Embed Size (px)
Citation preview

The implications of assuming independent tag lossin southern elephant seals
L. K. SCHWARZ,1,� M. A. HINDELL,2 C. R. MCMAHON,2,3 AND D. P. COSTA1
1University of California Santa Cruz, Long Marine Lab, 100 Shaffer Road, Santa Cruz, California 95060 USA2University of Tasmania, Institute for Marine and Antarctic Studies, Private Bag 49, Hobart Tasmania 7001 Australia
3Charles Darwin University, Research Institute for the Environment and Livelihoods,Darwin, Northern Territory 0909 Australia
Citation: Schwarz, L. K., M. A. Hindell, C. R. McMahon, and D. P. Costa. 2012. The implications of assuming
independent tag loss in southern elephant seals. Ecosphere 3(9):81. http://dx.doi.org/10.1890/ES12-00132.1
Abstract. Survival and reproductive rate estimation requires following uniquely identified individuals
through time, and many statistical models assume markings used to identify individuals are permanent.
However, survival rates are underestimated when single marks are lost, since the models will effectively
score those animals as dead. In order to account for mark loss, some researchers use a double-mark
approach, assuming the probability of losing one mark is independent of losing the other one. Therefore,
mark loss can be estimated using animals that have lost one mark. Using a 17-year dataset of southern
elephant seals (Mirounga leonina) marked with permanent brands and two cattle tags in their hind flippers,
we were able to compare tag loss and survival rate estimates with and without the assumption of
independent tag loss with respect to age, sex, and wean mass. We demonstrate the assumption of
independent tag loss is not valid, showing it is more likely for an animal to lose both tags than just one or
the other. The assumption of independent tag loss leads to an underestimate of survival rates which in turn
leads to underestimates of population growth rate. In addition, tag loss rates are different by sex and age,
with older males more likely to lose tags. Tag loss is also a quadratic function of wean mass through age
two, with smaller and larger animals more likely to lose both tags. Such differences are possibly due to
differences in behavior, flipper growth, and immune response. Using a Bayesian approach, we will be able
to use our tag loss estimates as priors in future analyses for a subset of marked animals that only have
flipper tags. With this population, the independent tag loss models are more likely to incorrectly estimate a
declining population (growth rate , 1.0), potentially leading to unwarranted management action. To
account for non-independent mark loss in survival rate studies, we recommend researchers use at least two
forms of marking on at least a subset of animals. However, neither form of marking need be permanent as
long as mark loss is independent between the different forms.
Key words: Bayesian; Cormack-Jolly-Seber; Macquarie Island; mark-resight; Mirounga leonina; population growth rate.
Received 4 May 2012; revised 15 August 2012; accepted 17 August 2012; published 25 September 2012. Corresponding
Editor: D. P. C. Peters.
Copyright: � 2012 Schwarz et al. This is an open-access article distributed under the terms of the Creative Commons
Attribution License, which permits restricted use, distribution, and reproduction in any medium, provided the original
author and sources are credited.
� E-mail: [email protected]
INTRODUCTION
Estimates of population growth are oftenreliant on following individuals throughout theirlives to determine survival and reproductiverates. In order to do so, individuals require
unique identifying marks. In some cases, marksare natural, such as coloration patterns, while inother cases individuals are captured and markedwith human-created devices. Metal bands at-tached around birds’ legs and plastic tagspunctured through soft tissue, such as an ear,
v www.esajournals.org 1 September 2012 v Volume 3(9) v Article 81

are two examples of many marking methods.However, not all marks are permanent, oftenwearing or changing with age. When animalslose all markings, statistical models that do notaccount for mark loss assume animals that havelost all marks are instead mortality events, andone cannot estimate the probability of mark losswhen only one mark is present. To solve themark-loss estimation problem, many studiesmark animals with two marks (Bjornsson et al.2011), and analysis of double marks mostcommonly assumes the probability of losingone mark is independent of losing the othermark (Beauplet et al. 2005, Oosthuizen et al.2010, Juillet et al. 2011).
However, the assumption of independentmark loss may create biases in survival rateestimates. Namely, if the proportion of animalsthat have lost all marks is underestimated,survival rate is biased low since statistical modelswill assume such animals are mortalities. If theno-mark proportion is overestimated, survivalrate is biased high.
Over the years, both branding and numberedplastic cattle tags attached to flippers (flippertags) have been used to uniquely identifyindividuals of many pinniped species. Long-termstudies have shown that branding is a permanentform of marking while flipper tags are not(Pistorius et al. 2000, van den Hoff et al. 2004,McMahon et al. 2006, Wilkinson et al. 2011).Because of concerns that the branding process isinhumane, flipper tags have subsequently be-come a common, and sometimes the only,marking method employed, although the issueof tag loss remains.
For a period of seven years (1993–1999), over6000 weaned southern elephant seal pups (Mir-ounga leonina) at Macquarie Island were giventhree marks: a brand on their flanks and twoplastic cattle tags in the outer webbing of eachhind flipper. Resights of brands and tags havebeen ongoing. This suite of markings provides aunique opportunity to estimate tag loss while thepermanent brands provide a means to identifyindividuals who have lost all tags. The assump-tion of non-independent tag loss is of particularimportance for this population since demograph-ic analysis of cohorts after 1999 will rely solely onresights of flipper tags. McMahon and White(2009) analyzed the first eight years of this data
and showed that tag loss was not independentbetween the two flipper tags, leading to anunderestimate of survival. In addition, tag losswas related to wean mass, with smaller pupsmore likely to lose both tags (McMahon andWhite 2009). We aim to revisit this data for threereasons (1) to quantify tag loss for animals overseven years old now that 17 years of data areavailable, (2) quantify differences in survival rateestimates and population growth rate whenindependence is assumed vs. not assumed, and(3) perform the analysis in a Bayesian frameworkso posterior distributions of tag loss probabilitymay be used as priors in analyses of futurecohorts and other populations.
METHODS
Data collectionMacquarie Island (548300 S, 1588500 E) is 1500
km southeast of Tasmania and 1300 km north ofAntarctica. Although elephant seals travel longdistances to forage, the Macquarie Island popu-lation is considered an isolated breeding groupand is the only major Pacific sector breedinggroup in the Southern Ocean (McMahon et al.2006). In addition, females exhibit a high degreeof philopatry (giving birth 1–4 km from theirbirth site) (Nicholls 1970, Hindell and Little1988), and the island is comparatively small (34km long by 5 km wide at its widest), makinginter-annual resights of individuals possible.
From 1993–1999, approximately 2000 pups peryear were tagged with uniquely numberedplastic tags in both hind flippers within 24 hoursof birth and subsequently recaught and brandedat weaning (Table 1). Consistent hot-iron brand-ing methods were used, so 98% of brands werereadable and permanent after the seals’ first molt(van den Hoff et al. 2004, McMahon et al. 2006),and flipper tagging methods were also standard-ized (McMahon and White 2009). Of the brandedanimals, about 45% were also weighed atweaning using a sling and pulley system(McMahon and White 2009). In 2000, 1999 pupswere given only flipper tags while roughly halfof them were also weighed at weaning (n¼1029).
Given the philopatric nature of this species,resight efforts were primarily focused in thenorthern region where seals were initially born(and marked). Between August 1993 and October
v www.esajournals.org 2 September 2012 v Volume 3(9) v Article 81
SCHWARZ ET AL.
2006, isthmus beaches were searched daily fortagged and branded animals. The northern thirdof the island was searched every ten days, whilethe remaining coastline was searched monthly.Searches were standardized by following thesame route on each occasion and were started atthe same time each day, week or monthdepending on the search category. After October2006 all searches were opportunistic.
As brands can be seen from a distance, resightsof brands do not directly disturb the animals.Detecting and reading flipper tags sometimesrequired spreading the hind flipper, whenpossible. During many resights, observers wereable to read the unique number and determinethe color of each tag. When unique numberscould not be read, the number of remaining tagswas still recorded. Multiple sightings of a sealwithin a seal year (15 Octobert–14 Octobertþ1)were treated as a single sighting and used tocreate annual individual mark-recapture histo-ries.
In summary, we used mark-resight data ofbranded animals from 1993–2009 to estimate tagloss with and without the assumption of inde-pendence. To quantify differences in survival rateestimates with and without independent tag loss,we used mark-resight data from the 2000 tag-only cohort, using tag loss probabilities estimat-ed from the branded data as priors in theanalysis.
AnalysisWe created a Bayesian multi-event, multi-state
method based on the standard Cormack-Jolly-Seber (CJS) mark-recapture model (Lebreton etal. 2009). The model allowed for several differentstates depending on the number of tags, detec-tion, and survival. At each time step, an
individual can fall in to several unique catego-ries: (1) alive or dead; (2) brand detected or notdetected; (3) number of tags detected or notdetected; (4) number of tags: 0, 1, or 2.
Overall, the unique categories lead to 24theoretical states for a given animal. However,we can make two simplifications based on datacollection procedures for this particular southernelephant seal colony. Tags were never detectedwithout the brand also being seen, and deadanimals are never detected. Therefore, at eachtime step southern elephant seals fall in to one of10 distinct states:
1. Alive, brand detected, tag count detected, 0tags
2. Alive, brand detected, tag count detected, 1tags
3. Alive, brand detected, tag count detected, 2tags
4. Alive, brand detected, tags not detected, 0tags
5. Alive, brand detected, tags not detected, 1tags
6. Alive, brand detected, tags not detected, 2tags
7. Alive, brand not detected, tags not detect-ed, 0 tags
8. Alive, brand not detected, tags not detect-ed, 1 tags
9. Alive, brand not detected, tags not detect-ed, 2 tags
10. Dead
Transition from one state to another statebetween sample periods involves four basicprobabilities that are estimated in the Bayesianmodel: survival rate (s), probability of detecting abrand (dB), probability of detecting tags (dT),probability of losing tags (W). The parameters arerepresented as vectors since they can be separat-ed into further categories depending on assump-tions we make about potential differences as afunction of time, different state transitions, andmany other factors.
Based on previous analyses by McMahon andWhite (2009), different parameters were estimat-ed as a function of sex, number of tags, year, andwean mass. All parameters were estimatedseparately by sex. Presence of a tag is easier todetect than absence of a tag, so probability of
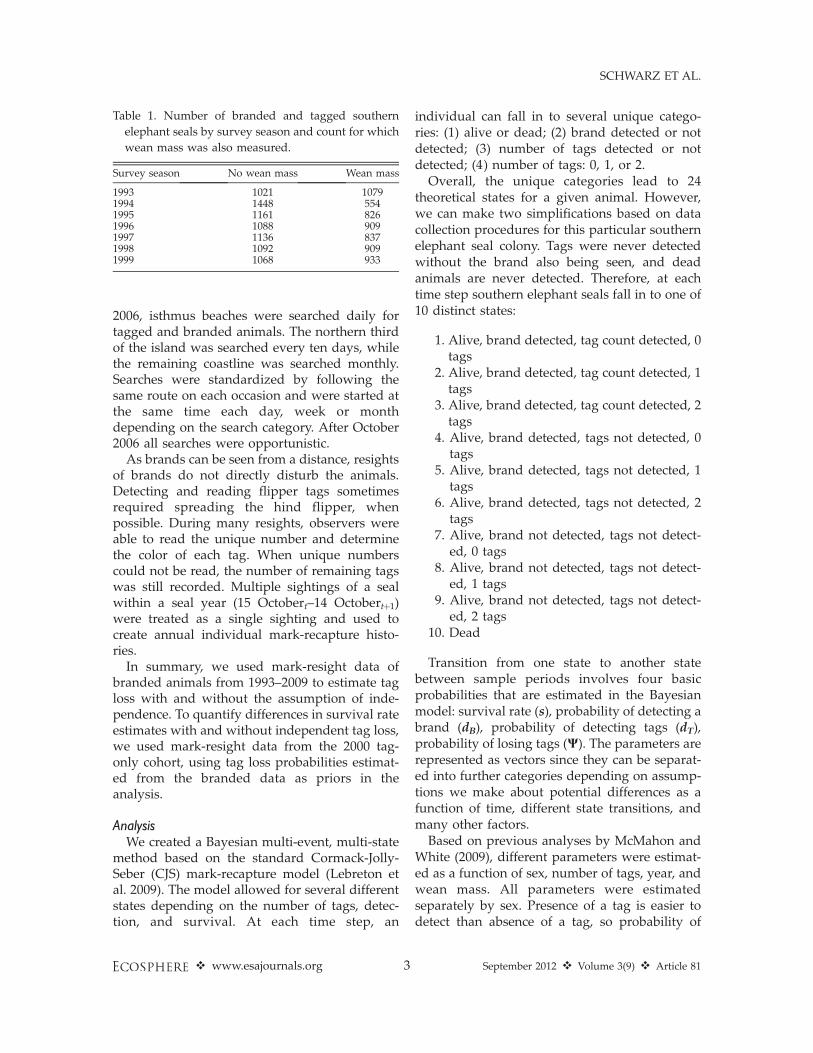
Table 1. Number of branded and tagged southern
elephant seals by survey season and count for which
wean mass was also measured.
Survey season No wean mass Wean mass
1993 1021 10791994 1448 5541995 1161 8261996 1088 9091997 1136 8371998 1092 9091999 1068 933
v www.esajournals.org 3 September 2012 v Volume 3(9) v Article 81
SCHWARZ ET AL.
detecting tags was estimated separately by thenumber of tags. Resight effort was annuallyvariable, so brand detection was estimatedseparately by year. To ensure survival rates didnot bias tag loss probabilities, survival wasestimated separately by age, cohort, and as aquadratic function of wean mass for ages 1 and 2yr. Finally, to compare with previous work, tagloss was estimated separately by age and sex andas a quadratic function of wean mass for ages 1and 2 yr. To make use of the entire dataset,survival rates and tag loss probabilities were alsoestimated only by age for the subset of data thatlacked wean mass measurements.
To test for tag loss independence, we ran themodel two different ways. First, we estimated tagloss transition probabilities between tag statesseparately: W2:0, W2:1, W1:0. Then, using the samedata, we estimated tag loss probability ( p)assuming independence where
W2:0 ¼ p2
W2:1 ¼ 2 3 p 3ð1� pÞ
W1:0 ¼ p
Overall, 182 parameters were estimated in thecase of dependent tag loss. One hundred thirty-eight parameters were estimated when assumingindependent tag loss.
To determine how the assumption of tag lossindependence affects survival rate estimates, weused the resulting tag loss probabilities as priorsto estimate survival for the cohort that did nothave brands, so survival was based solely onresights of flipper tags while accounting for tagloss. This final analysis incorporated an addi-tional 33 parameters: cohort-specific survival byage and by wean mass for years 1 and 2 anddetection probability of tags by year and numberof tags. There is one primary reason to limit thislast analysis to a tag-only cohort. In the brandedcohorts, brands and tag numbers are alwaysresighted together. Consequently, survival esti-mates of branded animals are based on resightsof the permanent brands while the number oftags is simply a characteristic of the animals. Ifwe exclude brand data to estimate tag loss andsurvival for the branded cohorts, we are limitedto sightings of animals with one or two tags.Therefore, we can no longer estimate tag loss as
potentially independent.Quadratic parameters were given broad, uni-
form distributions wide enough to preventtruncation of posterior distributions. All otherparameters were given uniform priors betweenzero and one. The Bayesian analysis was doneusing program MTG (Metropolis within Gibbs)developed by Daniel Goodman of Montana StateUniversity (Schwarz 2008). To maximize com-puter efficiency, simulations were performed onorthogonally transformed parameters when cor-relation between parameters was high (all qua-dratic parameters). Simulations were set for arejection rate near 0.7, a sub-sampling (thinning)of 1 in 50 and a burn-in period of 50, continuingfor a subsample size of 10,000 for each inference(see Cowles and Carlin 1995). The resulting lag-1autocorrelations were , 0.1, and independentchains with different parameter starting valuesgave indistinguishable results. To verify conver-gence and stationarity within the final chains, weused the Heidelberger and Welch convergencediagnostic available from the CODA package inR using standard 10% increments and p � 0.05(Heidelberger and Welch 1983, Plummer et al.2006).
Lastly, to understand the influence of theindependent tag-loss assumption on populationgrowth rate estimates, we created a simple Lesliematrix with the oldest age classes as a single state(Fig. 1). We assumed an equal pup sex ratio,constant survival after age 9, and constantreproductive rate starting at age 3. The last twoassumptions represent a best-case scenario withno senescence and maximum reproduction start-ing at the youngest observed reproductive age(Hindell 1991, McMahon et al. 2003). We utilizedposterior samples of survival rates from the non-branded cohort with and without the assumptionof tag loss independence. We allowed reproduc-tive rate to range between 0.2 and 1.0. Sensitivityanalysis shows the population growth rate ismost sensitive to variation in adult survival rates.Therefore, survival rate after age nine (sA) waseither the highest adult survival rate (best-casescenario) or the lowest adult survival rate (worst-case scenario) estimated for the non-brandedcohort. We then calculated population growthrate as the dominant eigenvalue of the Lesliematrix.
v www.esajournals.org 4 September 2012 v Volume 3(9) v Article 81
SCHWARZ ET AL.

RESULTS
The probability an animal has survived butlost all its tags (i.e., the probability an animal hastransitioned to the zero-tag state) is the key todetermining the importance of non-independenttag loss on survival rate estimates. Overall, ourresults show the assumption of independent tagloss underestimated the probabilities of movingto a zero-tag state (W2:0 and W1:0) while overes-timating the probability of moving to or stayingin a higher-tag state (W2:2, W2:1, and W1:1)regardless of wean mass (Figs. 2–4). The oneexception is the probability of going from a one-tag state to a zero-tag state in the first year (Fig.2). In that case, independent tag loss overesti-mated the probability of moving to a zero-tagstate. However, the sample size for this analysiswas comparatively small since only one cohortwas tagged with single tags. Since analysis withindependent tag loss uses all tag loss data toestimate one rate, results with independent tagloss are driven by the other tag loss probabilityestimates.
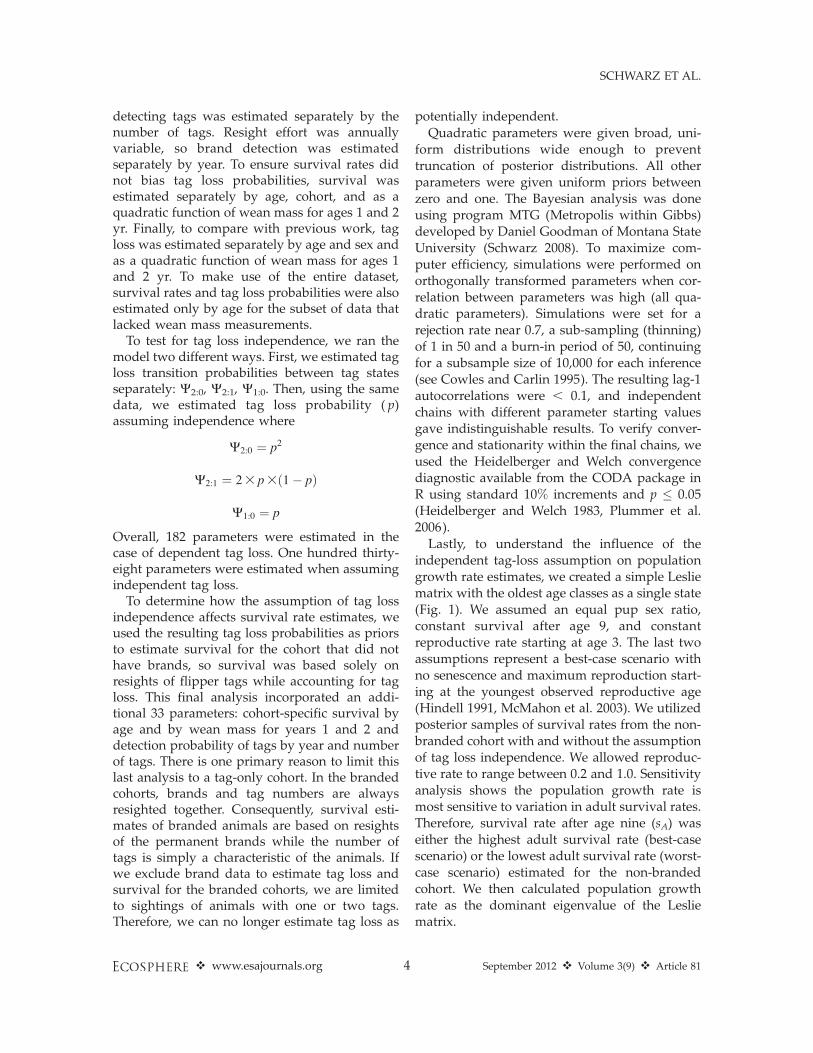
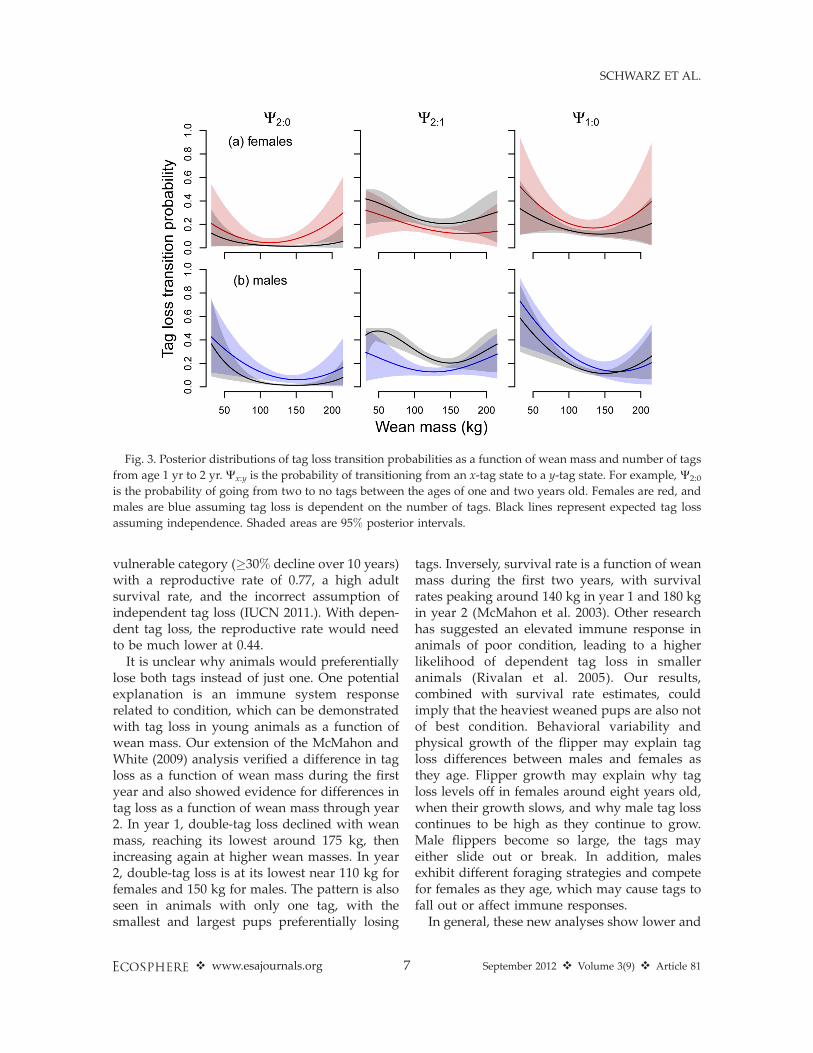
We also investigated tag loss as a function ofwean mass for the first two years. With theexception of Age Class 1 W2:1, tag loss is aquadratic function of wean mass, and there areno strong differences between males and females(Figs. 2 and 3). In general, both smaller andlarger weaned pups had a higher probability oftransitioning to a zero-tag state (going from two
or one to no tags) compared to pups between 100and 150 kg wean mass (Figs. 2 and 3). However,during the first year, the probability an animalwith two tags will lose both of them is at itslowest around 175 kg wean mass (Fig. 2).
For ages three and older, there is not strongevidence for differences in tag loss betweenmales and females (Fig. 4). However, when usingposterior distributions of tag loss probabilities toestimate the proportion of animals without tags,the proportions remain similar by sex for onlythe first eight years. At nine years and older, tagloss is higher for males (Fig. 5). Within the data,all re-sighted males greater than 13 years old hadlost all their tags.
The assumption of independent tag loss leadsto an underestimate of the proportion of animalsstill alive that have lost all their tags (Fig. 5). Ingeneral, the difference between proportionsincreases until age eight. For females, the biasremains relatively constant after age 8, while thebias for males declines as the proportion ofanimals with zero tags approaches one.
The underestimate of the proportion alivewithout tags then produced an underestimateof survival for the tag-only cohort (Fig. 6). Thedifference is higher and relatively constant forfemales after age two. Since the underestimate ofthe proportion alive without tags diminishes formales after age nine, the bias in male survivalrate also declines at age nine.
Underestimates in survival rate created a
Fig. 1. Life history diagram of stage-based model. Circles with numbers represent age classes, while arrows
represent transitions between age classes based on survival (s) and reproductive (r) probabilities.
v www.esajournals.org 5 September 2012 v Volume 3(9) v Article 81
SCHWARZ ET AL.

negative bias in population growth rate (Fig. 7).The mean population growth rate with indepen-dent tag loss was 0.025–0.064 lower. The bias ismore pronounced when adult survival is low andreproductive rates are high. In addition to tagloss probabilities, we estimated detection proba-bilities of brands by year and tags by number oftags. Resight probability was relatively stablefrom 1994 through 2001 with equal branddetection by sex, but resight probabilities post-2001 were variable, different by sex, and com-paratively lower (Table 2). The probability ofdetermining tag status was lowest when no tagswere present and highest when both tags werepresent. Overall, tag status was determined moreoften in males than females (Table 3).
DISCUSSION
Although an increasing number of mark-recapture analyses account for tag loss, ouranalysis emphasizes the importance of testingand accounting for the assumption of indepen-
dent tag loss. Analyzing the first eight years ofthis data series, McMahon and White (2009)showed the assumption of independent tag lossled to an underestimate of age-specific survivalrates. Our updated analysis of the longer 17 yeartime series concurred with those of McMahonand White (2009) and showed that assumingindependent rates of loss continued to produceinaccurately low survival rate estimates at olderages. In turn, population growth rate estimateswere biased down and were consequently morelikely to fall below 1, potentially incorrectlyimplying a declining population.
The incorrect assumption of independent tagloss could be of particular concern when policy-makers rely on such results to make speciesmanagement decisions. When survival rates arebiased low, erroneous results could triggerunwarranted, costly management action. Forexample, if listing of this population under theIUCN’s red list criteria was based solely on thisanalysis, the population would have more than a50% probability of falling in to at least the
Fig. 2. Posterior distributions of tag loss transition probabilities as a function of wean mass and number of tags
from birth to age 1 yr. Wx:y is the probability of transitioning from an x-tag state to a y-tag state. For example, W2:0
is the probability of going from two to no tags by the time the animal reaches one year old. Females are red, and
males are blue assuming tag loss is dependent on the number of tags. Black lines represent expected tag loss
assuming independence. Shaded areas are 95% posterior intervals.
v www.esajournals.org 6 September 2012 v Volume 3(9) v Article 81
SCHWARZ ET AL.
vulnerable category (�30% decline over 10 years)with a reproductive rate of 0.77, a high adultsurvival rate, and the incorrect assumption ofindependent tag loss (IUCN 2011.). With depen-dent tag loss, the reproductive rate would needto be much lower at 0.44.
It is unclear why animals would preferentiallylose both tags instead of just one. One potentialexplanation is an immune system responserelated to condition, which can be demonstratedwith tag loss in young animals as a function ofwean mass. Our extension of the McMahon andWhite (2009) analysis verified a difference in tagloss as a function of wean mass during the firstyear and also showed evidence for differences intag loss as a function of wean mass through year2. In year 1, double-tag loss declined with weanmass, reaching its lowest around 175 kg, thenincreasing again at higher wean masses. In year2, double-tag loss is at its lowest near 110 kg forfemales and 150 kg for males. The pattern is alsoseen in animals with only one tag, with thesmallest and largest pups preferentially losing
tags. Inversely, survival rate is a function of weanmass during the first two years, with survivalrates peaking around 140 kg in year 1 and 180 kgin year 2 (McMahon et al. 2003). Other researchhas suggested an elevated immune response inanimals of poor condition, leading to a higherlikelihood of dependent tag loss in smalleranimals (Rivalan et al. 2005). Our results,combined with survival rate estimates, couldimply that the heaviest weaned pups are also notof best condition. Behavioral variability andphysical growth of the flipper may explain tagloss differences between males and females asthey age. Flipper growth may explain why tagloss levels off in females around eight years old,when their growth slows, and why male tag losscontinues to be high as they continue to grow.Male flippers become so large, the tags mayeither slide out or break. In addition, malesexhibit different foraging strategies and competefor females as they age, which may cause tags tofall out or affect immune responses.
In general, these new analyses show lower and
Fig. 3. Posterior distributions of tag loss transition probabilities as a function of wean mass and number of tags
from age 1 yr to 2 yr. Wx:y is the probability of transitioning from an x-tag state to a y-tag state. For example, W2:0
is the probability of going from two to no tags between the ages of one and two years old. Females are red, and
males are blue assuming tag loss is dependent on the number of tags. Black lines represent expected tag loss
assuming independence. Shaded areas are 95% posterior intervals.
v www.esajournals.org 7 September 2012 v Volume 3(9) v Article 81
SCHWARZ ET AL.

Fig. 4. Posterior distributions of tag loss transition probabilities as a function of age and number of tags. Wx:y is
the probability of transitioning from an x-tag state to a y-tag state. For example, W2:0 is the probability of going
from two to no tags within a year. Females are red, and males are blue assuming tag loss is dependent on the
number of tags. Tag loss assuming independence is shown in black. Points are means and bars are 95% credible
intervals.
Fig. 5. Posterior distributions of the fraction of individuals with no tags given age assuming all animals start
with two tags. Black lines represent expected tag loss assuming independent tag loss. Females are red, and males
are blue assuming tag loss is dependent on the number of tags. Shaded areas are 95% posterior intervals.
v www.esajournals.org 8 September 2012 v Volume 3(9) v Article 81
SCHWARZ ET AL.

less variable age-specific tag loss compared toMcMahon and White (2009), most likely due to alarger sample size by age class. It is important tonote, however, that the remaining high level ofuncertainty in tag loss, survivorship, and popu-lation growth rates is not due to small samplesizes. Rather, relatively low and variable annualresight probabilities contribute substantially toposterior variability in parameter estimates.
In addition, our estimates of W2:1 as a functionof wean mass were substantially lower thanthose reported in McMahon and White (2009).Since the parameter is only represented in theiranalysis as the probability of losing one or theother of two tags (23 p3 (1� p)), the distributionis inherently bimodal. Because of the bimodalcharacteristic, their results show, correctly, avalue of 0.5. By simply defining the probability
Fig. 6. Posterior distributions of survivorship to age x. Females are red, and males are blue assuming tag loss is
dependent on the number of tags. Black lines represent expected survivorship assuming tag loss is not dependent
on number of tags. Shaded areas are 95% posterior intervals.
Fig. 7. Population growth rate as a function of reproductive rate, tag loss assumptions, and high or low adult
survival. Red lines are mean growth rate when tag loss is dependent on number of tags. Black lines represent
mean growth rate assuming independent tag loss. Shaded areas are 95% posterior intervals.
v www.esajournals.org 9 September 2012 v Volume 3(9) v Article 81
SCHWARZ ET AL.

as a transition from a two-tag state to a one-tagstate, the data quickly show this probability fallsbelow 0.5. In either case, W2:1 did not show astrong correlation with wean mass for age class 1.
The results of this analysis may only be validfor flipper tags attached in the outer webbing, asresults from other populations imply innerwebbing tags last longer (Oosthuizen et al.2010). Our results also show higher outer-webbing tag loss compared to the Marion Islandpopulation of southern elephant seals (Oosthui-zen et al. 2010). The dissimilarity may be due todifferences in timing of tagging. Marion Islandpups are tagged at weaning while MacquarieIsland pups are tagged as newborns. Althoughonly animals that retained their two tags untilweaning were used in this analysis, earlydevelopment of the flipper and mechanicalabrasion in those first few weeks may play arole in later tag loss. Differences in the placementof the tags (distance from the edge of the flipper)may also play a role. Behavioral and environ-mental differences as well as variability inimmune response could also explain the differ-ences between populations.
Tag loss studies at Marion Island have alsofound higher tag loss rates for males thanfemales, particularly at older ages (Pistorius etal. 2000, Oosthuizen et al. 2010). Although ourresults did not support a strong case forestimating tag loss separately by sex, one maywant to consider doing so, particularly when theprobable age at which all males have lost all tags
falls below the maximum age of survival. Such adistinction has important implications not only indemographic rate estimates but also for studiescomparing sex differences in behavior and lifehistory traits as a function of age.
CONCLUSIONS
Other studies have shown that the assumptionof independent tag loss is incorrect for blackbears (Ursus americanus) (Diefenbach and Alt1998), New Zealand fur seals (Arctocephalusforsteri ) (Bradshaw et al. 2000), and grey seals(Halichoerus grypus) (Smout et al. 2011b). In allcases, including this one, the assumption ofindependent tag loss produced an underestimatein the proportion of animals with zero tags whichled to underestimates in survival. This studytakes those analyses one step further and showssuch underestimates can be large enough totrigger unwarranted management actions. Inaddition, analyses should not assume mark lossis constant over all ages or by sex. If double tagsare to be the primary method for identifyingindividuals, it is important to test the assumptionof independent tag loss by employing at leasttwo forms of unique identification on at least asubset of the sampled population (Juillet et al.2011, Smout et al. 2011a). No mark types need tobe permanent as long as the different types arelost independently of each other. Such anapproach allows us to estimate potentiallydependent tag loss which can be used on thedata subset with only one mark type.
ACKNOWLEDGMENTS
L. S. was funded by the E & P Sound and MarineLife Joint Industry Project of the International Associ-ation of Oil and Gas Producers contract JIP22 07-23.Funding for all authors was provided by grant N0014-09-0896 from the Office of Naval Research to Univer-
Table 2. Probability of detecting a brand by survey year
and sex. Marginal means with 95% credible intervals
in parentheses.
Year Females Males
1994 0.62 (0.58, 0.66) 0.63 (0.59, 0.67)1995 0.54 (0.51, 0.57) 0.54 (0.50, 0.57)1996 0.46 (0.43, 0.49) 0.50 (0.47, 0.53)1997 0.56 (0.54, 0.58) 0.56 (0.54, 0.58)1998 0.51 (0.49, 0.53) 0.56 (0.53, 0.58)1999 0.64 (0.62, 0.66) 0.65 (0.63, 0.67)2000 0.63 (0.61, 0.65) 0.62 (0.60, 0.64)2001 0.64 (0.62, 0.66) 0.59 (0.57, 0.62)2002 0.20 (0.18, 0.22) 0.31 (0.29, 0.34)2003 0.55 (0.52, 0.57) 0.55 (0.52, 0.58)2004 0.46 (0.43, 0.49) 0.44 (0.40, 0.47)2005 0.61 (0.58, 0.65) 0.46 (0.42, 0.51)2006 0.29 (0.26, 0.32) 0.40 (0.35, 0.45)2007 0.44 (0.40, 0.48) 0.52 (0.46, 0.59)2008 0.20 (0.17, 0.24) 0.44 (0.34, 0.55)2009 0.90 (0.73, 1.00) 0.64 (0.41, 0.95)
Table 3. Probability of detecting tag status by number
of tags and sex for branded animals. Marginal
means with 95% credible intervals in parentheses.
Number of tags Females Males
0 0.28 (0.27, 0.29) 0.39 (0.38, 0.40)1 0.64 (0.60, 0.68) 0.76 (0.73, 0.79)2 0.71 (0.69, 0.73) 0.79 (0.77, 0.81)
v www.esajournals.org 10 September 2012 v Volume 3(9) v Article 81
SCHWARZ ET AL.

sity of California, Santa Barbara. Dr. Dave Watts of theAustralian Government Antarctic Division kindlyassisted in data management and access.
LITERATURE CITED
Beauplet, G., C. Barbraud, M. Chambellant, and C.Guinet. 2005. Interannual variation in the post-weaning and juvenile survival of subantarctic furseals: influence of pup sex, growth rate andoceanographic conditions. Journal of Animal Ecol-ogy 74:1160–1172.
Bjornsson, B., H. Karlsson, V. Thorsteinsson, and J.Solmundsson. 2011. Should all fish in mark-recapture experiments be double-tagged? Lessonslearned from tagging coastal cod (Gadus morhua).ICES Journal of Marine Science 68:603–610.
Bradshaw, C. J. A., R. J. Barker, and L. S. Davis. 2000.Modeling tag loss in New Zealand fur seal pups.Journal of Agricultural Biological and Environmen-tal Statistics 5:475–485.
Cowles, M. K. and B. P. Carlin. 1995. Markov ChainMonte Carlo diagnostics: A comparative review.Journal of the American Statistical Society 91:883–904.
Diefenbach, D. R. and G. L. Alt. 1998. Modeling andevaluation of ear tag loss in black bears. Journal ofWildlife Management 62:1292–1300.
Heidelberger, P. and P. D. Welch. 1983. Simulation runlength control in the presence of an initial transient.Operations Research (INFORMS) 31:1109–1144.
Hindell, M. A. 1991. Some life-history parameters of adeclining population of southern elephant seals,Mirounga leonina. Journal of Animal Ecology60:119–134.
Hindell, M. A. and G. J. Little. 1988. Longevity, fertilityand philopatry of two female southern elephantseals (Mirounga leonina) at Macquarie Island.Marine Mammal Science 4:168–171.
IUCN. 2011. Guidelines for using the IUCN Red Listcategories and criteria. Version 9.0. IUCN Stan-dards and Petitions Subcommittee. http://www.iucnredlist.org/documents/RedListGuidelines.pdf
Juillet, C., R. Choquet, G. Gauthier, and R. Pradel.2011. A capture-recapture model with double-marking, live and dead encounters, and heteroge-neity of reporting due to auxiliary mark loss.Journal of Agricultural Biological and Environmen-tal Statistics 16:88–104.
Lebreton, J. D., J. D. Nichols, R. J. Barker, R. Pradel,and J. A. Spendelow. 2009. Modeling individualanimal histories with multistate capture-recapturemodels. Pages 87–173 in H. Caswell, editor.Advances in ecological research. Volume 41.Elsevier, San Diego, California, USA.
McMahon, C. R., H. Burton, J. van den Hoff, R. Woods,
and C. J. A. Bradshaw. 2006. Assessing hot-ironand cryo-branding for permanently marking south-ern elephant seals. Journal of Wildlife Management70:1484–1489.
McMahon, C. R., H. R. Burton, and M. N. Bester. 2003.A demographic comparison of two southernelephant seal populations. Journal of AnimalEcology 72:61–74.
McMahon, C. R. and G. C. White. 2009. Tag lossprobabilities are not independent: Assessing andquantifying the assumption of independent tagtransition probabilities from direct observations.Journal of Experimental Marine Biology andEcology 372:36–42.
Nicholls, D. G. 1970. Disperal and dispersion inrelation to the birthsite of the southern elephantseal, Mirounga leonina, of Macquarie Island. Mam-malia 34:598–616.
Oosthuizen, W. C., P. J. N. de Bruyn, M. N. Bester, andM. Girondot. 2010. Cohort and tag-site-specific tag-loss rates in mark-recapture studies: A southernelephant seal cautionary case. Marine MammalScience 26:350–369.
Pistorius, P. A., M. N. Bester, S. P. Kirkman, and P. L.Boveng. 2000. Evaluation of age- and sex-depen-dent rates of tag loss in southern elephant seals.Journal of Wildlife Management 64:373–380.
Plummer, M., N. Best, K. Cowles, and K. Vines. 2006.CODA: convergence diagnosis and output analysisfor MCMC. R News 6:7–11.
Rivalan, P., M. H. Godfrey, A. C. Prevot-Julliard, andM. Girondot. 2005. Maximum likelihood estimatesof tag loss in leatherback sea turtles. Journal ofWildlife Management 69:540–548.
Schwarz, L. K. 2008. Methods and models to determineperinatal status of Florida manatee carcasses.Marine Mammal Science 24:881–898.
Smout, S., R. King, and P. Pomeroy. 2011a. Estimatingdemographic parameters for capture-recapturedata in the presence of multiple mark types.Environmental and Ecological Statistics 18:331–347.
Smout, S., R. King, and P. Pomeroy. 2011b. Integratingheterogeneity of detection and mark loss toestimate survival and transience in UK grey sealcolonies. Journal of Applied Ecology 48:364–372.
van den Hoff, J., M. D. Sumner, I. C. Field, C. J. A.Bradshaw, H. R. Burton, and C. R. McMahon. 2004.Temporal changes in the quality of hot-iron brandson elephant seal (Mirounga leonina) pups. WildlifeResearch 31:619–629.
Wilkinson, I. S., B. L. Chilvers, P. J. Duignan, and P. A.Pistorius. 2011. An evaluation of hot-iron brandingas a permanent marking method for adult NewZealand sea lions, Phocarctos hookeri. WildlifeResearch 38:51–60.
v www.esajournals.org 11 September 2012 v Volume 3(9) v Article 81
SCHWARZ ET AL.