Embed Size (px)
Citation preview
The implementation of Theory of Constraints in a multi-
project environment: an action research approach
H.R. Honiball
11356202
A research project submitted to the Gordon Institute of Business Science, University of
Pretoria, in partial fulfilment of the requirements for the degree of Master of Business
Administration
7 November 2012
Copyright © 2013, University of Pretoria. All rights reserved. The copyright in this work vests in the University of Pretoria. No part of this work may be reproduced or transmitted in any form or by any means, without the prior written permission of the University of Pretoria.
©© UUnniivveerrssiittyy ooff PPrreettoorriiaa
ii
Abstract: This study used action research to study the implementation of Critical
Chain methodology in a multi-project environment. It used a medium sized company,
which is an original equipment manufacturer, but due to the complexity of the
equipment each is executed as a project. This creates a multi-project environment.
The object of the research was to find the contributing and inhibiting factors to CC
implementation. It further sought to discover improvements in business performance
due to CC methodology.
The study found resistance to change prevented CC implementation. The resistance to
change was supported by incorrect application of CC principles and a false sense that
CC is contributing to the business. On business performance improvements it was
found that order intake improvements of thirty seven per cent year on year and
reduction in lead time of projects due to implementation of CC principles. The latter
also opened new markets which strategically benefitted the company.
Keywords:
Theory of Constraints
Critical Chain
Multi-Project
Action Research
iii
Declaration:
I declare that this research project is my own work. It is submitted in partial
fulfilment of the requirements for the degree of Master of Business
Administration at the Gordon Institute of Business Science, University of
Pretoria. It has not been submitted before any degree of examination in any
other University. I further declare that I have obtained the necessary
authorisation and consent to carry out this research.
5555555. 5555555.
HR Honiball

iv
Acknowledgements:
I wish to express my sincere thanks to:
My Lord Jesus Christ for his grace
Liezel, Marli and Carla, who have shared the burden by supported me throughout the
two years of study
Pieter Pretorius, my research supervisor, who has provided very valuable insights into
this research and who has fundamentally changed the way I view business in general
Geoff Willis and everyone at Winder Controls for co-operation and encouragement
v
Contents
Table of Figures and Tables ......................................................................................... ix
List of abbreviations ..................................................................................................... x
1 Introduction to research problem ........................................................................... 1
1.1 Theory of Constraints ........................................................................................ 1
1.2 Critical Chain ..................................................................................................... 2
1.3 Measurements ................................................................................................... 2
1.4 Action research .................................................................................................. 3
1.5 Choice of company ............................................................................................ 3
1.6 Summary ........................................................................................................... 3
2 Literature review .................................................................................................... 4
2.1 Introduction to Theory of Constraints (TOC) ...................................................... 4
2.2 The systems approach of TOC .......................................................................... 5
2.3 The business case for TOC ............................................................................... 8
2.4 Management philosophy of TOC ....................................................................... 9
2.5 The five focussing steps .................................................................................. 10
2.5.1 Identify the constraint ............................................................................ 10
2.5.2 Exploit the constraint ............................................................................. 11
2.5.3 Subordinate to the constraint ................................................................ 11
2.5.4 Elevate .................................................................................................. 12
2.5.5 Repeat the process ............................................................................... 12
2.6 Critical chain overview ..................................................................................... 12
2.7 Management practices .................................................................................... 15
2.7.1 Elimination of multi-tasking .................................................................... 15
2.7.2 Procrastination or the student syndrome ............................................... 16
2.7.3 Failure to report early completion .......................................................... 16
2.8 The critical chain concept ................................................................................ 17
2.9 Reducing suppliers’ lead time .......................................................................... 17
2.10 The practical application of CC ........................................................................ 18
vi
2.11 Criticism of TOC and CC ................................................................................. 19
2.12 Summary ......................................................................................................... 20
3 Research questions 2 .......................................................................................... 22
4 Research methodology and design ..................................................................... 23
4.1 Why action research ........................................................................................ 23
4.1.1 Organisational change .......................................................................... 23
4.1.2 Based on implementing theory .............................................................. 23
4.1.3 Used in problem solving ........................................................................ 23
4.2 General action research methodology ............................................................. 24
4.2.1 Human knowing .................................................................................... 24
4.2.2 Collaborative process ............................................................................ 25
4.3 Local context of this action research ................................................................ 26
4.3.1 Action research cycle time .................................................................... 26
4.3.2 System and population .......................................................................... 26
4.4 Personal Context ............................................................................................. 26
4.4.1 Personal bias ........................................................................................ 27
4.5 Mastering of theory by study group .................................................................. 27
4.5.1 Reading ................................................................................................ 27
4.5.2 Playing the die game ............................................................................. 27
4.6 Structuring the cycles ...................................................................................... 27
4.6.1 Discovery .............................................................................................. 28
4.6.2 Measureable action ............................................................................... 28
4.6.3 Reflection .............................................................................................. 28
4.6.4 Next steps ............................................................................................. 29
4.7 Financial Measurements .................................................................................. 29
4.8 Action research learning .................................................................................. 30
4.9 Action research group composition .................................................................. 30
4.10 Potential research limitations ........................................................................... 31
5 Results ................................................................................................................ 32
5.1 Structuring the action research group .............................................................. 32
5.2 On the introduction of theory ............................................................................ 32
5.3 Business performance results .......................................................................... 32
vii
5.3.1 General comments ................................................................................ 32
5.3.2 Net profit ............................................................................................... 33
5.3.3 Return on investment ............................................................................ 39
5.3.4 Cash flow .............................................................................................. 40
5.3.5 Order Intake .......................................................................................... 40
5.4 Summary on business performance improvement ........................................... 43
5.5 Action research cycles ..................................................................................... 43
5.5.1 Implementing the five focussing steps ................................................... 43
5.5.2 Interventions in the first cycle ................................................................ 44
5.5.3 Interventions during the second cycle ................................................... 45
5.5.4 Interventions during the third cycle ........................................................ 45
5.6 Indentifying the primary contributing and inhibiting factors to CC methodology
implementation ....................................................................................................... 46
5.6.1 Interruptions .......................................................................................... 46
5.6.2 Resistance to change ............................................................................ 47
5.7 Learnings identified by the action research group ............................................ 47
5.7.1 Success of CC ...................................................................................... 48
5.7.2 Changes in behaviour ........................................................................... 49
5.7.3 Implementation errors ........................................................................... 49
6 Summary of results ............................................................................................. 50
6.1 Inhibiting and contributing factors .................................................................... 50
6.1.1 Embedded culture ................................................................................. 51
6.1.2 Remuneration motivation ...................................................................... 51
6.1.3 Incorrect CC application ........................................................................ 51
6.2 Improvements in business performance .......................................................... 52
7 Conclusion .......................................................................................................... 53
7.1 Business performance ..................................................................................... 53
7.2 Contributing and inhibiting factors .................................................................... 53
7.3 Suggestions for further research ...................................................................... 54
7.4 Implications to management ............................................................................ 54
7.5 Conclusion ....................................................................................................... 55
8 References .......................................................................................................... 56

viii
9 Appendix 1 Agenda for Action Research meetings: ............................................. 60
10 Appendix 2: Organisational Chart: Overall ........................................................... 61
11 Appendix 3: Tender priorities example ............................................................... 62
ix
Table of Figures and Tables
Figure 2-1 Scouts Analogy ........................................................................................... 6
Figure 2-2 : Drum, Buffer, Rope Illustrated ................................................................... 7
Figure 2-3 Operational measurements' relation to the bottom line measurements, from
Goldratt & Fox (1996) ................................................................................................... 8
Figure 2-4 A simple "A" Plant ..................................................................................... 13
Figure 2-5 A simple project plan ................................................................................. 13
Figure 2-6: Traditional critical path view with buffers, from Goldratt (1997) ................. 14
Figure 2-7: Project plan showing critical path from Goldratt (1997) ............................. 14
Table 5-1: Cumulative EBITDA for study period ......................................................... 34
Table 5-2: Monthly income statement for 2011 ........................................................... 35
Table 5-3: Monthly income statement for 2012 ........................................................... 36
Figure 5-4 : EBITDA cumulative ................................................................................. 37
Figure 5-5 Monthly EBITDA figures ............................................................................ 37
Figure 5-6: Profits stated as EBITDA and NP ............................................................. 38
Figure 5-7: Cumulative profits stated as NP and EBITDA ........................................... 39
Figure 5-8: Cumulative order intake – major revenue ................................................. 40
Figure 5-9: Cumulative order intake growth table ....................................................... 41
Figure 10-1: Organisational chart ............................................................................... 61
x
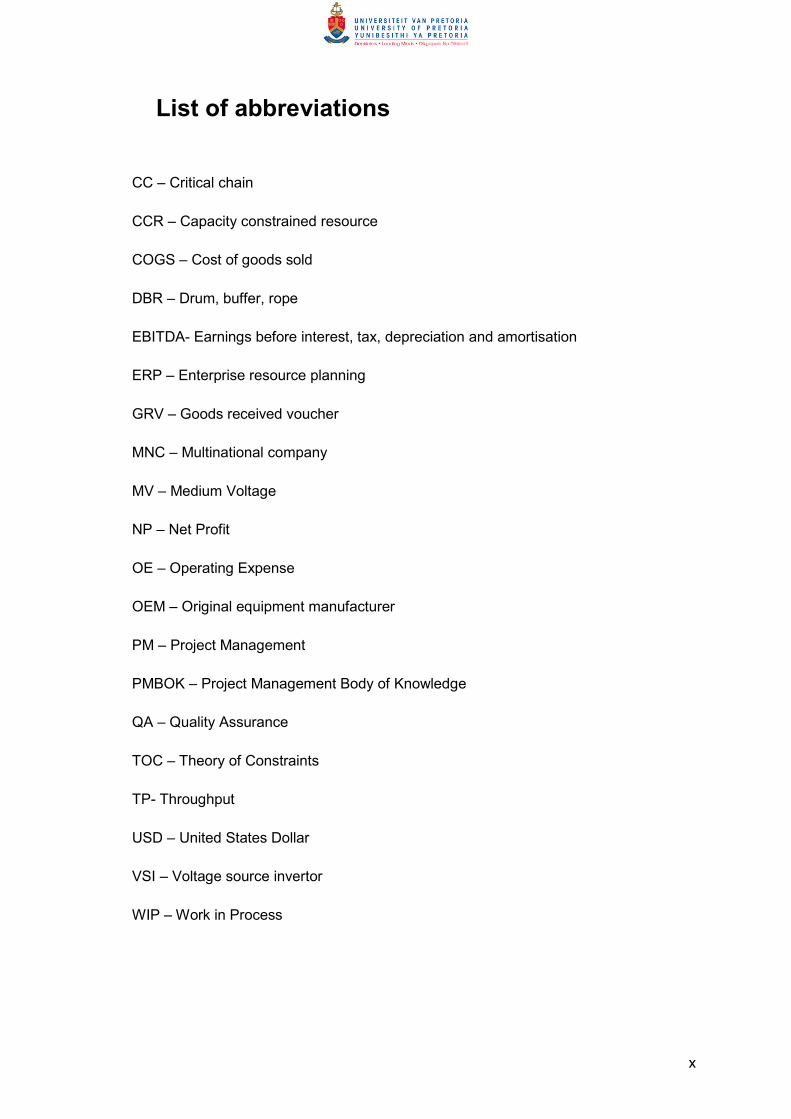
List of abbreviations
CC – Critical chain
CCR – Capacity constrained resource
COGS – Cost of goods sold
DBR – Drum, buffer, rope
EBITDA- Earnings before interest, tax, depreciation and amortisation
ERP – Enterprise resource planning
GRV – Goods received voucher
MNC – Multinational company
MV – Medium Voltage
NP – Net Profit
OE – Operating Expense
OEM – Original equipment manufacturer
PM – Project Management
PMBOK – Project Management Body of Knowledge
QA – Quality Assurance
TOC – Theory of Constraints
TP- Throughput
USD – United States Dollar
VSI – Voltage source invertor
WIP – Work in Process
1
1 Introduction to research problem
In South Africa, as everywhere in the world, original equipment manufacturers come
under ever increasing pressure to improve deliveries, be more flexible and innovative,
serve customers better while at the same time improve business performance in terms
of profits. In the search for improvement in business performance, a company might
consider implementing Theory of Constraints.
Goldratt (Goldratt & Cox, 1986) first formulated Theory of Constraints in the production
environment and published it as a novel, which was described as “The most successful
attempt at management-as-fiction” (Tibben-Lembke, 2009). Since then, The Goal
(Goldratt & Cox, 1986) “has inspired countless professionals in production” (Tibben-
Lembke, 2009, p. 1815) to embark on their own implementations of Theory of
Constraints.
In the multi-project environment Theory of Constraints is applied as Critical Chain
methodology, using the same principle of a capacity constrained resource. This
Critical Chain methodology is used by large companies such as Hitachi (Umble,
Umble, & Murakami, 2006), ABB, Boeing, Hewlett Packard and others (Stratton, 2011)
for project management.
This research focussed on a medium sized manufacturer and determined if any
business performance improvements could be realised by implementing CC, and
investigated what the contributing and inhibiting factors are to a CC implementation.
For this purpose action research was used, as CC requires a change in behaviour in
the organisation and action research is employed as a tool to bring about change
through data collection (Butterfield, 2009), rather than the data being the end product
in itself.
1.1 Theory of Constraints
Theory of Constraints (TOC) as formulated in The Goal (Goldratt & Cox, 1986),
explained that the throughput rate of a system is determined by the bottleneck. This
introduced Theory of Constraints as a means of managing a factory production
process with the aim of maximising throughput rate. Maximising throughput rate would
in turn maximise profit, cash flow and return on investment. As Rand (1986) writes, ‘It’s
2
a novel, but it’s also a manufacturing text-book, and it’s good on both accounts.’ Many
reviewers have agreed The Goal is an easy-to-read way to get an introduction to
production realities (Rand 1986, Belis 1994, The Economist 1995, Dani 2006).
Theory of Constraints was expanded to include project management. In the project
management field, the concept of Critical Chain (CC) was introduced (Goldratt E. M.,
1997).
1.2 Critical Chain
The idea of a resource called the bottleneck in TOC, became the capacity constrained
resource limiting a project duration in the same way. The critical chain determined the
project duration in the same way as the bottleneck determines production throughput
rate. Since its publication in the novel of the same name, Critical Chain found use in
many large companies such as Hitachi (Umble, Umble, & Murakami, 2006), ABB,
Boeing, Hewlett Packard and others (Stratton, 2011) for project management. Even a
small company can implement the full CC process as there is software available at
USD250 (Stratton, 2011).
Critical chain was shown to be an approach with significant differences to traditional
critical path project scheduling (Steyn, 2001), (Rand, 2000), (Lechler, Ronen, & Stohr,
2005). In a large multi-project environment, like the construction industry, Yang (Jyh-
Bin Yang, 2007) pointed out that the construction industry will benefit greatly from
critical chain scheduling. The construction industry uses multiple costly resources, in
the context of multiple projects executed by a single company. He pointed out that
there are definite benefits, and did so from a theoretical basis. Case studies exist for
large companies such as Impala Platinum (Phillis & Gumede, 2011) and complex
projects such as refurbishment of C-5 aircraft (Best, 2006), but literature is sparse for
small to medium OEMs (Original Equipment Manufacturers).
1.3 Measurements
Goldratt (Goldratt & Cox, 1986) demonstrated the benefit to business using the TOC
approach to be a maximisation of profits, cash flow and return on investment. In a
subsequent novel he demonstrated how Theory of Constraints can be applied to
project management for single and multi-projects and called this method “Critical
Chain” (Goldratt, 1997). This was viewed as an innovation (Steyn, 2001) on theory at
the time. The business merit of the critical chain methodology is clear – increase in
3
project throughput, shortening of lead times, all leading to better returns and ability to
compete in a rapidly changing environment. However, literature is sparse on what it
takes to implement this philosophy in an original equipment manufacturer.
1.4 Action research
As organisational change is required when CC is implemented, action research was
chosen to determine the factors that will enable or inhibit the implementation of CC.
The action research approach has the researcher in an involved role as a participant
(Saunders & Lewis, 2012) and action research is used where organisational change is
promoted (Saunders & Lewis, 2012). Changing the methodology of how work is
scheduled is an organisational change for a small enterprise. It also stands to reason
that in a small company the change will be more quickly noticeable than in a
multinational corporation.
The Goal offered a “powerful means for setting the goal of the organization” (Eigeles,
2003) in an organisational transformation context. It introduced Theory of Constraints
(TOC) as a means of managing a factory production process, or what may be regarded
as a change management framework (Berry & Smith, 2005), complementing the action
research approach.
1.5 Choice of company
Original equipment manufacturers (OEM’s) treat individual products sold as projects
when there is a great deal of customisation involved. In this research the context was
such a local South African original equipment manufacturer of highly customised
products. The firm is a medium sized enterprise and executes multiple projects, using
four internal resource groups. This reduced the size of the implementation down to
what can be handled within the time and resource scope of an MBA research report.
1.6 Summary
This research determined what the effect on business performance is when critical
chain methodology is implemented. It also explored what factors will influence the
successful implementation of CC methodology. Action research was used during the
implementation phase, using an accessible firm.
4
2 Literature review
This literature review will present the theoretical base that will be applied during the
action research, namely Critical Chain (CC), which is Theory of Constraints (TOC) as
applied to project management. First, the conceptual ideas of TOC are discussed, and
its application to production management, before applying the concepts of TOC to
project management. The main focus will be on areas that will be covered by the action
research. Some criticism of TOC and CC is also presented before summarising.
2.1 Introduction to Theory of Constraints (TOC)
A novel by Goldratt & Cox (1986), The Goal, was described in 1995 by The Economist
as “The most successful attempt at management-as-fiction” (Tibben-Lembke, 2009). It
introduced Theory of Constraints (TOC) as a means of managing a factory production
process with the aim of maximising profit, cash flow and return on investment.
Eigeles (2003) held that The Goal offered a “powerful means for setting the goal of the
organization” in an organisational transformation context, while Berry and Smith (2005)
described TOC as a culture change management framework. Since its introduction,
TOC has found many different applications such as optimising product mix (Wang,
Sun, Si, & Yang, 2009), (Bhattacharya, Vasant, Sarkar, & Mukherjee, 2008), (Tsai, Lai,
& Chang, 2007), business problem solving (Wu, Blos, Wee, & Chen, 2010) (Wu,
Wang, Blos, & Wee, 2007), solving managerial problems (Hsu & Sun, 2005),
enterprise resource planning (ERP) implementation (Ioannou & Papadoyiannis, 2004),
medical management (Aoki, Ohta, Kikuchi, & Oishi, 2008) and improving academic
results (Goldratt & Weiss, 2005). TOC is applied by non-profit companies, for-profit
companies (Stratton, 2011), manufacturing and service industries (Gupta & Kline,
2008) (Robbins, 2011) (Spencer, 2000) (Blackstone, Theory of constraints - a status
report, 2001).
Goldratt sets the scene of The Goal by defining the purpose of a business - calling it
the goal of the business, hence the title of the novel – and defines the goal of a for-
profit organisation as to make more money now and in the future (Goldratt & Cox,
1986). The means of achieving the goal is to focus management on controlling the
operation according to the bottleneck – the term for the single resource that determines
the throughput rate of a firm. The release of inventory to production is subordinated to
the production capacity of the bottleneck, and the buffer in front of the bottleneck is
5
large enough to prevent idle time of the bottleneck due to starvation. This method is
aimed at maximising the throughput rate of product, which in turn maximises
production and hence makes more money now and in the future.
Since its introduction and initial application to manufacturing, Goldratt has
demonstrated how TOC can be used in project management in a follow up novel called
Critical Chain (Goldratt E. M., 1997). In the project management application, the
concept of critical chain (CC) is introduced, and is equivalent to the bottleneck in the
production process. By controlling the critical chain, the entire project is controlled. He
suggests that in a multi project environment, control over the CC is essential to
maximise business performance.
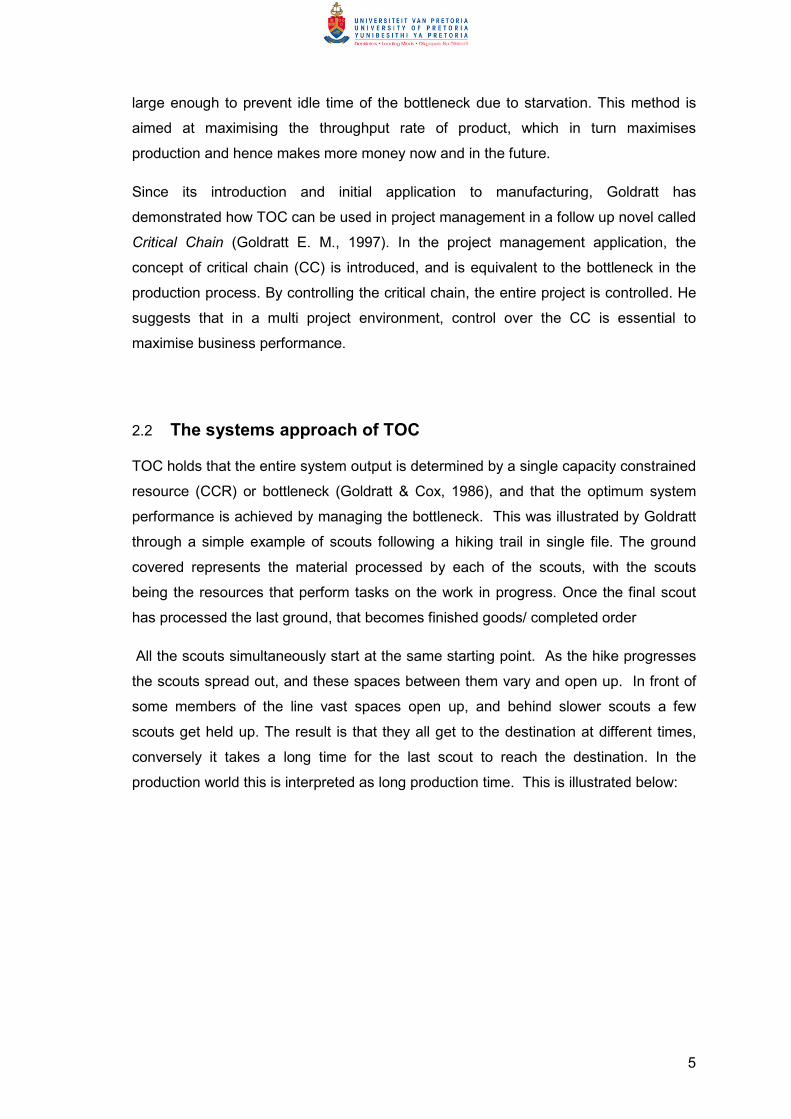
2.2 The systems approach of TOC
TOC holds that the entire system output is determined by a single capacity constrained
resource (CCR) or bottleneck (Goldratt & Cox, 1986), and that the optimum system
performance is achieved by managing the bottleneck. This was illustrated by Goldratt
through a simple example of scouts following a hiking trail in single file. The ground
covered represents the material processed by each of the scouts, with the scouts
being the resources that perform tasks on the work in progress. Once the final scout
has processed the last ground, that becomes finished goods/ completed order
All the scouts simultaneously start at the same starting point. As the hike progresses
the scouts spread out, and these spaces between them vary and open up. In front of
some members of the line vast spaces open up, and behind slower scouts a few
scouts get held up. The result is that they all get to the destination at different times,
conversely it takes a long time for the last scout to reach the destination. In the
production world this is interpreted as long production time. This is illustrated below:
6
Figure 2-1 Scouts Analogy
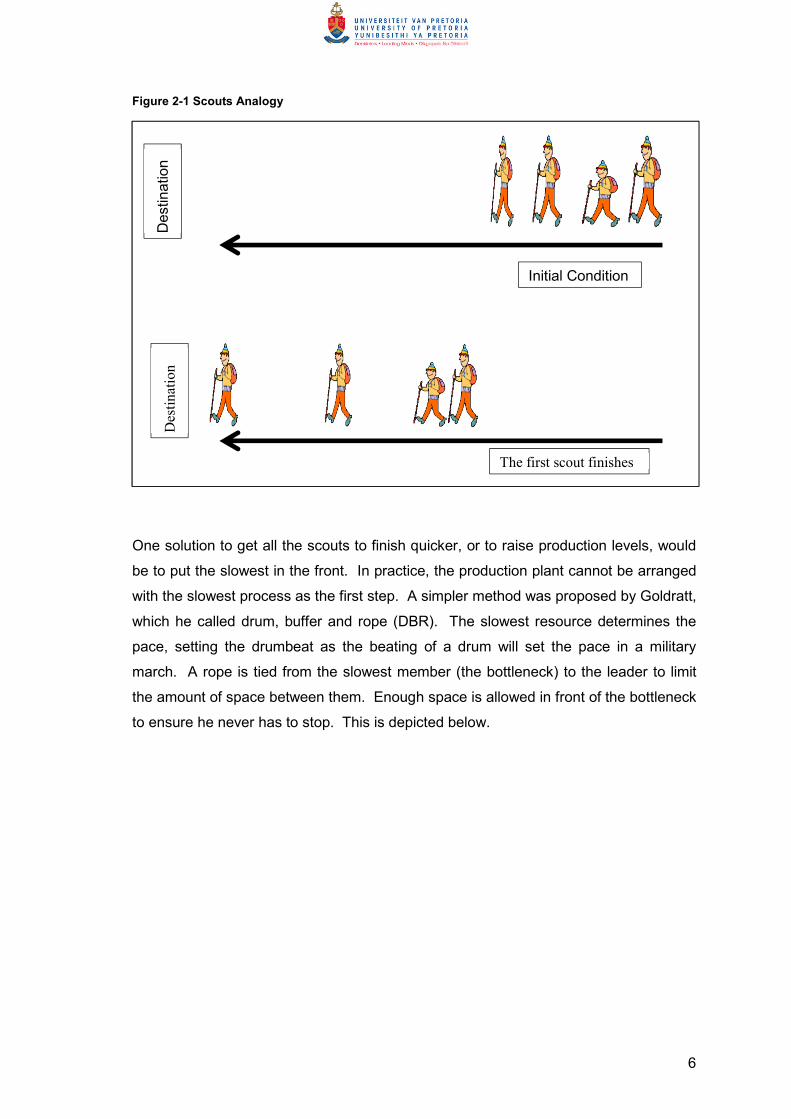
One solution to get all the scouts to finish quicker, or to raise production levels, would
be to put the slowest in the front. In practice, the production plant cannot be arranged
with the slowest process as the first step. A simpler method was proposed by Goldratt,
which he called drum, buffer and rope (DBR). The slowest resource determines the
pace, setting the drumbeat as the beating of a drum will set the pace in a military
march. A rope is tied from the slowest member (the bottleneck) to the leader to limit
the amount of space between them. Enough space is allowed in front of the bottleneck
to ensure he never has to stop. This is depicted below.
Initial Condition
Destination
Destination
The first scout finishes
7
Figure 2-2 : Drum, Buffer, Rope Illustrated
In this analogy the rope represents the rate of material release to limit the first scout
from running away. The buffer relates to the amount of time anybody in front of the
slowest scout can be delayed before it will start delaying the slowest scout: the
bottleneck
The drum determines the global schedule, or in manufacturing the rate at which the
constraint will be processing. Also the load of the slowest scout is distributed in an
attempt to speed him up. This will later be called exploitation of the bottleneck. This
example illustrated the effectiveness of using the bottleneck to synchronise the flow
through the process.
Destination
Rope
Buff
er
8
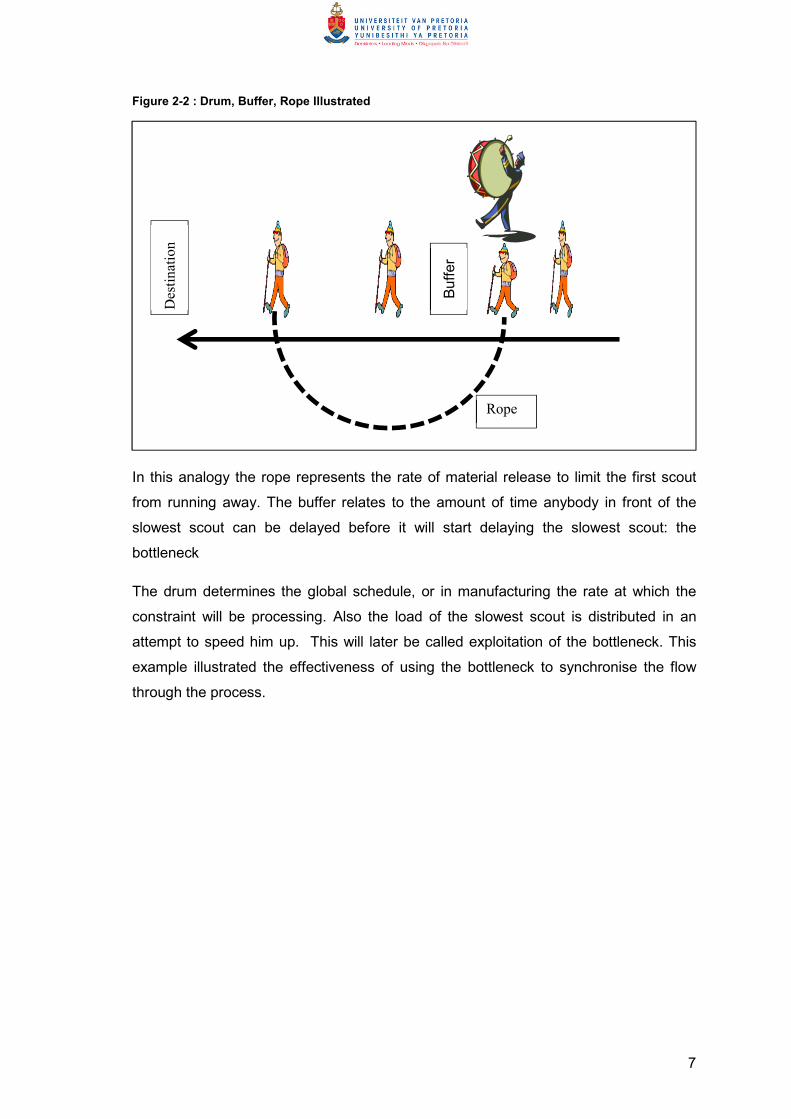
2.3 The business case for TOC
In The Goal Goldratt (Goldratt & Cox, 1986) proposed three measures of business
performance. The three are: net profit, return on investment and cash flow. The drivers
or operational measurements of these three bottom line measures are throughput,
inventory and operational expense. See below for a graphical representation of these
relationships.
Figure 2-3 Operational measurements' relation to the bottom line measurements, from Goldratt & Fox (1996)
Throughput: For every unit sold, the difference between selling price and the direct
material cost is the contribution per unit. The throughput is then defined as the product
of volume of units sold and unit contribution, or TP=Volume(Selling price- Variable
cost). It is obvious that increasing throughput would yield higher profit, since net profit
is the difference between throughput and operating expense, or NP=TP-OE. Higher
profit would yield higher return on investment, and higher throughput would lead to
more cash generated. Goldratt also shows that return on investment, ROI=Net profit/
Inventory = (TP-OE) / Inventory.
Throughput Inventory Operational
Expense
Net profit Return on
investment
Cash flow
9
Inventory: In the TOC framework, inventory includes all money spent or invested in
raw material, work in progress, finished goods and assets. Reducing inventory will lead
to an increase in cash. Reducing inventory will also increase return on investment.
Operating expense: Operating expense covers all expense not directly related to the
good produced or otherwise called fixed cost. This would only exclude material cost,
and direct labour cost. Direct labour is only direct labour if the labour cost has a linear
relationship with the number of units produced. It makes sense that if operating
expenses decrease, the profit should increase. A common method of using cost to
make decisions, is to determine cost per unit by allocate overheads to each unit
produced by dividing the overheads by the number of units. This may even be done
per process or machine, and then management may use figures derived by this
method to gauge efficiency or to manage according to this cost per unit. Goldratt
(Goldratt & Cox, 1986) pointed out that these cost per unit measures will drive
management behaviour that will result in less than optimal priority and scheduling
decisions and false impressions of efficiency. For example, the factory may be flooded
with inventory to prevent any machine running out of work. This may lead to apparently
good performance (i.e. low cost per unit, since overheads are allocated to many units),
but ties up excessive amounts of cash in the form of inventory, while at the same time
significantly increasing lead times and loss of flexibility.
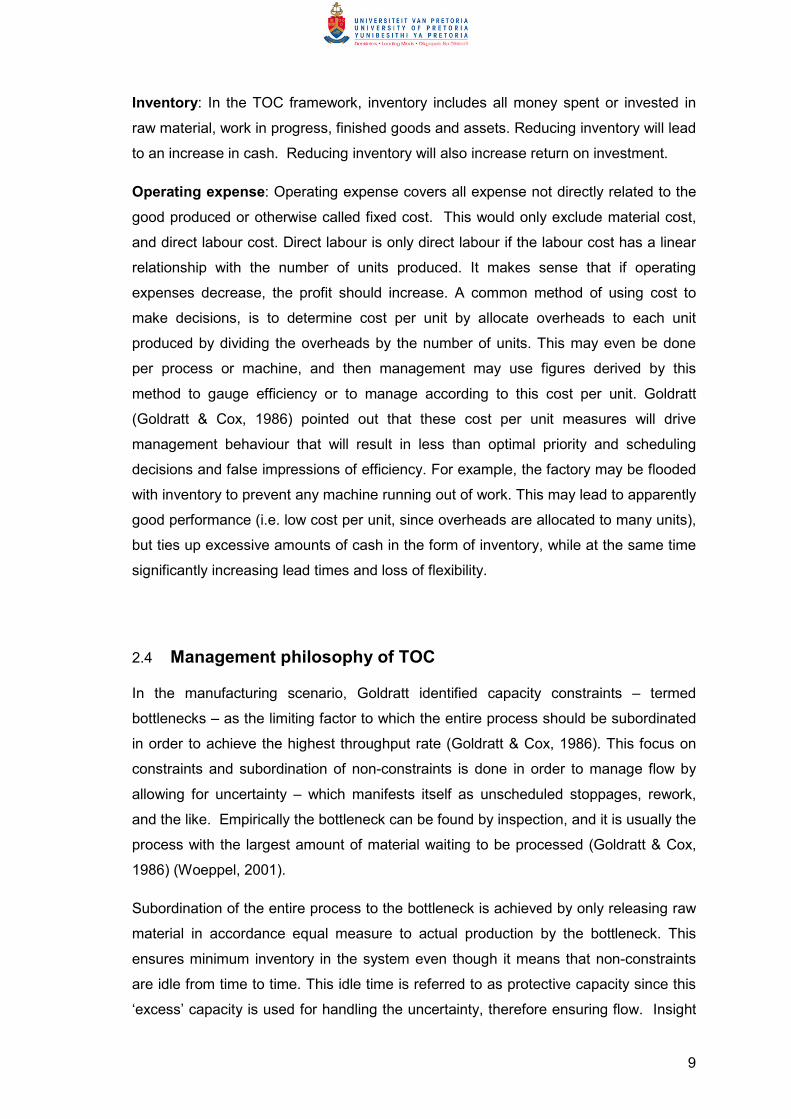
2.4 Management philosophy of TOC
In the manufacturing scenario, Goldratt identified capacity constraints – termed
bottlenecks – as the limiting factor to which the entire process should be subordinated
in order to achieve the highest throughput rate (Goldratt & Cox, 1986). This focus on
constraints and subordination of non-constraints is done in order to manage flow by
allowing for uncertainty – which manifests itself as unscheduled stoppages, rework,
and the like. Empirically the bottleneck can be found by inspection, and it is usually the
process with the largest amount of material waiting to be processed (Goldratt & Cox,
1986) (Woeppel, 2001).
Subordination of the entire process to the bottleneck is achieved by only releasing raw
material in accordance equal measure to actual production by the bottleneck. This
ensures minimum inventory in the system even though it means that non-constraints
are idle from time to time. This idle time is referred to as protective capacity since this
‘excess’ capacity is used for handling the uncertainty, therefore ensuring flow. Insight
10
is also given that the entire system’s throughput is determined by the production level
of the bottleneck – in as much as the strength of a chain is limited or determined by the
weakest link.
Exploitation of the bottleneck is accomplished by ensuring that the bottleneck is never
idle, by ensuring an adequate buffer size in front of the bottleneck. Wei, Liu and Tsai
(2002) developed a method for accurately estimating this buffer size, calling it
“enhanced TOC”, while an open queuing network analysis approach was proposed by
Louw and Page (2003). Goldratt did not give a specific size or method of calculation,
other than indicating the bottleneck should not run out of work (Goldratt & Cox, 1986).
Work that can be performed by other resources are also removed/offloaded from the
bottleneck, thus creating more capacity in the bottleneck, in turn increasing plant
throughput.
2.5 The five focussing steps
Theory of Constraints then proposed a system that follows five so-called focussing
steps that are completed in sequence.
These steps are
• Identify the constraint
• Exploit the constraint
• Subordinate to the constraint
• Elevate
• Repeat the process
2.5.1 Identify the constraint
As stated, the constraint internal to the system can be found empirically by inspection
of work in progress in the factory, as the bottleneck usually has large amounts of
inventory waiting to be processed in front of it. Constraints can be external to the firm
as well. The market, for example, can be the constraint. Woeppel (2001) found that
constraints can be broadly arranged in three categories: Policy constraints, resource
constraints, and materials constraints. He further found that policy constraints are by
far the most prevalent, with an incidence of around 90%. He defined “A policy is a rule,
measurement or condition that dictates organisational behaviour.” (p.12)
11
Woeppel (2001) found that resource constraints made up 8% of the cases studied and
the remainder were made up of materials constraints. Resource constraints are
capacity constraints, in other words the firm cannot produce more because of lack of
internal capacity. Materials constraints realise when some material is unobtainable, for
example computer microchips.
2.5.2 Exploit the constraint
The present capacity of a workstation can be expressed as:
Present capacity = work + waste (Youngman, 2012)
Exploiting the bottleneck is the process by which the present capacity is increased, by
reducing waste. In the exploitation of the bottleneck in The Goal, the following actions
were taken. Firstly it was checked whether the product actually needed to be
processed by the bottleneck. If this was not necessary, capacity was generated on the
bottleneck by allowing other machines to process this task. Secondly the amount of
wasted work processed by the bottleneck was reduced by introducing quality
assurance before it was sent for processing by the bottleneck. This meant that items
were rejected before the bottleneck wasted processing time on an item that would be
scrapped, thus reducing waste and increasing capacity.
The third method of exploitation is to remove the waste of over production.
Management is tempted to make product for stock, because it is “efficient”. In the
context efficient refers to the accounting method by which overhead is allocated to the
machine on a cost per unit basis, and it follows that more units produced before tooling
is changed, the less the cost per unit and therefore it appears to be more “efficient”.
Over production is regarded as waste of capacity under TOC. Production should be
limited to consumption for the foreseeable future.
2.5.3 Subordinate to the constraint
Usually, as Blackstone (2001) pointed out, the term ‘constraint’ refers to something that
must be avoided, but in the TOC framework the constraint is the “focussing point
around which a business can be organized”, p1053. In the same manner that exploit is
the focus of the bottleneck, the process of subordination is the focus of all the other
resources. If a resource stands idle, management will be concerned in the cost
allocation model because per unit costs are rising, but under TOC an idle resource is
perfectly allowable as long as it is not the bottleneck.
12
The exploitation plan drives the subordination plan (Youngman, 2012). Deviation from
the exploitation plan leads to non-bottlenecks either not doing what is supposed to be
done, or doing what is not supposed to be done. Subordination is the critical process
that aims to ensure that management does not focus on a local minima, such as cost
per unit, and pays for that by driving the system to a less than optimal solution.
In subordination to the bottleneck, a non-bottleneck needs to either produce at full
capacity (creating throughput), or be at standstill (protecting throughput) (Youngman,
2012). The situation where a non-bottleneck is producing at a reduced rate when it
really should be idle is detrimental to the process as a whole, and is termed throughput
destruction.
2.5.4 Elevate
Additional bottleneck capacity was installed in The Goal (Goldratt & Cox, 1986). This
took the form of old machines that could be re-commissioned and could perform some
of the same processes as the bottleneck. This is formalised as elevation. Elevation
could also take the form of outsourcing.
2.5.5 Repeat the process
Repeating the process is necessary because the process of exploiting and elevating
the bottleneck, may have caused the bottleneck to move. The active task of repeating
the process ensures that the process is continuously improved, and hence TOC is
seen as a continuous improvement methodology (Blackstone, Theory of constraints - a
status report, 2001).
2.6 Critical chain overview
It is possible to apply Theory of Constraints to project management, as Goldratt
demonstrated (Goldratt E. M., 1997), ultimately developing the idea of Critical Chain
(CC). To make the transition, a simple “A” plant is considered.
13
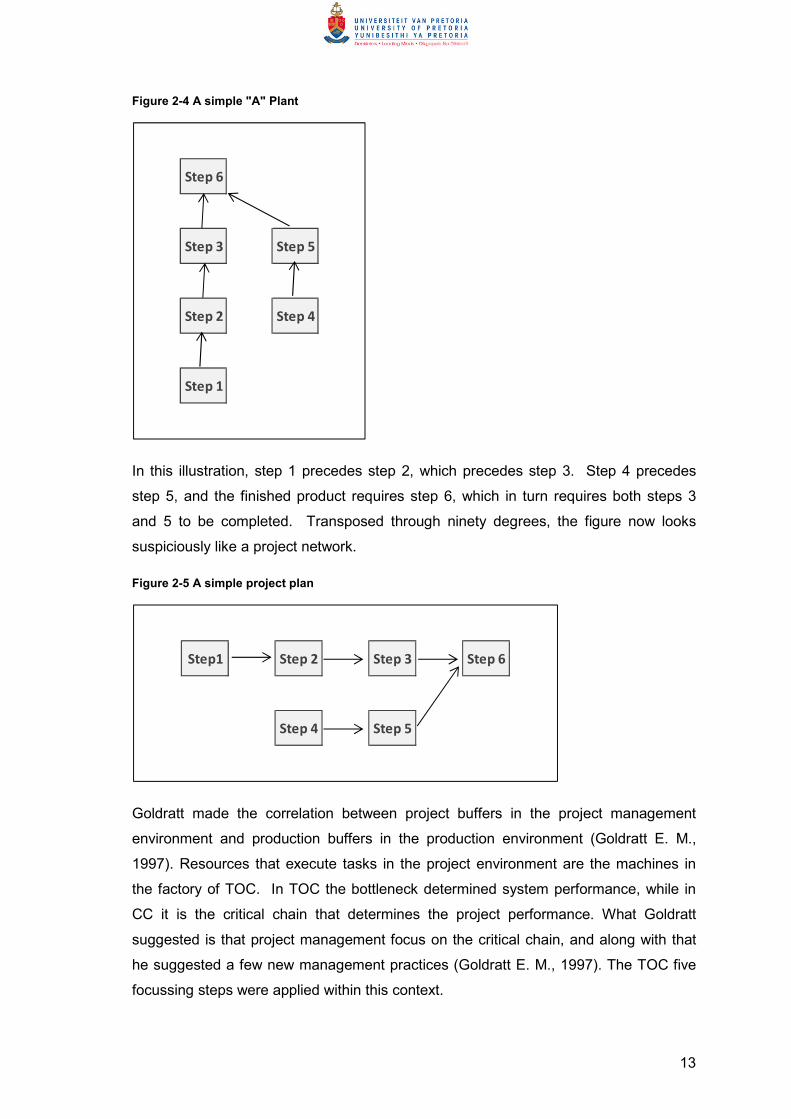
Figure 2-4 A simple "A" Plant
In this illustration, step 1 precedes step 2, which precedes step 3. Step 4 precedes
step 5, and the finished product requires step 6, which in turn requires both steps 3
and 5 to be completed. Transposed through ninety degrees, the figure now looks
suspiciously like a project network.
Figure 2-5 A simple project plan
Goldratt made the correlation between project buffers in the project management
environment and production buffers in the production environment (Goldratt E. M.,
1997). Resources that execute tasks in the project environment are the machines in
the factory of TOC. In TOC the bottleneck determined system performance, while in
CC it is the critical chain that determines the project performance. What Goldratt
suggested is that project management focus on the critical chain, and along with that
he suggested a few new management practices (Goldratt E. M., 1997). The TOC five
focussing steps were applied within this context.
Step 6
Step 3 Step 5
Step 2 Step 4
Step 1
Step1 Step 2 Step 3 Step 6
Step 4 Step 5
14
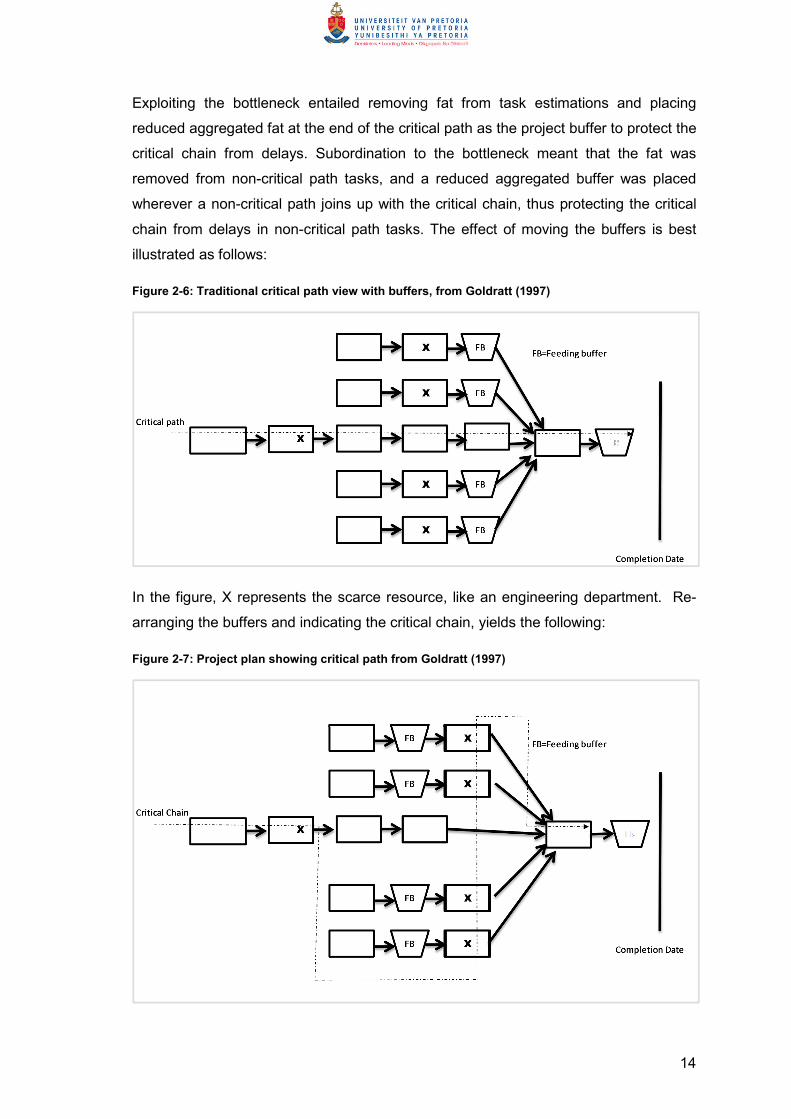
Exploiting the bottleneck entailed removing fat from task estimations and placing
reduced aggregated fat at the end of the critical path as the project buffer to protect the
critical chain from delays. Subordination to the bottleneck meant that the fat was
removed from non-critical path tasks, and a reduced aggregated buffer was placed
wherever a non-critical path joins up with the critical chain, thus protecting the critical
chain from delays in non-critical path tasks. The effect of moving the buffers is best
illustrated as follows:
Figure 2-6: Traditional critical path view with buffers, from Goldratt (1997)
In the figure, X represents the scarce resource, like an engineering department. Re-
arranging the buffers and indicating the critical chain, yields the following:
Figure 2-7: Project plan showing critical path from Goldratt (1997)
15
In addition, new rules were implemented to ensure that the reduced estimated time on
the resource is not wasted by:
• reduction of multi-tasking
• eliminating the student-syndrome
• ensuring that gains are also passed on, not only delays
2.7 Management practices
Project management methodologies generally focus on what ‘should’ be done, and
operates from the assumption that project leaders will follow a rational and consistent
approach. Shore (2008) pointed out that there is another view, which focusses on the
actual behaviour of individuals within an organisation. With this in mind, the following
management practices proposed by CC are presented.
2.7.1 Elimination of multi-tasking
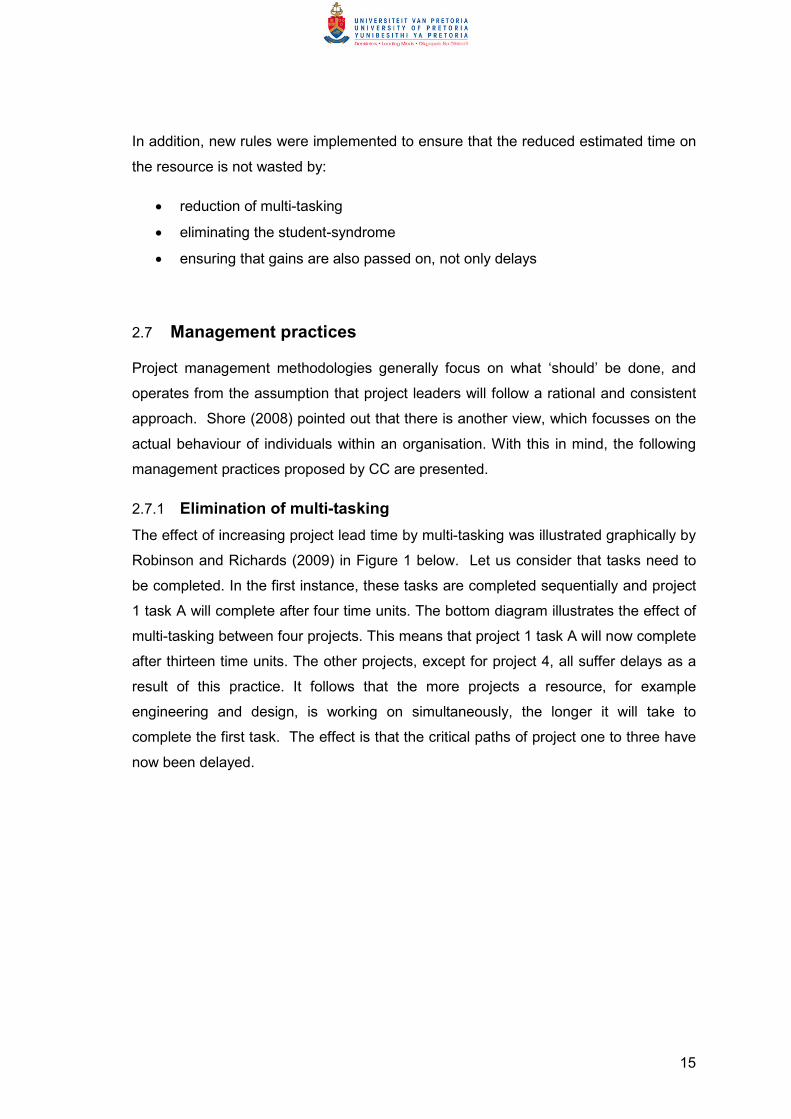
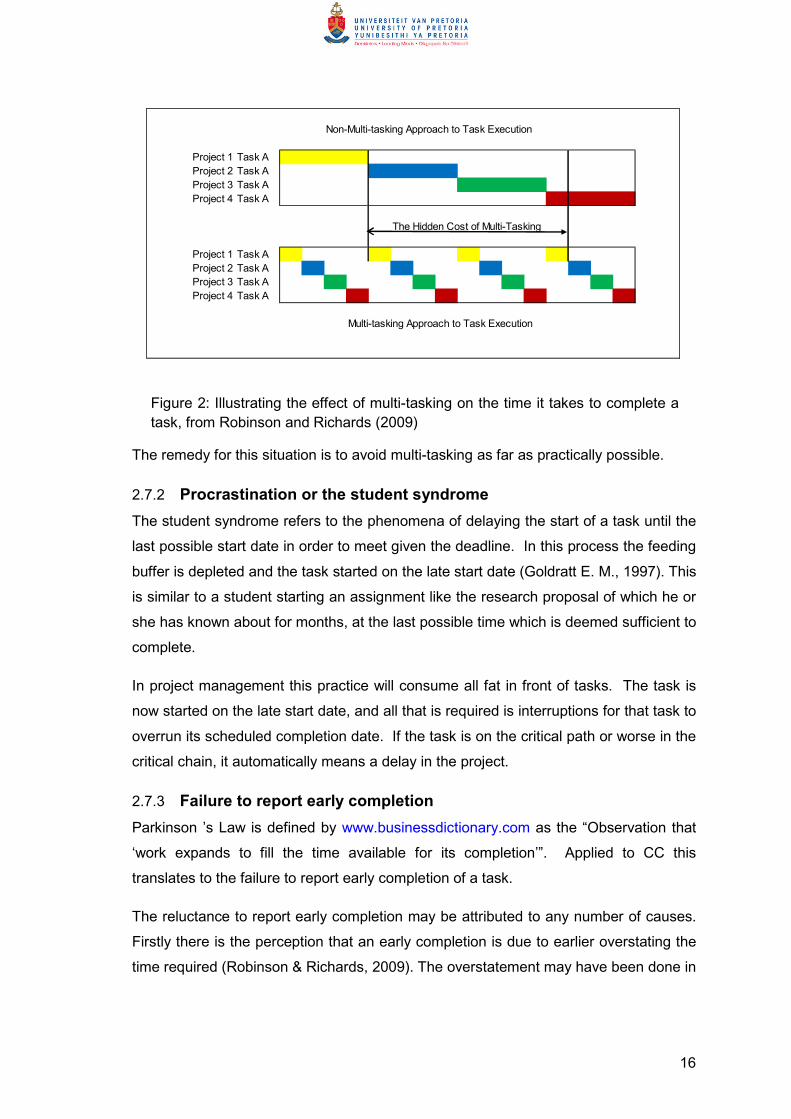
The effect of increasing project lead time by multi-tasking was illustrated graphically by
Robinson and Richards (2009) in Figure 1 below. Let us consider that tasks need to
be completed. In the first instance, these tasks are completed sequentially and project
1 task A will complete after four time units. The bottom diagram illustrates the effect of
multi-tasking between four projects. This means that project 1 task A will now complete
after thirteen time units. The other projects, except for project 4, all suffer delays as a
result of this practice. It follows that the more projects a resource, for example
engineering and design, is working on simultaneously, the longer it will take to
complete the first task. The effect is that the critical paths of project one to three have
now been delayed.
16
Figure 2: Illustrating the effect of multi-tasking on the time it takes to complete a
task, from Robinson and Richards (2009)
The remedy for this situation is to avoid multi-tasking as far as practically possible.
2.7.2 Procrastination or the student syndrome
The student syndrome refers to the phenomena of delaying the start of a task until the
last possible start date in order to meet given the deadline. In this process the feeding
buffer is depleted and the task started on the late start date (Goldratt E. M., 1997). This
is similar to a student starting an assignment like the research proposal of which he or
she has known about for months, at the last possible time which is deemed sufficient to
complete.
In project management this practice will consume all fat in front of tasks. The task is
now started on the late start date, and all that is required is interruptions for that task to
overrun its scheduled completion date. If the task is on the critical path or worse in the
critical chain, it automatically means a delay in the project.
2.7.3 Failure to report early completion
Parkinson ’s Law is defined by www.businessdictionary.com as the “Observation that
‘work expands to fill the time available for its completion’”. Applied to CC this
translates to the failure to report early completion of a task.
The reluctance to report early completion may be attributed to any number of causes.
Firstly there is the perception that an early completion is due to earlier overstating the
time required (Robinson & Richards, 2009). The overstatement may have been done in
Non-Multi-tasking Approach to Task Execution
Project 1 Task A
Project 2 Task A
Project 3 Task A
Project 4 Task A
The Hidden Cost of Multi-Tasking
Project 1 Task A
Project 2 Task A
Project 3 Task A
Project 4 Task A
Multi-tasking Approach to Task Execution
17
order to avoid punishment in case of an overrun in completion, and was done as a
protection mechanism.
Secondly, the effect on future estimates was considered. Management may reduce the
time allowed for a task in future based on past performance, which may lead to an
overrun and more punishment. Thirdly, management might now find idle resources or
an oversupply of resources, which underpins the threat of retrenchment.
The impact on the project schedule is clear: Because the task is not shown to be
completed on the project schedule, the next will not be started and the result is yet
another delay in the critical path.
2.8 The critical chain concept
In a multiple-project environment a further constraint was recognised, namely a scarce
resource constraint that determines the number of projects that can be executed
simultaneously. For example, a drawing office needs to produce drawings for all the
current projects, and this drawing office has limited capacity, which will affect all
projects simultaneously. The throughput of the scarce resource determines progress
on all projects, and therefore becomes a critical chain in itself. Under resource
contention, the critical chain might be different from the critical path, and in such cases
following the critical path leads to loss of control.
In a project management environment the bottleneck can take the form of equipment,
such as a tower crane, but often this can be a pool of skilled workers like an
engineering department. The need therefore is to address management practices,
including behavioural issues, which is why implementation of CC is referred to as a
culture change management framework (Berry & Smith, 2005).
2.9 Reducing suppliers’ lead time
In most projects, a supplier of some sorts may be used, whether it is to supply a good,
a service or execute a sub-project. The lead times of these suppliers may be on the
critical path. Goldratt illustrated that the marginal cost of an improvement on the lead
time is largely irrelevant (Goldratt E. M., 1997). He noted that the impact of a delay can
be measured in monetary terms by considering the impact on the organisation. In his
18
example, an expansion project in a high tech company that is delayed will cause a loss
in sales for the time it is delayed. The lost sales would have brought in profit, which is
cash flowing into the business. Lost sales also implies lost market share, lost market
share causing incorrect stock forecasts. The stock is not useable if it is not sold, as
high tech products are, and the lost market share caused over stocking. This implies
substantial damage to shareholders, illustrating that the price for accelerating a project
is relatively small compared to the potential damage (Goldratt 1997, p174-177).
2.10 The practical application of CC
Herroelen and Leus (2001) hold that project failure can mainly be attributed to lack of
planning. They later cited a survey among IT executive managers which identified
factors such as user involvement, executive management support and a clear
statement of requirements to be more important than proper project planning
(Herroelen & Leus, 2005). Odeh & Battaineh (2005) also identified lack of planning as
a factor contributing to project failure (Rozenes, Vitner, & Spraggett, 2006). Critical
chain approach requires a different mind-set and management practices in comparison
with traditional critical path scheduling, due to the vastly different philosophies (Lechler,
Ronen, & Stohr, 2005). It is therefore clear that CC encompasses more than the pure
project schedule, but reaches to managerial practices and behaviour of individuals
One of the underlying assumptions of methodologies such as critical path is that
resources are unlimited and available to for assignment to tasks (Herroelen & Leus,
2005), whereas CC introduced the concept of limited resources forming a critical chain
(Goldratt E. M., 1997). Project managers tend to think that the critical path determines
project duration, whereas CC brought the insight that under limited resources this can
be very misleading. Herroelen (2005) suggested that a multi-project environment
where projects are low in variability but high dependency, calls for deterministic
scheduling. He further suggests CC in cases where dependency is a real problem –
pointing to the contribution of CC as a method useful under resource scarcity.
It is therefore clear that CC has application to project scheduling, but importantly CC
also highlights managerial practices and individual behaviours to implement as part of
project management in general.
19
2.11 Criticism of TOC and CC
Refereeing: Goldratt published TOC as a novel (Goldratt & Cox, 1986), which Rand
(1986) described as “It’s a novel, but it’s also a manufacturing text-book, and it’s good
on both accounts.” (Tibben-Lembke, 2009). The status of The Goal as the latter has
been disputed by the likes of Trietsch (2005) who noted that almost none of Goldratt’s
work had been refereed. Trietsch was also of the opinion that the five focussing steps
are “theoretically flawed” (Trietsch D. , 2005).
Berry and Smith (2005) did not agree and noted that the theoretical base does in fact
exist in systems theory, metrics and culture based changed management. Thus
although The Goal may not have be refereed, the theory is not necessarily wrong, in
fact Aryanezhad, Badri and Komijan (2010) points out on p5076 that the algorithm had
been verified by Luebbe and Finch (1992) and Patterson (1992).
Originality of ideas: Trietsch (2005) claimed that most of the ideas had predated
Goldratt’s publishing of The Goal, for example he cited a book by Pervozvansky
(Trietsch D. , 2005) as the source of the idea of bottlenecks. He does however agree
that Goldratt made and “important contribution” (Trietsch D. , 2005). Steyn also cited
sources that claim the ideas presented in CC are nothing new, or at least heavily
borrowed (Steyn,2001).
Other sources differ from his view. Herroelen and Leus (2001) stated that “The majority
of the writings consider CC/BM as the most important breakthrough in the history of
project management.” (Herroelen & Leus, 2001, p. 560). Steyn found that applying
TOC to project management was “by no means common prior to the advent of Critical
Chain” (Steyn, 2001, p.369)
Criticism on the universal scheduling solution: That TOC is not the ultimate solution to
any plant-scheduling problem was pointed out by Souren, Ahn and Schmitz (2005)
who demonstrated an example where linear programming yielded more optimal results
than TOC. They have to note its high acceptance in practice, and have to concede that
TOC is applicable in a wide range of real product mix decisions. It was also noted that
TOC yields decision rules that are easy to comprehend and are common sense, while
care must be taken not to oversimplify (Herroelen, Leus, & Demeulemeester, Critical
chain project scheduling: do not oversimplify, 2002). One also must be careful to
generalise the assumption that linear programming will yield the same or better results
than TOC (Balakrishnan & Cheng, 2000). It has been demonstrated simulation that
other methods may yield better results in a multi-project environment (Cohen,
20
Mandelbaum, & Shtub, 2004), in a theoretical example. Blackstone, Cox & Schleier’s
(2009) example, however, showed CC to perform better, thus as far as theoretical
examples are concerned, the opinions are divided.
Criticism of the contribution of TOC to project management: Even though different
opinions exist on the originality of the ideas, critics and promoters alike admitted that it
was a breakthrough at the time, and that TOC presented an innovative new way of
project management. (Trietsch D. , 2005) (Herroelen & Leus, On the merits and pitfalls
of critical chain scheduling, 2001), (Lechler, Ronen, & Stohr, 2005), (Steyn, 2001).
Practical application: Critical chain is used by large companies such as Hitachi (Umble,
Umble, & Murakami, 2006), ABB, Boeing, Hewlett Packard and others (Stratton, 2011)
for project management. Even a small company can implement the full CC process as
there is software available even at USD250 (Stratton, 2011).
It should also be noted, as Lechler, Ronen and Stohr (2005) suggested, that there are
CC management practices that are highly beneficial to be implemented, without having
to implement the complete CC process. They named the following:
• Manage constraint resources to avoid or solve resource conflicts
• Reduce WIP
• Reduce multitasking
• Focus on total systems throughput rather than individual projects
The major criticism of CC and TOC then centred on refereeing, the originality of ideas,
and theoretical problems where other methods yielded better results. Usually the same
authors have to concede that CC did contribute some very common sense
management practices, that it is popular (Trietsch D. , 2005), intuitive (Cohen,
Mandelbaum, & Shtub, 2004) and addressed the issue of resource constraints (Cohen,
Mandelbaum, & Shtub, 2004).
2.12 Summary
Critical chain was shown to be an approach with significant differences to traditional
critical path project scheduling. At the very least CC offers beneficial management
practices that should be implemented, even without implementing the full CC process.
These practices are: elimination of multi-tasking, elimination of procrastination, and
elimination of failure to report early finishes. The five focussing steps may be used as a

21
continuous improvement process, the heart of which is the increase in throughput rate,
leading to making more money now and in the future.
Woeppel (2001) summarised it best: “I have NEVER seen an implementation where
the concepts were applied correctly and the organization didn’t see significant bottom
line results” (p.viii).
22
3 Research questions 2
The research therefore aimed to answer:
Research question 1:
What the improvements in business performance are due to critical chain
methodology being implemented; and
Research question 2:
What are the contributing and inhibiting factors that will determine the success
or failure of the implementation of the critical chain methodology?
23
4 Research methodology and design
Action research, a term coined by Lewin, (O'Brien, 1998) was selected as the most
appropriate research method for the study of the implementation of CC methodology.
4.1 Why action research
4.1.1 Organisational change
Action research is employed as a tool to bring about change through data collection
(Butterfield, 2009), rather than the data being the end product in itself. With action
research the “5purpose of the research is to be part of and study research in action
rather than to conduct research about action. A typical emphasis for the research may
be the change process in an organisation.” (Saunders & Lewis, 2012). As
implementing CC practices is a change in behaviour of managers and employees in
the organisation, action research was appropriate.
4.1.2 Based on implementing theory
As CC presents a simple theoretical base, and the object of change in the organisation
is the implementation of CC to improve business performance, action research is an
appropriate tool. The available theoretical material, in the form of The Goal (Goldratt &
Cox, 1986) and Critical Chain (Goldratt E. M., 1997), are written in a gripping novel
format. The Goal, was described in 1995 by The Economist as “The most successful
attempt at management-as-fiction” (Tibben-Lembke, 2009). This makes it easy for the
action research group to be well informed of the theory, as it is the intention that,
during the action research process, the researcher will “study the problem
systematically and ensures the intervention is informed by theoretical considerations”
(O'Brien, 1998).
4.1.3 Used in problem solving
Action research is used in real situations solving real problems, as opposed to solving
experimental or contrived problems (O'Brien, 1998). In the case of this research, action
research is thus appropriate as it is desired to overcome the practical problems of
implementation of CC. In solving these problems, the inhibiting and contributing
factors to the implementation will become apparent, and that is the true object of the
research.
24
4.2 General action research methodology
4.2.1 Human knowing
At the heart of action research is the concept that human knowing is a three step
heuristic process: experience, understanding and judgement (Coghlan & Brannick,
2010, p. 19). The pattern of these three actions is common to all cognitional activity.
Drawing from this, action research follows a series of cycles structured around this
three-step process.
Following the method proposed by O’Brien (O'Brien, 1998) the problem is first
identified. A plan (the actions) will be formulated, as the next step. Thirdly the actions
will be implemented. The fourth step is to observe the results achieved, and the last
step is the reflection upon the results, and specifying learnings. The three steps of
knowing referred to above is now completed. To increase learning further this cycle is
repeated. The key academic contribution will be made during the phase of specifying
the learnings. Saunders and Lewis (Saunders & Lewis, 2012) view these cycles as an
upward spiral.
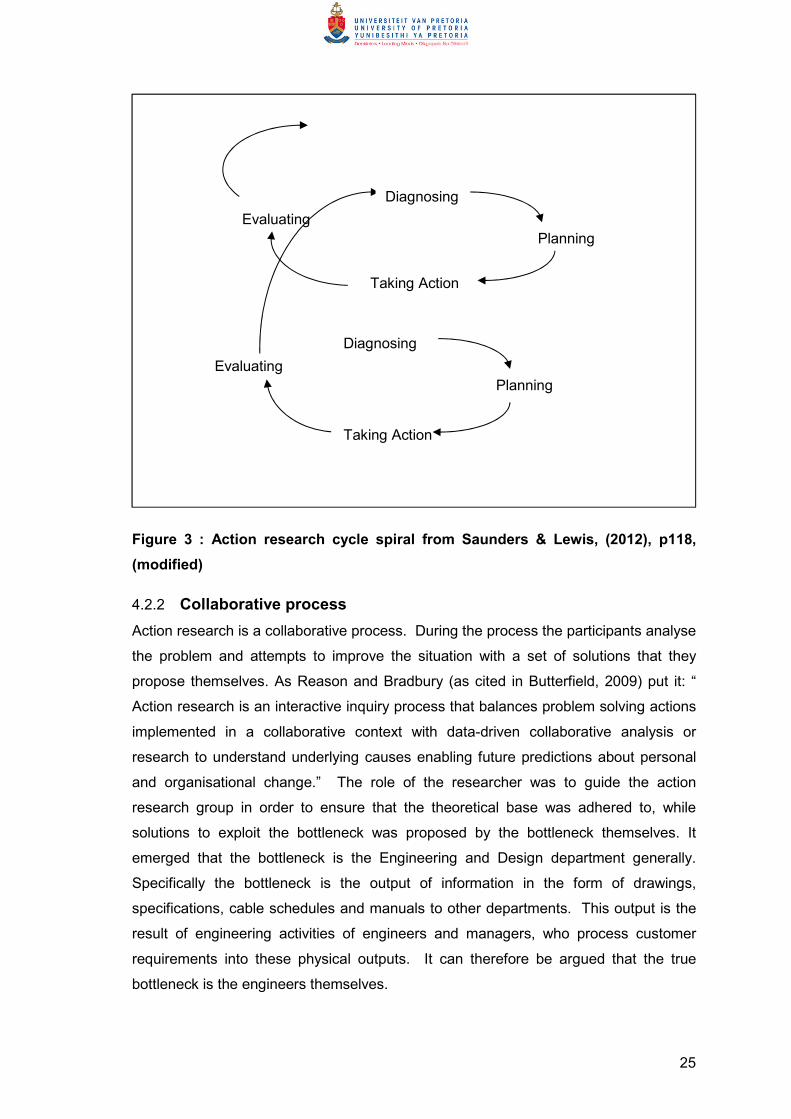
Coghlan & Brannick (2010) further pointed out that multiple action research cycles can
operate simultaneously, and these cycles typically have different time spans. The
analogy was made to a clock where the minute hand takes an hour to complete a
cycle, whilst the hour hand takes half a day to complete its cycle. They also pointed out
that being too rigid in the formal application of the research cycles may reduce
spontaneity and creativity.
25
Figure 3 : Action research cycle spiral from Saunders & Lewis, (2012), p118,
(modified)
4.2.2 Collaborative process
Action research is a collaborative process. During the process the participants analyse
the problem and attempts to improve the situation with a set of solutions that they
propose themselves. As Reason and Bradbury (as cited in Butterfield, 2009) put it: “
Action research is an interactive inquiry process that balances problem solving actions
implemented in a collaborative context with data-driven collaborative analysis or
research to understand underlying causes enabling future predictions about personal
and organisational change.” The role of the researcher was to guide the action
research group in order to ensure that the theoretical base was adhered to, while
solutions to exploit the bottleneck was proposed by the bottleneck themselves. It
emerged that the bottleneck is the Engineering and Design department generally.
Specifically the bottleneck is the output of information in the form of drawings,
specifications, cable schedules and manuals to other departments. This output is the
result of engineering activities of engineers and managers, who process customer
requirements into these physical outputs. It can therefore be argued that the true
bottleneck is the engineers themselves.
Diagnosing
Planning
Taking Action
Evaluating
Diagnosing
Planning
Taking Action
Evaluating
26
4.3 Local context of this action research
Original equipment manufacturers (OEM’s) treat individual products sold as projects
when there is a great deal of customisation involved. In this research, the context was
such a local South African original equipment manufacturer of highly customised
products. The firm is a medium sized enterprise and executes multiple projects, using
four internal resource groups. The company supplies specialised products largely to
South African mining companies, to their local and African operations. Lead times of
projects vary between eight and eighteen months.
4.3.1 Action research cycle time
A typical action research cycle can take three months, and this limits the amount of
cycles that can be completed for an MBA research report. However, it also stands to
reason that in a small company the change will be more quickly noticeable than in a
multinational corporation, which made the organisation better suited to action research.
4.3.2 System and population
CC is a systems approach. The system studied by this action research is defined as
the single OEM, executing multiple projects. This OEM represents a convenience
sample, due to limitations explained above.
The relevant population consists of all original equipment manufacturers where the
complexity and diversity of the products cause the company to treat each unit of
product as a project.
4.4 Personal Context
The firm chosen is the employer of the researcher, where the researcher holds a
senior management position. This enables decisions to be enforceable through the
organisation structure. Permission for this research had been obtained from the
shareholders and a team was assembled.
As action research requires the researcher in an involved role as a participant
(Saunders & Lewis, 2012), the researcher will assume the following roles: Chair the
steering committee and drive the change process. The researcher will also facilitate
data collection sessions, and encourage dialogue during these sessions. From a
management point the researcher will exercise control and ensure the agreed upon
interventions are carried out.
27
4.4.1 Personal bias
It is worth mentioning the possible bias of the researcher. The researcher is an
engineer, and previously was in charge of an engineering department in a similar
organisation. This may lead to confirmation bias, where he may have preconceived
ideas of how the department is supposed to function. Another source of confirmation
bias is that the researcher wishes to bring about effective change in the organisation,
and will be looking for positive evidence of effecting such change.
4.5 Mastering of theory by study group
4.5.1 Reading
In order for the study group to implement Critical Chain methodology, it was necessary
that the members of the study group actually know what is meant by CC. It was
decided to start with the Theory of Constraints and discover what the major theoretical
constructs are. This was achieved by circulating both of Goldratt’s books The Goal
(Goldratt & Cox, 1986) and Critical Chain (Goldratt, 1997) for reading by the study
group. This was completed in three months.
4.5.2 Playing the die game
The die game, described by Goldratt in chapter fourteen (Goldratt & Cox, 1986), was
played by the members of the study group. The game was led by the researcher and
comprised the broad team. The object of this learning was to
• appreciate that the bottleneck determines system throughput rate;
• appreciate that the bottleneck needs to be exploited;
• appreciate that the non-bottlenecks need to be subordinated to the bottleneck.
4.6 Structuring the cycles
During this action research project, action research cycles were executed. The cycles
were started and ended with group sessions lasting roughly three hours. The
researcher chairs the meeting and follows an agenda shown below and covered in
detail later:
• Discovery
28
• Measureable Action
• Reflection
• Next Steps / Planning
The researcher has to structure the dialogue and facilitate the group discussion on
these points in succession. Records of these discussions were kept. The definition
offered by Altrichter, Kemmis, McTaggart & Zuber-Skerritt (2002) states that action
research is
“(1) Action research is about people reflecting upon and improving their own
practice;
(2) By tightly inter-linking their reflection and action; and
(3) Making their experiences public to other people concerned by and
interested in the respective practice.” (p.128)
The four discussion points are structured to satisfy this definition as well as meet the
four steps O’Brien proposed (O'Brien, 1998).
4.6.1 Discovery
The discussion on discovery has to answer what has happened during the completed
cycle. Specific instances will be reflected on and the group will determine what has
been learned from these occurrences, and consider if any change in behaviour or
thinking has resulted from it. Bullet points under this heading are: What happened this
week? What did you learn from it? How did these new ideas change the way you are
thinking/taking action?
4.6.2 Measureable action
This heading covers the baseline measurements which will be agreed on by the
research group. It is examined if improvements have been noted, steps taken will be
noted and consideration is given to what the current status is with regards to where the
group wants to be. The bullet point under this heading are: What is your baseline?
What steps have you taken? Has it improved? Where are you on the scale from where
you started to where you want to go?
4.6.3 Reflection
The study group now considers what each individual will have to do during the next
cycle. Each member is required to comment on what should and could be done
differently. The facilitator ensures that these actions are in line with Theory of
Constraints. This section also contains space for the member to note down any other
29
thoughts and suggestions that have come to mind. The bullet points listed under this
heading are: What do you think/feel about what is going on? What recommendations
are you making to yourself for the next cycle? What could you be doing differently?
How do these ideas go along with or contrast what you have read in the literature
about this topic?
4.6.4 Next steps
This is a group activity again, and the research group plans what actions are going to
be taken during the next week. The idea is that it is reviewed what has worked and
what not during the past week. The steps for next week are planned – keeping the end
goal in mind. The team needs to plan specific actions that will be taken in the next
week or fortnight.
These interventions will be designed using Theory of Constraints generally, but Critical
Chain scheduling specifically to design the interventions. Key learning from the
implementation process are discovered and the interventions structured to test the
implementation of:
• Elimination of student syndrome
• Reducing multitasking
• Ensuring delays and gains are passed on to the next task in the process
Successful implementation of the above will reduce overall project lead times –
conversely throughput increasing. At the same time WIP should decrease, and
operating expenses decrease. The effects of these should manifest on the business in
terms of an increase in net profit, return on investment and cash flow.
4.7 Financial Measurements
The financial manager compiles the management accounts on a monthly basis, and in
Excel format for circulation to management. This data is sourced from the financial
system of the company, and very little manipulation is done on these reports to extract
the figures required for this research. As these reports follow conventional accounting
practice, throughput accounting figures need to be calculated. The source data up to
October 2011 is contaminated by the sale of the business, and contains cash figures
that require adjustment. As the research is concerned with improvements from the
start February 2012, this was of no concern.
30
Goldratt (1986) proposed three measurements for organisational performance. These
three are:
• Net profit
• Cash flow
• Return on investment
The definitions for these were covered in section 2.3. Net profit is calculated as
NP=TP-OE. To calculate NP, the sales figure was obtained from the financial sytem.
Sales refer to cash collected, as opposed to invoicing numbers. The direct costs are
subtracted from sales and then all the operational expense is subtracted. These are
shown in section 5.3.2
4.8 Action research learning
To answer question 2, the action research feedback form data is collated and
summarised. A view has to be taken
• if multitasking has been reduced and if it has improved throughput
• if failure to report early finishes has decreased and if it has improved
throughput
• if student syndrome has been reduced and if that has increased throughput.
An increase in throughput will manifest as an increase in revenue, an increase in net
profit, increase in return on investment and improved cash flow. The report is also
analysed for recurring themes, and from these themes factors that inhibit or contribute
to the implementation are distilled.
4.9 Action research group composition
The research team reports to the researcher and comprise the following participants:
Engineering Director and two of his direct subordinates – the most senior applications
engineer and the software engineer; the production manager and the workshop
manager; the services manager; the tendering manager and the financial manager.
The research team covers the managers of all the resources involved in the production
process. A typical project is handed from sales/ tendering to engineering. Engineering
31
designs and hands over to production. Production builds the equipment, and then
services will install and commission the equipment. Contracts management keeps an
eye on the process and is responsible for customer interaction and billing. The first
four are directly affecting the workflow and this is the area of study.
4.10 Potential research limitations
The research will be limited to the multi project environment. Further it is required that
the researcher is an integral part of the team due to his role, and this eliminates other
companies.
The specific circumstances and characteristics of the company studied may limit the
research to be applicable, for example, to only original equipment manufacturers in the
mining industry and in terms of size to a small to medium enterprise.
The last limitation to the research is the time limit. The research was conducted over a
nine month period, and it is possible that different results may be obtained if the period
is extended. As more of the focussing steps are worked through more diversity will be
introduced as it is possible that more departments may yield more reliable factors.
This is an area for future research.
32
5 Results
5.1 Structuring the action research group
The action research group initially consisted of the following participants: engineering
director, marketing manager, software engineer, contracts manager, divisional
directors, applications engineer, workshop manager, service manager and financial
manager. An organogram is attached as Appendix 2. The rationale was to include all
the heads of department and include other critical positions. The intention was to
identify the bottleneck as focussing step one. The structure of the action research
group would then be amended to focus on the bottleneck in order to complete the
focussing step of exploiting the bottleneck.
5.2 On the introduction of theory
The Goal (Goldratt & Cox, 1986) was circulated for reading to all these participants.
This was followed up by Critical Chain (Goldratt E. M., 1997). Comments after reading
the books include “I can recognise Winder Controls everywhere” in the book B. Peel
(personal communication, 10 January 2012), and “It makes one think differently” C.J.G.
de Beer (personal communication, 10 January 2012). A “mindset change” was
mentioned at the 13 August meeting. A general sense of excitement prevailed at the
meeting following the reading of the books, and there was general interest in
implementation of TOC, and it can be deduced that the theory was absorbed well
because participants identified with the theory as presented in story form.
To drive home the principle of statistical variation in process flow, and the effect of a
bottleneck limiting the output of the system, the die game from The Goal (Goldratt &
Cox, 1986) was played. This seemed to have created the energy required to
implement the changes to the way of working.
5.3 Business performance results
5.3.1 General comments
Winder Controls’ primary business is supplying large capital equipment to mines. The
order intake follows a similar pattern annually as the mines have a rhythmic cycle of
33
capital expenditure approval and placement of orders. It is therefore meaningful to
compare annual results on a general basis. Comparing any month to the same month
a year before, may add noise to the results. The analysis is thus done better on the
basis of observing general trends, when comparing with previous year’s results
The implementation of TOC started in March 2012, and it is useful to compare 2011
with 2012 over the same periods. As far as CC is concerned, one expects the results
to improve month by month, and here a month-by-month analysis can be done to
observe the results of the interventions.
Consideration should be given to the product mix. When projects range from upgrades
to full new supply, the complexity is not necessarily proportional to contract value.
Hence the material to labour ratio will differ between different types of products.
Similarly, small valued projects, can be as little as R700 000, and consist mostly of
engineering. Projects of R30 000 000, may contain only R1 000 000 in engineering, but
be equally complex to design.
As is typical of a company of this nature, order intake fluctuated from R780 000 to
R51 000 000 per month over the period shown. All financial figures, depicted as rand
values were divided by the average monthly sales figure. This was done to satisfy the
requirements of the company for the release of financial results for research purposes.
The scaling is such that a figure of R100 represents one average month’s revenue.
Goldratt (1986) suggests three measurements, net profit, return on investment and
cash flow, so these are examined in turn.
5.3.2 Net profit
5.3.2.1 Revenue streams
In the income statements two revenue streams are shown, major revenue and minor
sales. The term “major revenue” refers to indicate recognised revenue. Revenue
recognition is a standard practice of calculating revenue for income tax and reporting
purposes. Major revenue refers solely to project revenue and is calculated by adding
the tendered gross margin to actual cost for materials incurred for the period. The cost
of materials is easily determined by actual receipt of material by stores, and this is
reported by the GRV (Goods received Voucher) system. To this revenue value, the
labour recoveries as reported by the timesheet system is added as line IO85
Recoveries. This makes up the gross income from projects, or “major revenue”.
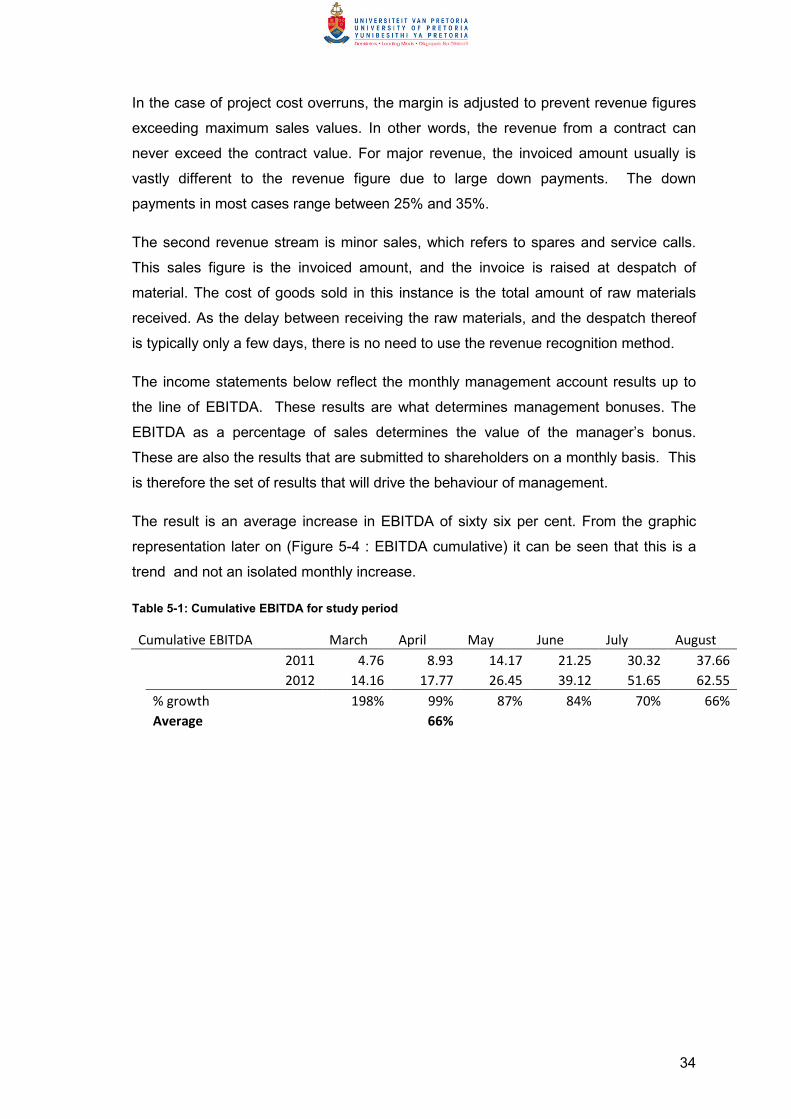
34
In the case of project cost overruns, the margin is adjusted to prevent revenue figures
exceeding maximum sales values. In other words, the revenue from a contract can
never exceed the contract value. For major revenue, the invoiced amount usually is
vastly different to the revenue figure due to large down payments. The down
payments in most cases range between 25% and 35%.
The second revenue stream is minor sales, which refers to spares and service calls.
This sales figure is the invoiced amount, and the invoice is raised at despatch of
material. The cost of goods sold in this instance is the total amount of raw materials
received. As the delay between receiving the raw materials, and the despatch thereof
is typically only a few days, there is no need to use the revenue recognition method.
The income statements below reflect the monthly management account results up to
the line of EBITDA. These results are what determines management bonuses. The
EBITDA as a percentage of sales determines the value of the manager’s bonus.
These are also the results that are submitted to shareholders on a monthly basis. This
is therefore the set of results that will drive the behaviour of management.
The result is an average increase in EBITDA of sixty six per cent. From the graphic
representation later on (Figure 5-4 : EBITDA cumulative) it can be seen that this is a
trend and not an isolated monthly increase.
Table 5-1: Cumulative EBITDA for study period
Cumulative EBITDA March April May June July August
2011 4.76 8.93 14.17 21.25 30.32 37.66
2012 14.16 17.77 26.45 39.12 51.65 62.55
% growth 198% 99% 87% 84% 70% 66%
Average
66%
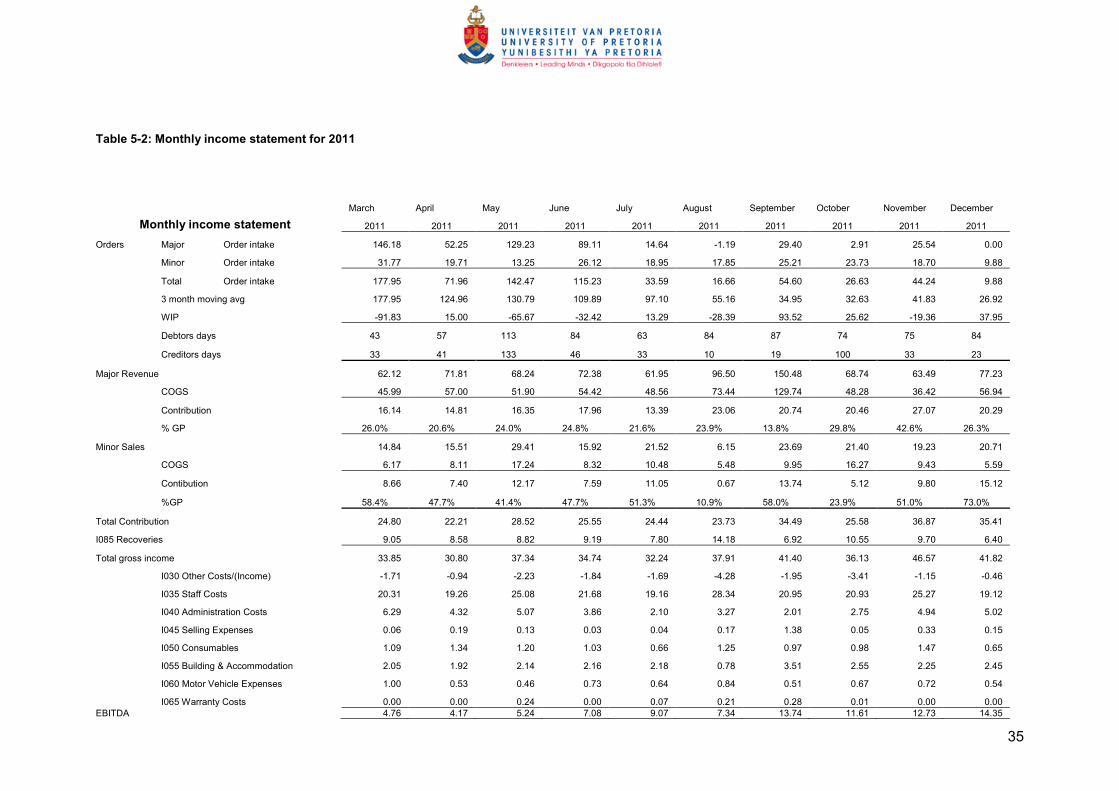
35
Table 5-2: Monthly income statement for 2011
Monthly income statement
March April May June July August September October November December
2011 2011 2011 2011 2011 2011 2011 2011 2011 2011
Orders Major Order intake 146.18 52.25 129.23 89.11 14.64 -1.19 29.40 2.91 25.54 0.00
Minor Order intake 31.77 19.71 13.25 26.12 18.95 17.85 25.21 23.73 18.70 9.88
Total Order intake 177.95 71.96 142.47 115.23 33.59 16.66 54.60 26.63 44.24 9.88
3 month moving avg 177.95 124.96 130.79 109.89 97.10 55.16 34.95 32.63 41.83 26.92
WIP -91.83 15.00 -65.67 -32.42 13.29 -28.39 93.52 25.62 -19.36 37.95
Debtors days 43 57 113 84 63 84 87 74 75 84
Creditors days 33 41 133 46 33 10 19 100 33 23
Major Revenue 62.12 71.81 68.24 72.38 61.95 96.50 150.48 68.74 63.49 77.23
COGS 45.99 57.00 51.90 54.42 48.56 73.44 129.74 48.28 36.42 56.94
Contribution 16.14 14.81 16.35 17.96 13.39 23.06 20.74 20.46 27.07 20.29
% GP 26.0% 20.6% 24.0% 24.8% 21.6% 23.9% 13.8% 29.8% 42.6% 26.3%
Minor Sales 14.84 15.51 29.41 15.92 21.52 6.15 23.69 21.40 19.23 20.71
COGS 6.17 8.11 17.24 8.32 10.48 5.48 9.95 16.27 9.43 5.59
Contibution 8.66 7.40 12.17 7.59 11.05 0.67 13.74 5.12 9.80 15.12
%GP 58.4% 47.7% 41.4% 47.7% 51.3% 10.9% 58.0% 23.9% 51.0% 73.0%
Total Contribution 24.80 22.21 28.52 25.55 24.44 23.73 34.49 25.58 36.87 35.41
I085 Recoveries 9.05 8.58 8.82 9.19 7.80 14.18 6.92 10.55 9.70 6.40
Total gross income 33.85 30.80 37.34 34.74 32.24 37.91 41.40 36.13 46.57 41.82
I030 Other Costs/(Income) -1.71 -0.94 -2.23 -1.84 -1.69 -4.28 -1.95 -3.41 -1.15 -0.46
I035 Staff Costs 20.31 19.26 25.08 21.68 19.16 28.34 20.95 20.93 25.27 19.12
I040 Administration Costs 6.29 4.32 5.07 3.86 2.10 3.27 2.01 2.75 4.94 5.02
I045 Selling Expenses 0.06 0.19 0.13 0.03 0.04 0.17 1.38 0.05 0.33 0.15
I050 Consumables 1.09 1.34 1.20 1.03 0.66 1.25 0.97 0.98 1.47 0.65
I055 Building & Accommodation 2.05 1.92 2.14 2.16 2.18 0.78 3.51 2.55 2.25 2.45
I060 Motor Vehicle Expenses 1.00 0.53 0.46 0.73 0.64 0.84 0.51 0.67 0.72 0.54
I065 Warranty Costs 0.00 0.00 0.24 0.00 0.07 0.21 0.28 0.01 0.00 0.00
EBITDA 4.76 4.17 5.24 7.08 9.07 7.34 13.74 11.61 12.73 14.35
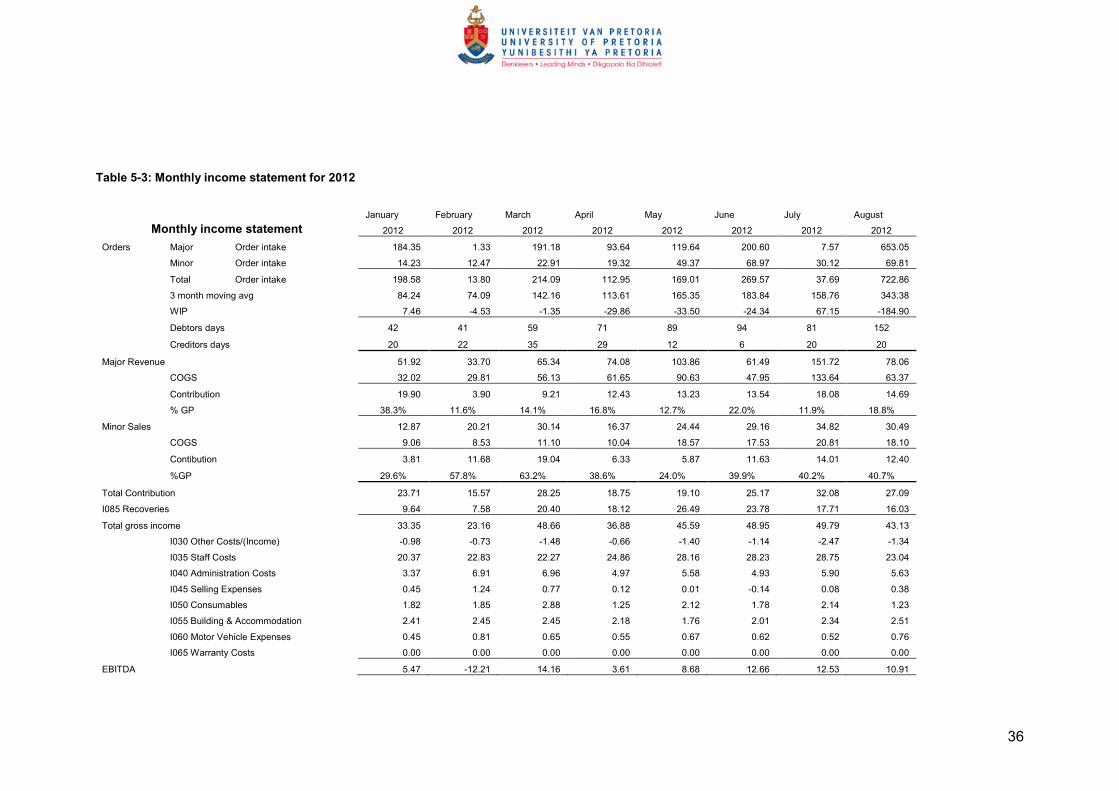
36
Table 5-3: Monthly income statement for 2012
Monthly income statement
January February March April May June July August
2012 2012 2012 2012 2012 2012 2012 2012
Orders Major Order intake 184.35 1.33 191.18 93.64 119.64 200.60 7.57 653.05
Minor Order intake 14.23 12.47 22.91 19.32 49.37 68.97 30.12 69.81
Total Order intake 198.58 13.80 214.09 112.95 169.01 269.57 37.69 722.86
3 month moving avg 84.24 74.09 142.16 113.61 165.35 183.84 158.76 343.38
WIP 7.46 -4.53 -1.35 -29.86 -33.50 -24.34 67.15 -184.90
Debtors days 42 41 59 71 89 94 81 152
Creditors days 20 22 35 29 12 6 20 20
Major Revenue 51.92 33.70 65.34 74.08 103.86 61.49 151.72 78.06
COGS 32.02 29.81 56.13 61.65 90.63 47.95 133.64 63.37
Contribution 19.90 3.90 9.21 12.43 13.23 13.54 18.08 14.69
% GP 38.3% 11.6% 14.1% 16.8% 12.7% 22.0% 11.9% 18.8%
Minor Sales 12.87 20.21 30.14 16.37 24.44 29.16 34.82 30.49
COGS 9.06 8.53 11.10 10.04 18.57 17.53 20.81 18.10
Contibution 3.81 11.68 19.04 6.33 5.87 11.63 14.01 12.40
%GP 29.6% 57.8% 63.2% 38.6% 24.0% 39.9% 40.2% 40.7%
Total Contribution 23.71 15.57 28.25 18.75 19.10 25.17 32.08 27.09
I085 Recoveries 9.64 7.58 20.40 18.12 26.49 23.78 17.71 16.03
Total gross income 33.35 23.16 48.66 36.88 45.59 48.95 49.79 43.13
I030 Other Costs/(Income) -0.98 -0.73 -1.48 -0.66 -1.40 -1.14 -2.47 -1.34
I035 Staff Costs 20.37 22.83 22.27 24.86 28.16 28.23 28.75 23.04
I040 Administration Costs 3.37 6.91 6.96 4.97 5.58 4.93 5.90 5.63
I045 Selling Expenses 0.45 1.24 0.77 0.12 0.01 -0.14 0.08 0.38
I050 Consumables 1.82 1.85 2.88 1.25 2.12 1.78 2.14 1.23
I055 Building & Accommodation 2.41 2.45 2.45 2.18 1.76 2.01 2.34 2.51
I060 Motor Vehicle Expenses 0.45 0.81 0.65 0.55 0.67 0.62 0.52 0.76
I065 Warranty Costs 0.00 0.00 0.00 0.00 0.00 0.00 0.00 0.00
EBITDA 5.47 -12.21 14.16 3.61 8.68 12.66 12.53 10.91
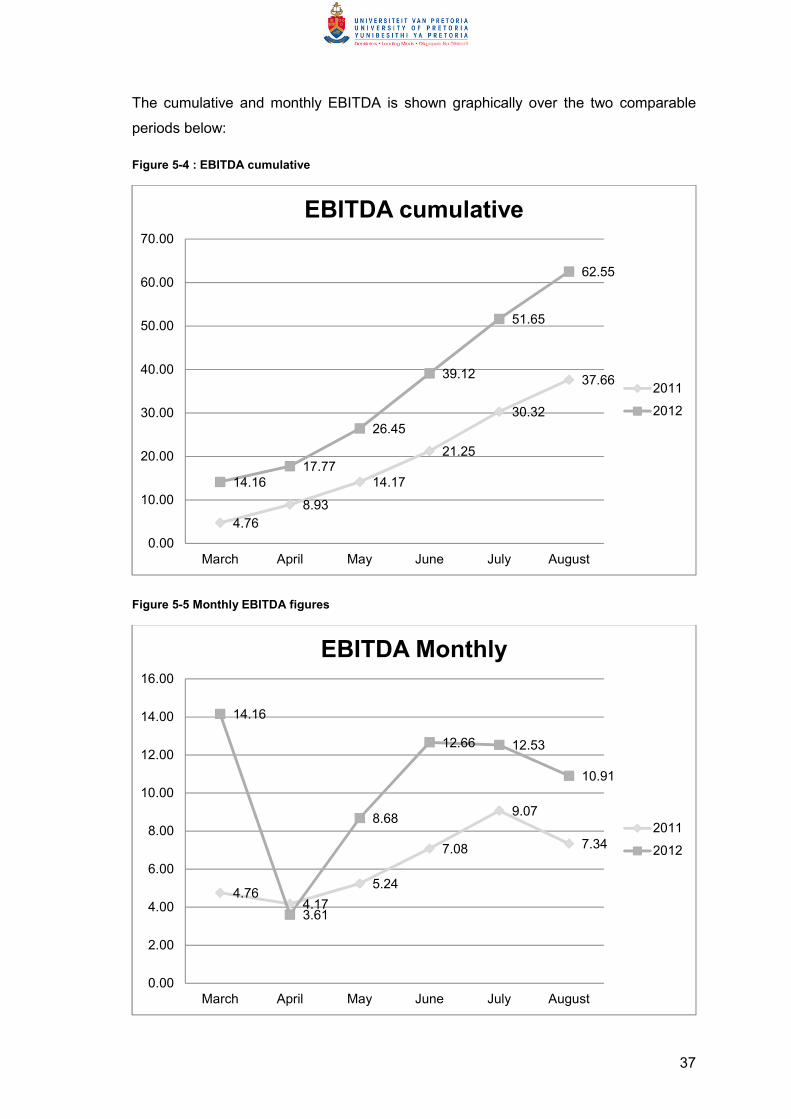
37
The cumulative and monthly EBITDA is shown graphically over the two comparable
periods below:
Figure 5-4 : EBITDA cumulative
Figure 5-5 Monthly EBITDA figures
4.76
8.93
14.17
21.25
30.32
37.66
14.16
17.77
26.45
39.12
51.65
62.55
0.00
10.00
20.00
30.00
40.00
50.00
60.00
70.00
March April May June July August
EBITDA cumulative
2011
2012
4.764.17
5.24
7.08
9.07
7.34
14.16
3.61
8.68
12.66 12.53
10.91
0.00
2.00
4.00
6.00
8.00
10.00
12.00
14.00
16.00
March April May June July August
EBITDA Monthly
2011
2012
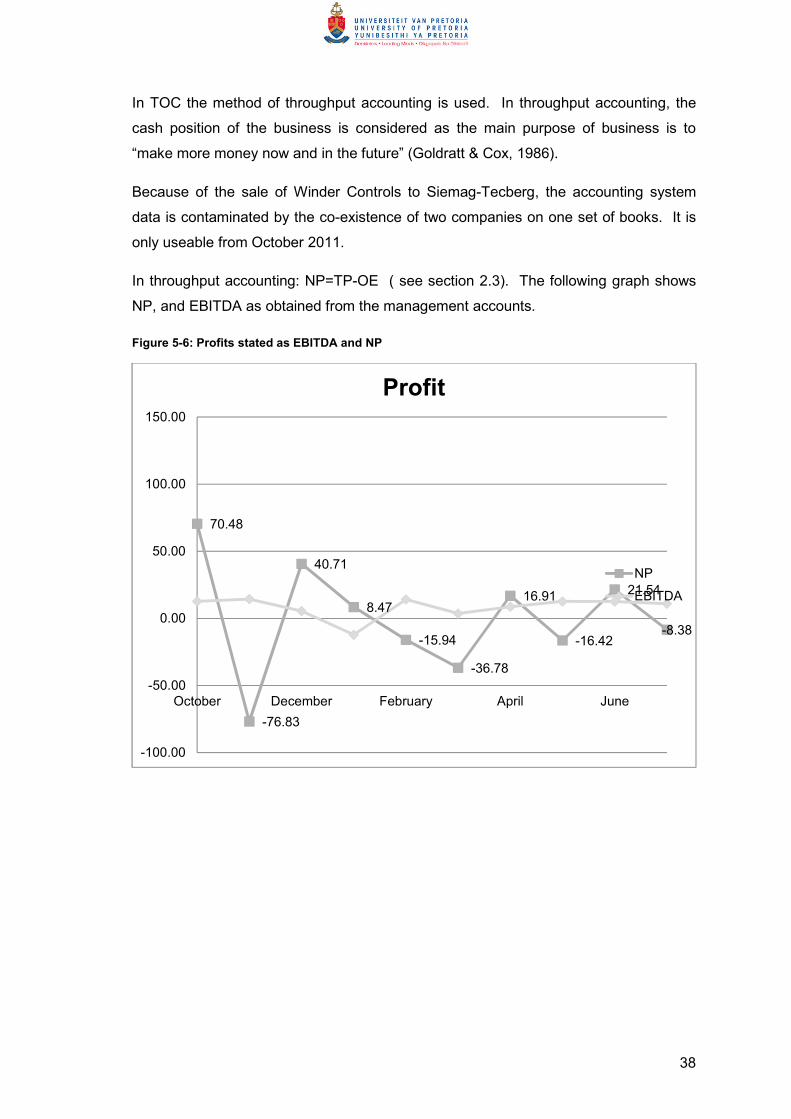
38
In TOC the method of throughput accounting is used. In throughput accounting, the
cash position of the business is considered as the main purpose of business is to
“make more money now and in the future” (Goldratt & Cox, 1986).
Because of the sale of Winder Controls to Siemag-Tecberg, the accounting system
data is contaminated by the co-existence of two companies on one set of books. It is
only useable from October 2011.
In throughput accounting: NP=TP-OE ( see section 2.3). The following graph shows
NP, and EBITDA as obtained from the management accounts.
Figure 5-6: Profits stated as EBITDA and NP
70.48
-76.83
40.71
8.47
-15.94
-36.78
16.91
-16.42
21.54
-8.38
-100.00
-50.00
0.00
50.00
100.00
150.00
October December February April June
Profit
NP
EBITDA
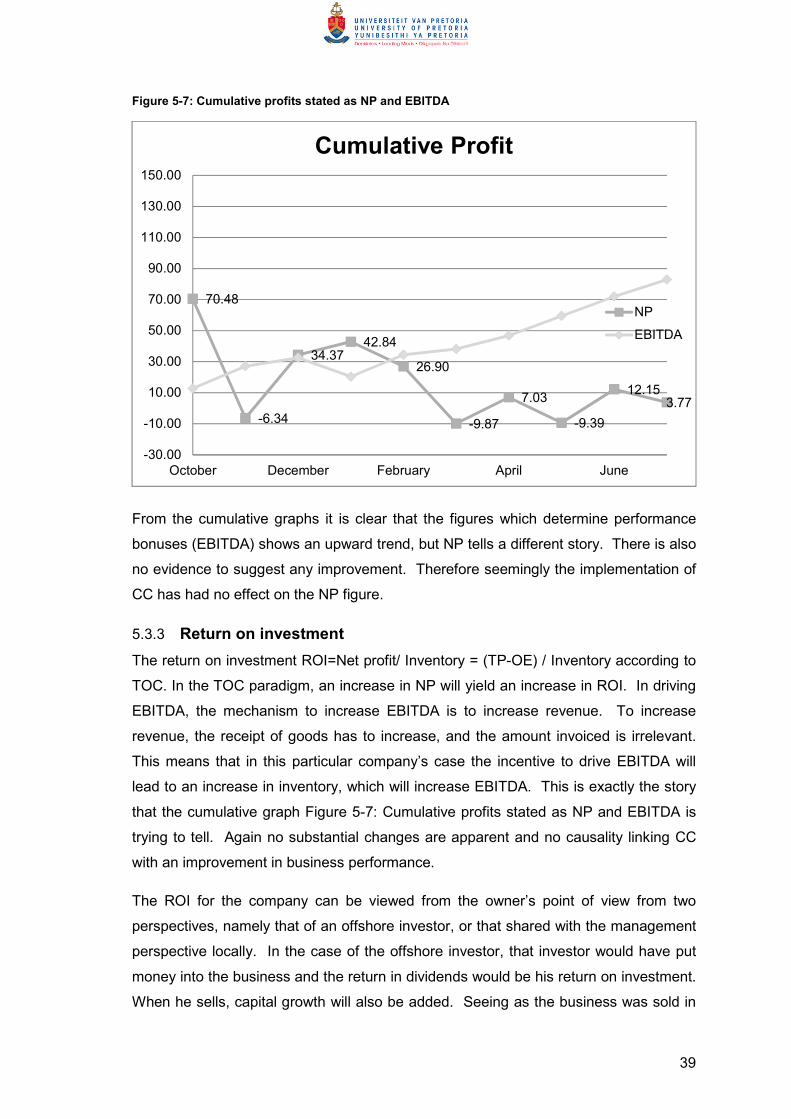
39
Figure 5-7: Cumulative profits stated as NP and EBITDA
From the cumulative graphs it is clear that the figures which determine performance
bonuses (EBITDA) shows an upward trend, but NP tells a different story. There is also
no evidence to suggest any improvement. Therefore seemingly the implementation of
CC has had no effect on the NP figure.
5.3.3 Return on investment
The return on investment ROI=Net profit/ Inventory = (TP-OE) / Inventory according to
TOC. In the TOC paradigm, an increase in NP will yield an increase in ROI. In driving
EBITDA, the mechanism to increase EBITDA is to increase revenue. To increase
revenue, the receipt of goods has to increase, and the amount invoiced is irrelevant.
This means that in this particular company’s case the incentive to drive EBITDA will
lead to an increase in inventory, which will increase EBITDA. This is exactly the story
that the cumulative graph Figure 5-7: Cumulative profits stated as NP and EBITDA is
trying to tell. Again no substantial changes are apparent and no causality linking CC
with an improvement in business performance.
The ROI for the company can be viewed from the owner’s point of view from two
perspectives, namely that of an offshore investor, or that shared with the management
perspective locally. In the case of the offshore investor, that investor would have put
money into the business and the return in dividends would be his return on investment.
When he sells, capital growth will also be added. Seeing as the business was sold in
70.48
-6.34
34.3742.84
26.90
-9.87
7.03
-9.39
12.153.77
-30.00
-10.00
10.00
30.00
50.00
70.00
90.00
110.00
130.00
150.00
October December February April June
Cumulative Profit
NP
EBITDA
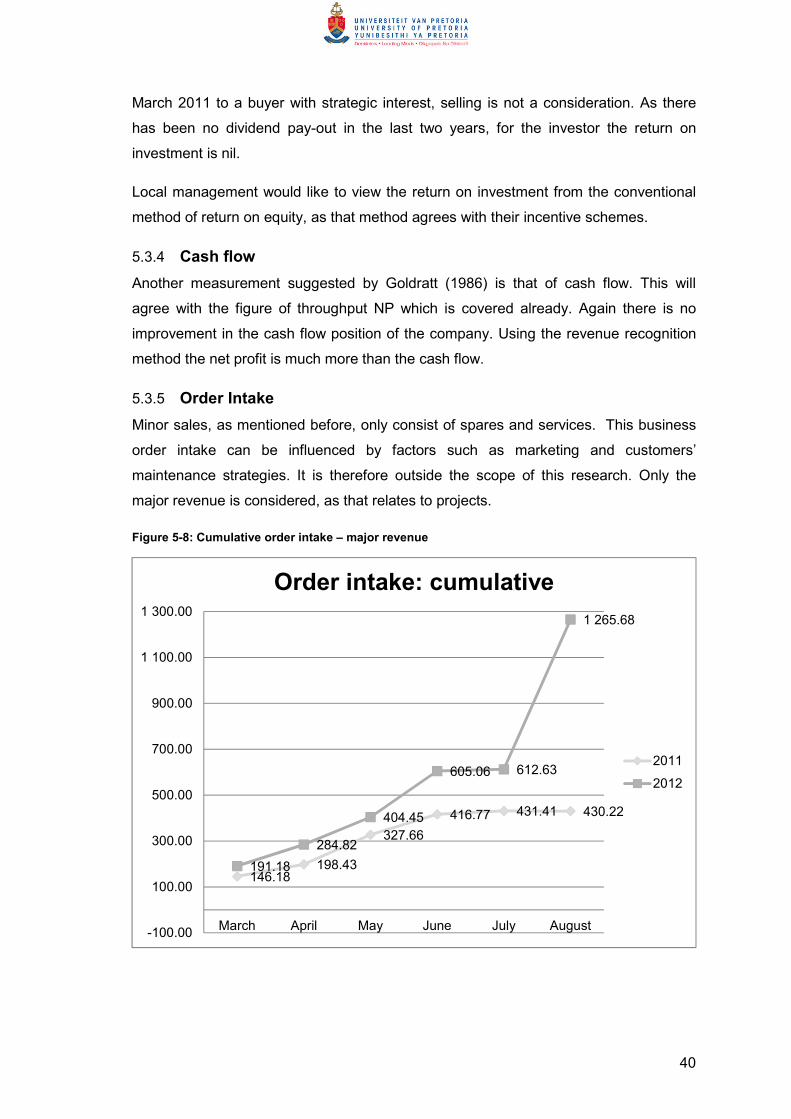
40
March 2011 to a buyer with strategic interest, selling is not a consideration. As there
has been no dividend pay-out in the last two years, for the investor the return on
investment is nil.
Local management would like to view the return on investment from the conventional
method of return on equity, as that method agrees with their incentive schemes.
5.3.4 Cash flow
Another measurement suggested by Goldratt (1986) is that of cash flow. This will
agree with the figure of throughput NP which is covered already. Again there is no
improvement in the cash flow position of the company. Using the revenue recognition
method the net profit is much more than the cash flow.
5.3.5 Order Intake
Minor sales, as mentioned before, only consist of spares and services. This business
order intake can be influenced by factors such as marketing and customers’
maintenance strategies. It is therefore outside the scope of this research. Only the
major revenue is considered, as that relates to projects.
Figure 5-8: Cumulative order intake – major revenue
146.18198.43
327.66
416.77 431.41 430.22
191.18
284.82
404.45
605.06 612.63
1 265.68
-100.00
100.00
300.00
500.00
700.00
900.00
1 100.00
1 300.00
March April May June July August
Order intake: cumulative
2011
2012
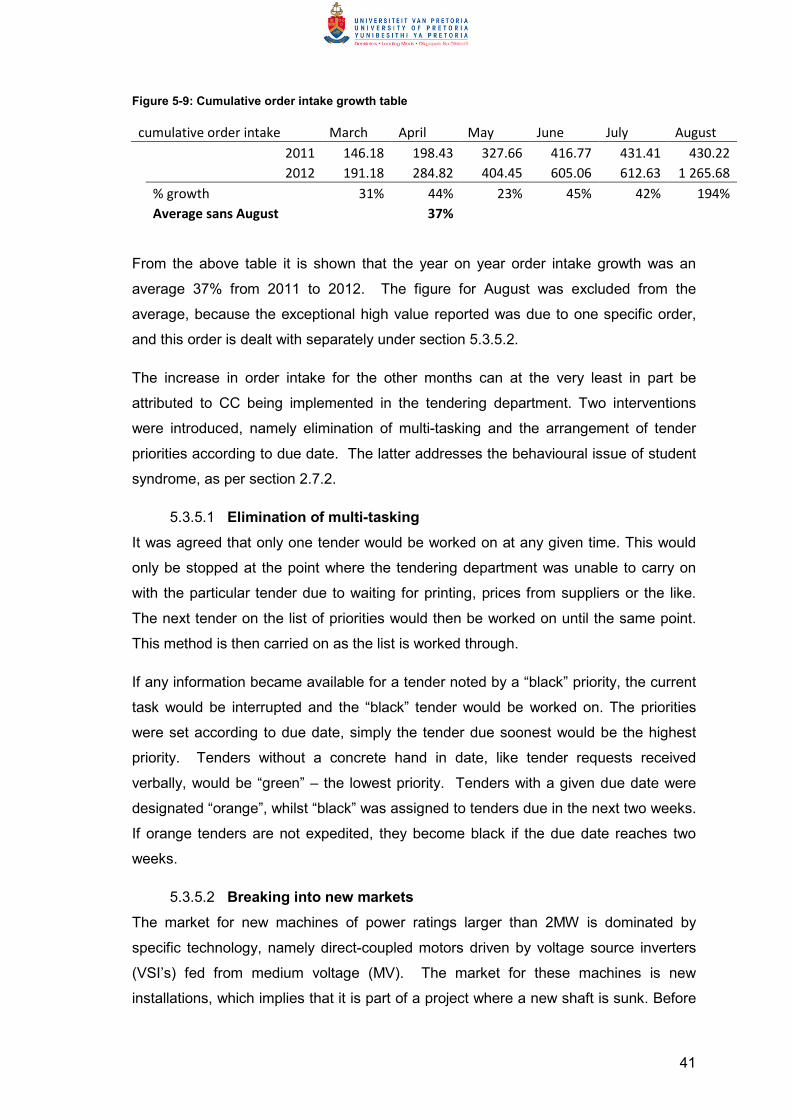
41
Figure 5-9: Cumulative order intake growth table
cumulative order intake March April May June July August
2011 146.18 198.43 327.66 416.77 431.41 430.22
2012 191.18 284.82 404.45 605.06 612.63 1 265.68
% growth 31% 44% 23% 45% 42% 194%
Average sans August 37%
From the above table it is shown that the year on year order intake growth was an
average 37% from 2011 to 2012. The figure for August was excluded from the
average, because the exceptional high value reported was due to one specific order,
and this order is dealt with separately under section 5.3.5.2.
The increase in order intake for the other months can at the very least in part be
attributed to CC being implemented in the tendering department. Two interventions
were introduced, namely elimination of multi-tasking and the arrangement of tender
priorities according to due date. The latter addresses the behavioural issue of student
syndrome, as per section 2.7.2.
5.3.5.1 Elimination of multi-tasking
It was agreed that only one tender would be worked on at any given time. This would
only be stopped at the point where the tendering department was unable to carry on
with the particular tender due to waiting for printing, prices from suppliers or the like.
The next tender on the list of priorities would then be worked on until the same point.
This method is then carried on as the list is worked through.
If any information became available for a tender noted by a “black” priority, the current
task would be interrupted and the “black” tender would be worked on. The priorities
were set according to due date, simply the tender due soonest would be the highest
priority. Tenders without a concrete hand in date, like tender requests received
verbally, would be “green” – the lowest priority. Tenders with a given due date were
designated “orange”, whilst “black” was assigned to tenders due in the next two weeks.
If orange tenders are not expedited, they become black if the due date reaches two
weeks.
5.3.5.2 Breaking into new markets
The market for new machines of power ratings larger than 2MW is dominated by
specific technology, namely direct-coupled motors driven by voltage source inverters
(VSI’s) fed from medium voltage (MV). The market for these machines is new
installations, which implies that it is part of a project where a new shaft is sunk. Before
42
June 2012, Winder Controls have been unsuccessful in selling a machine equipped
with a MV VSI. Projects that include new shafts would be, in addition to seeking the
lowest possible price, seeking shorter delivery times. Because of similar delivery
times, no competitor has a clear advantage over the other. However, because the
winders used for permanent operation is often installed during the sinking phase as
kibble winders – for example Impala 17 shaft (E. van Jaarsveld, personal
communication, September 2012). In this case delivery time becomes a clear
competitive advantage. If delivery time is excessively long, it becomes an order
disqualifier.
Winder Controls enjoys a long relationship with a supplier of this equipment, and
represents this supplier, TMIEC, in South Africa W.A. de Beer (personal
communication, November 2011). In the months preceding the August 2012 order,
three other projects were tendered involving this technology. Indications are that
Winder Controls will be successful in one of these (B de Leeuw, personal
communication, July 2012). The first two of these was used to establish a benchmark
in terms of market price. This feedback was given to the major supplier, TMEIC. As
their appetite grew, the supplier prices reduced.
At the time of the August order, price was merely an order qualifier – it had to reflect
market price, and therefore be within an acceptable range of three per cent to the next
competitor’s price. Delivery became the order winner, and TMEIC was approached to
improve their delivery time, which they agreed to. This proved to be successful, thus
supporting section 2.9.
Strategically this order was very important to Winder Controls, and caused much
celebration, because it concerns a medium voltage VSD drive and motor, a market
segment in which Winder Controls had not operated before and in which a reference
base has now been started. This has global benefits to the owners (I.M. Bailey,
personal communication, August 2012).
This reduction in suppliers’ lead time will ultimately reduce the overall project lead time,
as the drive motor is the single longest lead item on any project. Its lead time is longer
than all other suplly items, and determines the lead time of the supply portion of the
machine. This lead time for supply Ex Works (Japan) is typically twelve to fourteen
months, which was successfully negotiated down to ten months. A successful
reduction in this lead time, therefore will in future reduce overall project lead time.
43
5.4 Summary on business performance improvement
There was a definite improvement in order intake, and this improvement can be directly
attributed to the implementation of CC management practices. However, no
improvements in net profit, cash flow or return on investment were realised, when
viewed from the TOC throughput accounting. In TOC accounting only real cash items
are used in the calculation, including interest, tax, overheads and material cost. It
excludes depreciation and amortisation, and does not use revenue recognition to
determine sales.
Using conventional accounting based on revenue recognition, the evidence is not
convincing, either. Woeppel (2001) stated “I have NEVER seen an implementation
where the concepts were applied correctly and the organization didn’t see significant
bottom line results” (p.viii). To find out if this lack of financial improvement is caused
by CC not being implemented correctly; other evidence needs to be examined. It
needs to be determined whether CC was implemented correctly, and what other
factors were influenced the implementation.
5.5 Action research cycles
5.5.1 Implementing the five focussing steps
The first focussing step is to identify the bottleneck. At this point (20 February 2012)
the action research group consisted of the broad team identified in 5.1. The bottleneck
was agreed to be Engineering and Design. This definition was later refined to mean the
information output from Engineering and Design. The Engineering and Design
department provides circuit diagrams, bills of materials, manuals, and workshop
instructions. This information is required for all projects throughout the life cycle of all
open projects. Typically there are 45 projects open simultaneously, which implies a
significant amount of multi-tasking. The project life cycle is around eighteen months.
The unanimous identification of Engineering and Design as bottleneck was not
contested by Engineering and Design. The second focussing step is to exploit the
bottleneck, and actions were identified to achieve this. The first step in exploiting the
bottleneck entailed assessing the tasks performed by Engineering and Design to
establish if it was necessary to be done by Engineering and Design or whether it could
be offloaded to another department.
44
AG Willis (personal communication, February 2012) noted that in the past discussions
of this nature would have been met with fierce resistance and denial, and that it was
surprising to see cooperation from Engineering and Design. Mr Willis has been in
service of the company for a substantial amount of time and his opinion carries some
weight. It was also corroborated by B. Peel, also with more than twenty years’ service.
The action research group was now reconstructed to only include bottleneck
personnel, and a few others in order to gain focus. The group now consisted of the
engineering director, application engineer, contracts manager, special projects director
and managing director. The interventions were intended to follow the five focussing
steps, with the major focus on exploiting the bottleneck.
5.5.2 Interventions in the first cycle
Interventions were introduced proposed and the first cycle of the action research
commenced. The interventions named were:
• Implementation of E-Plan; and
• Offloading of QA (Quality Assurance)
5.5.2.1 Implementation of E-Plan
It was decided to implement E-Plan™ as the default drawing package for use by
Engineering and Design. The motivation was that the package would save
unnecessary time spent by Engineering and Design on items such as cross-
referencing and drawing up of cable schedules. Capital was approved and the
software acquired. Training commenced, but at the closure of the research in August
2012, E-Plan had still not been fully adapted as default drawing package, and an
estimated thirty per cent of projects were still not being done on E-Plan™. This
underpinned some resistance to change, as mentioned in section 5.7.3.
5.5.2.2 Offloading of QA
The process at the time required the engineer who ordered a specific item to also
inspect that item. This would be done on a daily basis where the engineer would
physically inspect items in the receiving are in the stores. He would then approve the
GRV, and the item would be approved for payment. However, a QA inspector was
present in the organisation, and the action research group decided that this particular
task could be done by the QA inspector. This intervention also failed, as engineers
carried on inspecting items in the store. After a small number of attempts by the QA
inspector the old system was re-instated, as engineers received queries from the QA
inspector and decided it would be quicker just to do it themselves.
45
5.5.3 Interventions during the second cycle
5.5.3.1 Outsourcing
At the commencement of the second cycle on 16 April 2012, it was decided to
introduce the following intervention: Outsourcing of drawing services to an appropriate
subcontractor. Some members had experience with two of these contractors, and
these contractors were able to do detail design when given the outline. This way the
load on Engineering and Design could be reduced as they only needed to provide an
outline.
5.5.3.2 Subordination
It was also decided to include a representative from Engineering and Design in the
morning production meeting. This would facilitate communication between
Engineering and Design and Production. This intervention is continuous and continued
to be in operation. The intention was to implement the focussing step of subordinating
to the constraint. The inverse happened as the bottleneck was now subordinated to
Production. Production is driven by management, who are incentivised on revenue
which is determined by cost and recoveries. In order to satisfy this, Production want to
be able to book all production time to jobs, as this drives revenue. Even working
overtime drives revenue. This means in their world idle time is catastrophic, whereas
TOC proved idle time is not detrimental unless it is the bottleneck spending time idling.
That further implies that Production will take a view on where they can keep busy, and
will request information on those particular jobs. This causes Engineering and Design
to drop what they are doing and answer that request – increasing mulit-tasking.
The reason for joining the Production meeting was to resolve queries that have arisen
in Production. These queries would be requests for copies of drawings, clarification on
circuit diagrams or mounting information. The intention was to reduce the interruptions
by production personnel. This in turn would reduce multi-tasking in the Engineering
and Design office.
5.5.4 Interventions during the third cycle
The third cycle commenced on 16 June 2012 and ended on 13 August 2012. The first
intervention planned was another attempt at offloading the bottleneck. This time it was
decided to delegate purchasing tasks to the estimator. The estimator is not fully
occupied and could upload the parts list for a design into the purchasing database.
This happened as planned and was in place when reported back on 13 August 2012.
46
It was also decided to equip the purchasing system software with a facility by which the
parts list could be uploaded in spread sheet format directly into the system. This did
not happen, mainly because the engineers kept on ordering material themselves.
5.6 Indentifying the primary contributing and inhibiting factors to
CC methodology implementation
5.6.1 Interruptions
Interruptions are explained by the group as the interruption of workflow in Engineering
and Design by breakdowns or other sudden shifts in priorities. This was cited at every
meeting.
These interruptions to Engineering and Design originate from various sources.
External sources are sources external to the company, like customers. Customers
often phone for information regarding a product that is thirty years old and now
requires a spare part. Engineering and Design has to furnish appropriate information
to sales for quoting purposes. Customers also phone in for technical support. As skills
levels diminish on the mines, customers phone in more regularly for support on
breakdowns. In order to maintain levels of customer satisfaction, breakdowns are dealt
with immediately. There is also the safety aspect, as the product is hoisting equipment
that transport men from underground workings in mines.
Internal interruptions originate from installation department requiring cable schedules,
manuals and software. Production will require information on the material assignments,
mounting instructions and circuit diagrams. Installation or commissioning engineers will
also call on Engineering and Design for technical support when confronted with
technical problems on site.
From this it is seen that the Engineering and Design department consists of specialised
knowledge regarding the products of the company, and this is perhaps the true product
of the company.
The interruptions were cited at every meeting as a hindrance and became the usual
rhetoric. Solid arguments were presented as to why these interruptions cannot be
eliminated: Installation sites would go on stop, miners would be trapped in shafts, and
the company would lose business.
47
Attempts to change processes and eliminate at least some of these interruptions, all
failed ultimately. After agreement was reached on an intervention, this would fail to be
implemented. For example it was agreed to outsource drawing services in order to
create more capacity. This was mentioned in cycle one, but at the end of cycle three
only one project had been outsourced, and only a comparatively small project.
From this evidence the primary inhibiter to the implementation of CC practices is
identified:
Resistance to change in a deeply embedded culture
This inhibitor was so prominent that in the time available for this research no other
contributing or inhibiting factors could be found. For action research to indicate more
factors change actually needs to occur. Because there was no change in financial
indicators, no change mentioned in the workgroups to ways of working, it is found that
the CC practices were not implemented due to the massive resistance to change.
5.6.2 Resistance to change
It comes as no surprise, that resistance to change is identified as an inhibiting factor.
Action research is a process to change organisations, and CC is a whole new
paradigm, so some resistance to change is to be expected. However, the
overwhelming resistance to change was not expected. In every single meeting
commitments were made to implement something, only to be re-committed at the next
meeting and never actioned.
5.6.2.1 Embedded culture – the bottleneck
The company was started in 1974. The engineering director has been with the
business since 1976 and has personally mentored the design engineer, which was part
of the action research group. He also held shares in the business until the sale to
Siemag-Tecberg in March 2011. The processes inside the company was well
documented, and formed part of the ISO9001 accredited QA system.
5.7 Learnings identified by the action research group
From the analysis of the learnings cited by the action research group during the
meetings, certain themes were identified. The first theme is identified in the response
to the question of whether the group thought CC was working by contributing to the
business.
48
5.7.1 Success of CC
The action research group expressed the unanimous opinion at every single meeting
that CC was working and contributing to the business. The expressions used referred
to emotive factors rather than facts, and could be viewed as telling management what
they wanted to hear. The evidence cited were:
Workshop hours: The amount of overtime hours worked by the workshop was
increasing. At the beginning of the year, no overtime was worked, whilst overtime was
worked every weekend during May. The deduction was made that it meant more
throughput from Engineering and Design, and therefore more throughput demand to
the workshop. The argument is technically flawed in the following areas: Firstly all
projects are late, therefore if information is available, the workshops will be inclined to
work overtime. Overtime is an extra income for the workers, and it is unlikely that
working overtime will be refused. Secondly, if projects were on time, workflow through
the system will ebb and flow. Idle time and apparent overload is to be expected, and of
no concern, but entirely normal.
Steelwork arriving after components: The standard practice in the period pre
implementation of CC was that an engineer would order the steelwork in the early
stages of the project design. This would be an estimate of the number of cubicles. As
he progresses with the design the engineer would then order the components that
need to be fitted in the cubicle. The result is that empty panels would occupy the
assembly area for weeks before the components would arrive. E-Plan designs
produce circuit diagrams, component lists and layout drawings. Production insisted to
work from layout drawings and this in turn forced engineering and design to produce
full sets of drawings, which included bills of material. The material, including cubicles,
were now ordered simultaneously, and herein is the solution to the observation. The
orders were now raised simultaneously, and the steelwork delivery was longer. This
led to components arriving before steelwork. The action research group’s observation
was correct, but it failed to prove any causal connection between CC and the
observation.
Gut feel: Twice it was cited in meetings that members in the group had a gut feeling
that CC is working and contributing to the company. This seemed to indicate a positive
attitude, but the evidence shows that CC is not working and it may be indicative of
passive resistance, or of good intentions.
49
From the evidence presented in this section ( 5.7.1 ) the secondary inhibiter to the
implementation of CC practices is identified:
The false perception that CC is working.
By secondary inhibiter, in this case, is meant a factor that supports the primary
inhibited identified. This is not to be confused with an inhibiter during the
implementation of CC, as it is proven above that CC was not implemented. This could
also be termed a passive form of resistance, as it will create the perception that CC is
being implemented, while no change can occur in the background.
5.7.2 Changes in behaviour
The group cited increases in sensitivity to disruptions that cause multi-tasking. The
group could name examples of behaviour changes like setting specific times aside for
mentoring, where previously this would be done on the basis of answering questions
from juniors on a continuous basis. The evidence was not convincing, though.
Another phrase that was mentioned at every single meeting, in some form was that the
reading material, The Goal (Goldratt & Cox, 1986) and Critical Chain (Goldratt E. M.,
1997) was thought provoking. But thought provoking as it may have been, evidence of
changes in behaviour was lacking. On the action research worksheet heading of
reflection, the question regarding recommendations to self for the next cycle was very
sparsely populated.
5.7.3 Implementation errors
The implementation of CC was not done correctly. In the first cycle, the group already
elevated the bottleneck. That is focussing step four. What was meant to have been
done is step two, exploitation. Introducing E-Plan™ did not install extra capacity, or
contribute towards the reduction of multi-tasking, as the exact opposite happened. The
additional burden of implementation on Engineering and Design caused more multi-
tasking in an attempt to learn new software.
The effect of this increase in multi-tasking led to an increase in workload in
Engineering and Design. This in turn contributed to more resistance to change. This
is then identified as the second secondary inhibitor to the implementation of CC:
Incorrect implementation of CC principles
A comment on the conclusion of the first cycle supports this – the Engineering Director
noted that there are too many things going on at the same time.
50
6 Summary of results
6.1 Inhibiting and contributing factors
The action research was conducted on the engineering and design department, after
identifying it as the bottleneck. After nine months and three action research cycles, no
implementation of CC in any meaningful form had occurred. The primary inhibiting
factor preventing CC implementation successfully identified is resistance to change in
a deeply embedded culture. The secondary factor identified that supported this
resistance to change, is the false perception that CC is working. It is possible that the
secondary factor is also a form of passive resistance.
One can speculate that in the environment of incentives and rewards to preserve and
maintain the status quo, resistance to change can manifest as passive resistance.
Passive resistance means that the resistance to change is not verbalised, but it
appears that co-operation is given. The reality is that there is no co-operation but
resistance instead. This passive resistance in turn can be applied in the form of telling
a manager what he would like to hear. This may have been interpreted as the false
perception that CC is working.
During the preparatory phase, discussed in chapter 5.2, theory was introduced. This
took the form of reading The Goal (Goldratt & Cox, 1986) and Critical Chain (Goldratt
E. M., 1997), and it was noted that the entire study group reacted positively to this
reading material. From the comments it is deduced that the factors that contributed
towards the general positive attitude towards CC are
• The books are written as novels with a storyline that is captivating
• The setting is familiar, making it easy to identify with the factory, the characters
and the problems.
The quality of the theoretical material in the form of the two novels, are thus viewed as
contributing factors to CC implementation.
The action research failed to answer conclusively the research questions as no
meaningful change was effected in the face of resistance to change. It does provide
some speculative contributing and inhibiting factors. The resistance to change must be
understood from the point of view of two drivers: embedded culture and remuneration
incentives.
51
6.1.1 Embedded culture
If a director has been in the position in excess of ten years, and has been doing the
same job for more than ten years, one can assume that some culture may be
embedded in the way of working and managing. If compounded by the fact that he has
been working for the same company since 1976, and that it was always in order to
work in a certain way, well some resistance to change may be experienced.
This director has also personally mentored the most senior applications engineer,
another participant in the action research group. This applications engineer began his
career at Winder Controls and has progressed from test technician to applications
engineer. It would be fair to assume that his behaviour, at least professional
behaviour, will be modelled on his mentor. This is enforced by the fact that his mentor
is well known in the industry and represents a legend to live up to. His mentor rightly
provides the model for behaviour, as Ashforth and Humphrey (1997) stated: “A major
task of senior management is to create and maintain a system of shared meanings to
provide a basis for coordinated behaviour”, p.46. No surprise, therefore, that his
embedded culture also presented resistance to change.
6.1.2 Remuneration motivation
The directors’ bonuses are based on a set value in Rands for every percentage point
of EBITDA as a percentage of sales. For this calculation the management accounts
are used, and this is driven from recognition of revenue and conventional accounting,
as opposed to throughput accounting. The bonus system is set by the shareholders
and they were not open to change of this system. As a result there is a reward for
driving revenue by driving up cost of material. Directors will also be penalised for
driving inventory down.
In light of the above, bringing about change is extremely difficult, as incentives are
against CC practices, and engineering and design gets by in its existing culture of
working, so there is no motivation to change. Kotter’s (1995) reason number one for
failure of transformation efforts, is “not creating a great enough sense of urgency”,
p.60. In this case management did not change reward structure, and Kotter observed
that unless at least 75% of the management is convinced that business as usual is
totally unacceptable, transformation efforts will fail.
6.1.3 Incorrect CC application
If one implements a focussing step out of sequence in the face of incentives against
change and a culture opposing CC, this will cause undesired results. These undesired
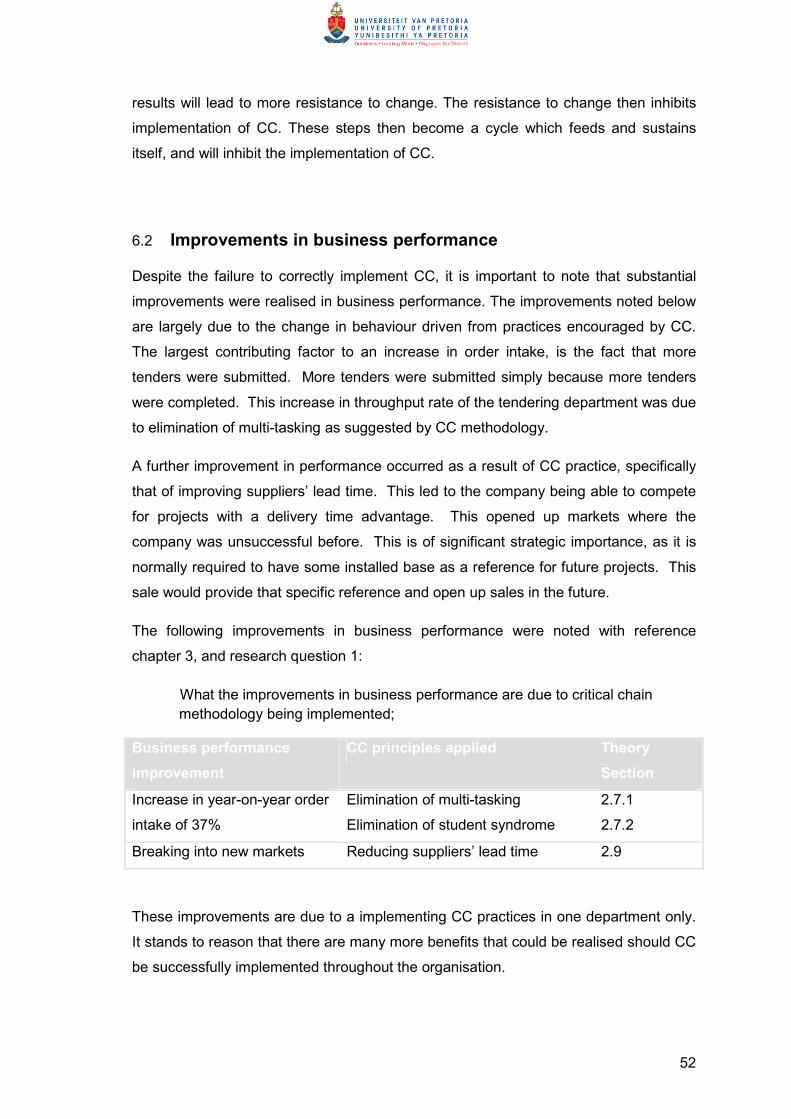
52
results will lead to more resistance to change. The resistance to change then inhibits
implementation of CC. These steps then become a cycle which feeds and sustains
itself, and will inhibit the implementation of CC.
6.2 Improvements in business performance
Despite the failure to correctly implement CC, it is important to note that substantial
improvements were realised in business performance. The improvements noted below
are largely due to the change in behaviour driven from practices encouraged by CC.
The largest contributing factor to an increase in order intake, is the fact that more
tenders were submitted. More tenders were submitted simply because more tenders
were completed. This increase in throughput rate of the tendering department was due
to elimination of multi-tasking as suggested by CC methodology.
A further improvement in performance occurred as a result of CC practice, specifically
that of improving suppliers’ lead time. This led to the company being able to compete
for projects with a delivery time advantage. This opened up markets where the
company was unsuccessful before. This is of significant strategic importance, as it is
normally required to have some installed base as a reference for future projects. This
sale would provide that specific reference and open up sales in the future.
The following improvements in business performance were noted with reference
chapter 3, and research question 1:
What the improvements in business performance are due to critical chain
methodology being implemented;
Business performance
improvement
CC principles applied Theory
Section
Increase in year-on-year order
intake of 37%
Elimination of multi-tasking
Elimination of student syndrome
2.7.1
2.7.2
Breaking into new markets Reducing suppliers’ lead time 2.9
These improvements are due to a implementing CC practices in one department only.
It stands to reason that there are many more benefits that could be realised should CC
be successfully implemented throughout the organisation.
53
7 Conclusion The research aimed to answer what improvements in business performance can be
expected from CC implementation, and secondly what the contributing and inhibiting
factors are to CC implementation.
7.1 Business performance
It is clear that the implementation of CC practices has achieved an improvement in
business performance by improving the order intake for projects, opening new
markets, and improving delivery times. The order intake showed a year on year
improvement of 37%, and this can be attributed to the implementation of CC
behaviours of:
• Elimination of multi-tasking
• Elimination of student syndrome
• Reducing suppliers’ lead time
These are all management practices suggested by Goldratt (1997) in Critical Chain.
Elimination of multi-tasking and elimination of student syndrome, led to an increase in
order intake, because more tenders are being generated. Market expansion was
driven by reducing suppliers’ lead time. The most significant decrease is reducing the
items with the longest lead, specifically drive motors. This leads to an overall reduction
in lead time, and opened up a strategic market to the company.
7.2 Contributing and inhibiting factors
It was found that resistance to change can inhibit the implementation of CC altogether.
This resistance to change can be supported by a deeply embedded culture, and
incentives that oppose CC, like bonus structures. If the implementation of CC seeks to
elevate before exploit, this will also contribute to the resistance to change.
Factors that will contribute to a successful implementation of CC practices, are centred
around the presentation of theory to the group. In this implementation it was found that
the novels The Goal (Goldratt & Cox, 1986) and Critical Chain (Goldratt E. M., 1997)
presented the theory in a captivating story which was familiar to the members of the
study group.
54
7.3 Suggestions for further research
The resistance to change in a company should be overcome before TOC or CC can be
implemented. In this instance action research was unsuccessful in the time available
and it is conceivable that with other interventions or extended time change may be
effected to a point where contributing and inhibiting factors can be measured. If
incentives are structured in accordance with CC, the resistance might be overcome. An
area for research is to restructure the incentives as the first intervention of action
research.
In the implementation some confusion occurred between two of the four focussing
steps, and a further area of research is what the level of comprehension of the
principles are in a typical manufacturing environment.
7.4 Implications to management
It is clear that implementation of CC is beneficial to an OEM executing multi-projects.
In this study, an increase in order intake was almost immediately apparent. Care must
be taken on the implementation of CC practices at the bottleneck.
Implementation of CC has to be done in the order of the focussing steps. Elevating
before exploiting will have the opposite effect of what is desired. Results have to be
measured against a goal that is very carefully engineered in order to prevent a false
sense of CC contributing to the business. Incorrect implementation and a false sense
of CC contributing will both contribute to resistance to change. Incentives need to be
structured to enable CC implementation. Incentives that reward the status quo will
lead to resistance to change.
55
7.5 Conclusion
Critical Chain methodology offers simple management practices that can be
implemented without cost of capital investment. These will cause significant gains in
business performance. Care must be taken to implement CC correctly, and follow the
focussing steps in sequence. Resistance to change will be the biggest obstacle, but
the rewards will be tangible and worthwile.
This study was not successful in satisfying its original purpose. However, positive
results for the company and the researcher was realised in the form of a greater
understanding of organisational change. Furthermore learning has taken place with
regards to CC and the philosophy of throughput accounting. The value of this learning
is invaluable in a business environment that becomes more competitive every day.
“I have NEVER seen an implementation where the concepts were applied correctly
and the organization didn’t see significant bottom line results” (Woeppel, 2001, p.viii).
56
8 References
What is Parkinson's Law definition and meaning. (2012, June 10). Retrieved from
Business Dictionary: http://www.businessdictionary.com/definition/Parkinson-s-
Law.html
Altrichter, H., Kemmis, S., McTaggart, R., & Zuber-Skerrit, O. (2002). The concept of
action research. The Learing Organisation, 9(3), 125-131.
Aoki, N., Ohta, S., Kikuchi, N., & Oishi, M. (2008, April). An introduction to the Theory
of Constraint and how it can be applied to medical management. The Physician
Executive, pp. 52-58.
Aryanezhad, M. B., Badri, S. A., & Komijan, A. R. (2010). Threshold-based method for
elevating the system's constraint under theory of constraints. International
Journal of Production Research, 5075-5087.
Ashforth, B. E., & Humphrey, R. H. (1997, January-February). The ubiquity and
potency of labelling in organizations. Organisation science, 8(1), 43-58.
Balakrishnan, J., & Cheng, C. H. (2000). Theory of constraints and linear
programming: a re-examination. International Journal of Production Research,
1459-1463.
Berry, R., & Smith, L. B. (2005). Conceptual foundations for the Theory of Constraints.
Human Systems Management, 83-94.
Best, W. D. (2006). Critical chain project management files. Industrial Engineer: IE,
38(11), 46-47.
Bhattacharya, A., Vasant, P., Sarkar, B., & Mukherjee, S. K. (2008). A fully fuzzified,
intelligent theory-of-constraints production-mix decision. International Journal of
Production Research, 46(3), 798-815.
Blackstone, J. H. (2001). Theory of constraints - a status report. International Journal
of Production Research, 1053-1080.
Blackstone, J. H., Cox, J. F., & Schleier, J. G. (2009). A tutorial on project
management from a theory of constraints perspective. International Journal of
Production Research, 7029-7046.
Butterfield, J. (2009). Using gounded theory and action research to raise attainment in,
and enjoyment of, reading. Educational Psychology in Practice, 25(4), 315-326.
doi:10.1080/020669360903315131
Coghlan, D., & Brannick, T. (2010). Doing action research in your own organization
(3rd ed.). London: SAGE Publications Ltd.
57
Cohen, I., Mandelbaum, A., & Shtub, A. (2004). Mulit-project scheduling and control: a
process-based comparitive study of the critical chain methodology and some
alternatives. Project Management Journal, 39-50.
Eigeles, D. (2003). Facililatating shared vision in the organization. Journal of European
Industrial Training, 27(5), 208-219.
Fox, R., & Goldratt, E. M. (1996). The race. New York: North River Press.
Goldratt, E. M. (1997). Critical chain. Pretoria: Avraham Y Goldratt institute.
Goldratt, E., & Cox, J. (1986). The goal: A process of ongoing improvement. (Revised,
Ed.) Croton-on-Hudson: North River Press.
Goldratt, R., & Weiss, N. (2005). Significant enhancement of academic achievement
through application of the Theory of Constraints. Human Systems
Management, 13-19.
Gupta, M., & Kline, J. (2008). Managing a community mental health agency: A Theory
of Constraints based framework. Total Quality Management & Business
Excellencce, 281-293.
Herroelen, W. (2005). Project scheduling - theory and practice. Production and
Operations Management, 413-432.
Herroelen, W., & Leus, R. (2001). On the merits and pitfalls of critical chain scheduling.
Journal of Operations Management, 19(5), 559-557.
doi:10.1016/S02726963(01)00054-7
Herroelen, W., & Leus, R. (2005). Identification and illumination of popular
misconceptions about project scheduling and time buffering in a resource
constrained environment. Journal of the Operational Research Society, 102-
109.
Herroelen, W., Leus, R., & Demeulemeester, E. (2002). Critical chain project
scheduling: do not oversimplify. Project Management Journal, 33(4), 48-60.
Hsu, P.-F., & Sun, M.-H. (2005). Using the Theory of Constraints to improve the
identification and solution of managerial problems. International Journal of
Management, 415-427.
Ioannou, G., & Papadoyiannis, C. (2004). Theory of constraints-based methodology for
effective ERP implementations. International Journal of Production Research,
42(23), 4927-4954.
Kotter, J. P. (1995). Leading change: Why transformation efforts fail. Harvard business
review, 59-67.
Lechler, T. G., Ronen, B., & Stohr, E. A. (2005). Critical chain: A new project
management paradigm or old wine in new bottles? Engineering Management
Journal, 49(4), 45-58.
58
Louw, L., & Page, D. C. (2004). Queuing network analysis approach for estimating the
sizes of the time buffers in theory of constraints-controlled production systems.
International Journal of Production Research, 1207-1226.
O'Brien, R. (1998). An overview of the methodological approach of action research.
Retrieved April 12, 2011, from http://www.web.net/robrien/papers/arfinal.html
Phillis, R., & Gumede, H. (2011). A case study on stoping shift buffering at Impala
Platinum: A crititcal chain project management perspective. The Journal of the
Southern African Institute of Mining and Metallurgy, 111, 793-799.
Rand, G. K. (2000). Critical chain: the theory of constraints applied to project
management. International Journal of Project Management, 173-177.
Robbins, W. A. (2011). Process improvement in the public sector: A case for the
Theory of Constraints. The Journal of Government Financial Management, 40-
46.
Robinson, H., & Richards, R. (2009). An introduction to critical change project
management. AACE International Transactions, PS.S03.1-11.
Rozenes, S., Vitner, G., & Spraggett, S. (2006). Project control: Literature review.
Project Management Journal, 37(4), 5-14.
Saunders, M., & Lewis, P. (2012). Doing research in business and management.
Edinburg Gate: Pearson.
Shore, B. (2008, December). Systematic biases and culture in project failures. Project
Management Journal, 39(4), 5-16. doi:10.1002/pmj.20083
Souren, R., Ahn, H., & Schmitz, C. (2005). Optimal product mix decisions based on
Theory of Constraints? Exposing rarely emphasized premises of Throughput
Accounting. International Journal of Production Research, 43(2), 361-374.
Spencer, M. S. (2000). Theory of constraints in a service application: the Swine
Graphics case. International Journal of Production Research, 1101-1108.
Steyn, H. (2001). An investigation into the fundamentals of critical chain project
scheduling. International Journal of Project Management, 19(6), 363-369.
doi:10.1016/S0263-7863(00)00026-0
Steyn, H. (2002). Project management applications of the theory of constraints beyond
critical chain scheduling. International Journal of Project Management, 75-80.
Stratton, R. (2011, December 28). Critical chain project management theory and
practice. POMS 20th Annual Conference.
Tibben-Lembke, R. S. (2009). Theory of constraints at UniCo: analysing The Goal as a
fictional case study. International Journal of Production Research, 1815-1834.
Trietsch, D. (2005). From management by constraints (MBC) to management by
criticalities (MBC II). Human Systems Management, 105-115.
59
Trietsch, D. (2005). Why a critical path by any other name would smell less sweet?
Project Management Journal, 36(1), 27-36.
Tsai, W. H., Lai, C. W., & Chang, J. C. (2007). An algorithm for the optimizing joint
products decision based on Theory of Constraints. International Journal of
Production Research, 45(15), 3421-3437.
Umble, M., Umble, E., & Murakami, S. (2006). Implementing theory of constraints in a
traditional Japanese manufacturing environment: the case of Hitachi Tool
Engineering. International Journal of Production Research, 44(10), 1863-1880.
Wang, J. Q., Sun, S. D., Si, S. B., & Yang, H. A. (2009). Theory of constraints product
mix optimisation based on immune algorithm. International Journal of
Production Research, 47(16), 4521-4543.
Wei, C.-C., Liu, P.-H., & Tsai, Y.-C. (2002). Resource-constrained project management
using enhanced theory of constraint. International Journal of Project
Management, 561-567.
Woeppel, M. J. (2001). Manufacturer's guide to implementing the theory of constraints.
Boca Raton: St Lucie Press.
Wu, S., Blos, M. F., Wee, H. M., & Chen, Y.-L. (2010). Can the Toyota way overcome
the recent Toyota setback - a study based on the Theory of Constraints.
Journal of Advanced Manufacturing Systems, 9(2), 145-156.
Wu, S., Wang, S., Blos, M. F., & Wee, H. M. (2007). Can the big 3 overtake Toyota - A
study based on the Theory of Constraints. Journal of Advanced Manufacturing
Systems, 145-157.
Yang, J.-B. (2007). How the critical chain scheduling method is working for
construction. Cost Engineering, 49(4), 25-32.
Youngman, K. Y. (2012). Production. Retrieved May 07, 2012, from A Guide to
Implementing the Theory of Constraints (TOC):
www.dbrfmfg.co.nz/Production.htm
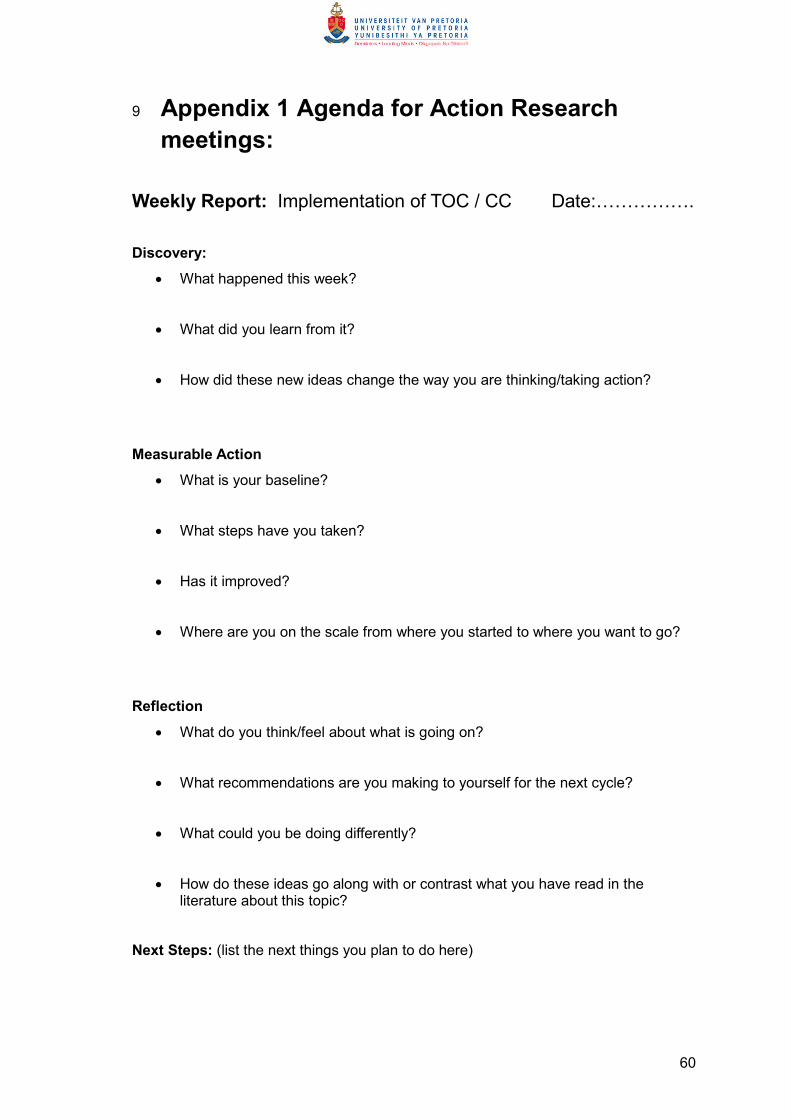
60
9 Appendix 1 Agenda for Action Research
meetings:
Weekly Report: Implementation of TOC / CC Date:55555.
Discovery:
• What happened this week?
• What did you learn from it?
• How did these new ideas change the way you are thinking/taking action?
Measurable Action
• What is your baseline?
• What steps have you taken?
• Has it improved?
• Where are you on the scale from where you started to where you want to go?
Reflection
• What do you think/feel about what is going on?
• What recommendations are you making to yourself for the next cycle?
• What could you be doing differently?
• How do these ideas go along with or contrast what you have read in the literature about this topic?
Next Steps: (list the next things you plan to do here)
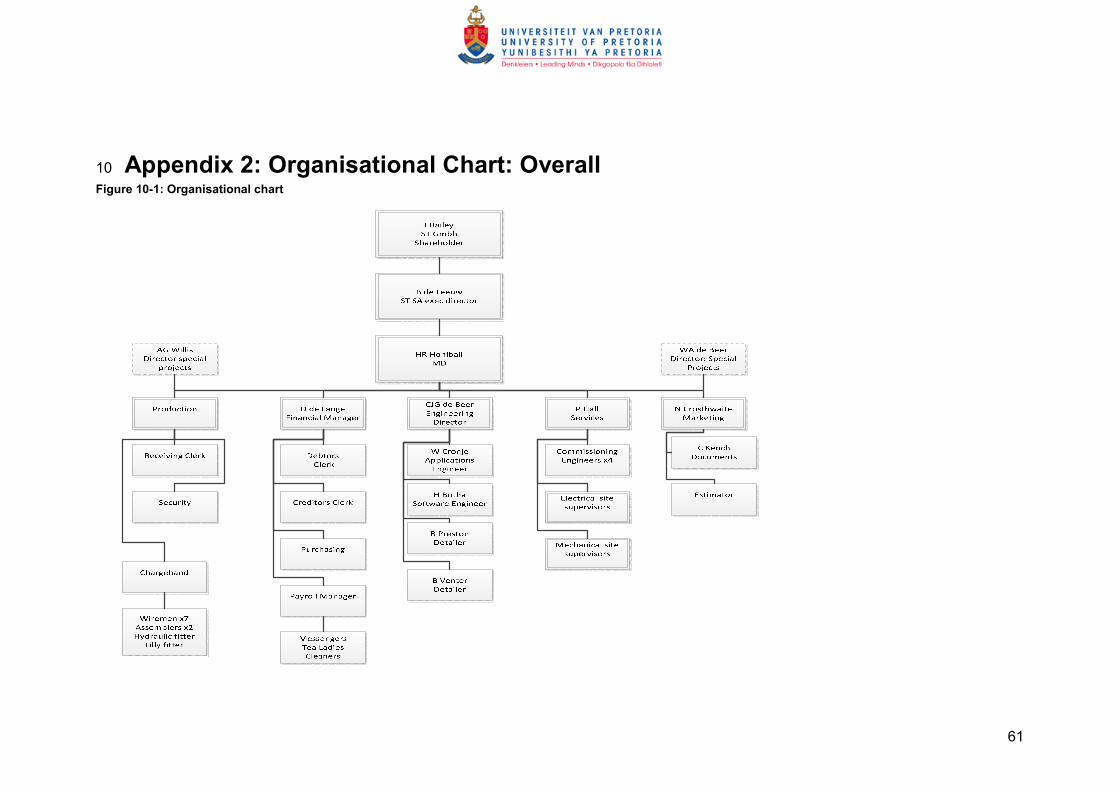
61
10 Appendix 2: Organisational Chart: Overall Figure 10-1: Organisational chart
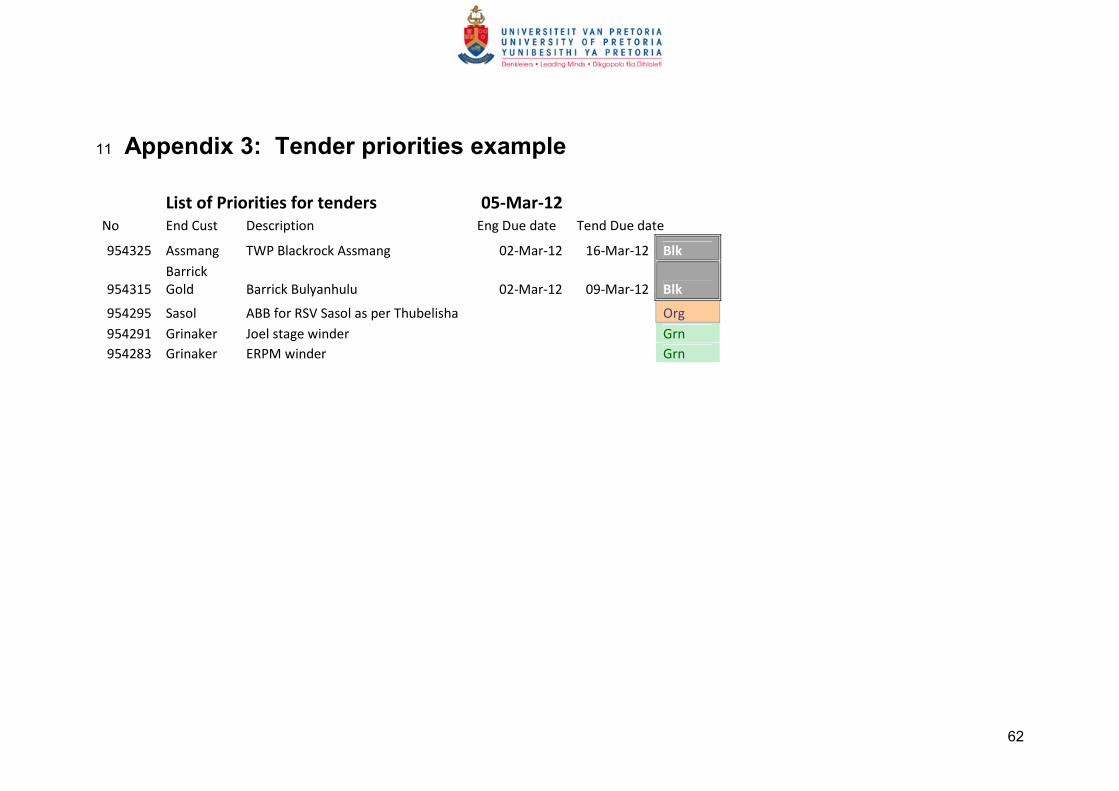
62
11 Appendix 3: Tender priorities example
List of Priorities for tenders 05-Mar-12 No End Cust Description Eng Due date Tend Due date
954325 Assmang TWP Blackrock Assmang 02-Mar-12 16-Mar-12 Blk
954315
Barrick
Gold Barrick Bulyanhulu 02-Mar-12 09-Mar-12 Blk
954295 Sasol ABB for RSV Sasol as per Thubelisha
Org
954291 Grinaker Joel stage winder
Grn
954283 Grinaker ERPM winder
Grn


![MULTI-SECTORAL NUTRITION IMPLEMENTATION PLAN… · [multi-sectoral nutrition implementation plan, results framework & ] ... also goes to the world bank, ... [multi-sectoral nutrition](https://img.pdfslide.us/doc/110x75/5b0d161f7f8b9a2f788d3170/multi-sectoral-nutrition-implementation-plan-multi-sectoral-nutrition-implementation.jpg)