Embed Size (px)
Citation preview
The Impacts of Incorrect SalesOrders on the Purchase OrderProcessing, ContinuousImprovement of the PurchaseProcess
Logistiikka
Maisterin tutkinnon tutkielma
Laura Jakobsson
2010
Liiketoiminnan teknologian laitos
HELSINGIN KAUPPAKORKEAKOULUHELSINKI SCHOOL OF ECONOMICS
HELSINGIN KAUPPAKORKEAKOULU
Logistiikka ja palvelutalous
The Impacts of Incorrect Sales Orders
on the Purchase Order Processing,
Continuous Improvement of the Purchase Process
Pro gradu -tutkielma
Laura Jakobsson
Hyväksytty liiketoiminnan teknologian laitoksella 19.03.2010 arvosanalla
_________________________________________________________
Markku Tinnilä Anu Bask

Helsinki School of Economics 12th March 2010
Department of Business Technology, Logistics
Master’s thesis
Laura Jakobsson
The Impacts of Incorrect Sales Orders on the Purchase Order Processing, Continuous Improvement of the Purchase Process
ABSTRACT
Today’s highly competitive market environment forces companies to improve their work
processes constantly leaving no room for errors. In order to improve customer satisfaction, it is a
necessity to improve process lead time and quality. In addition quality efforts improve the
bottom line and remain an important part in the continual quest for improving performance.
Effective continuous improvement of quality can help in locating areas of development and
implementing corrective and preventive actions to support the improvement of order correctness.
This study explores the impacts of incorrect sales orders on the purchase order process in a
global case organisation in the telecommunications industry. The focus was to find ways for the
case organisation to minimize the number of incorrect sales orders released for purchasing. The
objectives of the study aimed at describing the current situation to support decision-making,
identify the errors in the incorrect sales orders, find out the number of incorrect sales orders and
measure the lead time of handling the incorrect sales orders in the purchasing process.
The theoretical framework describes how to improve quality, operational performance, and
customer satisfaction by continuous improvement of internal processes, i.e. by minimizing the
order processing costs and improving internal order correctness. The theoretical section
introduces literature on Total Quality Management, Supply Chain Management, Process
Management, Continuous Improvement and Performance Measurement.
The empirical research was carried out as a case study by collecting error related data from sales
orders from 30th October to 31
st December 2009. Research material was also collected through
interviews, an inquiry and by participation-observation. The research results show that 33% of
the sales orders were incorrect during the data collection period. In addition the incorrect sales
orders lengthened the lead time of purchase order creation from the 1 day’s target to 3.2 days.
Even the clean orders’ purchase order creation lead time was 1.7 days, resulting from the
processing time spent on the incorrect sales orders with current resources. Based on the error
categorization and empirical data analysis, 33% of the errors are related to incorrect
configuration, and 40% of the errors could be eliminated by the case organisation itself.
Empirical findings present strong evidence that the sales order correctness quality is poor, the
impacts of incorrect sales orders show in extra work and costs of bad quality, and the process
requires improvement. A new quality control method was implemented as part of the continuous
improvement to improve the reporting of the errors and information flow quality.
The framework seems applicable for evaluating the implications of incorrect sales orders in the
purchase process of a telecommunications company and could be applied to other industries’
internal order correctness process performance improvement efforts as well. Finally,
management support is required to ensure that the empirical results are exploited in the
continuous efforts toward improvement.
Keywords: Continuous Improvement, Sales Order Correctness, Purchase Order Process, Quality
Total number of pages: 114

Helsingin kauppakorkeakoulu 12.3.2010
Liiketoiminnan teknologian laitos
Logistiikan pro gradu -tutkielma
Laura Jakobsson
Virheellisten myyntitilausten vaikutukset ostotilausten käsittelyyn, ostoprosessin jatkuva parantaminen
TIIVISTELMÄ
Koventunut kilpailu markkinoilla pakottaa yrityksiä jatkuvasti parantamaan prosessejaan.
Asiakastyytyväisyyden takaamiseksi on parannettava prosessin läpimenoaikaa ja laatua. Laadun
kehittäminen vaikuttaa yrityksen tulokseen ja on osa jatkuvaa suorituskyvyn parantamista.
Operatiivisen toiminnan laadun parantamiseksi tarvitaan toimintatapoja, joiden avulla yritys voi
tunnistaa potentiaalisia kehityskohteita sekä ottaa käyttöön korjaavia ja ennaltaehkäiseviä
keinoja, jotka tukevat myyntitilausten oikeellisuutta.
Tässä tutkimuksessa tarkasteltiin virheellisten myyntitilausten vaikutuksia oston prosesseihin
globaalissa telekommunikaation alalla toimivassa yrityksessä. Tutkielmassa selvitettiin keinoja
joilla esimerkkiyritys voisi vähentää ostettavaksi vapautettujen virheellisten myyntitilausten
lukumäärää. Nykyistä tilannetta kuvailtiin päätöksenteon tueksi, virheellisten myyntitilausten
tyypilliset virheet tunnistettiin sekä laskettiin virheellisten tilausten läpimenoaika
ostoprosessissa. Tätä tarkoitusta varten tutkimuksen teoreettinen viitekehys kuvaa miten
prosessien laatua, operatiivista suorituskykyä ja asiakastyytyväisyyttä voidaan kehittää
parantamalla yrityksen sisäisiä prosesseja tilauksenkäsittelyn kustannuksia vähentämällä ja
tilausten oikeellisuutta parantamalla. Teoreettinen osuus sisältää kirjallisuutta
kokonaisvaltaisesta laatujohtamisesta, tarjontaketjun hallinnasta, prosessijohtamisesta,
suorituskyvyn mittaamisesta ja parantamisesta sekä tiedonhallinnasta.
Empiirisen työn tehtävänä oli tarkastella esimerkkiorganisaatiota viitekehykseen valittujen
tekijöiden näkökulmasta. Tutkimuksen empiirinen osa tehtiin case-tutkimuksena keräämällä
myyntitilausten virheitä 30.10.–31.12.2009 välisenä aikana. Aineistoa kerättiin myös
haastattelujen, kyselyn ja osallistuvan havainnoinnin avulla. Tulokset osoittavat, että
tarkastelujakson aikana 33 % myyntitilauksista oli virheellisiä. Virheelliset tilaukset pidensivät
ostotilausten luomisen läpimenoaikaa yhden päivän tavoitteesta 3,2 päivään. Jopa virheettömien
ostotilausten läpimenoaika oli 1,7 päivää, mikä tulkittiin seuraukseksi virheellisten tilausten
käsittelystä nykyisillä resursseilla. Virheluokituksen ja empiirisen tutkimuksen perusteella
selvisi, että 33 % virheistä liittyy virheelliseen konfiguraatioon tilauksella, sekä että 40 %
virheistä voitaisiin välttää esimerkkiorganisaation toimesta. Tutkimuksen tulokset osoittavat, että
tilausten oikeellisuuden laatu on heikko ja että virheellisten ostotilausten vaikutukset näkyvät
ylimääräisenä työnä ja huonon laadun kustannuksina. Osana jatkuvaa parantamista uusi
laadunvalvontamenetelmä otettiin käyttöön esimerkkiorganisaatiossa virheiden raportoinnin ja
tiedonkulun parantamiseksi.
Tutkimuksen viitekehys todettiin toimivaksi havainnollistamaan virheellisten tilausten
vaikutuksia ostoprosessissa sekä riittävän yleiseksi soveltuakseen myös muiden toimialoilla.
Lopuksi, johdon tukea tarvitaan empiiristen tulosten hyödyntämiseksi jatkuvassa kehitystyössä
sekä organisaation sitouttamiseksi toimimaan uusien toimintatapojen mukaisesti.
Avainsanat: jatkuva parantaminen, laatu, tilauksen oikeellisuus, ostotilausprosessi
Sivujen lukumäärä (liitteineen): 114

The Impacts of Incorrect Sales Orders on the Purchase Order Processing List of Contents
Abstract
Tiivistelmä
List of Figures
List of Tables
List of Appendixes
1 INTRODUCTION ...................................................................................................................... 6
1.1 Research Problem and Objectives ..................................................................................... 9
1.2 Research Approach and Methodology ............................................................................ 11
1.3 Structure of the Study ...................................................................................................... 13
1.4 Terminology and Abbreviations ..................................................................................... 14
2 QUALITY IN THE ORDER-DELIVERY LOGISTIC PROCESS ......................................... 16
2.1 The Concept of Total Quality Management .................................................................... 18
2.1.1 Customer Focus ................................................................................................. 20
2.1.2 Participation and Teamwork .............................................................................. 21
2.1.3 Process Focus with Continuous Improvement ................................................... 22
2.2 Key Issues of Supply Chain Management ...................................................................... 23
2.3 Process Management ....................................................................................................... 26
2.3.1 Order Processing and Purchasing Management ................................................ 29
2.3.2 Cost and Lead Time Minimization .................................................................... 30
3 PERFORMANCE MEASUREMENT AND IMPROVEMENT ............................................. 32
3.1 Value of Information ....................................................................................................... 34
3.2 Designing an Effective Performance Measurement System ........................................... 36
3.3 Analyzing and Using Performance Data to Create Quality Control ............................... 38
3.4 Continuous Improvement ................................................................................................ 40
3.4.1 Kaizen, the Process of Gradual and Incremental Improvement ........................ 41
3.4.2 PDCA Cycle, Connection between Productivity and Quality Improvement ..... 43
3.4.3 Quality Cost Information ................................................................................... 44
3.4.4 Root Cause Analysis, a Tool for Problem Solving ............................................ 47
3.4.5 Six Sigma ........................................................................................................... 49
4 CONTINUOUS IMPROVEMENT OF THE PURCHASE PROCESS ................................... 51
5 CURRENT PRACTICES IN THE CASE ORGANISATION................................................. 52
5.1 The Case Organisation in a Nutshell ............................................................................... 52
5.2 Global Order Process for 3rd Party Products ................................................................... 54
5.3 Purchase Order Creation ................................................................................................. 59
5.4 Current State in the Case Organisation ........................................................................... 62
5.4.1 Complex and Long Process ................................................................................ 62
5.4.2 Unbalanced Workload and Working Resources ................................................ 64
5.4.3 Discussion of the Possible Root Causes of the Incorrect Sales Orders .............. 65
6 THE EMPIRICAL CASE STUDY: EXPLORING THE IMPACTS OF INCORRECT
SALES ORDERS ON THE PURCHASE ORDER PROCESSING ........................................ 68
6.1 Errors from the Buyers’ Perspective ............................................................................... 70
6.2 Identification of Errors .................................................................................................... 73
6.3 Error Handling Processes per Error Category, the Case Examples ................................ 75
6.3.1 Case: Site Installation Address Missing, LT 1-4 Days ...................................... 76
6.3.2 Case: Delivery Address Incorrect, LT 3 Days ................................................... 76
6.3.3 Case: Obsolete Item and Site Installation Address Missing, LT 16 Days ......... 77
6.3.4 Case: Incorrect Plant, LT 5 Days ....................................................................... 78
6.3.5 Case: Vendor Quotation Missing and Purchasing Data not Open, LT 4 Days .. 79
6.4 Empirical Results of Data Collection .............................................................................. 80
6.4.1 Research Limitations of Data Collection ........................................................... 80
6.4.2 The Number and Proportion of Incorrect Sales Orders ..................................... 81
6.4.3 Incorrect Sales Orders per Error Category ......................................................... 83
6.4.4 Impact of Incorrect Sales Orders on the Purchase Order Creation Lead Time .. 85
6.4.5 Review of Order Correctness’ Sigma Level ...................................................... 88
7 RESEARCH FINDINGS AND CONCLUSIONS ................................................................... 89
7.1 Theoretical Findings ........................................................................................................ 89
7.2 Empirical Findings and Managerial Implications ........................................................... 92
7.2.1 Root Cause Analysis .......................................................................................... 93
7.2.2 Check-List for the LCs to Prevent the Eliminable Errors .................................. 94
7.2.3 New Quality Control Method............................................................................. 95
7.2.4 Cost Analysis of Incorrect Sales Orders in the Process ..................................... 97
7.3 Other Observations .......................................................................................................... 98
8 DISCUSSION ......................................................................................................................... 100
8.1 Research Progress and Contribution ............................................................................. 101
8.2 Suggestions for Future Research ................................................................................... 104
References
List of Figures
Figure 1-1 Research ProblemApproach ........................................................................................ 10
Figure 2-1 The Principles of Total Quality (Evans & Lindsay 2005, 23) .................................... 19
Figure 2-2 Total Quality Management (Lecklin 2006, 19) ........................................................... 20
Figure 2-3 Supply Chain Business Processes (Cooper et al. 1997, 10) ........................................ 25
Figure 2-4 The Order Cycle (Christopher 1998, 158) .................................................................. 30
Figure 3-1 The Deming Cycle (Evans & Lindsay 2005, 636) ...................................................... 44
Figure 3-2 The Costs of Quality ................................................................................................... 46
Figure 3-3 The Quality Costs Model (Weele 2005, 194) ............................................................. 47
Figure 4-1 A Research Framework of the Factors Impacting Continuous Improvement ............. 51
Figure 5-1 Global Order Process for 3rd Party OEM Products ..................................................... 55
Figure 5-2 The LC’s and the Buyer’s Order Processing Target Times in the Process Flow ........ 61
Figure 6-1 The Most Common Error Notice Points ..................................................................... 73
Figure 6-2 Error Classification ..................................................................................................... 74
Figure 6-3 The Number and Proportion of Incorrect Sales Orders ............................................... 82
Figure 6-4 The Number and Proportion of Incorrect Sales Orders per Region ............................ 83
Figure 6-5 Incorrect Sales Orders per Error Category .................................................................. 84
Figure 6-6 Averaged Purchase Order Creation Lead Time in Days ............................................. 86
Figure 6-7 Averaged Lead Time of Purchase Order Creation per Error Category ....................... 87
List of Tables
Table 6-1 The Most Common Errors per Error Category ............................................................. 85
Table 6-2 The Averaged Lead Times and Standard Deviations ................................................... 86
Table 6-3 Sigma Levels per Period ............................................................................................... 88
Table 7-1 Root Cause Analysis ..................................................................................................... 94
Table 7-2 Impacts of Errors by Error Notice Point, Error Category and Related Costs ............... 97
List of Appendixes
Appendix 1 Questions of the Inquiry for Buyers ........................................................................ 110
Appendix 2 Incorrect Hardware Related Sales Orders in 2009, (case company intranet, 2009) 111
Appendix 3 Purchase Order Creation in the Case Organisation ................................................. 113
Appendix 4 New Order Status Excel Template, Error Follow-Up Tool ..................................... 114
6
1 Introduction
Where business growth has slowed down and competition increased, attention has turned to the
challenge of managing companies more efficiently and effectively to meet the pressures of
profitability. Today’s highly competitive market environment forces companies to improve their
work processes constantly leaving no room for errors. On one hand, companies want to achieve
business growth. On the other hand, there is a vital need to reduce costs and to boost
productivity. To be able to grow a company can only compete in terms of productivity and costs.
If it can reduce its costs and maintain excellent quality, it can do better than its competitors.
Therefore quality should be integrated into all activities of the business and work processes. The
principles of quality have become a standard part of routine management practices. However,
without a conscious focus on improving quality, it is easily slipped from view as a short-term fix
and takes second place to economic pressures. After all, quality efforts improve the bottom line
of a company and are an important part in the continuous quest for improving performance.
Process quality and customer satisfaction can be perceived as important operational measures of
any company. If a company seeks to improve customer satisfaction, it is a necessity to improve
process lead time and quality. Customers require complete and accurate deliveries to take place
exactly as ordered. In general, companies are streamlining their supply chains in order to become
more responsive, cost-effective and capable of delivering high-quality products and services to
customers in a consistent manner. As Christopher (1998, 9) puts it, customers in all industries
seek greater responsiveness and reliability from suppliers; they are looking for reduced lead
times and value-added services that enable them to serve their customers better. The needs of
customers are satisfied through the coordination of the material and information flows that
extend from the marketplace through the company and its operations and beyond that to
suppliers.
In a highly competitive, global marketplace the pressure on organisations to find new ways to
create and deliver value to customers grows ever stronger. In the telecommunications industry
supply chain agility is considered a basic competitive requirement, not any sustainable
differentiation opportunity. During the recent years the industry has been characterized by
frequent market changes and varying, unique customer requirements of large operators (Collin
and Lorenzin 2006, 419).
7
How does a company achieve good customer satisfaction along with efficiency in supply chain
management? According to Heikkilä (2002, 747) good relationships between the customer and
the supplier contribute to reliable information flows, and reliable demand information flows in
turn contribute to high efficiency. These are well-researched issues in several industry
environments. But in a fast-changing systems business such as the telecommunications industry,
the suppliers need to be able to adapt its offering to a wide variety of customer situations and
needs. Understanding the customer’s situation and needs combined with the right offering
contributes to good co-operation in improving the joint demand chain, which further leads to
superior demand chain efficiency and high customer satisfaction.
Due to the increased competition and stringent customer requirements, continuous improvement
has to be an integral part of the working processes. Continuous improvement efforts are targeted
at all the major performance categories, including cost, quality, cycle time and delivery
performance. In these circumstances it is crucial to do things right the first time, because every
error leads to time loss and extra costs. Long lead times incur costs for the process. In evaluating
the total costs of a process, all the real costs of the process should be taken account in the
decision-making.
This thesis was carried out as an assignment for a case company that is a leading network
equipment manufacturer in the telecommunications industry. The case company is planning to
grow its business by streamlining the organisation and accelerating decision-making. The biggest
challenge is to turn the net sales into growth. The organisation needs to be altered to serve
customers better than before. According to the CEO of the case company, it is now time to move
on from the strategy of focusing on profitability and cash and to drive really for growth in order
to increase the market share (Sajari 2009, 9). After these comes the objective to prioritise cost
leadership. The CEO of the case company sent a letter in January 2010 to all employees, stating
that all tasks done must follow three key principles:
- Customer-driven focus and outside-in thinking
- Speed and simplified ways of working
- Empowerment, responsibility and accountability.
The research problem and the objectives of this study can be derived from these perspectives,
because the current state at the case organisation is far from these three principles. Selling
systems with varying hardware and software content to customers is a challenge which has
8
entailed numerous errors to the organisation’s internal order-delivery processes. Consequently
there is a high occurrence of errors in the sales orders and this has major impacts on process
performance both upstream and downstream. The good quality of a sales order is important in
creating a correct purchase order for the supplier quickly and in minimizing the lead time. In
complex order-delivery processes with long supply chain a little error at the front-end can cause
a tremendous disaster if it goes through the pipeline and is revealed in the back-end where fixing
the error is complicated, frustrating and costly.
In the case of a big global organisation the long operative working processes are difficult to
control, which leads to easily expanding problems with errors in the process. Therefore the
impacts of errors are difficult to estimate. In addition, the organisation springs up self-
reconstructive processes which make it even more challenging to explore the total impacts.
Because of the complexity and the length of the process in a supply chain, especially the costs of
bad quality are difficult to define. Some figures can easily be formed, but eventually some
factors might be estimated misleadingly and therefore measurements fall flat.
There are several reasons for the challenges in the case organisation that bring about incorrect
sales orders. In general level the followings can be mentioned: high number of suppliers, fast-
developing and changing products, products with short life cycles, products with complicated
configurations, globally done work in the process in several different time zones, long supply
chain and processes from customer to third party supplier and back to customer, as well as a fast-
growing market environment. In addition, the number of orders has increased 150% during the
past two years without any investments on working resources. The business has increased
heavily and it is still growing very strongly and therefore the supply chain needs a lot of
development.
This thesis research is targeted at this gap. The purpose is to identify and explore where the case
organisation functioning in the telecommunications industry currently is and what could be
improved in order to achieve the three principles mentioned by the CEO of the case company.
Therefore, the objective of the study is to build a framework for the continuous improvement of
the purchase process and order correctness performance by exploring the impacts of incorrect
sales orders on the purchase order handling process. A more detailed coverage about the research
problem, including the approach and limitations can be found in the following Chapters 1.1 and
1.2.
9
1.1 Research Problem and Objectives
Studying the impact of incorrect sales orders on the internal process performance has not been
the focus of previous research, but it is nevertheless justified as intuitive statements exist that
link process quality to customer satisfaction and cost-effectiveness. It can be stated that by
improving the process and order quality it is possible to gain time and cost savings. Better
process and order quality improves lead times and the added value gained improves customer
satisfaction. Internally all these factors together will lead to better resource utilization and
minimization of extra work.
In order to create a correct purchase order from the purchase requisition of a sales order and send
it to a supplier for further processing, the information and requirements of the sales order have to
be correct. If the sales order is incorrect although released for purchasing, the missing or
incorrect information has to be found and fixed. The ultimate goal is that the errors caused by the
case company’s internal problems do not reach the supplier. Moreover, from the viewpoint of the
Purchasing team, the sales orders should be correctly entered in the ERP system in the beginning
of the process, or at least at the point when the Logistics Coordinator releases the sales order for
the Buyer.
This research is relevant in the case organisation because currently the lead time of processing
the sales orders to create a purchase order is too long. This is because a lot of time and thus costs
are wasted on correcting, checking, asking and waiting for information and doing same actions
for several times. By improving the quality of sales orders and thus minimizing the order
processing lead time, the case organisation can improve customer satisfaction, resource
utilization, inventory levels, clarity to invoices, time from quote-to-cash and supplier
relationships.
The main research problem of the study is how the case organisation could improve its
practices to minimize the number of incorrect sales orders released for purchasing and the time
spent on processing them. In more detail, the research problem can be described as follows:
10
• What is the number of incorrect sales orders released for purchasing that require
processing?
• What are the error types of incorrect sales orders?
• How are the incorrect orders processed in order to create clean purchase orders?
• What are the time and costs related to handling incorrect sales orders in the purchasing
process?
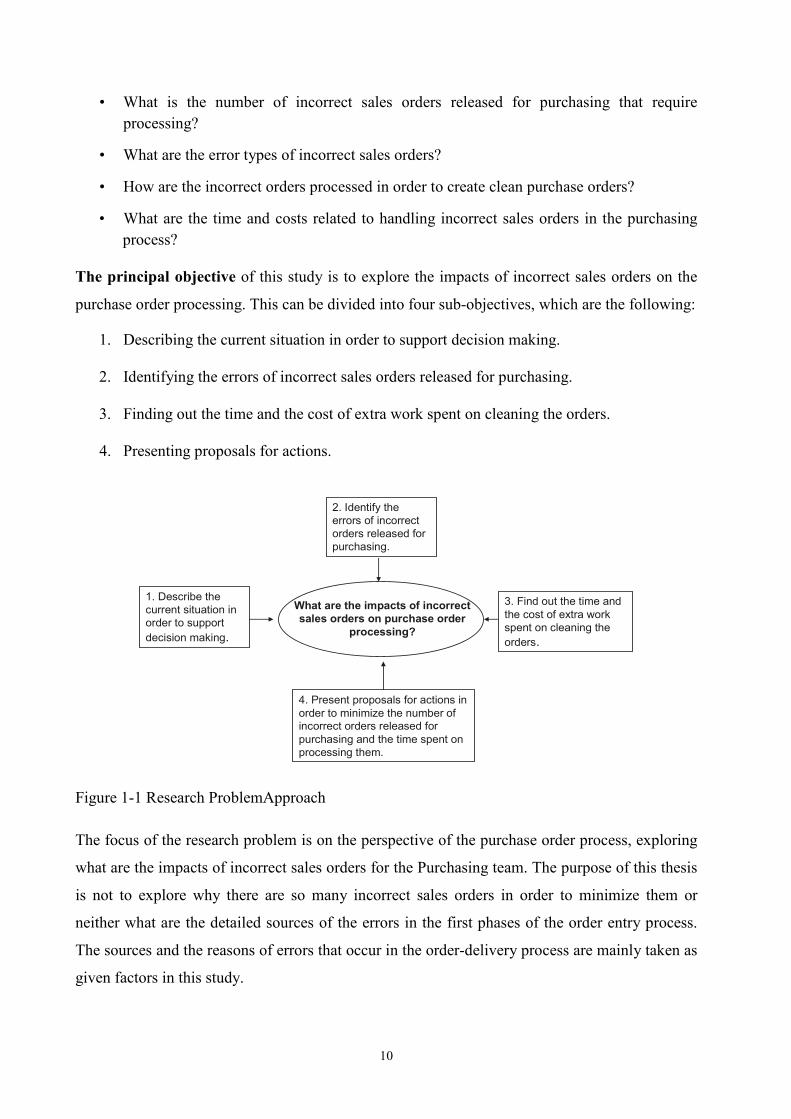
The principal objective of this study is to explore the impacts of incorrect sales orders on the
purchase order processing. This can be divided into four sub-objectives, which are the following:
1. Describing the current situation in order to support decision making.
2. Identifying the errors of incorrect sales orders released for purchasing.
3. Finding out the time and the cost of extra work spent on cleaning the orders.
4. Presenting proposals for actions.
1. Describe the
current situation in
order to support
decision making.
2. Identify the
errors of incorrect
orders released for
purchasing.
3. Find out the time and
the cost of extra work
spent on cleaning the
orders.
4. Present proposals for actions in
order to minimize the number of
incorrect orders released for
purchasing and the time spent on
processing them.
What are the impacts of incorrect
sales orders on purchase order
processing?
Figure 1-1 Research ProblemApproach
The focus of the research problem is on the perspective of the purchase order process, exploring
what are the impacts of incorrect sales orders for the Purchasing team. The purpose of this thesis
is not to explore why there are so many incorrect sales orders in order to minimize them or
neither what are the detailed sources of the errors in the first phases of the order entry process.
The sources and the reasons of errors that occur in the order-delivery process are mainly taken as
given factors in this study.
11
The results of this study can be applied as guidance for the Purchasing team and management of
the matters that could be improved. Although the focus of this study is on a company in order-
delivery and material execution process of 3rd party OEM system products, the characteristics of
the main concepts of order and lead time remain the same regardless of industry related factors
which leaves room for applying the model in other businesses having the specified features. The
following Chapters 1.2 and 1.3 specify the approach used in the study and the structure of it.
1.2 Research Approach and Methodology
This study follows a case study approach. Yin (2003, 85-86) recommends using as many sources
as possible in case studies to ensure the quality of the study. Yin lists six different sources, which
are seen to be the most important, including documentation, archival records, interviews, direct
observations, participation/observation and physical artefacts.
In order to reveal the current situation and practices in the case organisation with regard to the
continuous improvement of the purchase process, internal databases were reviewed and
interviews of Buyers and other team representatives from the case organisation in relation to
order correctness were carried out. Also an inquiry including five questions about errors was sent
to the Buyers allowing them to describe the current situation from the viewpoint of their
expertise. Participant-observation was used as well; the researcher served as a team member in
the case organisation and was involved in everyday issues and events. As Koskinen et al. (2005,
158) mention there is a participative element present in a case study when the researcher makes
observations as an active participant of a company, such as an internal consultant. This element
is important since the author was a member of the case organisation before and during the
research.
Yin (2003, 93) remarks that the major advantage in participant-observation is that it offers access
to information that is not available to scientific investigation and an ability to perceive reality
from the viewpoint of someone inside the case study. One major problem related to this method
is that the participant-observer is likely to follow a commonly known phenomenon and become a
supporter of the group or organisation being studied. In addition, observation can interfere with
participation and vice versa. However, observation was executed by perceiving a general
impression of the purchasing process and all the functions influencing it in practice. Observation
was also needed to make feasible and as good implementation proposals as possible.
12
Based on the inquiry, interviews, expert analysis, observation and written sources of information,
the research phenomena and the errors of the incorrect sales orders were identified and classified
into five different error categories.
The data collection from all incoming sales orders was carried out from 30th October to 31
st
December 2009. The Buyers kept track of incorrect sales orders by marking on their order status
Excel sheets three extra columns: whether the order is clean or there's an error, the error type and
description of the error. In addition the following information was collected: the date the sales
order was released for purchasing and the date the purchase order was created by the Buyer. Also
other information about all incoming orders was available, for example region, country,
customer, suppliers, etc.
The data collection and statistical analysis were executed to measure e.g. the lead time of the
purchase order creation and the number of the incorrect sales orders, as well as what types of
errors were prevalent in which regions and what was the impact of the incorrect sales orders on
the lead time per different error category. In addition, a performance measurement and statistical
analysis were done exploring what were the key dimensions for measuring the purchase order
processing performance identified as lead time. It was also agreed that the Order Engineering
was to be informed of all the errors. It was also possible to make comparisons of how the error
follow-up of the Purchasing team for the purposes of this study affected the Order Engineering’s
monthly reported error statistics.
The forecasted results of the statistical analysis were that approximately 50 percent of the sales
orders are incorrect, and that the lead time for creating a purchase order from an incorrect sales
order is approximately three days while the target is one day. The assumption was that the most
time-consuming errors are related to incorrect or unclear configuration. In addition, there was a
supposition that cases where mandatory information is missing should be easy to prevent and
eliminate by the case organisation, and additionally information flows can be improved
internally as well.
The focus and objectives of this study were set to be from the case organisation’s and the
Buyer’s perspective, focusing on what the case organisation and Buyers can improve to
minimize the number of incorrect sales orders released for purchasing. The solution cannot
solely be something that just pushes the problem to the previous step of the process and accusing
13
only others of bad quality. Therefore, this study explored several methods for the case
organisation and Buyers to continuously improve the purchase process.
The objectives of the continuous improvement in the case organisation’s Purchasing team were
laid in accordance with the TQM-principle of organisation-wide involvement as well as the
Kaizen event. The Manager of the Purchasing team supported the improvement efforts by
bringing forward the need to continually minimize the time wasted in the forms of manual work
and a huge number of e-mails. To make sure that everyone involved had the necessary
information about the goals of continuous improvement, the author attended numerous weekly
meetings in the case organisation.
The study holds the assumption that the errors of the sales orders indicate bad quality from the
previous steps of the process, not bad quality from the Buyers’ side. Instead, the Buyers are in
that special back-end phase of the process where they end up fixing the incorrect orders.
Therefore the performance measurement from the Buyers’ team perspective is the purchase order
creation lead time, as it is in their hands and it can be perceived as capability of their work. The
number of reported incorrect sales orders can be allocated to the customer teams’ order entry per
different regions’ capability. In addition, the number of incorrect sales orders is assumed to be
somewhat stable, depending mainly on the total number of incoming sales orders.
Another assumption of this study is that the lead time, number of people involved, working days
and process steps are considered indicators for costs. To define the cost for example in the case
of double work backwards in a complex and long global order-delivery process is a challenging
task as it is difficult or sometimes even impossible to measure exact numbers. It is relatively easy
to conclude an estimation, but it is after all only an estimation and not a realistic calculation.
Therefore, no costs are presented in this study.
1.3 Structure of the Study
The beginning of Chapter 1 contains an introduction and a motivation for the study. The latter
part describes the research problem, objectives, research approach as well as the main
terminology and abbreviations used in the study.
Chapters 2 and 3 contain a review of the necessary theoretical components related to the creation
of the framework for the continuous improvement of the purchase process. The theoretical part
14
starts off by introducing the necessary perspectives on quality as a concept and continues with
presenting the components of Total Quality Management.
The study introduces Supply Chain Management in order to bring forward the necessary
elements any company has to explore when having problems with internal process performance
and its supply chain. To provide consistently high quality for customers, a company must be able
to create efficient ways of working in its supply chain. In practice it is about designing efficient
and effective processes both between the parties in a supply chain, and also internally in a
company. Therefore, Process Management as a concept is covered next in the theoretical part of
the study.
The second part of the theoretical review is about models and practices relating to Performance
Measurement with emphasis on Continuous Improvement. Furthermore, as improvement cannot
be perceived without measurement, a discussion about the importance of measurement and the
value of information in designing an effective performance measurement system is given. Also
the methods to analyze the performance measurement data to create quality control are
described.
Chapter 4 presents the theoretical research framework. The essentials of the case organisation, as
well as the description of the current state are encompassed in Chapter 5 to reveal the
background of the research problem and objectives. Chapter 6 holds the empirical case study as
well as the results of it. Chapter 7 includes theoretical and empirical findings and managerial
implications. Finally, discussion and suggestions for further research are presented in Chapter 8.
1.4 Terminology and Abbreviations
Front-end and back-end are generalized terms that refer to the initial and the end stages of a
process. The front-end is responsible for collecting input in various forms from the user and
processing it to conform to a specification the back-end can use.
Enterprise resource planning (ERP) system is a commercial software package that integrates
organisational information systems and provides an infrastructure for managing information
across the enterprise. ERP systems promote seamless integration of all the information flowing
through a company.
Lead time (LT) is a general term used to describe the time between order and delivery.
15
Original equipment manufacturer (OEM) manufactures products or components that are
purchased by a company and retailed under that purchasing company's brand name. OEM refers
to the company that originally manufactured the product. It is a type of contract manufacturing
and a form of outsourcing.
Purchase order (PO) is a commercial document issued by a buyer to a seller, indicating types,
quantities, and agreed prices for products or services the seller will provide to the buyer. Sending
a PO to a supplier constitutes a legal offer to buy products or services. Acceptance of a PO by a
seller usually forms a one-off contract between the buyer and seller.
Sales order (SO) is an order issued by a business to a customer. A sales order is an internal
document of the company, generated by the company itself. The customer's purchase order is the
originating document which triggers the creation of the sales order. A sales order can contain
many customer purchase orders under it.
CT Customer Team
LC Logistics Coordinator
OCS Order Configuration Support
OE Order Engineering
OMC Order Management Centre
16
2 Quality in the Order-Delivery Logistic Process
In this Chapter the research problem is positioned into existing literature. Many theories are
introduced here because this study synergizes a wide array of past research. The purpose of
Chapter 2 is to demonstrate the relevant theoretical topics of quality in the order-delivery logistic
process of a supply chain in relation to the research problem and to form a foundation for the
study.
In essence, the minimized lead time of a purchase order handling process as a consequence of the
order correctness in a process is the outcome of the level of operational quality the organisation
has been able to achieve in its different functions and processes. Although the functions, such as
sales, purchasing, customer service and product support, have their independent purposes, their
level of cooperation is a key factor affecting the performance of the organisation. Fluent
cooperation between different functions in an organisation presupposes in practice well-designed
processes and ways of working.
Based on these considerations, a further contemplation of what constitutes quality in the order-
delivery process has to include the examination of the key aspects of Supply Chain Management
and Process Management. The discussion begins by looking at what is quality and continues
with a review about the main principles of Total Quality Management.
What exactly is quality? The literature on the subject contains almost as many definitions as
there are authors who have written about it. A distinction is made between concepts such as
functional quality, physical quality, fitness for use, product’s conformance to the requirements,
transcendent, etc. IBM’s simple definition of quality is the most descriptive in relation to the
research topic: “Quality is the degree in which customer requirements are met. We speak of
quality product or quality service when both supplier and customer agree on requirements and
these requirements are met” (IBM & Crosby, 1980 mentioned in Weele 2005, 192). The
requirements mentioned can relate to the technical properties of a product. However, they can
also relate to user-friendliness, ease of maintenance, delivery agreements and packaging
instructions. Here, a broad view is taken and the quality concept is seen to relate to more than
just the physical properties of the product.
In general, it is understood that quality is about fulfilling the expectations of the customers in a
way where the internal efficiency and profitability of the company is maximized. Here, the
17
element of continuous improvement, i.e. aiming at doing things right the first time and every
time, meaning that no mistakes are done, and ensuring that the right things are being done,
cannot be overlooked (Lecklin 2006, 18-19). Thus, quality can be viewed also as the
combination of efficiency and effectiveness. Here, efficiency relates to “doing things right”,
whereas effectiveness is about “doing the right things”. Therefore, quality could also be defined
as “doing the right things right” (Clark 1999, 5). Emphasis on the customer has lately become
the norm when defining quality. This perspective is based on the user- and product-based criteria
and is driven by the need to provide value to the customer.
Also Lecklin (2006, 18) emphasizes the needs and expectations of customers when defining
quality. A company’s level of operations can be regarded as being of good quality if the
customer is content with the company’s products. Therefore, internal efficiency and a faultless
product do not as such guarantee high quality. The prerequisite of high quality is taking the
viewpoint of the customers into account. A customer-driven definition of quality can then be
expressed as Evans and Lindsay (2005, 16) put it: “Quality is meeting or exceeding customer
expectations”. A company has to concentrate on increasing the customer value of its product or
services and in this way increase customer loyalty. The problem for the vendor is that the criteria
and needs of the customer can be subconscious and in a constant state of flux (Laamanen &
Tinnilä 2009, 67).
Evans and Lindsay (2005, 29) state that an organisation that is committed to total quality must
apply it at three levels: the organisational level, the process level, and the performer/job level. At
the organisational level, quality concerns centre on meeting external customer requirements.
Customer-driven performance standards should be used as bases for goal setting, problem
solving, performance appraisal, incentive compensation, nonfinancial rewards, and resource
allocation.
At the process level, organisational units are classified as functions or departments. Because
most processes are cross-functional, the danger exists that managers of organisational units try to
optimize the activities under their control, which can sub optimize activities for the organisation
as a whole (Evans & Lindsay 2005, 29). Laamanen and Tinnilä (2009, 67) note that each process
has a customer whose feedback and information on satisfaction is needed for the development of
the process. At the performer level, standards for output must be based on quality and customer-
service requirements that originate at the organisational and process levels. These standards
include requirements for such features as accuracy, completeness, innovation, timeliness, and
18
cost. Evans and Lindsay (2005, 29) point out that for each output of an individual’s job, one
must ask: What is required by the customer, both internal and external? How can the
requirements be measured? What is the specific standard for each measure?
Viewing an organisation from this perspective clarifies the roles and responsibilities of all
employees in pursuing quality. Getting everyone involved is the foundation of Total Quality
(Evans & Lindsay 2005, 29). Total Quality Management is a comprehensive approach for
improving quality in organisations. Therefore, the next Chapter 2.1 includes a review about the
main principles of Total Quality Management.
2.1 The Concept of Total Quality Management
For long, achieving quality concentrated on reducing defects on products. However,
organisations have realized that quality, as well as customer satisfaction and business results,
cannot be achieved without significant attention to the quality of the management practices used
on a daily basis. This includes strategy development, listening to customers, measuring
performance and analysing data, rewarding and training employees, but also developing long-
term relationships and designing as well as delivering products. In this sense quality is regarded
more as an organisation-wide performance excellence approach. Whilst the above mentioned
view has integrated into management systems, the notion of Total Quality Management (TQM)
has become popular (Evans & Lindsay 2005, 10).
Since the 1920s quality management has evolved into a management philosophy that emphasises
the importance of understanding customer needs and the continuous improvement of operations.
Processes play a crucial role in all quality management models. Total Quality Management is a
people-focused management system that focuses on increasing customer satisfaction and
reducing costs. It includes a systems approach that integrates organisational functions and the
entire supply chain. (Laamanen & Tinnilä 2009, 67)
Quality and productivity are inextricably linked. Improved quality and increased productivity go
together as do targeted performance and customer satisfaction. Wilson and Pearson suggest
(1995, 10) that maybe the title of this concept should be Total Quality, Productivity,
Management, Effectiveness, and Overall Performance Improvement Resulting in Client
Satisfaction Program, for short, to describe to way TQM is about improving the organisational
performance.
19
Top management support, direction, and commitment are vital to the development and
implementation of an effective TQM program. In addition, other elements are required as well to
be carried out:
• Defining customer expectations and translating these into realistic goals and objectives
• Using, developing, and empowering employees; treating these resources as capital
• Planning and espousing continuous improvement
• Developing and carrying out effective project and process management
• Appropriate quantitative measurement techniques for status reporting and trend analysis
• An effective root cause analysis system to identify the real causes for problems
• Positive fault correction; practical corrective, adaptive, and preventive actions (Evans &
Lindsay 2005, 18).
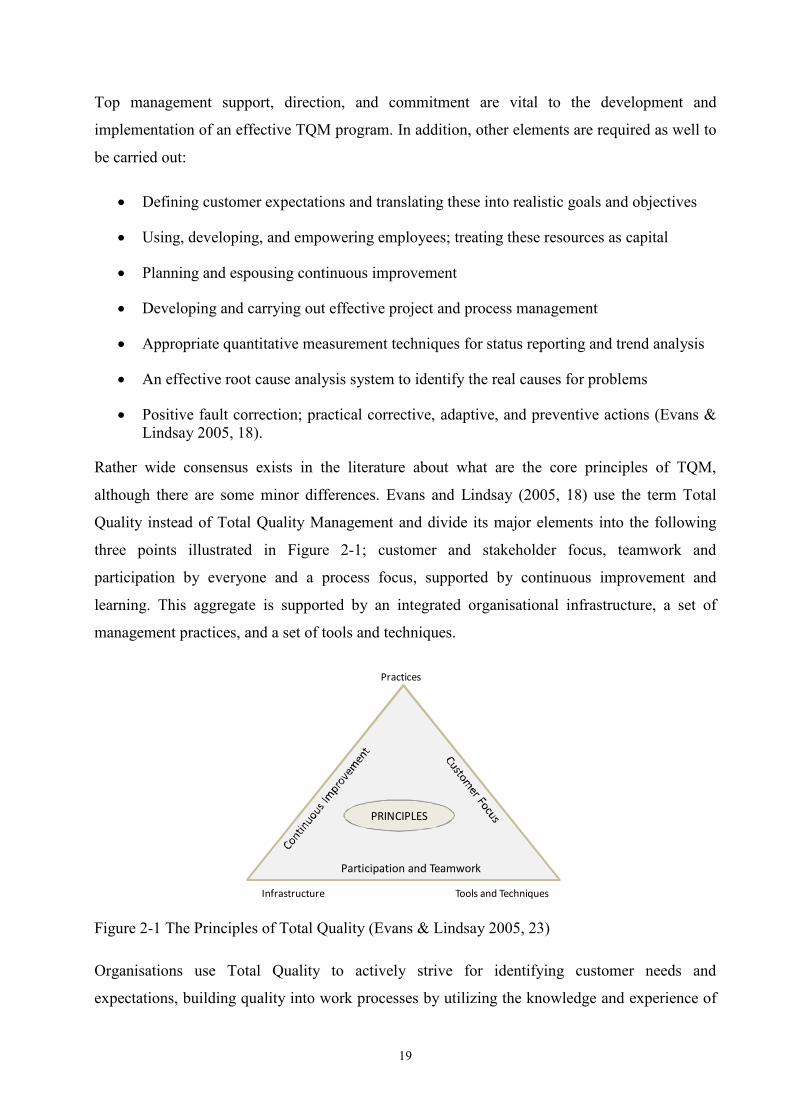
Rather wide consensus exists in the literature about what are the core principles of TQM,
although there are some minor differences. Evans and Lindsay (2005, 18) use the term Total
Quality instead of Total Quality Management and divide its major elements into the following
three points illustrated in Figure 2-1; customer and stakeholder focus, teamwork and
participation by everyone and a process focus, supported by continuous improvement and
learning. This aggregate is supported by an integrated organisational infrastructure, a set of
management practices, and a set of tools and techniques.
PRINCIPLES
Practices
Tools and TechniquesInfrastructure
Participation and Teamwork
Figure 2-1 The Principles of Total Quality (Evans & Lindsay 2005, 23)
Organisations use Total Quality to actively strive for identifying customer needs and
expectations, building quality into work processes by utilizing the knowledge and experience of
20
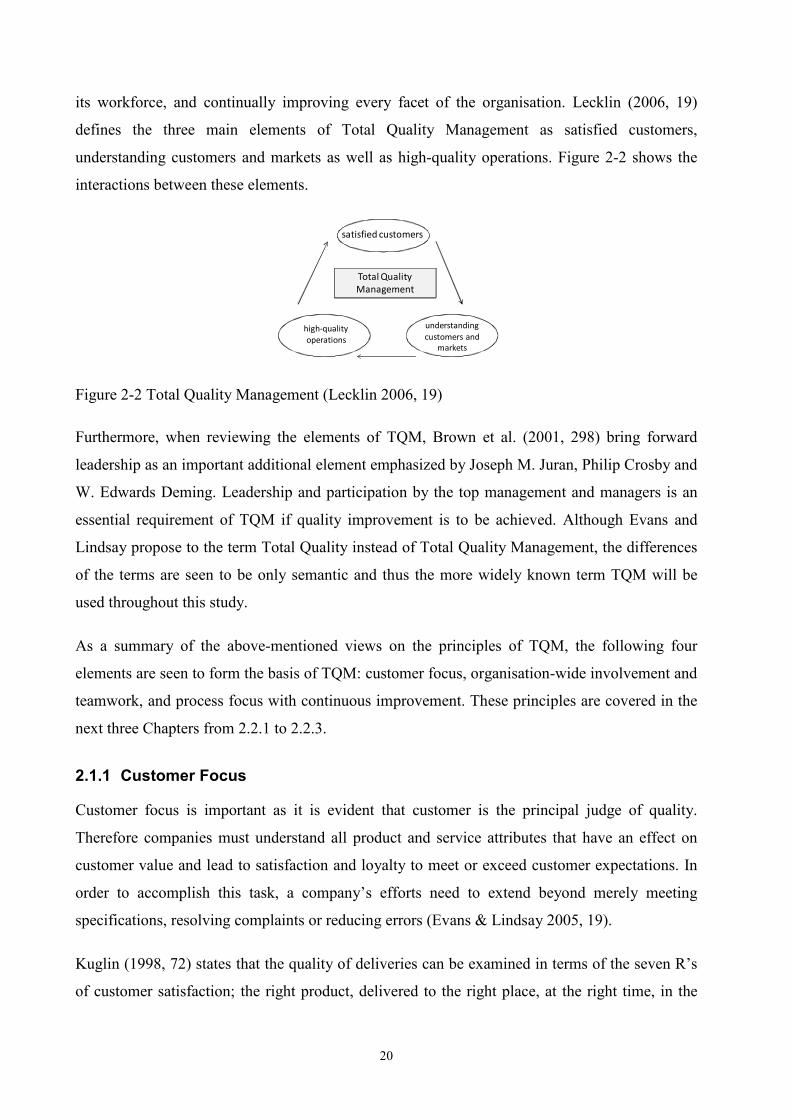
its workforce, and continually improving every facet of the organisation. Lecklin (2006, 19)
defines the three main elements of Total Quality Management as satisfied customers,
understanding customers and markets as well as high-quality operations. Figure 2-2 shows the
interactions between these elements.
satisfied customers
understanding
customers and
markets
high-quality
operations
Total Quality
Management
Figure 2-2 Total Quality Management (Lecklin 2006, 19)
Furthermore, when reviewing the elements of TQM, Brown et al. (2001, 298) bring forward
leadership as an important additional element emphasized by Joseph M. Juran, Philip Crosby and
W. Edwards Deming. Leadership and participation by the top management and managers is an
essential requirement of TQM if quality improvement is to be achieved. Although Evans and
Lindsay propose to the term Total Quality instead of Total Quality Management, the differences
of the terms are seen to be only semantic and thus the more widely known term TQM will be
used throughout this study.
As a summary of the above-mentioned views on the principles of TQM, the following four
elements are seen to form the basis of TQM: customer focus, organisation-wide involvement and
teamwork, and process focus with continuous improvement. These principles are covered in the
next three Chapters from 2.2.1 to 2.2.3.
2.1.1 Customer Focus
Customer focus is important as it is evident that customer is the principal judge of quality.
Therefore companies must understand all product and service attributes that have an effect on
customer value and lead to satisfaction and loyalty to meet or exceed customer expectations. In
order to accomplish this task, a company’s efforts need to extend beyond merely meeting
specifications, resolving complaints or reducing errors (Evans & Lindsay 2005, 19).
Kuglin (1998, 72) states that the quality of deliveries can be examined in terms of the seven R’s
of customer satisfaction; the right product, delivered to the right place, at the right time, in the
21
right condition and packaging, in the right quality, at the right cost, to the right customer. In
essence, a company’s ability to fulfil these criteria depends on the quality of the logistics
processes of the company. In short, the question here is about fulfilling a company’s promises to
the customer in all aspects of the delivery (Kuglin 1998, 69 and 193-195). Customers naturally
expect to get their orders filled perfectly.
According to Christopher (1998, 24) products don’t have value until they are in the hands of the
customer at the time and place required. There are clearly many facets of customer service,
ranging from on-time delivery through to after-sales support. Essentially the role of customer
service should be to enhance “value-in-use”, meaning that the product becomes worth more in
the eyes of the customer because service has added value to the core product. In this way
significant differentiation of the total offer (that is the core product plus the service package) can
be achieved. The service excellence can only be achieved through a closely integrated logistic
strategy. In reality, the ability to become a world class supplier depends upon the effectiveness of
one’s operating systems and upon the presentation of the product, the creation of images and the
influencing of consumer perceptions. Managing the logistics of service delivery on a consistent
basis is a source of differential advantage. (Christopher 1998, 24)
Logistic management can play a key role in enhancing customer lifetime value through
increasing customer satisfaction and thus customer retention. “Perfect order” achievement should
form the basis for the measurement of service performance and the creation of service standards
(Christopher 1998, 68).
2.1.2 Participation and Teamwork
Participation and teamwork are needed in order to ensure quality improvement and development
of a company’s practices. Providing the right tools, a fair amount of freedom and encouragement
to the employees are factors that are necessary for achieving development. Many times the
people themselves are the experts in delivering the best suggestions for developing their own
work. This is in direct contrast with the typical attitude according to which people need to be
“managed”. Teamwork, especially in cross-functional teams, is required for achieving progress
in processes or ways of working (Evans & Lindsay 2005, 18-19).
Because an element of human factor is always present, good leadership, fine techniques and well
functioning processes are not enough to create excellent quality. The best guarantee in attaining
high quality is motivated, trained and competent personnel. Quality is achieved via cooperation
22
among the personnel; the process is as good as its weakest link. Each employee has to be
empowered to take responsibility and consider risks where appropriate. The key is to learn from
mistakes and to analyse and process them or to develop ways of working in a way that prevents
reoccurrence (Lecklin 2006, 236-237).
According to Krajewski and Ritzman (2002, 250) a complete program in employee involvement
would include changing corporate culture, encouraging teamwork, supporting individual
development through training, establishing awards and ensuring a proper incentive structure
which supports the development of quality. Everyone in an organisation must have a view that
controlling quality is an end in itself; errors should be corrected at the source and not passed
along to the final products.
Leadership and top management commitment is required to ensure development in a company’s
aspirations of improving and managing quality. In practice this means investing time and money
into quality development, and an active approach related to quality issues. The involvement of
management must not be limited to only reviews of results. Commitment means personal
willingness to develop and a desire to learn and master quality management (Lecklin 2006, 58).
In addition to the points made by Lecklin, Evans and Lindsay (2005, 218-221) see leadership as
a necessary element in the organisational infrastructure supporting quality development and
bring forward some additional issues. An important task of the top management is to create a
customer-focused vision and clear quality values to serve as a basis for decision-making
throughout the organisation. These quality values must be visible in the management’s daily
leadership, as leadership is the “driver” of the whole quality system of a company.
2.1.3 Process Focus with Continuous Improvement
Many of the most potential areas of organisational performance improvement lie between
different functions of a company. This is one of the main reasons why process focus is so
important in developing quality. Very few of the major activities of a company do not involve
processes that span across different functional units. In other words, although many times an
organisation is viewed by looking at the vertical dimension of it, much of the work gets done
horizontally, via processes between functions. For example, the following steps can be
distinguished in a typical order fulfilment process: placing an order, entering it into the computer
system, checking credit, picking, packing and finally delivering the items (Evans & Lindsay
2005, 20-21). Process management will be more extensively discussed in Chapter 2.3.
23
Continuous improvement is about systematically closing the gaps between customer
expectations and the characteristics of process outputs. Continuous improvement is built-in
quality work and it includes the idea that things can always be done better. Learning is tightly
linked with continuous improvement and has a considerable effect on the long-term performance
improvement. (Evans & Lindsay 2005, 22-23) A more broad coverage of continuous
improvement as a philosophy and on a practical level is provided in Chapter 3.4.
Building and sustaining a Total Quality organisation requires a readiness for change, the
adoption of sound practices and implementation strategies, and an effective organisational
infrastructure. As the principles of TQM have been covered, the next Chapter 2.2 brings forward
an issue that companies have to consider when striving for improvements in the order-delivery
process; Supply Chain Management.
2.2 Key Issues of Supply Chain Management
The Supply Chain Management (SCM) concept extends the view of operations from a single
business unit of a company to the whole supply chain. Essentially, SCM is a set of practices
aimed at managing and coordinating the supply chain from raw material suppliers to the ultimate
customer (Heikkilä 2002, 749). According to Lambert et al. (1998, 1) the success of companies
depends on the ability of the management to integrate the inter-company processes. The
management of these relationships across the supply chain is being referred to as Supply Chain
Management.
No clear understanding exists on the definition of SCM. The distinction between the concepts of
SCM and logistics is different depending on which source is referred to. SCM has been defined
as follows by the Global Supply Chain Forum (Lambert et al. 1998, 1): “Supply chain
management is the integration of key processes from end-user through original suppliers that
provides products, services, and information that add value for customers and other
stakeholders”. Laamanen and Tinnilä (2009, 64) define SCM to involve the optimisation of a
product deliveries and services chain that consists of several companies. The supply chain strives
to reduce overall chain costs, improve service, accelerate flows and, in turn, increase sales. The
objective is to integrate in the supply chain the various parties’ information flows as well as to
increase communication. The goals of SCM are dependent on the ability of the companies in the
supply chain to utilize information technology in exchanging information.
24
According to Simchi-Levi et al. (2000, 2) shortening of products’ life-cycles, customers’
heightened expectations, increased global competition and advances in communication and
transportation technologies have been the driver for the change that companies need to compete
between supply chains and not as solely autonomous entities. The shortening of product life-
cycles is also creating a need to cut the order-to-delivery cycle times in order to avoid
obsolescence (Kuglin 1998, 69). Goals of SCM include improvements on business processes and
ultimately customer service. In a typical supply chain raw materials are procured, products
manufactured, shipped to warehouses or directly to the end-customers. Effective SCM must take
into account the interactions of the different levels of the chain, consisting of suppliers,
manufacturers, distribution centers and retail outlets, for example (Simchi-Levi et al. 2000, 2).
A number of researchers suggest that better performance can be achieved by consolidating
customer and supplier bases, removing unnecessary steps in the chain, speeding up information
and material flows, and creating long-term partnerships with major customers and suppliers to
leverage the capabilities of several companies in the chain. Previous management theory in the
area of SCM can be broadly divided into two main categories. The first is studies on primarily
the chain structure, and the second is primarily about industrial networks and the relationships
between organisations in the chain. (Heikkilä 2002, 749)
The complexity in SCM comes from the different parties in the chain with often different, even
conflicting objectives. This is one reason why exchanging accurate information is important,
when the activities of a chain are developed to optimise quantities, time and quality. Suppliers,
for example, often want manufacturers to commit themselves to large and fixed purchasing
quantities with flexible delivery times. However, from the manufacturers’ point of view the more
flexibility it gets from its suppliers the better. Another issue adding to the difficulty of successful
SCM is the dynamic nature of the chain. The chain evolves over time, as demand and supply
capabilities of players and their relationships change. Matching supply and demand is a
challenge. Furthermore, some supply chain problems may be totally new and there might not be
a clear understanding about the best resolutions (Simchi-Levi et al. 2000, 3, 8).
To reveal what Supply Chain Management means in practice, the most common models used can
be examined to illustrate the key components of SCM in order to see beyond definitions. Here
the focus will be put on a model created by Cooper et al. (1997, 10 in Lambert et al. 1998, 2),
illustrated in the following Figure 2-3.
25
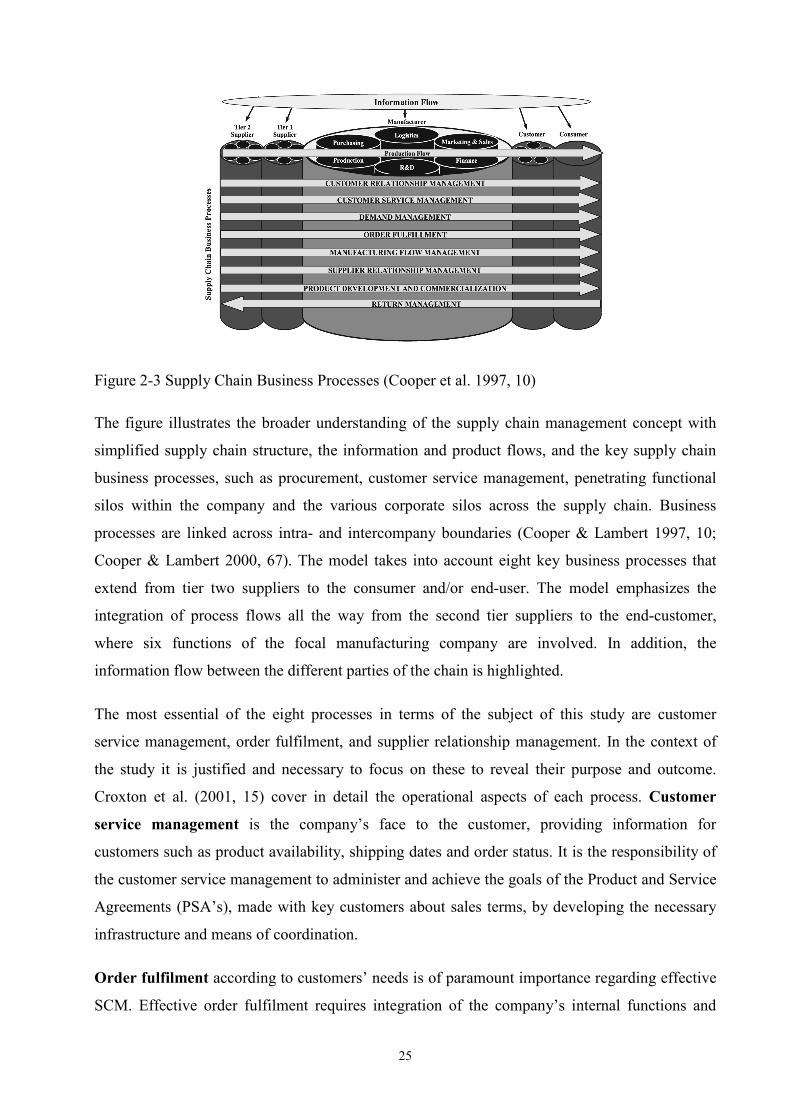
Figure 2-3 Supply Chain Business Processes (Cooper et al. 1997, 10)
The figure illustrates the broader understanding of the supply chain management concept with
simplified supply chain structure, the information and product flows, and the key supply chain
business processes, such as procurement, customer service management, penetrating functional
silos within the company and the various corporate silos across the supply chain. Business
processes are linked across intra- and intercompany boundaries (Cooper & Lambert 1997, 10;
Cooper & Lambert 2000, 67). The model takes into account eight key business processes that
extend from tier two suppliers to the consumer and/or end-user. The model emphasizes the
integration of process flows all the way from the second tier suppliers to the end-customer,
where six functions of the focal manufacturing company are involved. In addition, the
information flow between the different parties of the chain is highlighted.
The most essential of the eight processes in terms of the subject of this study are customer
service management, order fulfilment, and supplier relationship management. In the context of
the study it is justified and necessary to focus on these to reveal their purpose and outcome.
Croxton et al. (2001, 15) cover in detail the operational aspects of each process. Customer
service management is the company’s face to the customer, providing information for
customers such as product availability, shipping dates and order status. It is the responsibility of
the customer service management to administer and achieve the goals of the Product and Service
Agreements (PSA’s), made with key customers about sales terms, by developing the necessary
infrastructure and means of coordination.
Order fulfilment according to customers’ needs is of paramount importance regarding effective
SCM. Effective order fulfilment requires integration of the company’s internal functions and
26
developing partnerships with the key suppliers to meet the customers’ needs. In practice, order
fulfilment specifies the steps how customer orders are “generated and communicated, entered,
processed, documented, picked, delivered and handled post delivery” (Croxton et al. 2001, 20-
21).
Supplier relationship management refers to the ways in which the company interacts with its
suppliers and how it conducts the purchasing activities as a whole. It is a mirror image of
customer relationship management. This process includes categorization of suppliers to identify
key suppliers, negotiations of PSAs and finally implementing and managing the PSAs. The level
of collaboration with the suppliers should be dependent on the importance of the relationship.
Closer ties should be kept with key suppliers, while maintaining more traditional relationships
with others (Croxton et al. 2001, 24-26).
Some scholars suggest using the term demand chain management instead of SCM (Vollmann &
Gordon, 1998 mentioned in Heikkilä 2002, 749, Christopher 1998, 18). This puts emphasis on
the needs of the marketplace, not suppliers, and designing the chain to satisfy these needs,
instead of starting with the supplier/manufacturer and working forward. Christopher (1998, 18)
adds that equally the word chain should be replaced by network since there are normally multiple
suppliers and, suppliers to suppliers as well as multiple customers and customers’ customers in
the total system. Thus supply chain could be defined as a network of connected and
interdependent organisations mutually and co-operatively working together to control, manage,
and improve the flow of materials and information from suppliers to end users.
Managing processes between organisations is a key component of SCM. Therefore, Process
Management as a management philosophy is covered next.
2.3 Process Management
In SCM accruing the benefits from integration is largely dependent on the company’s ability to
integrate its processes with its partners in the supply chain. When discussing the approach of
TQM the importance of business process development is all the same as important. In short,
improving the quality of the logistics operations is about process development. The purpose of
this Chapter is to illustrate Process Management further. Taking into account the research
problems and the focus of the study, a look on process management is a necessity, since the
underlying goals are much about examining the quality of the order-delivery process and
identifying improvement opportunities.
27
According to Laamanen & Tinnilä (2009, 20) a business process can be defined as “a set of
logically related activities and the resources needed to achieve the business result”. A process
always has an internal or external customer for which the process creates added value. Lecklin
(2006, 123) describes a process as “a set of activities in which a company transforms the inputs
of the process into outputs for the customer”. Process is a series of activities that can be defined,
repeated and measured.
Process Management is a way of working in a company, where operations are managed via
processes. It involves planning and administering the activities necessary to achieve a high level
of performance. The approach is focused on aligning all aspects of an organisation with the
needs of customers. It is a holistic approach attempting to improve processes continuously. It
could therefore be described as a process optimization process. Processes are considered to be
strategic assets of an organisation that must be understood, managed, and improved to deliver
value added products and services to customers. This foundation is very similar to other Total
Quality Management or Continuous Improvement methodologies or approaches.
According to Evans and Lindsay (2005, 364-371) top companies in quality and customer service
share certain common practices in process management. First, these companies have an ability to
translate customer requirements into product and service requirements early in the process,
taking into account the manufacturing and supplier capabilities and environmental issues.
Second, they build quality into the products and use appropriate tools during product
development to maximize the speed and quality of the process. Third, they define and document
important value creation and support processes, and manage them carefully. Fourth, they set
performance levels for suppliers and ensure by monitoring that they are met. Fifth, they use
reengineering and benchmarking methods in process development where appropriate.
In addition to the five practices, two more practices are mentioned related to developing and
managing quality. These aspects are directly related to the core theme of this study, improving
the quality of an order-delivery process.
1. Control the quality and operational performance of key processes and use systematic
methods to identify variations, determine root causes, and make corrections in
operational performance and quality.
2. Continuous improvement of processes to achieve better quality, cycle time, and overall
operational performance (Evans & Lindsay 2005, 368-369).
28
The process management of a company consists of the process owners of the most important
processes. Process owners are assigned to processes that span across different functions (Lecklin
2006, 131-132). The advantage of process management is the alignment of the structure of the
organisation with the nature of daily operations. This helps to develop activities as a whole and
arrange the communication between people responsible for different tasks in the process
(Lecklin 2006, 130-132). Process management helps to make commonly shared objectives of the
process known in the company, such as cutting costs, improving productivity or quality,
increasing flexibility or cutting lead times. Applying process management practices is the most
suitable in logically proceeding processes that always have a determined event that initiates the
process, proceed logically in a certain sequence and have a determinant result (Lecklin 2006.
128-129).
Karrus (2005, 210-212) states that process thinking is especially suitable in logistics
development since logistics is information-intensive by nature and deals with real processes. One
important aspect in process management is the appreciation of where in a process is value
generated. Added value is generated by well-connected and managed activities that are linked to
each other, and not from separate functions or activities. In the development of processes the
question usually is how to improve the processes in a way that best creates value for the
customers. Naturally, this performance of the processes has to be measured by process-specific
performance indicators.
The order-delivery process is comprised of activities starting from the order placed by the
customer and ending with the receiving of products and services. The process activities of
product delivery include: order placement, order receipt and processing, manufacture,
warehousing, shipping, transfer, and receiving of delivery. In a supplying organisation goods for
delivery may also involve production and procurement planning and testing. In terms of process
designing an important factor is to what extend the service and product are standardised. The
main alternatives range from fully standard goods delivered directly from inventory, to pre-
specified components and a customer-specific assembly comprised of them, to a partly or fully-
customised project delivery. (Laamanen & Tinnilä 2009, 64)
Organisations can establish several different delivery processes according to various customer
needs and segments. For example, standardised order-delivery processes meet the standard needs
of customers, while customised processes are developed for more customer-specific needs. The
29
efficiency of processes varies due to, for example, the need for customisation, volume and the
need for adapting to variations. (Laamanen & Tinnilä 2009, 64)
2.3.1 Order Processing and Purchasing Management
Order processing helps to ensure that customers receive material when and where they require it.
Monczka et al. (2009, 49) mention, that problems with order processing have involved accepting
orders before determining if adequate production capacity is available, not coordinating order
processing with order scheduling, and using internal production dates instead of the customer’s
preferred date to schedule the order. Order processing is an important part of supply chain
management as it represents a link between the producer and the external customer.
A purchase order is usually initiated through a purchase order requisition or a materials
requisition. When ordering from a supplier, it is very important to be specific about the
information and instructions to the supplier. Generally, a purchase order will include the
following entities: an order number, a product description, unit price, number of units required,
expected delivery time or date, delivery address, invoicing address and other information
necessary for effective logistic and administrative processing. The supplier is requested to send
in an order confirmation for each purchase order received. The purchasing process is concluded
with the follow-up phase. If all the preparatory activities have been executed adequately, there
will be less work in the ordering and order handling stages. In practice, however, things often
work out differently, and considerable efforts are required during the phase of ordering and
expediting (Weele 2005, 57).
The description of the purchasing process clarifies that a buyer must be an all-rounder with
sufficient technical knowledge, a feeling for the commercial side of the process, and be familiar
with the basics of logistics and administration. Every step in the buying process must be
executed carefully and systematically in order to provide the internal customer what is needed: a
product which is fit for its use, on time, in the required quantity and at a reasonable cost. (Weele
2005, 63)
Buyers need to reflect total quality management approaches in their ways of working. For
example, after the product specifications have been released the purchasing department must
ensure that they will be met by the supplier. The products that are to be manufactured must
remain within these specifications. In addition, the purchasing department has to ensure that the
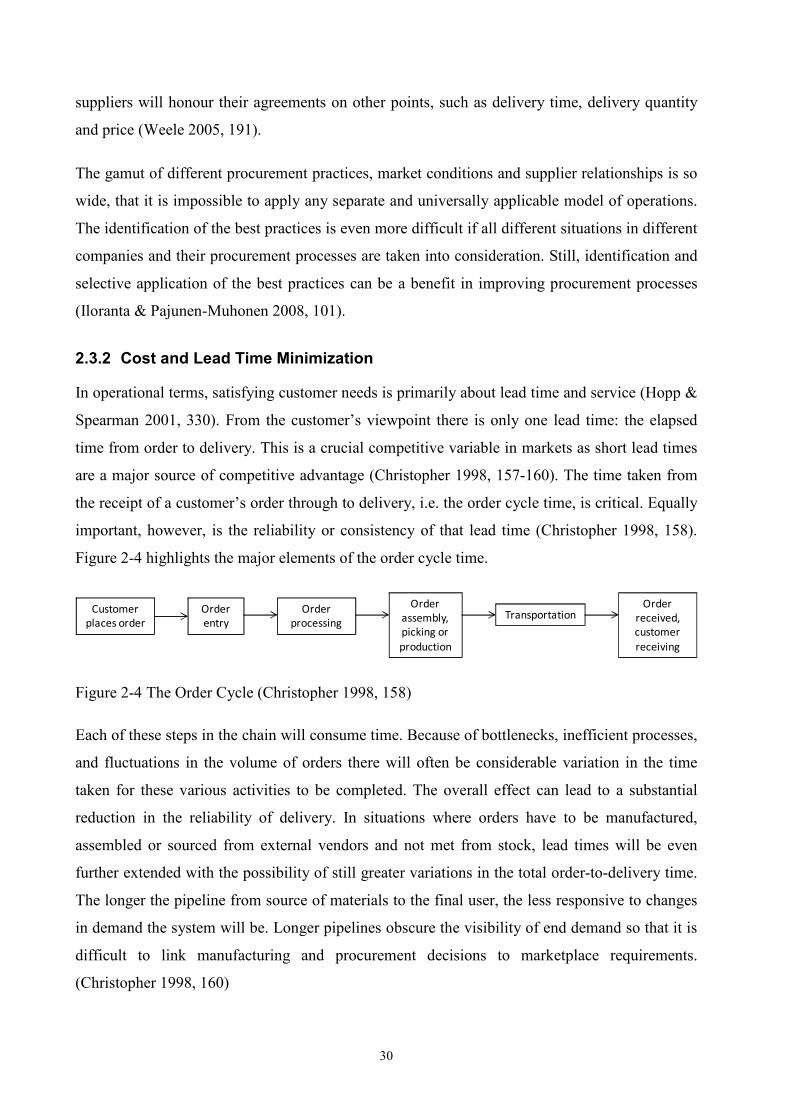
30
suppliers will honour their agreements on other points, such as delivery time, delivery quantity
and price (Weele 2005, 191).
The gamut of different procurement practices, market conditions and supplier relationships is so
wide, that it is impossible to apply any separate and universally applicable model of operations.
The identification of the best practices is even more difficult if all different situations in different
companies and their procurement processes are taken into consideration. Still, identification and
selective application of the best practices can be a benefit in improving procurement processes
(Iloranta & Pajunen-Muhonen 2008, 101).
2.3.2 Cost and Lead Time Minimization
In operational terms, satisfying customer needs is primarily about lead time and service (Hopp &
Spearman 2001, 330). From the customer’s viewpoint there is only one lead time: the elapsed
time from order to delivery. This is a crucial competitive variable in markets as short lead times
are a major source of competitive advantage (Christopher 1998, 157-160). The time taken from
the receipt of a customer’s order through to delivery, i.e. the order cycle time, is critical. Equally
important, however, is the reliability or consistency of that lead time (Christopher 1998, 158).
Figure 2-4 highlights the major elements of the order cycle time.
Customer
places order
Order
entry
Order
processing
Order
assembly,
picking or
production
TransportationOrder
received,
customer
receiving
Figure 2-4 The Order Cycle (Christopher 1998, 158)
Each of these steps in the chain will consume time. Because of bottlenecks, inefficient processes,
and fluctuations in the volume of orders there will often be considerable variation in the time
taken for these various activities to be completed. The overall effect can lead to a substantial
reduction in the reliability of delivery. In situations where orders have to be manufactured,
assembled or sourced from external vendors and not met from stock, lead times will be even
further extended with the possibility of still greater variations in the total order-to-delivery time.
The longer the pipeline from source of materials to the final user, the less responsive to changes
in demand the system will be. Longer pipelines obscure the visibility of end demand so that it is
difficult to link manufacturing and procurement decisions to marketplace requirements.
(Christopher 1998, 160)
31
Variability degrades performance, but how much can depend on where in the process the
variability is created. Variability early in the process is more disruptive than variability later.
High process variability toward the front of a process propagates downstream and causes delays
later, while high process variability toward the end of the line affects only those phases.
Therefore, there tends to be greater leverage from variability reduction applied to the front end of
a line than to the back-end. (Hopp & Spearman 2001, 332) Many sources of uncontrollable
variability exist in any process.
Therefore, according to Christopher (1998, 227), each link in the supply chain should be
critically examined to identify the value that it creates and the cost that it has. Value in this
context refers to customer value. A large proportion of the time spent is non-value-added time,
for example delays in paperwork, time a product sits as inventory, time spent on checking and
re-checking, and so forth. The target should be to eliminate or reduce all non-value-added
activities.
Christopher (1998, 227) states that the order processing system is a fabulous hunting ground to
seek out and remove non-value-adding activities. It is common that no one has ever questioned
the way in which paperwork is managed, or the sequence in which activities take place or why.
The goal should be to look for opportunities to combine steps in the processes, to integrate
separate groups of people performing adjacent tasks and to simplify processes. A major part of
the time consumed in meeting customer requirements is actually redundant and its elimination
will improve the consistency and reliability of the delivered service, thus enhancing its value in
the eyes of the customer. Christopher says (1998, 176) that time compression has the potential
both to speed up response times and to reduce supply chain costs. To sum it up, reducing non-
value adding time improves service and reduces costs.
SCM or the optimization of the supply chain has been studied from a variety of perspectives. The
optimal choice how to arrange the supply chain is a function of many inputs, and depends on the
competitive strategy of the company. One of these considerations is the lead time in terms of the
entire logistics footprint of the company, but also between suppliers and other supply chain
partners. Because business decisions are most often made from the perspective of their cost
effect, it makes sense to attempt to translate those decision parameters which are originally
something else into costs. In this way the “supply chain function” can be optimized in terms of
cost parameters that are easier to consider than intangible ones.
32
Chapter 3 includes discussion about the importance of Performance Measurement with emphasis
on Continuous Improvement, and the interconnections between them.
3 Performance Measurement and Improvement
The main objectives of performance improvement in a supply chain like prompt deliveries,
quality assurance and cost minimization are highly interdependent. The discussion in this
Chapter 3 focuses on performance improvement practices and the importance of measurement as
well as their interconnection. The intra-connections between organisations to ensure high
operational quality must in practise be taken care of with the help of information management.
According to Evans and Lindsay (2005, 374) there are three important reasons why companies
need performance measurement. First, to guide the company to drive strategies and
organisational change, second, to manage the resources needed in guiding the company to the
desired direction by evaluating the effectiveness of action plans, and third, to operate the
company’s processes and continuously improve them. Essentially much of the same message is
included in the insight of Osborne and Gaebler who make the following three observations about
the need for measurement (mentioned in Evans & Lindsay 2005, 372):
• “If you don’t measure results, you can’t tell success from failure.
• If you can’t see success, you can’t reward it, and if you can’t reward success, you are
probably rewarding failure.
• If you can’t recognise failure, you can’t correct it.”
Brown’s et al. (2001, 207) view is that “what gets measured gets done”. People make decisions
partly based on how they are measured and rewarded. Measurement practices are not only about
determining what has happened in the past. They are also about getting people to act in ways that
help the company to achieve the desired future state. Due to this, performance measurement
must be aligned with a company’s objectives (Brown et al. 2001, 207).
Performance measurement and improvement support one another. In order to achieve
improvements in performance, the current situation has to be determined by measurement. Once
the current state has been determined, the measures that are hoped to lead to improved
performance are carried out. Again, measurement is needed to verify the power and effects of the
performance measures. However, defining what to measure, how to measure it and being able to
perform measurement is not simple. Even more challenging is the successful determination of
33
those causes that stand in the way of improved performance and the ability to consistently create
sound solutions to these problems. It is easy to get lost in details and spend a large amount of
efforts on analysing without meaningful results. However, mastering both measurement and
systematic problem-solving is very important to keep a company competitive in the long run.
Operational control is about measuring performance. Performance measurement is important for
all functions of an organisation, strategic or operational. It is especially important for operational
management, because it reveals how the company is performing and what the state of quality of
its operations is. Measurement also reveals the operational areas that are performing less than
adequately and need improvement (Brown et al. 2001, 307-308 and 318).
A central objective of logistics is efficiency. It is measured with appropriate quantity, time, cost,
and quality measures. In logistics, efficiency is sought by creating new ways of working or
improving the old ones. The most important purpose of a measure is to give an accurate, wide
enough and objective picture about the state of logistics efficiency. The appropriate efficiency
measures depend largely on the nature of the business and product in question (Karrus 2005,
169-170). Performance can be expressed in terms of economic measures and indicators (cost,
profit, turn-over) and those which are non-economic (effectivity, efficiency, throughput time,
flow, waste and customer satisfaction). A high degree of competitiveness is one of the desired
results of performance (Laamanen & Tinnilä 2009, 118).
Weele (2005, 264) states that purchasing performance measurement is important since it may
additionally lead to a greater recognition by all other business functions. When applied
effectively, it may lead to better communication with other disciplines, better decision-making,
higher motivation of staff involved and a greater transparency of the company’s dealings with
suppliers. Objective performance measurement is, however, in many cases a difficult matter
since it is consequent upon poor definitions and poor planning. Moreover, information systems
may not support the data gathering and reporting structures required (Weele 2005, 264).
In measuring purchasing performance Weele (2005, 265) suggests focusing on both purchasing
effectiveness and efficiency. Purchasing effectiveness is covered by three key areas; purchasing
materials costs and prices, total quality control, and purchasing logistics. Purchasing efficiency is
related to the resources that are needed to realize predetermined targets and plans encompassing
the purchasing organisation, i.e. purchasing staff, management, procedures, and guidelines and
information systems. For each of these key areas a number of tools such as monitoring reports
34
and performance indicators can be selected. These enable a holistic view of how purchasing has
performed. Actual performance needs to be compared with standards. (Weele 2005, 265)
Halachmi (2005, 505-506) claims that in order to improve performance there is a need to manage
performance rather than simply measure any given aspect of it across the board. Management of
performance can mean in some cases measurement of effectiveness and efficiency, in others it
may mean management of important stakeholders or the organisational relations with them. In
other cases, management of organisational culture and motivation may be the key to improve
performance. Halachmi (2005, 502) points out that resorting to performance management is in
fact a return to the basic concept of management that assures that there is a need to do something
in order to assure that the use of resources results in the attainment of desired goals.
However, can measuring output, short-term-outcomes or any other indicators bring about, all by
themselves, an improvement in performance? Halachmi (2002, 373) has offered a list of reasons
in support of introducing performance measurement as a promising way to improve
performance. Examining this list suggests that doing performance measurement right may be an
impossible task. It seems extraordinarily difficult and often unreliable to measure phenomena as
complex as performance. Today’s organisations are rapidly changing, thus results and measures
quickly become obsolete. Translating human desires and interactions to measurement is
impersonal and even heavy handed (Halachmi 2005, 504).
Changes in customer requirements, particularly related to speed, reliability and quality, have
profoundly affected performance measurement in supply chains. In many industries, on-time
deliveries have become an order-qualifier, short lead times and six sigma quality in delivered
items the norm (Brown et al. 2001, 317-318).
3.1 Value of Information
Information is data in context of a business or organisation and it is derived from the analysis of
data. Good information allows managers to make decisions on the basis of facts, not opinions. It
is important to gather the right information, because having too much data can be as bad as not
having any. According to Evans and Lindsay (2005, 372, 374), the aim of measurement and
analysis is to guide an organisation toward the achievement of key business results and strategic
objectives, and to anticipate and respond to rapid or unexpected internal or external changes.
Dealing with data and information should be addressed from a process perspective, and total
35
quality concepts can be applied to the generation, analysis, and use of data and information. This
Chapter examines the concept of value in information management.
Considerable value lies in using objective data as a basis for problem solving and decision
making. Often measurement activities are seen only in terms of outputs from the production
system. This limited approach is a mistake because a broad base of measurements, tied together
by strong information systems, can help to align a company’s operations with its strategic
directions. Evans and Lindsay (2005, 374) bring up a good analogy for information systems
within an organisation as the central nervous system in the body. The central nervous system
sends messages to and from the brain to various points in the body where the work gets done.
Effective information systems provide the right information to the right people at the right time.
By having a central source of information accessible to everyone, individuals in the order-
delivery process can have correct input at the right time and everyone can share information for
solving problems. Empowered individuals with the right information can make more timely
decisions and can take action to better serve customers (Evans & Lindsay 2005, 374).
Good data and information management provide many benefits (Evans & Lindsay 2005, 375) as
they help the company to understand customers and provide feedback to workers to verify their
progress establishing a basis for reward and recognition. Moreover, good information
management helps to assess progress and the need for corrective action, and finally to reduce
costs through better planning and improvement actions. Fawsett et al. (2009, 226) propose that
an organizational-culture based willingness to share information is a relatively scarce resource
that can lead to a competitive advantage for a firm.
In order for a company to be successful the importance of data and information in strategic
planning and daily customer-focused decision-making needs to be recognized. According to
Evans and Lindsay (2005, 375-378) some of the key leading practices can be summarized as
follows. All these practices encourage “management by fact” that is one of the key elements of
TQ:
1. Develop a comprehensive set of performance indicators that reflect internal and external
customer requirements and the key business drivers
2. Use comparative information and data to improve performance and competitive position
3. Involve everyone in measurement activities and ensure that performance information is
widely visible
36
4. Ensure that data and information are reliable and accessible to all who need them
5. Use sound analytical methods to conduct analyses and use the results to support strategic
planning and daily decision-making
6. Continually refine information sources and their uses within the organisation.
Analyzing information provides an idea of what really happens. The challenge is that there is
often a large volume of information available and finding and managing the most applicable
information can prove difficult (Laamanen & Tinnilä 2009, 70, Lecklin 2006, 263). The
challenge is how to aggregate the information to serve as an aid in decision-making,
improvement, action and reward. Numerical information can be processed using statistic
methods, such as by calculating averages, uncertainties and deviations. The presentation of
information in, for example tables (differences), trend graphs, and two-factor graphs
(correlations), plays a significant role. Qualitative information is often processed by
classification and drafting summaries, reviews or conceptual analysis.
3.2 Designing an Effective Performance Measurement System
To generate useful performance measures, a systematic process is required. Evans and Lindsay
(2005, 393-394) say that organisation does not have to have one set of performance measures
that everyone produces and reports, but rather, measures are used where they are most
appropriate. Information that supports review of organisational-level performance is passed on to
the corporate level.
Key performance measures should be aligned with strategies and action plans (Evans & Lindsay
2005, 388). A balanced scorecard approach helps in identifying the right measures by aligning
them with the organisation’s vision and strategy. Effective performance measures that are
aligned with business strategy are driven by factors that determine what is important to the
success of the business. Balanced scorecards often fail for a variety of reasons, including
incorrectly identifying the real drivers of customer satisfaction; not defining measures
appropriately to focus attention on the places within a process where they will have the greatest
impact, process limitations, and improvement capabilities (Evans & Lindsay 2005, 387). Thus,
organisations must carefully design their performance measurement systems.
The purposes of a performance measurement system include the following:
• Providing direction and support for continuous improvement
37
• Identifying trends and progress
• Facilitating understanding of cause-and-effect relationships
• Allowing performance comparison to benchmarks
• Providing a perspective of the past, present, and future.
In addition, they should be intelligible to a majority of employees, provide real-time information
for decisions, and support personal and organisational learning (Evans & Lindsay 2005, 386).
Mark Graham Brown suggests (in Evans & Lindsay 2005, 390) that the fewer the better.
Measures should be linked to the factors needed for success, such as the key business drivers. In
addition, measures should include a mix of past, present and future including targets or goals that
are based on research instead of arbitrary numbers.
Lecklin (2006, 153) states that process metrics should be reliable, unambiguous, understandable,
easy-to-use, just, economical, fast and relevant. The metrics should be clear leaving no room for
different kinds of interpretations of their results. The number of metrics per process should be
kept low, so that the key aspects of the process are measured. If the pay of the employees is
dependent on the results of a metric, those people have to have a way of affecting the results of
the metric. Gathering the data for the metric must not be expensive and one has to be able to
gather the data first. A good metric guides the future performance of the company.
Kankkunen et al. (2005, 210) note that the process measures have to reflect those issues the
customer sees important. A key question in process measurement is whether to measure
organisational functions/units, processes or both. By measuring processes, large improvements
can be reached in customer satisfaction and loyalty. However, these improvements do not come
for free. An organisation has to have the necessary capabilities and culture for the process
management orientation to succeed.
Many organisations make two fundamental mistakes: not measuring the key characteristics
critical to company performance or customer satisfaction, and taking irrelevant or inappropriate
measurements. In the first case, the organisation often fails to meet customer expectations or
performance goals. In the second, the measurement system directs attention to areas that are not
important to customer, thus wasting time and resources. The number of performance indicators
seems to grow with the size and complexity of the organisation. In many organisations,
performance indicators have been around for a long time, and few managers can probably say
38
where, when, and why they developed. In most cases, somebody just decided they were good to
have (Evans & Lindsay 2005, 386-387).
At the process level, quality indicators focus on the outcomes of processes. A common indicator
of manufacturing quality is the number of nonconformities per unit, or defects per unit. In
services, it is errors per opportunity. Each customer transaction provides an opportunity. Thus, a
common measure is dpmo, defects per million opportunities. (Evans & Lindsay 2005, 390)
As has been covered, the clear characteristics of good logistics and process measures can be
found. However, if one extends the perspective on the measurement of entire supply chains, the
situation appears to be different. Although many companies have recently realized the potential
of SCM, they often lack the insight of developing an effective measurement scheme to achieve a
fully integrated supply chain. However, taken the focus of the study into account, a more
thorough coverage of these measures is not required.
3.3 Analyzing and Using Performance Data to Create Quality Control
All the data support operational-level decisions, leadership performance reviews, priority setting,
and strategic planning. However, simply reporting numbers or showing them on graphs and
charts is not enough. Data require sound analysis to turn them into information. Analysis refers
to an examination of facts and data to provide a basis for effective decisions. Evans and Lindsay
(2005, 395) mention examples of possible analyses such as examining trends and changes,
making comparisons relative to other business units or best-in-class benchmarks, calculating
statistical measures, and seeking to understand relationships among different performance
indicators. An organisation needs a process for transforming data into information that top
management can understand and work with (Evans & Lindsay 2005, 396) in order to create
quality control methods.
Quality control entails all activities and decisions aimed at taking the organisation’s products and
services to the desired quality level and maintaining that level. This is to make sure that the
quality requirements are met and to be able to demonstrate this objectively. This implies that for
every transaction between the customer and supplier, they need to agree on the basic
requirements of the transaction, the way in which the requirements are to be realized, how to
check that the requirements are fulfilled, and the measures to be taken when the
requirements/expectations are not met (Weele 2005, 192). Therefore, quality control requires
intensive consultation and sound tuning between the various departments in the organisation and
39
with the outside supplier and customer. After the desired quality level has been established, the
complete production process must be organised in such a way that this level of quality is reached
and maintained in a controllable manner. To accomplish this, quality management has at its
disposal four inter-related functions: setting standards, assessment, control, and assurance.
(Weele 2005, 193)
Seven commonly known tools for quality control are often connected with quality improvement.
Coverage of the purpose and use of at least some of these tools is an integral part of any
literature related to quality improvement. The seven tools are: check sheets, flowcharts, control
charts and pareto charts, cause-and-effect diagrams, scatter diagrams and histograms (e.g. Brown
et al. 2001. 322-323; Evans & Lindsay 2005, 641-657; Clark 1999, 75-92; Ho 1999, 164-172;
Lecklin 2006, 175-187). Check sheets, pareto charts ad histograms are more related to
classification of identified incidents or problems. Cause-and-effect diagrams are used for
visualising the smaller subcomponents of a larger problem, i.e. for understanding the nature and
components of a seemingly large and difficult problem. Flowcharts are used for mapping
processes, determining the flow of the process with the help of standardised graphical symbols.
Scatter diagrams are used for depicting the correlation between two variables. Finally, control
charts are used in statistical process control of processes, where the performance of the process is
measured against specified control limits.
Wilson and Pearson (1995, 12) argue that although the seven tools are widely applied, the use is
adequate only for resolving minor or simple problems. The underlying reason is that they have
quality control, not quality improvement as their origin, and are therefore stretched beyond their
original and intended purpose. Wilson and Pearson (1995, 12) point out that it would be hard to
imagine any meaningful improvement project being launched without first performing root-
cause analyses to learn the real reasons or obstacles behind poor performance. Therefore, the
“root cause analysis effort must integrate with an effective fault detection system (input) and
sound, corrective, adaptive, and preventive action system (output)”. Root-cause analysis is an
approach that is heavily related to continuous improvement efforts.
The underlying main principles and ideas behind continuous improvement are well documented
in literature. However, companies fail to achieve long-term results from their continuous
improvement practices. Wilson (1996, 46) argues that this fact stems primarily from two issues.
The first is related to the organisational commitment for continuous improvement of quality in
order to achieve consistent results. The second issue is that companies do not always have the
40
necessary tools in place to achieve improvement. Many of the tools meant for continuous
improvement were designed in the 1950s and reflect more the then prevalent quality control
discipline, as opposed to the current objectives of quality improvement. Therefore, companies
need new tools to enable continuous improvement.
In addition to the discussion on using the performance measures, Laamanen and Tinnilä (2009,
117-118) note that the capability of a process is related to its “enabling and constraining factors’
and approaches”. These include materials and information, methods and procedures, and
resources like time, money, skills, equipment and machines plus the environment and outside
circumstances. Thus, the actual performance is linked to the determination and creativity of the
people involved in deploying the best approaches throughout the process.
3.4 Continuous Improvement
Change can improve performance only if a process’ activities are carried out in a new way that
produces better results (Laamanen & Tinnilä 2009, 79). From a developmental standpoint, the
simplest thing to do is to identify the problem and agree on the corrective measures to be taken.
This is effective in solving simple problems. However, this approach leads to a reactive
operating and in many cases the real causes of the problem are never addressed. Consequently,
the problems are not solved, but repeated in a variety of forms and eventually accepted as part of
the organisational routine. Effective changes in the operating method are realised through a
development project (Laamanen & Tinnilä 2009, 80).
The importance of information analysis is traditionally emphasised in continuous improvement.
Typical continuous improvement models can be found in quality theories, such as Statistical
Process Control (SPC), Six Sigma as Design-Measure-Analyze-Improve-Control (DMAIC),
Deming’s Plan-Do-Check-Act (PDCA) and Kaizen. A large number of analysis tools, such as
pareto, fishbone and flow charts, have been developed to support these models (Laamanen &
Tinnilä 2009, 80).
The improvement of a process has to start with an analysis of the present state of the process
against its objectives and customer feedback. The ultimate objective of a process is to provide
outputs for the customers of the process. A definite requirement in the development of any
process is the usage of customer feedback. In order to be able to do this, the customers of the
process, the outputs and results of the process and the performance of the process have to be
known and measured (Lecklin 2006, 141-143).
41
This information is used in the next phase where decisions are made about the improvements that
are needed for better performance of the process. On a general level, and depending on the
nature of the process, there are different methods for acquiring data to support the decision-
making process and to determine which measures are needed for performance improvement.
These methods include for example brainstorming, analyzing the process flows, analyzing the
cost structure of the process, benchmarking, problem-solving and constant follow-up of process
performance (Lecklin 2006, 141-153). After the needed analyses and measurements are
performed, and the problems solved, decisions have to be made on what kind of improvement
measures to implement. Measures can be for example changes in the flow of the process, internal
changes in a particular phase of work, changes in the management system or some combination
of these (Lecklin 2006, 191-196).
When choosing between different options of improvement, focus has to be laid especially on the
improvement potential of the measure and the implications of the measure on customer
satisfaction. The capabilities of the organisation to implement the proposed changes have to be
evaluated especially in terms of costs, length of implementation, effects on other processes,
information technology requirements and the acceptance of those commonly participating in the
process. After the most suitable option has been decided on, an improvement plan is drawn up.
(Lecklin 2006, 193-194).
Continuous improvement is a management philosophy where quality improvement is seen to be
a never-ending process of incremental steps instead of onetime radical improvement efforts. A
key aspect in continuous improvement is setting demanding, but achievable objectives and
comparing progress to these objectives. Continuous improvement is an integral part of TQM.
3.4.1 Kaizen, the Process of Gradual and Incremental Improvement
The Japanese term for continuous improvement is called Kaizen (Brown et al. 2001, 318-319,
Manos 2007, 47). Kaizen has long been recognized as a key factor in the success of Japanese
companies. In the broader sense, Imai (1986, 15) defines Kaizen as “the process of gradual and
incremental improvement in a pursuit of perfection of business activities”. In this strategy
continuous improvement is considered to be everybody’s job in an organisation, in that any
employee must do his/her job and improve it. According to Kaizen, not a single day should go by
without some kind of improvement being made somewhere in the organisation. Total quality
management is viewed as an integral element in the Kaizen strategy (Alsmadi 2009, 203).
42
Most existing literature identifies Kaizen with three main ideas. First, it is continuous, i.e. an
ongoing, inbuilt practice and not a strategic add-on. Second, it is incremental, i.e. accumulating
through small changes. Finally, it is participative, i.e. it is built on active work force
involvement. The Said Business School researchers (Brunet and New 2003, 1426) define Kaizen
as “pervasive and continual activities” which are extra to specific, contracted duties and which
involve activities each individual believes contribute to the organisational success. A Kaizen
event is a focused and structured continuous improvement project, using a cross-functional team
to address a targeted work area, to achieve specific goals (Doolen et al. 2008, 639).
Over the past 20 years the model has received much attention and growing support in literature
and by experts worldwide. For example Manos (2007, 47) indicates that the Kaizen benefits
include more time and money savings with reduced inventory cost. Neese (2007, 50) suggests
that Kaizen helps to improve work processes and implement lean manufacturing throughout the
supply chain. Wilcox and Morton (2006, 23) view Kaizen as a strategy to reduce energy
consumption and waste, and yet improve productivity in targeted activities and processes.
Gopalakrishnan (2006, 22) finds that the Kaizen strategy is used to improve the quality of
technical communications in the workplace. Chan et al. (2005, 71) says that companies should
adopt the Kaizen model to improve competitiveness and deal with the increased competition
thereby satisfy customers.
Alsmadi (2009, 204) has revisited Kaizen to evaluate its contribution to competitiveness in
organisations. Alsmadi concludes that, if properly implemented, the Kaizen model can
substantially contribute to continuous improvement and, thus, drive organisations for high
competitiveness without the need for major investment. Alsmadi also shows that the success of
the Kaizen model is not always guaranteed, as the work environment and organisational culture
can be the important variables in its implementation. Based on the findings of the literature view
by Alsmadi (2009, 203-211) the Kaizen strategy has long been recognized as a major factor in
the success of Japanese businesses. Many Western companies implementing Kaizen in their
work settings have found favourable results, mainly in cost savings and improved
competitiveness. Clearly, this indicates that the Kaizen can fit into everyday management
practices in organisations. The inspiring theme of Kaizen is that there is always room for
improvement. In a highly competitive business environment, this can put the organisation ahead
of competition (Alsmadi 2009, 209).
43
However, the effective implementation of the Kaizen strategy requires a change in management
attitudes. Organisation members should be empowered to participate in setting targets for
process improvement. This calls upon management to develop a culture within the organisation
that can support the implementation of the Kaizen strategy. The Japanese companies have
practiced large-scale absorption of new technology but have invested heavily in their people at
the same time (Krüger 1996, 11). The Japanese management way is to concentrate more on
making permanent improvement in the work processes to raise their effectiveness and
productivity (Krüger 1996, 12). This means making small-scale continuous improvement and
changes to the existing production system.
The Said study (Brudet and New 2003, 1428) highlights a number of points that explain
Kaizen’s success in Japan and difficulties in applying it in Western companies. First,
employment practices such as lifetime contracts, rewarding seniority and performance bonuses
accounting for as much as 30 percent of salary make workers’ interests inextricable from those
of the company. Second, Kaizen is self-fulfilling, i.e. once it is in place it becomes an embedded
way to think about working practices and to carry those practices out that embrace change. In
Western companies nobody can expect a job for life. Against this background, it is clear that
Western managers face challenges when trying to implement Kaizen to make it an everyday and
sustainable practice.
3.4.2 PDCA Cycle, Connection between Productivity and Quality Improvement
Deming found in Japan that the consistent realization of improved levels of product and service
quality begets inevitably and naturally an increase in productivity. Based on this observation, he
developed his “chain reaction”. When management endeavours continuously to attain levels of
performance in the company’s work processes that are superior to any previous level, quality
will be improved. As quality improves, productivity will consequently also increase, because the
company will have less rework and not so much waste. The organisation will enjoy fewer
mistakes and defective parts, fewer delays, and fewer rejections from the customers. (Krüger
1996, 12)
Deming pointed out the direct connection between productivity and quality improvement
(Krüger 1996, 13). In order to achieve continuous business success and growth, management is
required to realize quality improvements and attain superior levels of performance in the work
processes. The consequence is that the relationship of output and the necessary inputs will be
more profitable. Investing on rework and defective parts is very costly. It is definitely cheaper to
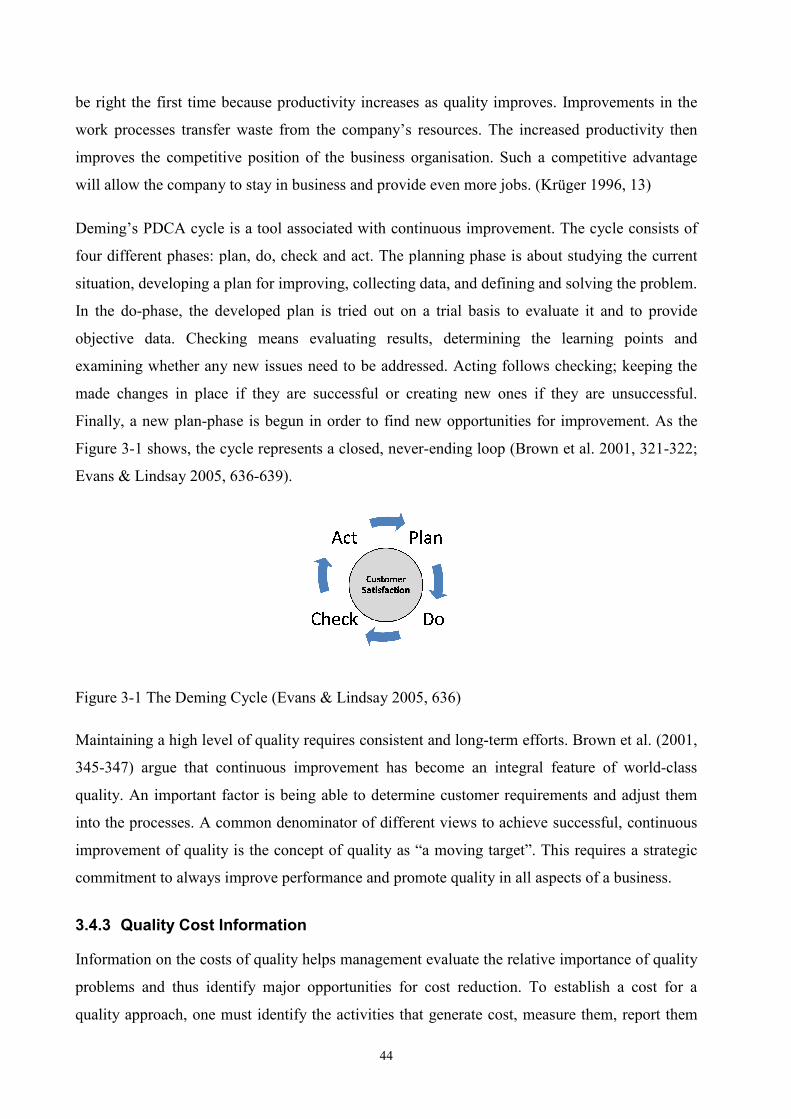
44
be right the first time because productivity increases as quality improves. Improvements in the
work processes transfer waste from the company’s resources. The increased productivity then
improves the competitive position of the business organisation. Such a competitive advantage
will allow the company to stay in business and provide even more jobs. (Krüger 1996, 13)
Deming’s PDCA cycle is a tool associated with continuous improvement. The cycle consists of
four different phases: plan, do, check and act. The planning phase is about studying the current
situation, developing a plan for improving, collecting data, and defining and solving the problem.
In the do-phase, the developed plan is tried out on a trial basis to evaluate it and to provide
objective data. Checking means evaluating results, determining the learning points and
examining whether any new issues need to be addressed. Acting follows checking; keeping the
made changes in place if they are successful or creating new ones if they are unsuccessful.
Finally, a new plan-phase is begun in order to find new opportunities for improvement. As the
Figure 3-1 shows, the cycle represents a closed, never-ending loop (Brown et al. 2001, 321-322;
Evans & Lindsay 2005, 636-639).
Figure 3-1 The Deming Cycle (Evans & Lindsay 2005, 636)
Maintaining a high level of quality requires consistent and long-term efforts. Brown et al. (2001,
345-347) argue that continuous improvement has become an integral feature of world-class
quality. An important factor is being able to determine customer requirements and adjust them
into the processes. A common denominator of different views to achieve successful, continuous
improvement of quality is the concept of quality as “a moving target”. This requires a strategic
commitment to always improve performance and promote quality in all aspects of a business.
3.4.3 Quality Cost Information
Information on the costs of quality helps management evaluate the relative importance of quality
problems and thus identify major opportunities for cost reduction. To establish a cost for a
quality approach, one must identify the activities that generate cost, measure them, report them
45
in a meaningful way to managers, and analyze them to identify areas for improvement. This
Chapter discusses these activities in greater detail.
Crosby (1984, 15) points out that it is not so much quality, as the lack of it that costs money. The
concept of quality costs can be used to launch quality improvement initiatives. In many
companies a considerable number of working hours is spent on the inspection of incoming goods
and on solving acute quality problems (troubleshooting). The costs involved are often invisible
and many companies have absolutely no idea what the lack of quality is costing them (Weele
2005, 193). Making these costs transparent starts with classifying them.
According to Evans and Lindsay (2005, 398-399) among others, quality costs can be divided into
four major categories: prevention costs, appraisal costs, internal failure costs, and external failure
costs. Prevention costs are investments made to keep nonconforming products from occurring
and reaching the customer, including the following specific costs:
• Quality planning costs, such as salaries of individuals associated with quality planning
and problem-solving teams, the development of new procedures, new equipment design,
and reliability studies
• Process control costs, that include costs spent on analyzing production processes and
implementing process control plans
• Information systems costs expended to develop data requirements and measurements
• Training and general management costs, including internal and external training,
programs, clerical staff expenses, and miscellaneous supplies.
Appraisal costs are those associated with efforts to ensure conformance to requirements,
generally through measurement and analysis of data to detect nonconformance. Categories of
appraisal costs include the following:
• Testing and inspection costs associated with incoming materials, work-in-processes, and
finished goods, including equipment costs and salaries
• Instrument maintenance costs due to calibration and repair of measuring instruments
• Process measurement and control costs that involve the time spent by workers to gather
and analyze quality measurements.
Internal failure costs are incurred as a result of unsatisfactory quality found before the delivery
of a product to the customer; some examples include the following:
• Scrap and rework costs, including material, labor, and overhead
• Cost of corrective action arising from time spent determining the causes of failure and
correcting production problems
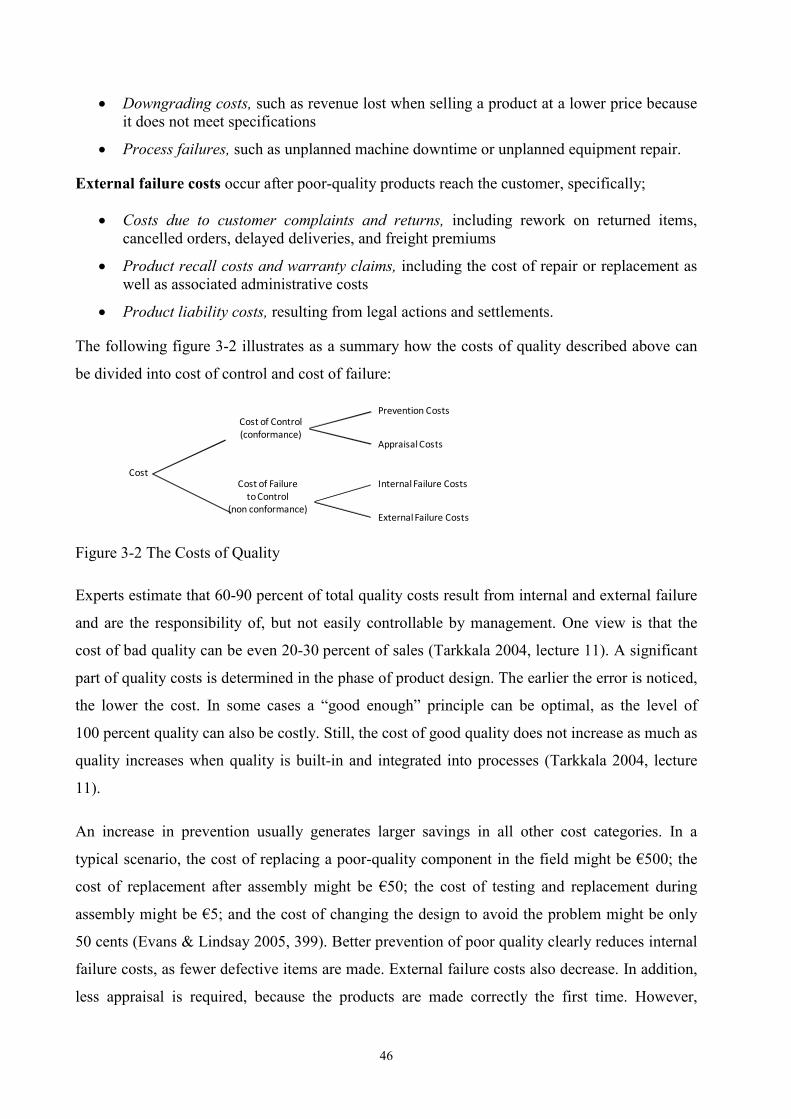
46
• Downgrading costs, such as revenue lost when selling a product at a lower price because
it does not meet specifications
• Process failures, such as unplanned machine downtime or unplanned equipment repair.
External failure costs occur after poor-quality products reach the customer, specifically;
• Costs due to customer complaints and returns, including rework on returned items,
cancelled orders, delayed deliveries, and freight premiums
• Product recall costs and warranty claims, including the cost of repair or replacement as
well as associated administrative costs
• Product liability costs, resulting from legal actions and settlements.
The following figure 3-2 illustrates as a summary how the costs of quality described above can
be divided into cost of control and cost of failure:
Cost
Cost of Control
(conformance)
Cost of Failure
to Control
(non conformance)
Prevention Costs
Appraisal Costs
Internal Failure Costs
External Failure Costs
Figure 3-2 The Costs of Quality
Experts estimate that 60-90 percent of total quality costs result from internal and external failure
and are the responsibility of, but not easily controllable by management. One view is that the
cost of bad quality can be even 20-30 percent of sales (Tarkkala 2004, lecture 11). A significant
part of quality costs is determined in the phase of product design. The earlier the error is noticed,
the lower the cost. In some cases a “good enough” principle can be optimal, as the level of
100 percent quality can also be costly. Still, the cost of good quality does not increase as much as
quality increases when quality is built-in and integrated into processes (Tarkkala 2004, lecture
11).
An increase in prevention usually generates larger savings in all other cost categories. In a
typical scenario, the cost of replacing a poor-quality component in the field might be €500; the
cost of replacement after assembly might be €50; the cost of testing and replacement during
assembly might be €5; and the cost of changing the design to avoid the problem might be only
50 cents (Evans & Lindsay 2005, 399). Better prevention of poor quality clearly reduces internal
failure costs, as fewer defective items are made. External failure costs also decrease. In addition,
less appraisal is required, because the products are made correctly the first time. However,
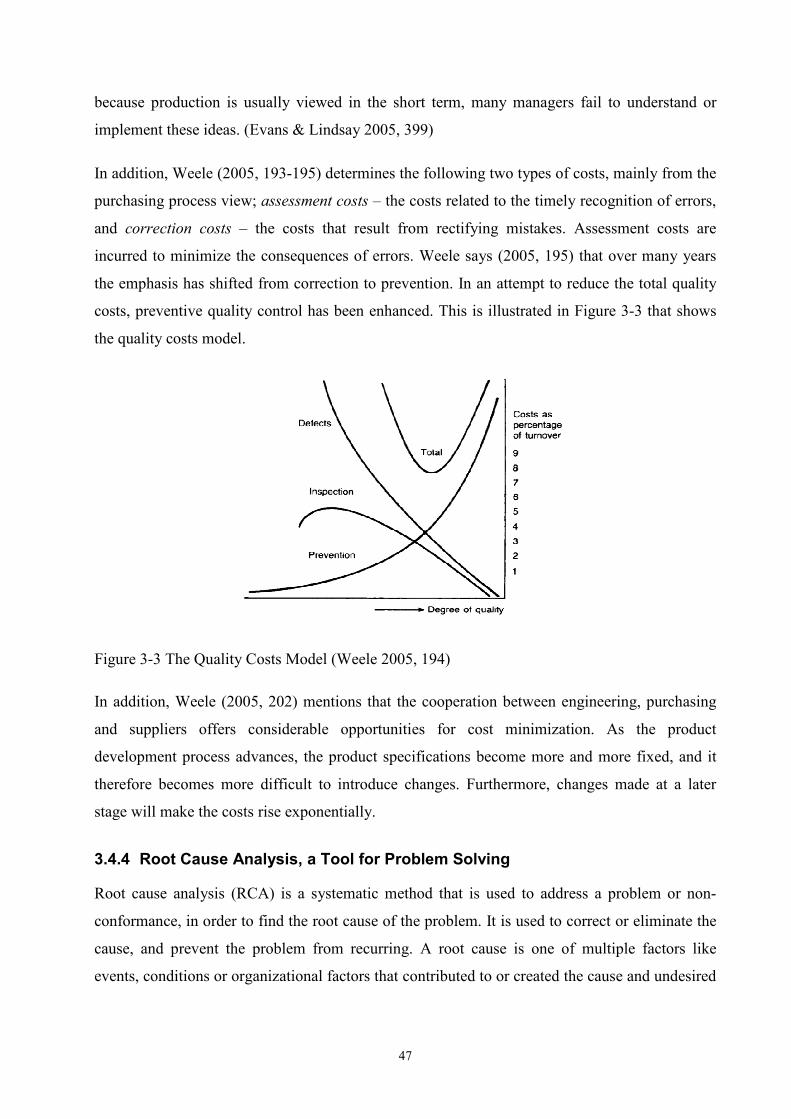
47
because production is usually viewed in the short term, many managers fail to understand or
implement these ideas. (Evans & Lindsay 2005, 399)
In addition, Weele (2005, 193-195) determines the following two types of costs, mainly from the
purchasing process view; assessment costs – the costs related to the timely recognition of errors,
and correction costs – the costs that result from rectifying mistakes. Assessment costs are
incurred to minimize the consequences of errors. Weele says (2005, 195) that over many years
the emphasis has shifted from correction to prevention. In an attempt to reduce the total quality
costs, preventive quality control has been enhanced. This is illustrated in Figure 3-3 that shows
the quality costs model.
Figure 3-3 The Quality Costs Model (Weele 2005, 194)
In addition, Weele (2005, 202) mentions that the cooperation between engineering, purchasing
and suppliers offers considerable opportunities for cost minimization. As the product
development process advances, the product specifications become more and more fixed, and it
therefore becomes more difficult to introduce changes. Furthermore, changes made at a later
stage will make the costs rise exponentially.
3.4.4 Root Cause Analysis, a Tool for Problem Solving
Root cause analysis (RCA) is a systematic method that is used to address a problem or non-
conformance, in order to find the root cause of the problem. It is used to correct or eliminate the
cause, and prevent the problem from recurring. A root cause is one of multiple factors like
events, conditions or organizational factors that contributed to or created the cause and undesired
48
outcome, but there is no underlying cause. Had a root cause been eliminated or modified, then
the undesired outcome would have been prevented.
Root cause analysis is an essential part of the philosophy of continuous improvement. According
to Dorsch et al. (1997, 271) it concentrates on the “need to locate, identify and correct
operational problems and deficiencies at their most basic source or root”. Wilson and Pearson
(1995, 12) see root cause analysis as a vital component of any improvement effort to understand
the real problems behind a given situation. Wilson et al. (1993, 3) define RCA as including a
variety of techniques, both informal and structured, which are used to determine these root
causes. RCA is a method that helps organisations to reach the objectives to focus on customer
satisfaction and the search for improvement of processes as part of the continuous improvement.
To apply RCA for problem solving it is essential to be able to make the distinction between
symptoms, and apparent and actual causes of the problem (Dorsch et al. 1997, 271). The
differences between these may be difficult to determine. A thorough detailed analysis of internal
processes and systems is required (Dorsch et al. 1997, 271). Symptoms are the manifestations of
a problem; they are not the cause of it. In a similar way, an apparent cause represents an obvious
reason for the problem, but this does not automatically qualify it to be the root cause. Only after
required analysis it can be determined whether the cause was the root cause of a problem
(Wilson et al. 1993, 10).
The usage of effective RCA techniques provides a lot of benefits for an organisation. Wilson et
al. (1993, 11-15) list many different benefits. First, the utilisation of available resources
improves, since less time is wasted on re-solving same problems attributed to the same cause.
Second, the avoidance of unnecessary disruptions is financially beneficial for an organisation.
Third, the objectivity of problem solving is likely to improve, since RCA does not leave room
for subjective decision-making. Fourth, the RCA techniques reveal the real reasons behind the
problem supporting the creation of effective, sustainable solutions. Fifth, RCA may also be
useful in preventing similar problems from arising elsewhere. Finally, the use of effective RCA
techniques contributes to the identification of improvement opportunities in general.
The effectiveness of the chosen implemented solution to tackle the root cause cannot be
determined immediately. In general, the effectiveness of the applied RCA methods can be
determined based on performance development, i.e. whether the organisation is finding, fixing
and preventing problems more efficiently than before (Wilson et al. 1993, 102-103). In fact, the
49
diagnosis only discovers potential root causes, but it is only the effectiveness of the solution that
finally determines whether the root cause was identified or not. There can also be many root
causes to a problem, not only one.
The utilisation of RCA requires a disciplined and logical approach to problem solving. An
ongoing, effective approach has to combine the use of traditional managerial methods with the
application of specific RCA techniques (Dorsch et al. 1997, 276). Here, the underlying
perspective is that different problem solving tools complement rather than exclude one another.
For example statistical process control (SPC) has been combined with RCA.
3.4.5 Six Sigma
The popular quality improvement method of Six Sigma has many identical characteristics with
the previously mentioned quality improvement models, but has more emphasis on statistical
methods and partly also customer requirements. Widely accepted definition of Six Sigma can be
described as a business improvement approach that seeks to find and eliminate causes of defects
and errors in processes by focusing on outputs that are critical to customers and a clear financial
return for the organisation. Six Sigma is based on a statistical measure that equates to 3.4 or
fewer errors or defects per million opportunities. (Leckin 2006, 203 and Evans & Lindsay 2005,
486-488)
General Electric’s problem solving approach, DMIAC, is often related to Six Sigma methods. It
follows project methodologies inspired by Deming's PDCA Cycle. According to Evans and
Lindsay (2005, 488-492) the five phases of DMIAC are in brief as follows:
1. Define: identify customers and their requirements that have the most impact on quality
and set up a project to tackle these.
2. Measure: determine how to measure the process, what is its current performance and
identify those internal processes that impact the customers’ requirements.
3. Analyse: determine the most likely cause of defects, seek the root cause.
4. Improve: identify the practices to remove the causes of defects.
5. Control: determine how to maintain the improved performance; standard operating
procedures, training, checklists, statistical process control charts.
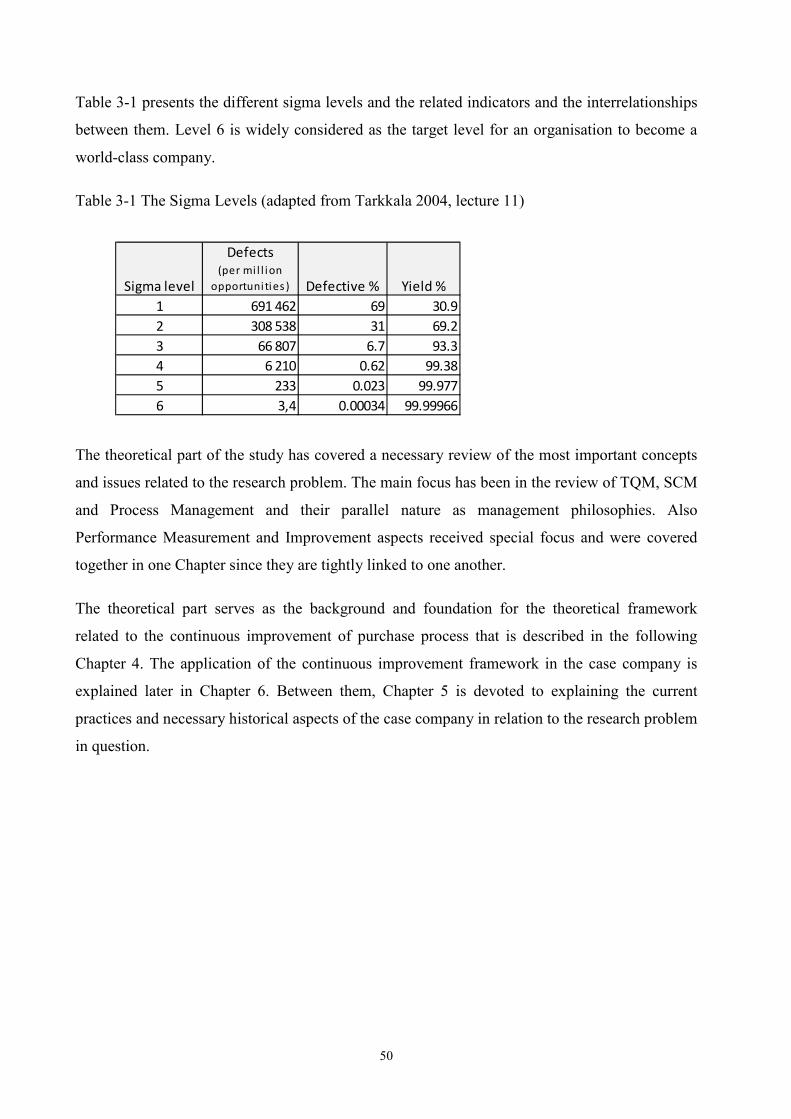
50
Table 3-1 presents the different sigma levels and the related indicators and the interrelationships
between them. Level 6 is widely considered as the target level for an organisation to become a
world-class company.
Table 3-1 The Sigma Levels (adapted from Tarkkala 2004, lecture 11)
Sigma level
Defects
(per mi l l ion
opportunities ) Defective % Yield %
1 691 462 69 30.9
2 308 538 31 69.2
3 66 807 6.7 93.3
4 6 210 0.62 99.38
5 233 0.023 99.977
6 3,4 0.00034 99.99966
The theoretical part of the study has covered a necessary review of the most important concepts
and issues related to the research problem. The main focus has been in the review of TQM, SCM
and Process Management and their parallel nature as management philosophies. Also
Performance Measurement and Improvement aspects received special focus and were covered
together in one Chapter since they are tightly linked to one another.
The theoretical part serves as the background and foundation for the theoretical framework
related to the continuous improvement of purchase process that is described in the following
Chapter 4. The application of the continuous improvement framework in the case company is
explained later in Chapter 6. Between them, Chapter 5 is devoted to explaining the current
practices and necessary historical aspects of the case company in relation to the research problem
in question.
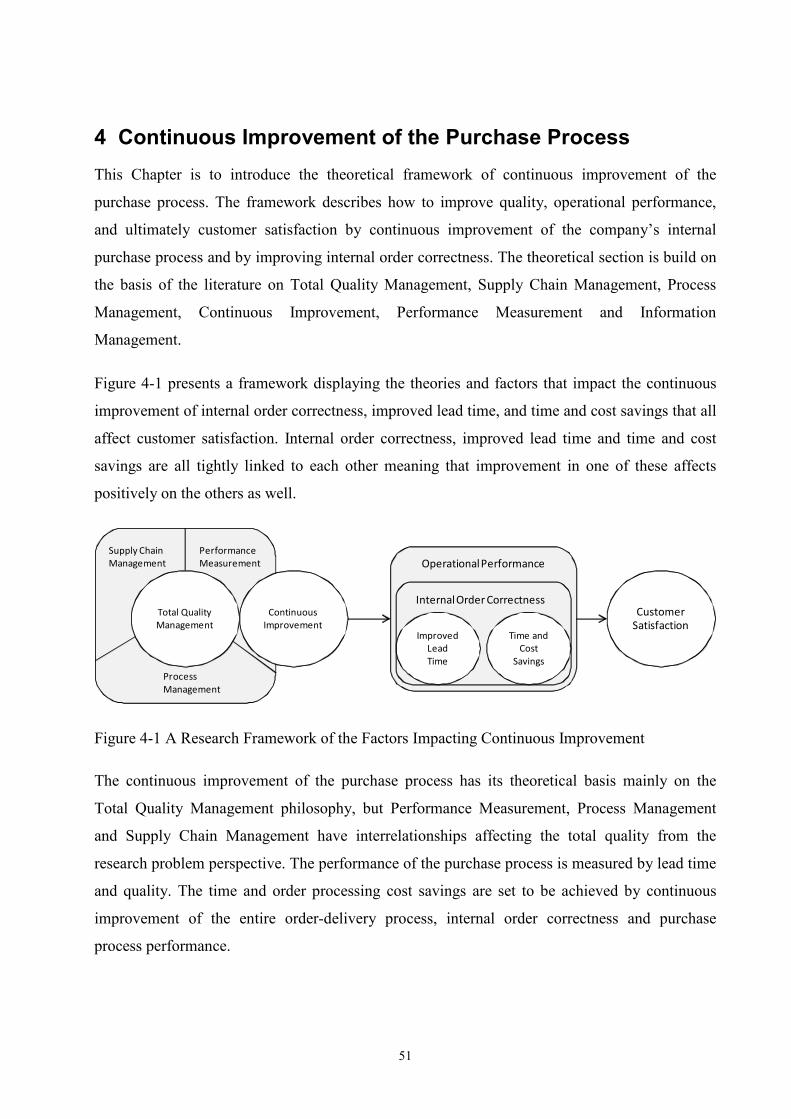
51
4 Continuous Improvement of the Purchase Process
This Chapter is to introduce the theoretical framework of continuous improvement of the
purchase process. The framework describes how to improve quality, operational performance,
and ultimately customer satisfaction by continuous improvement of the company’s internal
purchase process and by improving internal order correctness. The theoretical section is build on
the basis of the literature on Total Quality Management, Supply Chain Management, Process
Management, Continuous Improvement, Performance Measurement and Information
Management.
Figure 4-1 presents a framework displaying the theories and factors that impact the continuous
improvement of internal order correctness, improved lead time, and time and cost savings that all
affect customer satisfaction. Internal order correctness, improved lead time and time and cost
savings are all tightly linked to each other meaning that improvement in one of these affects
positively on the others as well.
Total Quality
Management
Performance
Measurement
Process
Management
Supply Chain
Management
Continuous
ImprovementImproved
Lead
Time
Time and
Cost
Savings
Internal Order CorrectnessCustomer
Satisfaction
Operational Performance
Figure 4-1 A Research Framework of the Factors Impacting Continuous Improvement
The continuous improvement of the purchase process has its theoretical basis mainly on the
Total Quality Management philosophy, but Performance Measurement, Process Management
and Supply Chain Management have interrelationships affecting the total quality from the
research problem perspective. The performance of the purchase process is measured by lead time
and quality. The time and order processing cost savings are set to be achieved by continuous
improvement of the entire order-delivery process, internal order correctness and purchase
process performance.
52
5 Current Practices in the Case Organisation
In Chapters 5 and 6 the theoretical framework presented previously is applied to a real-life case.
Due to confidentiality reasons the name of the case company is not revealed. For the same reason
some parts of the case organisation’s description have been stripped down somewhat. It must be
noted that the working roles and process steps are covered mainly with the means of details and
issues that are relevant to the research problem.
Chapter 5 starts with an introduction to the case company and the case organisation. After the
essentials of the company are covered, the working roles and the processes of the case
organisation are introduced. Finally, in Chapter 6 the empirical case study and the results of it
are presented.
5.1 The Case Organisation in a Nutshell
The case company is a global telecommunications network solutions and equipment supplier. It
is one of the leading companies in its field providing telecommunications hardware, software
and services. The company operates in approximately 150 countries worldwide and employs
about 60 000 people. Its major manufacturing sites are in China, Finland, Germany, Poland and
India. The customer base includes about 600 customers around the world. About 1 billion people
are connected through its networks.
For the full year of 2009 the company ended with 12.6 billion euros in net sales, a decline of
about 18% compared to 2008. The company has radically decreased its operating expenses, in
2009 by more than 16% compared to the same time in 2008. In 2010 the company launched a
new organisational structure that is said to focus on customers’ needs and is a part of a company-
wide change to drive the company forward in becoming faster, simpler, more empowered, and
more customer-focused.
The empirical study has been conducted in a case organisation that is a part of the Operations
business unit of the case company. The Operations is responsible for the supply chain
management for all hardware and software for OEM (Original Equipment Manufacturer)
products. This includes manufacturing, immaterial product supply, supply planning, direct
sourcing and procurement and logistics as well as design for the demand supply network and the
delivery capability creation in the product programs.
53
The Operations meets customer requirements of right quality, short order lead times and
competitive cost by implementing modular supply chain models, developing delivery capability
and capacity flexibility, and creating transparency in end-to-end inventory and ordering. These
are measured by for example delivery performance (on-time-delivery, lead times), continuous
product cost reduction, asset efficiency (inventories) as well as by quality and customer
satisfaction.
As a part of the business unit the case organisation is responsible for delivering all integrated
OEM, digital products and global services as a part of the case company’s service and solutions
supply chain. The mission of the case organisation is to set up a supply chain with a strong
customer and end-to-end process orientation with the best industry processes and performance to
ensure customer delight, while remaining agile and cost effective. The value added by the case
organisation is an agile demand fulfilment with logistical excellence, cost efficient delivery and
customer front-end focused order engineering to meet customer expectations. The intention is to
provide best customer value with a service oriented supply chain. The business contribution
targets of the case organisation have been set to be as follows:
• Customer- and market-focused;
� Continuous alignment of market and customer requirements with internal strategy
� High customer satisfaction through short lead times, reliable and flexible delivery
commitment and fast responsiveness
� Single point of contact to simplify customer team and stakeholder interface
• Cost effectiveness;
� Optimized value add split along end-to-end OEM supply
• End-to-end process thinking and acting
• Fast decision-making (agile)
� Lean and agile organisation to adapt continuously to the changing business needs
and requirements
� Streamlined process implementation by reusing operative resources in several
roles
� Close interface to service and sales to ensure optimal information flow.
54
To sum it up, the case organisation’s intention is to provide integrated OEM deliveries of highest
quality, at competitive costs and with logistical excellence.
Providing integrated OEM deliveries means offering customers solutions that solve specific
customer problems. The system solution typically consists of the company’s own hardware and
software products manufactured at the company’s local plant, 3rd party system hardware supplied
by one or several OEM vendors, and different software elements, installation and integration into
the customer’s infrastructure, customization and care that can be either internally developed or
sourced from external vendors. Essentially, all the system deliveries are configured to
specifically meet each individual customer’s needs and, thus, all of the deliveries are different
from each other. The wide variety of product combinations and configurations make the order
handling, purchasing and delivery very complicated tasks.
The different products are not presented in this study because of their complexity and as they are
not so relevant in solving the research problem. However, in general level, two main product
business modes can be perceived; Global Procurement and Consulting and System Integration
(CSI). The CSI business comprises consulting, systems integration, applications solutions and
security lines of business that provide services to customers. The CSI business ordering process
has its own characteristics that are apart from other product businesses’. Therefore, CSI is
mentioned later relating to incorrect orders.
The solutions are currently sold primarily to mobile network operators, but in the future the
company intends to increase the share of solutions provided to fixed network operators as well as
service providers and large enterprise customers. The challenge is how to tailor the demand
chain according to the distinct needs and characteristics of specific customer segments. The
demand chain architecture must be robust in order to apply different demand chains in different
customer situations.
5.2 Global Order Process for 3rd Party Products
The global order process for 3rd party products starts from Order Management related tasks in the
Customer teams. In general the Customer teams configure the order and enter it into the system.
The Logistics Coordinator handles the sales order and releases it for purchasing to the Buyer. In
the procurement step, the Buyer from the Purchasing team creates the purchase orders for the
suppliers. After production, assisted by the Buyer the Logistics Coordinator arranges shipping
when the goods are ready and finally the Customer team coordinates the end customer delivery
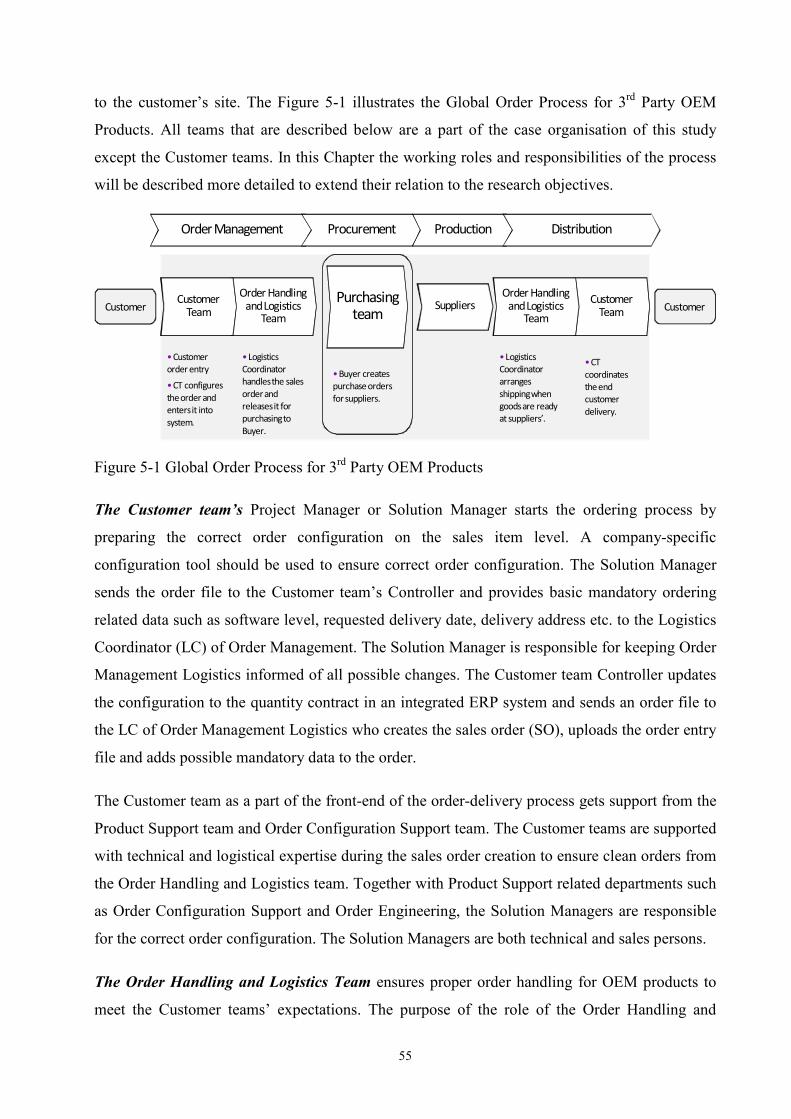
55
to the customer’s site. The Figure 5-1 illustrates the Global Order Process for 3rd Party OEM
Products. All teams that are described below are a part of the case organisation of this study
except the Customer teams. In this Chapter the working roles and responsibilities of the process
will be described more detailed to extend their relation to the research objectives.
Order Management Procurement Production Distribution
Order Handling and Logistics
Team
Purchasing team
Customer Team
Suppliers
•Customer
order entry
•CT configures
the order and
enters it into
system.
•Logistics
Coordinator
handles the sales
order and
releases it for
purchasing to
Buyer.
•Buyer creates
purchase orders
for suppliers.
•Logistics
Coordinator
arranges
shipping when
goods are ready
at suppliers’.
•CT
coordinates
the end
customer
delivery.
Order Handling and Logistics
Team
Customer TeamCustomer Customer
Figure 5-1 Global Order Process for 3rd Party OEM Products
The Customer team’s Project Manager or Solution Manager starts the ordering process by
preparing the correct order configuration on the sales item level. A company-specific
configuration tool should be used to ensure correct order configuration. The Solution Manager
sends the order file to the Customer team’s Controller and provides basic mandatory ordering
related data such as software level, requested delivery date, delivery address etc. to the Logistics
Coordinator (LC) of Order Management. The Solution Manager is responsible for keeping Order
Management Logistics informed of all possible changes. The Customer team Controller updates
the configuration to the quantity contract in an integrated ERP system and sends an order file to
the LC of Order Management Logistics who creates the sales order (SO), uploads the order entry
file and adds possible mandatory data to the order.
The Customer team as a part of the front-end of the order-delivery process gets support from the
Product Support team and Order Configuration Support team. The Customer teams are supported
with technical and logistical expertise during the sales order creation to ensure clean orders from
the Order Handling and Logistics team. Together with Product Support related departments such
as Order Configuration Support and Order Engineering, the Solution Managers are responsible
for the correct order configuration. The Solution Managers are both technical and sales persons.
The Order Handling and Logistics Team ensures proper order handling for OEM products to
meet the Customer teams’ expectations. The purpose of the role of the Order Handling and
56
Logistics team’s Logistics Coordinator (LC) is to ensure sales order confirmation respecting the
requested delivery date and to ensure on-time delivery of a sales order according to the
confirmed delivery date. The Logistics Coordinator is responsible for managing material flow
tasks like delivery management, order management, export and invoicing. A major part of the
LC’s work is to develop the relationships with customer teams in different regions by close
communication and to advice customer teams in OEM order handling. In addition, the LC is
responsible for order checking and enquiring missing information from the Customer teams’
Logistics, such as ERP system related data, order data and customer and supplier specific data.
The Order Handling and Logistics Team’s Line Manager’s main target in the role description is
clean orders.
The Logistics Coordinator carries out a logistics check for the sales order including tracking,
scheduling and monitoring sales orders in the ERP system. The LC releases a special block in the
system when the sales order is ready for purchasing from technical (order configuration) and
logistics (plants, shipping points, delivery grouping, mandatory information required by
suppliers available) perspectives. Other LC specific tasks include informing the site address to
the Buyers, carrying out delivery creation, picking, packing, post goods issue and invoicing and
shipping the goods to the end customer or passing the documentation to be prepared for shipment
when goods are ready.
The Order Handling and Logistics team is responsible for holding the sales order as long as the
order content is correct, including information about plants, shipping points, item categories,
delivery grouping and all the mandatory information needed for purchasing. Mandatory
information includes for example site address in orders containing physical items from several
vendors, deal identification number and discount percentage if special pricing is agreed with one
vendor, any special arrangements, and different delivery address in pre-installation cases.
The Purchasing team as a part of the case organisation specializes in optimizing and executing
the supply chain for OEM products, meaning hardware, software and services purchased from 3rd
party vendors. The Purchasing team is responsible for the supplier interface in the organisation
and the continuous development of this function to enable the growing OEM business to make
use of best-in-class procurement processes and performance.
The Buyer from the Purchasing team is responsible for the procurement data management of all
hardware and software needed in the 3rd party customer projects. The work includes receiving
57
orders, purchasing from 3rd party vendors, related logistics activities and management of the
supply chain. The purpose of the role of the Buyer is to ensure material availability for the
organisation’s business without exceeding the agreed total cost and inventory levels. The Buyer
handles operative ordering towards internal and external suppliers. Also one of the Buyer’s tasks
is the rectification of invoicing errors.
The Buyers are responsible for tracking open purchase requisitions in the ordering system and
converting them into purchase orders, preparing a pre-advice for the warehouse in the case of a
consolidation delivery mode, doing goods receipt in the order system when receiving inbound
messages from the warehouse and passing the packing lists to the Order Handling and Logistics
team. The Buyer’s role includes also other tasks of information gathering between the customer
and the supplier. The work includes more order handling related tasks than what originally can
be perceived as traditional Buyer’s purchasing tasks. To summarize the Buyer’s role in the order
process flow; the Buyer takes care of the goods in the supply chain until the goods are ready to
be shipped from the warehouse or suppliers’ premises.
One detail that separates the roles of the Logistics Coordinator and Buyer are the authorization
rights in the ERP system. The LC handles the sales order and has access and authorization to
order changes only in the sales order, while the Buyer handles the purchase order, creates and
makes possible changes to the purchase orders. They both have viewing access to sales orders
and purchase orders, but the order changing and revising functions differ in these two working
roles. Another separating fact is that the Buyer communicates with the suppliers when the LC
communicates with the Customer teams. In this sense, the Customer teams and suppliers should
never be in contact.
The Category Management and Specialists drive collaboration and development of the logistics
processes with the main suppliers, control logistical supplier management and performance and
handle the order escalations.
Order Engineering (OE) is a systematic way of working proactively ensuring that all data
needed for a complete and correct order of a high quality delivery and customer project is
available and checked prior to the order entry in the case company’s order management system.
The OE process is a cross-functional process of the case company’s business unit Operations.
The purpose of the OE’s role is to ensure clean orders and provide technical and logistical
support to the Customer teams by utilizing the information network.
58
OE coordinates all the order engineering related sales orders and projects and engineers the
requirements with the information networks. The purpose is to provide feedback for the
Customer teams. After selecting and prioritizing the OE cases with support and information from
the Order Handling and Logistics team and Buyers, the OE person collects feedback and
provides reports of the OE cases as well as trains to stakeholders in global functions. This is to
develop information network further to improve support capabilities. The OE team establishes
and provides content to the OE communications channels. The results of OE are also analyzed
for continuous improvement. OE meetings are held every second week. To sum it up, Order
Engineering provides product-specific support and logistics process know-how, analyse incorrect
sales orders, cluster errors and create error reports, and develop and maintain a global
information network.
The Order Configuration Support (OCS) provides ordering and configuration support to the
Solution Managers and Logistics Coordinators for trial, volume delivery and ramp-down
products. The OCS informs about material availability, helps with questions on creating
configurations and defines correct items for configuration in case the product is not supported by
the company’s Configuration Tool. The OCS pre-checks configuration content before the order
is entered into the ERP system and informs of product-specific mandatory information that is
needed for ordering. Pre-checking is done on request or it is mandatory for separately named
products. Approximately 50% of the orders are checked, but the products that require checking
vary. The OCS is the main communication channel between the product creation process and the
delivery process for competence sharing and transfer on ordering of new products, including for
example trainings and ordering instructions. There are dedicated support persons per product in
the OCS.
The Order Configuration Support has its own intranet pages with further links to product
information for ordering, list of products that require OCS’s pre-check, lead times, availability
information on new products and releases, ramp-down information and demand planning
information. According to an OCS team representative Aki (10th November 2009), it is the
Solution Manager’s responsibility to send the configuration file to the case company’s
configuration tool. This configuration file has then to be sent to the OCS that after checking it
sends the file to the Logistics Coordinator. What comes to products that need to be checked by
the OCS, the order should not go to the LC without the OCS’s permission. It is the Solution
Managers’ responsibility to ensure that the content of the order is what has been sold to the
59
customer. Working as a Specialist in the OCS team, Aki says that everyone does not know that
the Order Configuration Support exists and that their help could be used in order to minimize
errors.
The OCS team is a function whereas OE is a process. According to Aki continuous and
straightforward communication with the customer teams in different regions should be increased
to improve order correctness. One source of incorrect sales orders is the misuse of the
configuration tool. The sales item data in the configuration tool must be updated and
synchronized with the ERP system. If the tool is not updated with new product releases it
automatically generates errors. The Product Support is responsible for creating specifications to
the configuration tool to ensure the correct output. Aki mentions that a new SAP R/3 based
configuration tool will be launched during the first half of 2010. It is said to be way better than
the current tool.
Product trainings for the case organisation are held occasionally when a new product is or will
be released or if an old product is updated or changed remarkably. According to the Buyers the
number of product trainings has diminished during the past few years. The product trainings
include basic information about the product, especially what is relevant for ordering. It is the
product lines’ or product support’s responsibility to share the information about e.g. what items
are used for the product, contact persons, suppliers that are related to the product, customer base
and potential, geographical distribution per regions and release schedules dates.
5.3 Purchase Order Creation
The buyer in the Purchasing team is responsible for creating the purchase order in the ERP
system. The creation of a purchase order in the system can be technically done easily and in a
short time provided that the sales order is correct and all the needed information is in place. In
case of a perfect sales order the purchase order can be created on the average in 3-30 minutes, if
calculated only in active processing and working time. The Purchasing team follows sales order
driven ordering rules based on an internal procurement user guide. The pull principle is used in
the demand chain and items for products are purchased against customer orders.
The sales orders are assigned a delivery block automatically when created/handled in the ERP
system. Purchase requisitions will be automatically created only after the delivery blocks have
been removed from the sales order. After the purchase requisitions are generated items are
visible in the purchasing transaction for the Purchasing team’s processing. Either the Logistics
60
Coordinator contacts the Buyer informing about the new order that can be purchased or the
Buyer searches for new released purchase requisitions from the ERP system in sales order driven
business cases. Purchase orders can be created based on the sales order number or the purchase
requisition number. After removing the item level block from the sales order the purchase
requisitions are ready for procurement.
Before starting to work with the purchasing transaction the Buyer usually checks that some
special information is correct and in place in the sales order, for example whether the shipping
plant and item material groupings are correct. As hardware and software items are under separate
product codes and delivered from different plants, they need to be grouped in the system.
The vendor appears automatically to the items with up-to-date purchasing info record. After
these steps the Buyer adds delivery specific information by inserting a standard text template and
choosing the correct standard texts according to the sales mode (corporation sales purchase,
subsidiary purchase or direct export purchase). This “text information” is important for the
supplier in relation to the delivery details. The Buyer fills in the needed information from
different sources such as the data in the sales order as well as the project instructions.
When creating the purchase order the Buyer needs to check at least the delivery date (all items
must have the same delivery date and the delivery date must always be set according to the item
that has the longest lead time), and the tax code and delivery address. If the supplier is
synchronised with the case company’s ERP system, the purchase order will be automatically sent
to the supplier. The supplier will see the purchase order within 15 minutes from Buyer has
pressed the save button in the purchase order. The supplier gets an e-mail automatically only
when a new purchase order is available, but in case of any changes made to the purchase order
afterwards, the Buyer must send an e-mail to supplier. For all the other vendors outside the
Syncro Tool, Buyer must send the purchase order via e-mail in PDF file format.
The Logistics Coordinators of the Order Handling and Logistics team have set a processing
target time to be two business days. The Buyers’ order processing target time is one business
day. Five business days has been counted as target for the supplier confirmation. Figure 5-2
illustrates also the information flows in the ordering process.
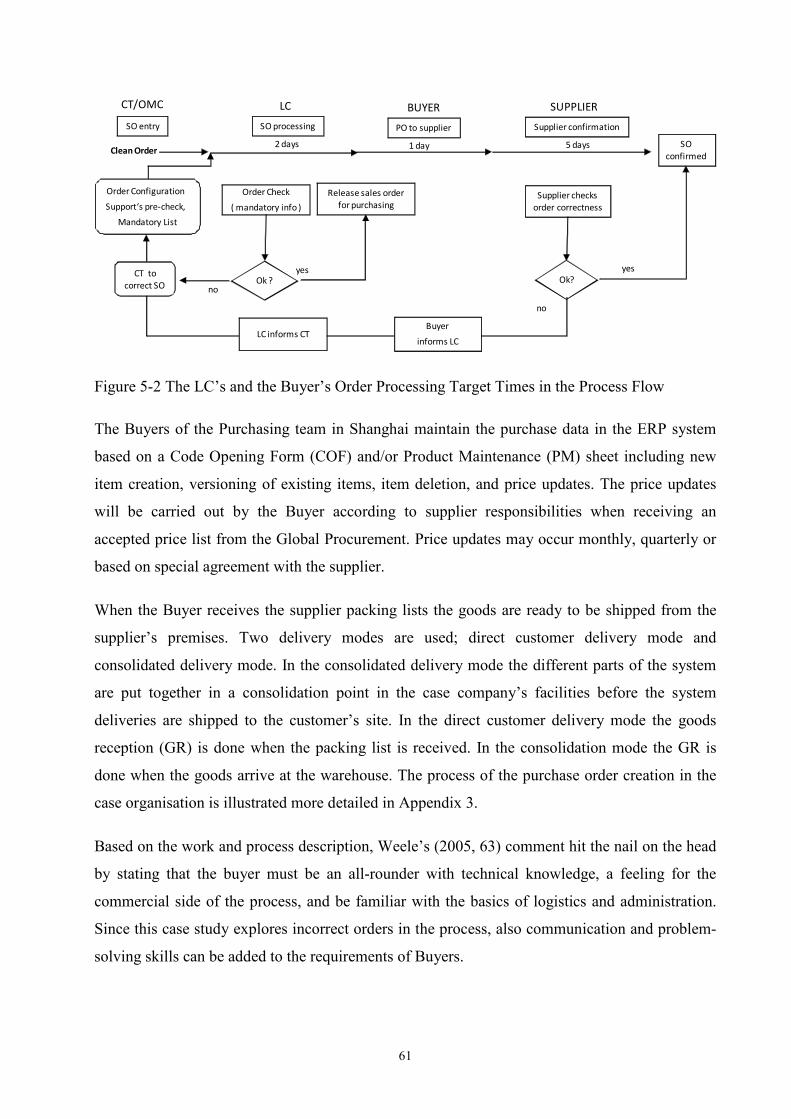
61
Order Check
( mandatory info )
Ok ?
Release sales order
for purchasing Supplier checks
order correctness
Ok?
SO processing PO to supplier Supplier confirmation
SO
confirmed
Order Configuration
Support‘s pre-check,
Mandatory List
yes yes
2 days 1 day 5 days
no
Buyer
informs LCLC informs CT
CT/OMC LC BUYER
no
CT to
correct SO
Clean Order
SUPPLIER
SO entry
Figure 5-2 The LC’s and the Buyer’s Order Processing Target Times in the Process Flow
The Buyers of the Purchasing team in Shanghai maintain the purchase data in the ERP system
based on a Code Opening Form (COF) and/or Product Maintenance (PM) sheet including new
item creation, versioning of existing items, item deletion, and price updates. The price updates
will be carried out by the Buyer according to supplier responsibilities when receiving an
accepted price list from the Global Procurement. Price updates may occur monthly, quarterly or
based on special agreement with the supplier.
When the Buyer receives the supplier packing lists the goods are ready to be shipped from the
supplier’s premises. Two delivery modes are used; direct customer delivery mode and
consolidated delivery mode. In the consolidated delivery mode the different parts of the system
are put together in a consolidation point in the case company’s facilities before the system
deliveries are shipped to the customer’s site. In the direct customer delivery mode the goods
reception (GR) is done when the packing list is received. In the consolidation mode the GR is
done when the goods arrive at the warehouse. The process of the purchase order creation in the
case organisation is illustrated more detailed in Appendix 3.
Based on the work and process description, Weele’s (2005, 63) comment hit the nail on the head
by stating that the buyer must be an all-rounder with technical knowledge, a feeling for the
commercial side of the process, and be familiar with the basics of logistics and administration.
Since this case study explores incorrect orders in the process, also communication and problem-
solving skills can be added to the requirements of Buyers.
62
5.4 Current State in the Case Organisation
The OEM hardware and related software based business has a strong growth, but to deliver
processes with a low maturity level requires an organisation that can ensure the highest delivery
quality and efficient end-to-end processes and tools for the delivery models. The business has
been booming and is still growing very strongly and therefore the supply chain needs a lot of
development. The internal working processes have been created while the business has increased
rapidly. Based on the company targets all extra resources should be focused on to find time to do
new business (solution managers) to gain growth, not focused on operational problems.
The Purchasing team of the OEM hardware and related software based business has six
permanent Buyers and one temporary employee on a six-month contract. The number of created
purchase orders has increased substantially during the last few years. In the third quarter of 2009
the total value of purchased items was 150% higher than in the third quarter of 2008. In addition,
for example during the summer 2009 the number of purchase orders increased 50% in three
months. Despite of the growth the workforce resources have remained the same because of the
case company’s overall financial situation and decreasing net sales.
The monthly purchase order volume is usually between 450-550 purchase orders and the
purchase order value ranges from 5 million to 15 million euros in a month. The average value of
a purchase order is thus approximately €20 000.
5.4.1 Complex and Long Process
If already the input of a process is incorrect, the output is not most likely of the best quality. Or,
the cost of the internal order-delivery process and production is extremely high when numerous
process steps are done several times including checking and correcting to deliver value to the
customer. Also, if the beginning of the process is not familiar with what the end of the process is
doing and vice versa, the process most likely includes insufficient communication, inadequate
information flows and bad process quality with long lead times and delayed deliveries.
Consequently in the end is the unsatisfied customer.
The Purchasing team’s function can be perceived to be in the back-end of the process. In practice
it appears that all the mistakes made in the front-end of the process will cumulate towards the
end. The incorrect ordering will eventually come visible in the purchase order creation phase.
The errors are corrected by the Logistics Coordinators and Buyers so that the purchase order can
63
be created or the supplier can confirm the order as soon as possible. In other words, the problems
of the process are currently cumulated to the back-end.
The correction and finding the missing mandatory information is done in a huge hurry because
the target of the purchase order creation lead time is one business day. Typically the incorrect
sales orders have several errors and they are released late, meaning that the delivery date
requested by the customer can be due already.
Currently the process is said to be slow and having extreme impacts on sales (Workshop 6th
October 2009). A slow process impacts also customer satisfaction, resource utilization and
margins. The case organisation consists of small 1-6 members’ teams distributed in several
countries and in different time zones. The process is said to be so complex that the right hand
does not know what the left is doing. The complexity of the process also means that if bad
quality occurs in the beginning of the process, there is a disaster in the end. In other words the
process is very inflexible to changes. The case organisation has informed the Customer teams
and the back-end of the process that if the orders are forecasted well enough and if the orders are
placed in the system correctly including all the mandatory information needed, the delivery
accuracy and the promised lead time can be guaranteed.
The process is also too slow compared to customer needs and expectations. One cure for the
slowness are efforts that improve the lead time. If the lead time “depends”, it is a question of
consistency that affects customer satisfaction. Customers expect reliable actions from suppliers,
not deliveries with depending delivery dates. However, there is no sense to speed up the process
and simultaneously deliver bad quality. Then again, if high quality is delivered, waste is
automatically removed.
According to the Kaizen method waste increases costs and provides no value to the customer.
Currently the global order process for 3rd party products is said to be a copy-paste process, full of
checking and controlling, so to say waste (Pierre, Workshop 6th October 2009). Checking is
waste because everything should be correct the first time. Quality should be built inside the
process, so there would be no need for pre-checking. All checking activities are only treating the
symptom, while the root cause of the actual problem stays hidden. According to Kaizen there are
seven types of waste; correction, waiting, processing, inventory, transportation, motion, and
over-production. The ideal is that everyone in the internal process would receive only excellent
quality information so that they can do their work easily.
64
Although checking can be considered as waste, before radical improvement of the order-delivery
process organisation must set standards for working methods and add the controlling and
checking steps as a short-term solution. Currently it seems that the Logistics Coordinator does
not always know and identify the requirements of a purchase order that should be found in the
sales order. Also, at times the missing mandatory information from a sales order might be left
unobserved in a hurry. However, the LCs’ remissness inflicts double work and costs on the
Buyers as well, in the worst case also on the suppliers.
The situation with the sales order errors is a global sales order level problem, meaning that
everything should to be correct in the sales order. The impacts of the incorrect sales orders on
purchasing operations need to be informed about to the customer teams and other order entry
related teams in the front-end of the process. The division of work and authorization rights split
in the ERP system between the Logistics Coordinators and Buyers requires extensive
cooperation and effective communication between the LCs and Buyers. This also adds working
phases if changes due to incorrect orders are needed. For example, if the Buyer notices an error
that needs to be fixed, the correcting and changing takes time because the Buyer can only change
the purchase order side, and the Logistics Coordinator the sales order side. Thus, they will have
to communicate on-time and effectively together to get the order clean as soon as possible. This
cooperation works well if both the LC and the Buyer are located in the same country or in the
same time zone. Usually, the change has to be executed in the sales order before the purchase
order can be fixed.
5.4.2 Unbalanced Workload and Working Resources
The large amount of incorrect sales orders and their impact on additional work required create
huge pressure on the Purchasing team resulting in a need to have more working resources. It can
be stated that if more resources would be placed on the front-end of the process to ensure correct
sales orders in the first place, the root causes of the problem of incorrect orders would be
removed. This would automatically ease the working pressure and workload in the Purchasing
team as well.
The lack of resources in relation to the increased number of sales orders makes the operative
working capability sensitive to such changes as holidays, sick leaves and occupational stress
injuries. In addition, the huge personal workload gobbles up energy from developing and
improving efforts when all the efficient working time goes to operative work. Processing and
fixing the incorrect sales orders is a major source of additional work that should be eliminated.
65
The work in the case organisation is said to be reactive instead of proactive troubleshooting. The
process problems, oversized workload and errors cause tense nerves and bad feelings. People are
unsatisfied and tired. For example, when a customer notices that the purchase order has been
confirmed far later than was requested, the customer is angry and disappointed when contacting
the Buyer. The Buyer in his/her side cannot really influence the late confirmation date if the
purchase order has already been late or incorrect in the system and a lot of time has been wasted
in the early steps of the ordering process. The workload also stresses the Buyers to that extend
that following the order status proactively gets minor attention and the actual status does not get
noticed until the customer asks for it. This is naturally bad customer service.
Fixing the errors of incorrect sales orders wastes the limited working resources in expense of the
performance capability of processing the correct ones. The significant impact of the incorrect
sales orders on the purchase process is also established as a result of the empirical research.
Partly because of the reactive way of working, the number of e-mails is tremendous and
increases manual work. It seems that a major part of the e-mails to the Buyers are mainly
questions about status and unclear orders. If the incorrect sales orders were eliminated, it would
significantly improve well-being at work not to mention operational benefits.
5.4.3 Discussion of the Possible Root Causes of the Incorrect Sales Orders
The order-delivery process of OEM hardware related 3rd party products is complicated including
a lot of special exception situations and arrangements which makes the finding of the possible
root causes for incorrect sales orders difficult. According to OE Specialist Birgitta (19th October
2009), you have to ask why as long as it starts to feel vain when exploring the root causes of the
incorrect sales orders. Finally, after several why’s, the answers most likely are “he didn’t
know…”, “they weren’t informed…”, “he should have…”. So the root causes will eventually
seem very simple and human. This is one basic problem of very long process and supply chain.
The incorrect sales orders are generated for example in the following way. The customer has
received an offer from the Customer team which is valid for 30 days. In other words, the
customer has 30 days to close the deal and make the order. However, if the customer orders after
agreed 30 days, all the main details and specifications related to the product configuration and
ordering will change. At this point, the process is in a hurry and the customer expects to receive
the product at site as required in the first place. The customer team is pushing to get the order in
the system and to the ordering process as soon as possible. The work is iniated without checking
whether the customer request can be fulfilled or that the order is something that is possible to
66
order from a supplier. The purchasing process in the back-end is not known in the Customer
team and they are not aware of the consequences of errors in the order. This may lead to a
situation where the sales order is released for purchasing although it includes incorrect items,
such as obsolete items because of the changed product configuration.
According to Harri, Head of Technical Support (9th November 2009), 30% of the orders are risk
orders meaning that the procurement and production is started with the possibility that the
customer can call-off and cancel the order. If the risk order is cancelled, it possibly increases the
inventory level. The nature of risk orders increases the possibility of changes, errors and double
work.
Everything should be agreed in detail in the offer phase before creating the sales order and
purchase order. The number of risk orders is huge; the customers negotiate and bargain until the
very end. In the worst case scenario, the sales order gets done late and it includes errors and
delivery dates requested by customer that are unrealistic at the time the sales order comes to the
purchase creation phase. If a supplier cannot fulfill the delivery date requested by the customer
because it exceeds the agreed lead time or it is due, the customer starts escalating the order. So
the incorrect ordering eventually leads to escalation by the customer. At this point the Buyer is
still working on getting the order correct, for example finding out the missing mandatory
information or asking how the configuration should be fixed. Escalation of incorrect orders is
additional work that wastes resources. The Purchasing team has a rule that if the order is not
clean, it will not be escalated (Marko, 2nd
December 2009).
It has been agreed previously that the Buyers and Logistics Coordinators inform OE about the
incorrect sales orders by adding the OE Manager Birgitta to e-mails that include information
about an incorrect order. This has been an agreed practice for over a year now. According to
Birgitta (19th October 2009) the bigger the volume of the sales orders has been, the less the errors
are reported by the Buyers. This can be explained by workload but also with the fact that this has
not become a part of the standardized working methods and practices. In addition as incorrect
sales orders have become so common that Buyers are immune to them, the Buyers might think
that a small detail missing is not worth sending an e-mail to Birgitta. In other words, small errors
that can be easily fixed are not seen as errors anymore. The process has become self-improving.
If the customer team representatives in different regions cannot place the orders correctly, they
do not understand the technical requirements of the case company’s products. This means that
67
the products are productized incorrectly or they are too complicated, and therefore it is difficult
to order them. These problems should naturally be tackled. One possible cure could be providing
more training for the Customer teams and Solution Managers. The challenge lies in the fast
changing products with short life-cycles.
Harri (9th November 2009) says that there are several ordering instructions available but the
problem is how the people needing them will find the instructions, especially if these people do
not acknowledge needing them. This challenge to find the most applicable information from a
large volume of information available has been also mentioned for example by Laamanen and
Tinnilä (2009, 70). The challenge is how to aggregate the information to serve as an aid in
action, decision-making, and improvement. One answer in Harri’s opinion could be adding pop-
up windows into the ordering system including instructions about ordering special products, for
example: “this information is required”. People are tired of searching for information if it is
difficult in practice.
The Order Engineering and Order Configuration Support have been established to serve and help
ordering and to minimize incorrect orders. One important finding of this study is that the
information about all the incorrect orders released for purchasing does not reach the OE that
should share the results of incorrect orders to the front-end of the process and create action
points for improvement. This would distribute the feedback on errors of incorrect ordering to the
Customer teams in the regions including the consequences the incorrect orders have inflicted.
Previously the reason for the poor error information sharing from the Buyers to the OE was said
to be the huge workload.
To summarize the current state in the case organisation there is plenty of room for
improvements, and the objectives for this assignment case study are well-justified. Thus, to
improve the purchase process quality, the impacts of the incorrect sales orders are explored in
the next Chapter 6, in which the empirical case study is presented.
68
6 The Empirical Case Study: Exploring the Impacts of Incorrect Sales Orders on the Purchase Order Processing
To be able to explore the impacts of incorrect sales orders on the purchase order processing, the
framework of Continuous Improvement of the purchase process described in Chapter 4 was
applied to the assignment case organisation in this empirical case study. Chapter 6 provides a
review about how the case study was executed and what were the empirical results of it.
This research is relevant in the case organisation because currently the lead time for processing
the incorrect sales orders to create purchase orders is too long. Long lead time is a result of the
time and costs wasted on correcting, checking, asking and waiting for information and doing the
same actions for several times. By improving the quality of sales orders and thus minimizing the
order processing lead time, the case organisation can improve customer satisfaction, resource
utilization, inventory levels, clarity of invoices, time from quote to cash and supplier
relationships.
The main research problem of the study was how the case organisation could improve its
practices to minimize the number of incorrect sales orders released for purchasing and the time
spent on processing them. The principal objective of this study was to explore the impacts of
incorrect sales orders on the purchase order processing. This was divided into the following four
sub-objectives: to describe the current situation to support decision-making, identify the errors of
incorrect sales orders released for purchasing, find out the time and the cost of extra work spent
on correcting the orders, and to present proposals for actions.
In order to reveal the current situation and practices in the case organisation with regard to the
continuous improvement of the purchase process, internal databases were reviewed and
interviews of Buyers and other team representatives from the case organisation in relation to
order correctness were carried out. Also an inquiry including five questions about errors was sent
to the Buyers allowing them to describe the current situation. Participant-observation was used
as well; the researcher served as a team member in the case organisation and was involved in
everyday issues and events. Based on the inquiry, interviews, expert analysis, observation and
written sources of information, the research phenomena and the errors of the incorrect sales
orders were identified and classified into five different error categories. Different case examples
of the incorrect sales orders are presented in this Chapter based on the five error categories.
69
The data collection from all incoming sales orders was carried out during business operating
periods 11 and 12 from 30th October to 31
st December 2009. The Buyers were asked to keep
track of incorrect sales orders by marking on their order status Excel sheets three extra columns:
whether the order is clean or there's an error, the error type and description of the error. In
addition the following information was collected: the date the sales order was released for
purchasing and the date the purchase order was created by the Buyer. Also other information
about all incoming sales orders was available for measurements, for example region, country,
customer etc. Data collection and statistical analysis were executed to measure e.g. the lead time
of the purchase order creation and the number of incorrect orders, as well as what types of errors
are prevalent in which regions and what was the impact of the incorrect sales orders on the lead
time per different error category.
The lead time was chosen to be the indicator for the time and costs spent on creating the
purchase order as well as for the quality of the process. It was also agreed with Order
Engineering Manager Birgitta that the author would forward her the information about all the
errors. Finally there is a review of the impact of the error follow-up by the Buyers during the
data collection period for this thesis work on the Order Engineering’s monthly reported error
statistics. In addition a performance measurement and statistical analysis were done exploring
what were the key dimensions for measuring purchase order processing performance identified
as lead time.
During the research it was discovered that the data quality of the OE reports on incorrect sales
orders is not reliable as all the order errors are not reported to OE. This led the researcher to find
out how to ease and improve the ways the errors could be reported more effectively. The
Purchasing team implemented a new quality control method in January 2010. Order quality and
correctness can be now controlled by shared order status Excel sheets per Buyer that include
mainly the same columns that were followed during the data collection period of this study.
Since January OE has collected the needed data for error reports from these order status Excels.
This procedure was to ensure more reliable data about the number of incorrect sales orders as
well as the errors in them to inform and give feedback to the Customer teams. This holds an
assumption that the overall order quality can be improved with the help of OE and that the
Buyers’ task is to take care of communicating the errors to OE.
During the research process it became evident that one way the Purchasing team could minimize
the number of incorrect sales orders was to give feedback to the previous step in the process on
70
whether they are providing good or bad quality in the internal process. Therefore, the Logistics
Coordinators, as the previous step in the process before the Buyers, are required to use a check-
list of the mandatory information needed in a sales order to eliminate these types of errors.
6.1 Errors from the Buyers’ Perspective
This Chapter presents the summary of the results of the inquiry for the Buyers executed in
October 2009 (Appendix 1). The Buyers were asked to answer five questions based on their
working experience to perceive the research field and to identify the incorrect sales orders.
The most common errors. According to the Buyers’ mutual estimation, incorrect configuration
is one of the main sources of incorrect sales orders. Incorrect configuration automatically creates
errors in the purchase requisitions. Usually this means that items are missing, incorrect quantities
of items are included or services are ordered to countries where the suppliers cannot deliver
them. Incorrect configuration can also necessitate that wrong items like end-of-life (EOL) items
are ordered.
In addition to incorrect configuration also general technical ERP system errors are common.
Generally the technical ERP error is related to missing or incorrect information that is required in
creating the purchase order. The general technical ERP errors mentioned by the Buyers are:
- incorrect item category generates incorrect delivery address in purchase order
- incorrect shipping points and material groupings
- mandatory information is missing or incorrect (e.g. site address, Care Manager contact
person information, information about the original order)
- supplier specific information is missing (e.g. Deal ID number or discount percentage,
supplier’s user centre account number, supplier’s quotation and reference)
- errors from invalid info record or source list (e.g. vendor missing for item because of
missing info record)
- wrong price on item
- wrong range item used (e.g. range item is old or for a higher price).
The main sources of errors. The case company’s configuration tool is named as one of the main
sources of errors by the Buyers. From the Buyers’ perspective it seems that the tool is not
updated or not being used when ordering. The configuration tool should give correct items, but
instead some old Excel file, usually with end-of-life items, is used in ordering. Besides, the
Order Configuration Support’s role in checking the sales orders is seen inadequate. Or, despite
71
the checking by the Order Configuration Support, the sales orders are not clean for creating the
purchase order.
According to the Buyers, the Customer teams’ competence in ordering the OEM products is seen
also as one of the main sources of errors. It seems that the CTs do not know or remember to add
the required information into the sales order, or they do not know what they are ordering or what
is really needed. There are also cases in which the Customer team has changed the configuration
after the original version has been checked and approved by the Order Configuration Support.
Also frequent personnel changes in the Customer teams and in the Order Handling and Logistics
teams and the lack of proper orientation and training were mentioned as the sources of incorrect
sales orders. The Logistics Coordinator of the Order Handling and Logistics team does not
always know or recognize what is required for creating a purchase order. The incorrect Code
Opening Form (COF) and the cases when it is not available for the correct persons was
mentioned as one of the main sources of errors. In addition it was mentioned that CSI ordering is
not done according to the process and this also causes errors in the sales orders.
The most time-consuming errors to fix based on the Buyers’ work experience are the ones
related to configuration errors. When the configuration is incorrect the order has to be changed
maybe even several times, it may have to be cancelled and items need to be added. This takes
time because the changes need to be done in every process step by different teams according to
the process flow and system requirements. The more people involved in fixing the errors, and the
later in the process the errors are noticed, the more time-consuming it is to get the order clean
(e.g. an incorrect purchase order has been sent to a supplier and the errors are noticed by the
supplier, resulting in tens of e-mails).
A lot of time is spent on asking and waiting for the mandatory missing information from the
customer end. Because of different time zones, very rarely anything can be fixed totally at once.
The Purchasing team does not have insight and cannot see how difficult it is for e.g. the Logistics
Coordinator in the Order Management Centre in a different region to get the missing information
and from whom the information finally can be gotten. It also takes time and efforts from the
Buyers to get replies and help from the Order Configuration Support and Product line. For
example a typical configuration error might take a lot time to fix, if the Order Configuration
Support or Product line do not reply to the questions sent to them. Sometimes the supplier’s
72
comments about the error of the order are unclear which in turn causes extra work and
communication in the Order Configuration Support and Product line.
The lack of ERP system competence in the Customer teams slows down the correction of orders
in cases where basic knowledge about how to cancel e.g. a line is missing. A lot of confusion and
wasted working time are caused by cases where the customer order is not done properly by the
CT and the customer negotiation process is somehow still unfinished, but the order is anyhow
released for purchasing. Also, if the order is delivered (delivery created), but the CT cannot
make receiving for the site in the ERP system e.g. because of wrong item category, the
correcting process takes a lot of extra time, because all the documents and postings have to be
cancelled in the system, the sales orders have to be rewritten and the correct documents and
postings have to be created again.
The approximated time to get the incorrect order clean depends on the error. The Buyers
estimate that it normally takes from 15 seconds to four weeks to correct the unclean order,
approximately one week. If counted in efficient working time the time is less (approximately a
couple of hours per day), because it takes time to get answers to the missing information
inquiries. Also working in different time zones postpones the process of correcting. The CSI
orders are more complex than others and therefore it takes at least a week to fix them. To
summarize, it takes approximately 1-5 working days to fix an incorrect order.
The process step when the error is noticed by the Buyer. The later the error is noticed in the
process, the more time-consuming and complex it is to fix by several people, e.g. when the
purchase order has been created and received by supplier. It is usually the Buyer who notices the
incorrect information or the missing mandatory information in the sales order when creating the
purchase order by reviewing the sales order or it is pointed out by the ERP system (e.g. end-of-
life items, or “flagged for deletion”). The other common notice point is when the purchase order
is sent to the supplier (especially configuration errors). The supplier notices that the incorrect
purchase order cannot be handled and the purchase order will be sent back to the Buyer. With the
main suppliers of the OEM products it has been agreed that in these situations the purchase order
will be totally cancelled and a new correct sales order will be placed when the error in the system
is cleared.
The most common error notice points when the error can be detected inside the case organisation
are in the process flow order (Figure 6-1):
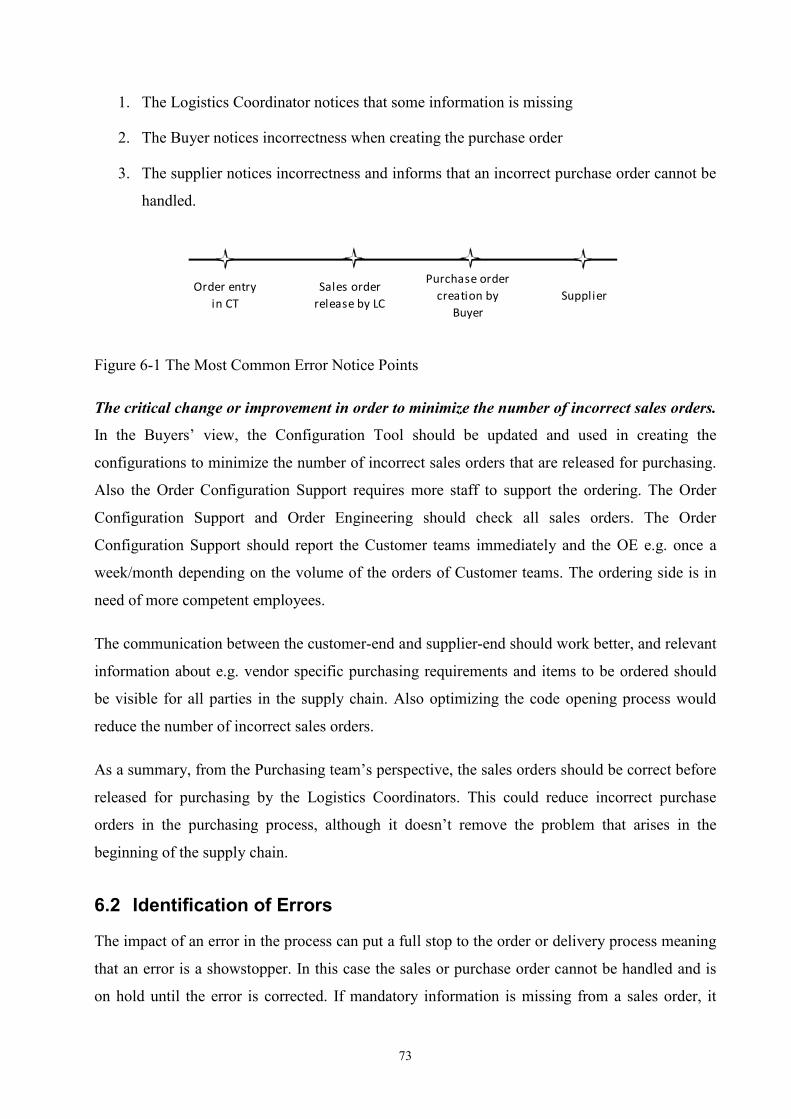
73
1. The Logistics Coordinator notices that some information is missing
2. The Buyer notices incorrectness when creating the purchase order
3. The supplier notices incorrectness and informs that an incorrect purchase order cannot be
handled.
Order entry
in CT
Sales order
release by LC
Purchase order
creation by
Buyer
Supplier
Figure 6-1 The Most Common Error Notice Points
The critical change or improvement in order to minimize the number of incorrect sales orders.
In the Buyers’ view, the Configuration Tool should be updated and used in creating the
configurations to minimize the number of incorrect sales orders that are released for purchasing.
Also the Order Configuration Support requires more staff to support the ordering. The Order
Configuration Support and Order Engineering should check all sales orders. The Order
Configuration Support should report the Customer teams immediately and the OE e.g. once a
week/month depending on the volume of the orders of Customer teams. The ordering side is in
need of more competent employees.
The communication between the customer-end and supplier-end should work better, and relevant
information about e.g. vendor specific purchasing requirements and items to be ordered should
be visible for all parties in the supply chain. Also optimizing the code opening process would
reduce the number of incorrect sales orders.
As a summary, from the Purchasing team’s perspective, the sales orders should be correct before
released for purchasing by the Logistics Coordinators. This could reduce incorrect purchase
orders in the purchasing process, although it doesn’t remove the problem that arises in the
beginning of the supply chain.
6.2 Identification of Errors
The impact of an error in the process can put a full stop to the order or delivery process meaning
that an error is a showstopper. In this case the sales or purchase order cannot be handled and is
on hold until the error is corrected. If mandatory information is missing from a sales order, it
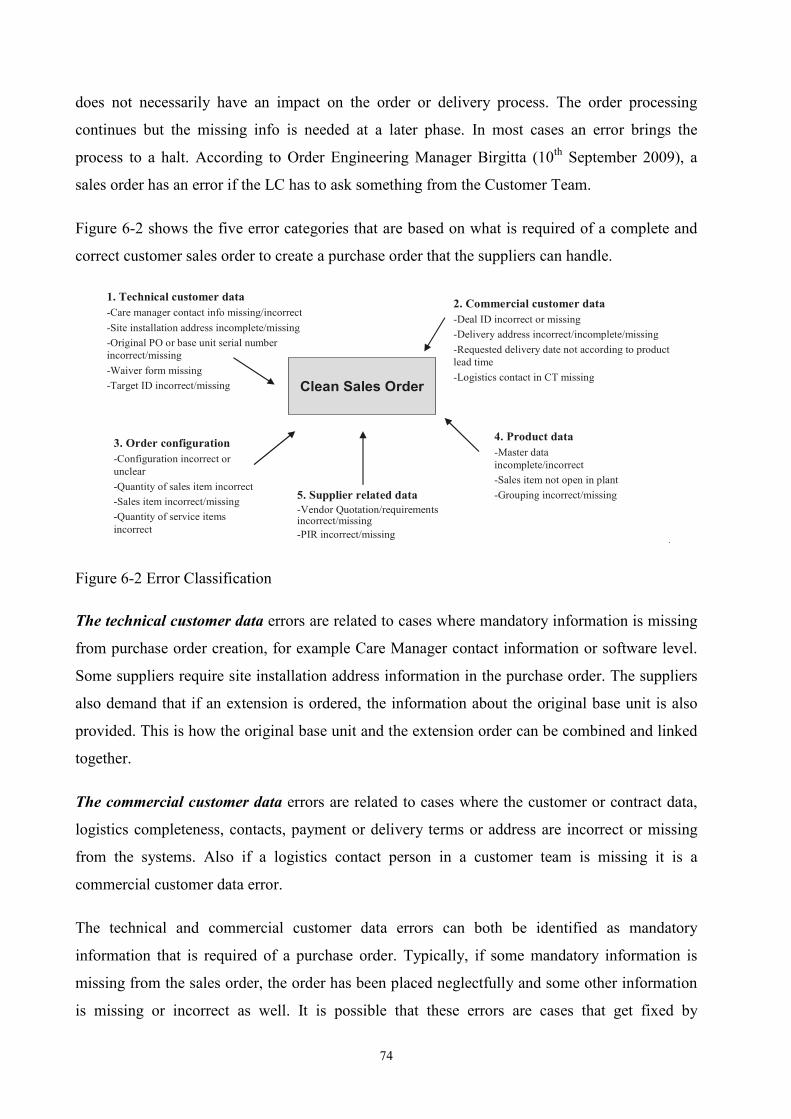
74
does not necessarily have an impact on the order or delivery process. The order processing
continues but the missing info is needed at a later phase. In most cases an error brings the
process to a halt. According to Order Engineering Manager Birgitta (10th September 2009), a
sales order has an error if the LC has to ask something from the Customer Team.
Figure 6-2 shows the five error categories that are based on what is required of a complete and
correct customer sales order to create a purchase order that the suppliers can handle.
4. Product data-Master data
incomplete/incorrect
-Sales item not open in plant
-Grouping incorrect/missing5. Supplier related data-Vendor Quotation/requirements incorrect/missing
-PIR incorrect/missing
3. Order configuration-Configuration incorrect or
unclear
-Quantity of sales item incorrect
-Sales item incorrect/missing
-Quantity of service items
incorrect
2. Commercial customer data-Deal ID incorrect or missing
-Delivery address incorrect/incomplete/missing
-Requested delivery date not according to product
lead time
-Logistics contact in CT missing
1. Technical customer data-Care manager contact info missing/incorrect
-Site installation address incomplete/missing
-Original PO or base unit serial number
incorrect/missing
-Waiver form missing
-Target ID incorrect/missing Clean Sales Order
Figure 6-2 Error Classification
The technical customer data errors are related to cases where mandatory information is missing
from purchase order creation, for example Care Manager contact information or software level.
Some suppliers require site installation address information in the purchase order. The suppliers
also demand that if an extension is ordered, the information about the original base unit is also
provided. This is how the original base unit and the extension order can be combined and linked
together.
The commercial customer data errors are related to cases where the customer or contract data,
logistics completeness, contacts, payment or delivery terms or address are incorrect or missing
from the systems. Also if a logistics contact person in a customer team is missing it is a
commercial customer data error.
The technical and commercial customer data errors can both be identified as mandatory
information that is required of a purchase order. Typically, if some mandatory information is
missing from the sales order, the order has been placed neglectfully and some other information
is missing or incorrect as well. It is possible that these errors are cases that get fixed by
75
themselves because they occur so often that the Buyers and LCs are used to their existence, or
they are quite effortless to fix. Maybe the Buyers don’t recognize or attach these as errors
anymore.
A correct sales order includes product codes and sales items according to its agreed order
configuration. A sales order is incorrect if its configuration is incorrect or unclear. Usually in
these cases the quantity of sales items or service items is incorrect or the sales item is incorrect
or even missing from the sales order. The Purchasing team have estimated that the configuration
errors are the most time-taking errors to fix.
Incorrect orders with product data related errors have problems in their product master data. An
error is also identified as product data based if the sales item is not open in a plant or the
grouping or the shipping point is incorrect or missing. Also if the plant is incorrect or missing,
the error can be categorised as a product data error. An incorrect plant error is often related to
risk orders as risk orders are automatically consolidated. These product data errors are
showstoppers causing a full stop to the order and delivery process.
Supplier related data is related to supplier delivery capability; vendor and purchasing data in the
systems, quotations and offers, special discounts and supplier specific requirements. The most
common supplier related data error cases are related to CSI business’ orders that include both
missing quotation and missing purchasing data in the systems. The supplier related data errors
also cause a full stop to the order and delivery process.
6.3 Error Handling Processes per Error Category, the Case Examples
Five error handling process case examples are described here, presenting one case of each error
category to form a conception of what it takes from the Buyer to fix the incorrect sales order.
The approach was to explore the e-mail chains related to these cases because e-mail is one of the
main working tools of the Buyer. The purpose of these cases is also to demonstrate how many
people are involved in e-mail discussions and to perceive in what time frame the cases are
handled and possibly solved. These are the elements that have an impact on the Buyers’ working
process and these factors influence the total costs of quality in terms or resource utilization. The
main impact of the errors of all the error categories is a full stop of the order and delivery process
(showstopper) and only in a few cases where mandatory information is missing it has no impact
on the order and delivery process.
76
The cases were selected on the grounds that they would be as descriptive as possible in terms of
how the errors are fixed and describing the impacts of incorrect sales orders on the Buyer’s
work. The approach is to illustrate the time and costs related to how many people are involved
and how much time is wasted vainly on e-mailing.
6.3.1 Case: Site Installation Address Missing, LT 1-4 Days
Missing site installation address information is identified as technical customer data error. It is
necessary for supplier X’s needs. The Buyer cannot create a purchase order without this
information, so the absence of it will not escape the attention. Typically if the sales order
contains supplier X’s items, it has supplier Y’s items as well. Delays in X’s purchase order
processing prejudices also Y’s process. Thus, missing site installation address inflicts a full stop
on the order and delivery process of at least supplier X’s items.
When the Buyer notices that the site installation address is missing, the Buyer contacts the LC to
track it down. The LC contacts a CT representative who knows the information related to the
customer. At shortest, it takes 3-4 e-mails and three persons’ involvement until the Buyer gets
the information and purchase order creation is possible. Due to holidays, substitution and general
workload, the lead time of site installation address error case is from 1 to 4 days, if everything
else goes smoothly.
One explanation for a missing site installation address is that the sales order containing material
to be purchased from several suppliers is released at once. This means that the purchase orders
for other suppliers than for supplier X requiring site installation address information can be
created and sent. However, in the case of consolidation of goods from different suppliers to one
sales order the process lead time cannot be escalated by releasing the sales order without site
installation address. Additional asking and e-mailing should be minimized also in the case of a
missing site installation address.
During the data collection period, 13 sales orders occurred with this similar error, and they
counted for 5.7 percent of all incorrect sales orders. The share of errors related to missing site
installation address was 26 percent of all technical customer data errors.
6.3.2 Case: Delivery Address Incorrect, LT 3 Days
Incorrect delivery address is identified as commercial a customer data error. In this case, the
sales order from India was released for purchasing on 9th November 2009. The Buyer started
77
working on the purchase order but noticed that the delivery address in the sales order was
Helsinki Vantaa airport which could not be correct. The Buyer e-mailed the LC to check the
delivery address. The LC e-mailed the CT and finally the correct delivery address was received
on 11th November 2009 and the LC was able to make the change into the sales order. During the
same day the Buyer created the purchase order and sent it to the supplier. Altogether the number
of e-mails was six while seven people were involved. The lead time of purchase order creation
was three days. In 10 percent of all commercial customer data related errors during the data
collection period the delivery address was incorrect, unclear or missing.
6.3.3 Case: Obsolete Item and Site Installation Address Missing, LT 16 Days
End-of-life or obsolete items are errors that are identified as Order Configuration errors. An
order from Poland, the North East (NE) region, was released for purchasing on 14th December
2009. During the same day the LC noticed that one item is obsolete. The LC asked support from
the Order Configuration Support with an e-mail that involved eight people from Customer teams
and Product Support. After around 10 e-mails the 22nd
December 2009 it was noticed that the
COF was missing for the item replacing the obsolete one. At this point the e-mail chain included
seven people. It became clear that the item had received an end-of-life status in mid 2009.
Finally on 29th December 2009 Logistics Coordinator Iza from the Customer team’s order
management phase made required changes in the sales order. After this the LC from the Order
Handling and Logistics team noticed that it was a risk order at stake and the plant and shipping
point for all hardware components needed to be changed. At this point it was 4th January 2010.
Iza replied that she had received a notice before Christmas that the risk order status had been
removed. The LC from the Order Handling and Logistics team replied that in that case there is
no need for consolidation and gave instructions to change the plant and shipping point
accordingly again. The purchase order was not created yet.
On 5th January 2010 the LC asked Iza to change the customer requested delivery date to be more
realistic as it was 10th January 2010 and at this point very unrealistic. A realistic customer
requested delivery date is needed in a purchase order sent to a supplier. Iza replied that the
customer needs the equipment as soon as possible and disagreed with requested delivery date
changes. The LC replied that the delivery is not possible earlier than in the beginning of
February and proposed to ask the supplier if they can deliver the equipment in the beginning of
February. The LC also suggested waiting for the confirmed delivery dates from the supplier
78
before providing any reliable delivery date. If this would not be agreeable, the LC advised Iza to
start the escalation process and attached instructions for escalation process.
On the same date, 5th January 2010 the LC sent an e-mail to the Buyer saying that the order is
free for purchasing. The next day was a bank holiday in Finland and on 7th January 2010 the
Buyer replied saying that for some reason there are delivery blocks in the sales order and asked
the LC to remove them. The blocks had been generated automatically by the system because of
the sales order changes made by the Customer team. Finally on the 8th January 2010 the purchase
orders were created and sent to three different suppliers. However, when creating the purchase
orders, the Buyer noticed that the site installation address is missing (technical customer data),
which is a mandatory information for one of the suppliers. The Buyer asked for this from the LC
and Customer team representative. The site installation address was received by the Buyer on
11th January 2010 and one purchase order was on hold at the supplier’s premises until that.
In this extreme case more than one week was lost in waiting for a removal of an ERP system
restriction. The customer had expected to get the goods in the beginning of January when the
order was not able to be delivered. Non-fulfillment of terms of a customer order can cause the
cancellation of further orders. To sum it up, this e-mail chain contained 38 e-mails involving
approximately 10 people from the case company, plus the communication between the Buyer
and suppliers. The lead time of purchase order creation was 16 days, which is the longest lead
time during the reporting period.
Order configuration related errors with end-of-life or obsolete items occurred in 17 orders during
the reporting period. It is 19 percent of the total number of the order configuration errors.
6.3.4 Case: Incorrect Plant, LT 5 Days
An incorrect plant in a sales order is identified as a product data related error. During the error
follow-up period there was a sales order to Luxembourg, in the North East (NE) region. The
sales order included two purchase orders for two different vendors. Before the purchase orders
were created the Buyer noticed that the plant was incorrect in the sales order. Due to incorrect
plant the delivery funnels either directly to the customer’s site or to the company’s consolidation
point. The Logistics coordinator sent an e-mail on 22nd
December 2009 about a new order and
during the same day the Buyer asked the Logistics coordinator to check the plant and proceed
with the possible change. The LC turned to the Customer team’s representative and inquired
after the correct plant information.
79
The sales order stayed on hold waiting for the LC’s reply. Finally, because of no information
from the LC, the Buyer sent an inquiry by e-mail to the LC on 23rd December 2009 for any news.
The LC replied that yes, the plant needs to be changed. It was the day before Christmas Eve and
afternoon so the case was postponed to Monday. In this case both the Buyer and the LC were
substituting because of holidays, which might have affected the lead time of order handling.
Finally on 30th December 2009 the plant information was changed correctly and the purchase
order was created and sent to the supplier. The lead time of purchase order creation was 5 days.
During the data collection period there were nine orders with incorrect plant in total. Of all
product data errors the share of these errors was 32 percent.
6.3.5 Case: Vendor Quotation Missing and Purchasing Data not Open, LT 4 Days
If a quotation is missing, unclear or incorrect, the error is identified as a supplier related data
error. A sales order from India was released for purchasing on 10th December 2009. Purchase
order creation was not possible because the vendor quotation as well as the Code Opening Form
(COF) were missing. The Buyer contacted Elizabeth from Product Data Management to get
some help. Elizabeth did not have what the Buyer was missing and forwarded the e-mail to a
colleague who did not know who had created the item and asked Elizabeth if she knew.
Elizabeth replied that the Product Data Management Tool was not working that ongoing day and
the creator of the item could not be checked. Elizabeth had noticed that the item was created in
the ERP system on 7th December 2009. Elizabeth proposed that the Buyer waited until Monday.
The Buyer thought it was fine because she had many other purchase orders to process as well.
On Monday the search for the item creator continued. After 10 e-mails from 11th to 15
th
December, including six people and 2 reminding e-mails from the Buyer, the quotation and the
COF were found from one of the Product Data Management team members’ inbox. Finally, the
purchase order was able to be created on 15th December 2009; the lead time was four days
(weekend in between).
Altogether 22 incorrect sales orders with missing or unclear vendor quotations were found
during the research period. The share of these of all the supplier related data errors was
67 percent.
80
6.4 Empirical Results of Data Collection
This Chapter presents the empirical results of data collection, research limitations as well as the
sigma level analysis of the current state of order correctness. The data collection was carried out
from 30th October to 31
st December 2009. The total reported number of hardware related sales
orders was 696, thus N=696.
6.4.1 Research Limitations of Data Collection
The data collection of incorrect sales orders was asked to be carried out by all the 6 Buyers of the
Purchasing team. One Buyer reported not to be able to participate so the sales orders from Latin
America (LAM) and Greater China (GC) are mainly left out of the scope. Therefore the total
number of sales orders during the data collection period differs from the case company’s other
comparable calculations. The last four weeks included three bank holidays because of Christmas.
The data includes all the sales orders that were released for purchasing after 30th October 2009. It
also includes released but afterwards cancelled sales orders, with or without a purchase order.
This was decided on because cancellation most probably has been caused by an incorrect order.
It has to be noticed also that the concept of incorrect order means errors or lack of mandatory
information in the sales order and not for example process related errors (people do not know
how the process works etc.) which can be easily interpreted as an error.
As a measurement method, the lead time of purchase order creation was calculated from the date
the sales order was released for purchasing to the date the purchase order was created in the
system. For example, if the purchase order is created on the same day as the sales order is
released for purchasing, the lead time is one day. Again, if the sales order is released on 1st
October, and the purchase order is created on 2nd
October, the lead time is two days.
As a limitation, the measurement of the lead time of purchase order creation is not reliable if the
error is noticed after the purchase order is created. This limitation is notable because these
incorrect orders are not detected in this study and this contorts the total number of incorrect sales
orders that occurred during the data collection period. This mainly relates to cases where the
supplier notices the error after the purchase order is sent for suppliers’ processing.
In measurements of the lead time per error category the cases that included two types of errors
were counted twice according to the related error categories. The amount of these cases was 24.
81
It has to be pointed out as well that due to the nature of the error phenomenon the higher the
number of sales orders, the higher the possibility of errors.
The reliability of the research data and results has been affected by the fact that the data was
collected by six individuals who naturally have differing ways to understand the errors despite of
the instructions. During the data analysis it was noticed that some of the errors were marked into
the wrong categories. This may also indicate that the error categorization with error descriptions
is incoherent and open to various interpretations. Because of this the more narrowly the errors
are detected with the data, the more inaccurate the results become. Nevertheless, despite of all
the limitations, it is essential to outline the total number of incorrect sales orders and identify the
different errors occurring in them.
The statistical significance is at least adequate because the sample size was equal to population.
696 incoming sales orders were collected during the reporting period of two months. All the
information apart from GC and LAN regions was received. The Buyers that collected the data in
their daily work marked all the sales orders accurately stating whether the order was clean or not.
All in all the Buyers expressed sincere helpfulness with their expertise and support to the
research.
The results are valid and can be generalised to the chosen research environment because other
sources of information in the case organisation have reached parallel results. Generalisation to
other order correctness phenomena in the order-delivery process is more challenging, especially
what comes to the sources of errors, as they are derived from the company’s products and
offering.
6.4.2 The Number and Proportion of Incorrect Sales Orders
The data collection was carried out during the operating business periods 11 and 12 from the 30th
October to the 31st of December 2009. The total reported number of hardware related sales
orders was 696, of which the number of incorrect sales orders was 229. Thus, 33% of the sales
orders were incorrect during the reporting period. In P11 (from 30th October to 26
th November
2009) the total reported number of sales orders was 312 and in P12 (from 27th November to 31
st
December 2009) it was 384, with error percentages of 46.5% and 21.9%. (Figure 6-3).
The special characteristic about the reporting period 12 was that it had a lot of bank holidays but
also sales pressure towards the year end. In period 12 there were a couple of large orders
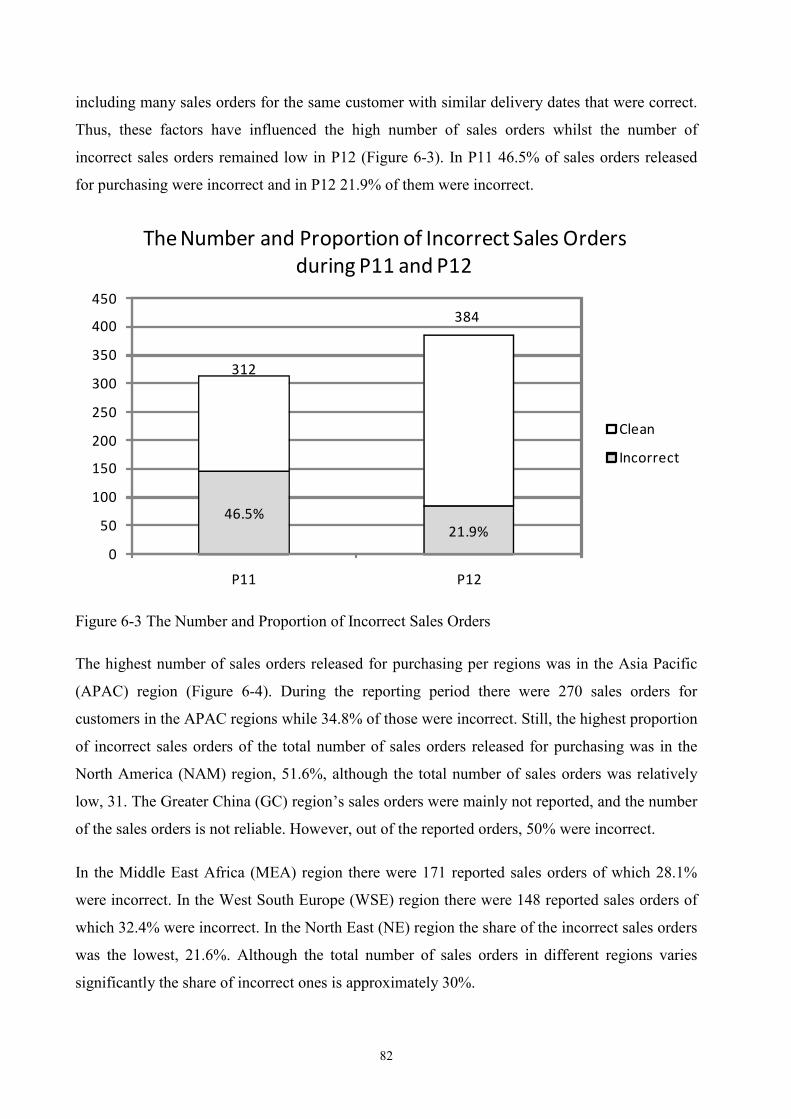
82
including many sales orders for the same customer with similar delivery dates that were correct.
Thus, these factors have influenced the high number of sales orders whilst the number of
incorrect sales orders remained low in P12 (Figure 6-3). In P11 46.5% of sales orders released
for purchasing were incorrect and in P12 21.9% of them were incorrect.
46.5%
21.9%
312
384
0
50
100
150
200
250
300
350
400
450
P11 P12
The Number and Proportion of Incorrect Sales Orders
during P11 and P12
Clean
Incorrect
Figure 6-3 The Number and Proportion of Incorrect Sales Orders
The highest number of sales orders released for purchasing per regions was in the Asia Pacific
(APAC) region (Figure 6-4). During the reporting period there were 270 sales orders for
customers in the APAC regions while 34.8% of those were incorrect. Still, the highest proportion
of incorrect sales orders of the total number of sales orders released for purchasing was in the
North America (NAM) region, 51.6%, although the total number of sales orders was relatively
low, 31. The Greater China (GC) region’s sales orders were mainly not reported, and the number
of the sales orders is not reliable. However, out of the reported orders, 50% were incorrect.
In the Middle East Africa (MEA) region there were 171 reported sales orders of which 28.1%
were incorrect. In the West South Europe (WSE) region there were 148 reported sales orders of
which 32.4% were incorrect. In the North East (NE) region the share of the incorrect sales orders
was the lowest, 21.6%. Although the total number of sales orders in different regions varies
significantly the share of incorrect ones is approximately 30%.
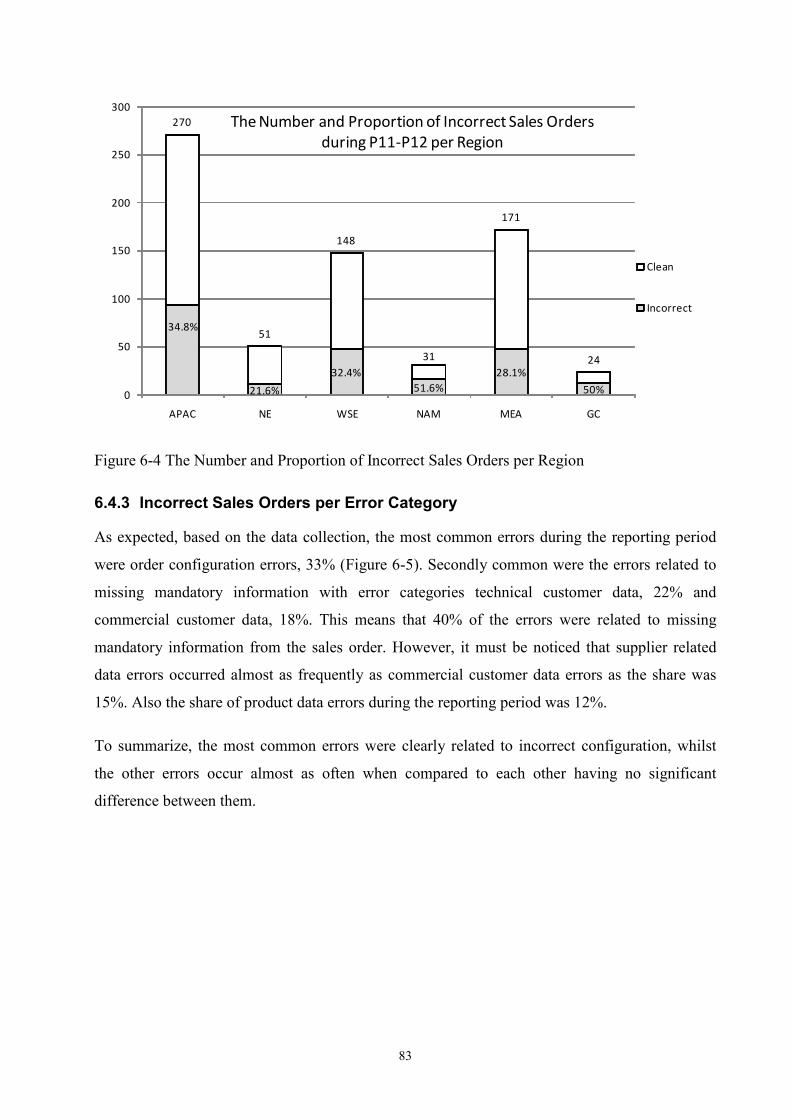
83
34.8%
21.6%
32.4%
51.6%
28.1%
50%
270
51
148
31
171
24
0
50
100
150
200
250
300
APAC NE WSE NAM MEA GC
The Number and Proportion of Incorrect Sales Orders
during P11-P12 per Region
Clean
Incorrect
Figure 6-4 The Number and Proportion of Incorrect Sales Orders per Region
6.4.3 Incorrect Sales Orders per Error Category
As expected, based on the data collection, the most common errors during the reporting period
were order configuration errors, 33% (Figure 6-5). Secondly common were the errors related to
missing mandatory information with error categories technical customer data, 22% and
commercial customer data, 18%. This means that 40% of the errors were related to missing
mandatory information from the sales order. However, it must be noticed that supplier related
data errors occurred almost as frequently as commercial customer data errors as the share was
15%. Also the share of product data errors during the reporting period was 12%.
To summarize, the most common errors were clearly related to incorrect configuration, whilst
the other errors occur almost as often when compared to each other having no significant
difference between them.
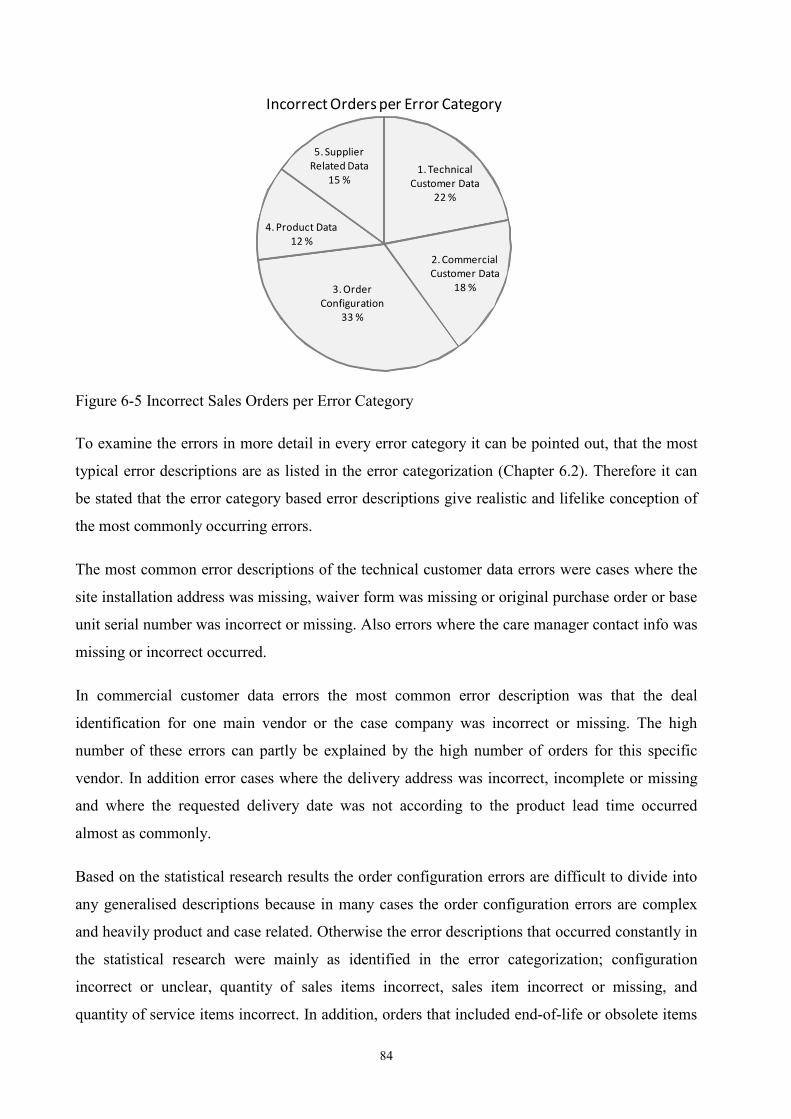
84
1. Technical
Customer Data
22 %
2. Commercial
Customer Data
18 %3. Order
Configuration
33 %
4. Product Data
12 %
5. Supplier
Related Data
15 %
Incorrect Orders per Error Category
Figure 6-5 Incorrect Sales Orders per Error Category
To examine the errors in more detail in every error category it can be pointed out, that the most
typical error descriptions are as listed in the error categorization (Chapter 6.2). Therefore it can
be stated that the error category based error descriptions give realistic and lifelike conception of
the most commonly occurring errors.
The most common error descriptions of the technical customer data errors were cases where the
site installation address was missing, waiver form was missing or original purchase order or base
unit serial number was incorrect or missing. Also errors where the care manager contact info was
missing or incorrect occurred.
In commercial customer data errors the most common error description was that the deal
identification for one main vendor or the case company was incorrect or missing. The high
number of these errors can partly be explained by the high number of orders for this specific
vendor. In addition error cases where the delivery address was incorrect, incomplete or missing
and where the requested delivery date was not according to the product lead time occurred
almost as commonly.
Based on the statistical research results the order configuration errors are difficult to divide into
any generalised descriptions because in many cases the order configuration errors are complex
and heavily product and case related. Otherwise the error descriptions that occurred constantly in
the statistical research were mainly as identified in the error categorization; configuration
incorrect or unclear, quantity of sales items incorrect, sales item incorrect or missing, and
quantity of service items incorrect. In addition, orders that included end-of-life or obsolete items
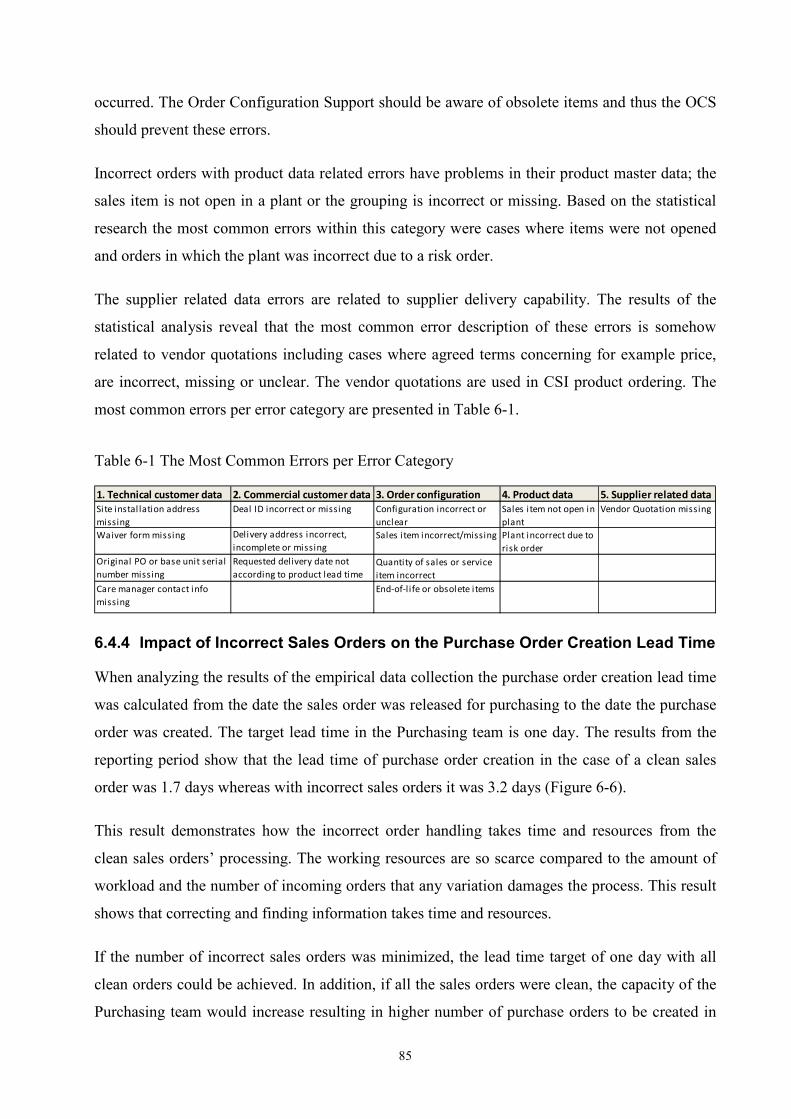
85
occurred. The Order Configuration Support should be aware of obsolete items and thus the OCS
should prevent these errors.
Incorrect orders with product data related errors have problems in their product master data; the
sales item is not open in a plant or the grouping is incorrect or missing. Based on the statistical
research the most common errors within this category were cases where items were not opened
and orders in which the plant was incorrect due to a risk order.
The supplier related data errors are related to supplier delivery capability. The results of the
statistical analysis reveal that the most common error description of these errors is somehow
related to vendor quotations including cases where agreed terms concerning for example price,
are incorrect, missing or unclear. The vendor quotations are used in CSI product ordering. The
most common errors per error category are presented in Table 6-1.
Table 6-1 The Most Common Errors per Error Category
1. Technical customer data 2. Commercial customer data 3. Order configuration 4. Product data 5. Supplier related data
Site instal lation address
missing
Deal ID incorrect or missing Configuration incorrect or
unclear
Sales item not open in
plant
Vendor Quotation missing
Waiver form missing Delivery address incorrect,
incomplete or missing
Sales item incorrect/missing Plant incorrect due to
risk order
Original PO or base unit serial
number missing
Requested delivery date not
according to product lead time
Quantity of sales or service
item incorrect
Care manager contact info
missing
End-of-life or obsolete items
6.4.4 Impact of Incorrect Sales Orders on the Purchase Order Creation Lead Time
When analyzing the results of the empirical data collection the purchase order creation lead time
was calculated from the date the sales order was released for purchasing to the date the purchase
order was created. The target lead time in the Purchasing team is one day. The results from the
reporting period show that the lead time of purchase order creation in the case of a clean sales
order was 1.7 days whereas with incorrect sales orders it was 3.2 days (Figure 6-6).
This result demonstrates how the incorrect order handling takes time and resources from the
clean sales orders’ processing. The working resources are so scarce compared to the amount of
workload and the number of incoming orders that any variation damages the process. This result
shows that correcting and finding information takes time and resources.
If the number of incorrect sales orders was minimized, the lead time target of one day with all
clean orders could be achieved. In addition, if all the sales orders were clean, the capacity of the
Purchasing team would increase resulting in higher number of purchase orders to be created in
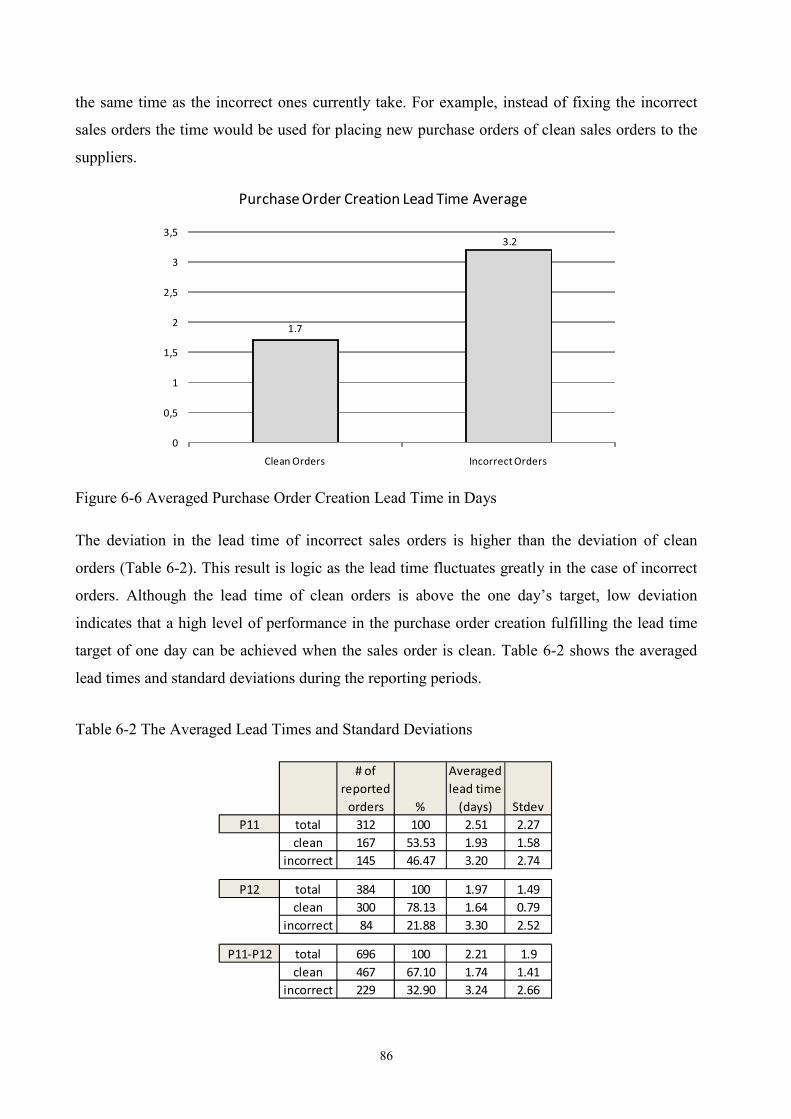
86
the same time as the incorrect ones currently take. For example, instead of fixing the incorrect
sales orders the time would be used for placing new purchase orders of clean sales orders to the
suppliers.
1.7
3.2
0
0,5
1
1,5
2
2,5
3
3,5
Clean Orders Incorrect Orders
Purchase Order Creation Lead Time Average
Figure 6-6 Averaged Purchase Order Creation Lead Time in Days
The deviation in the lead time of incorrect sales orders is higher than the deviation of clean
orders (Table 6-2). This result is logic as the lead time fluctuates greatly in the case of incorrect
orders. Although the lead time of clean orders is above the one day’s target, low deviation
indicates that a high level of performance in the purchase order creation fulfilling the lead time
target of one day can be achieved when the sales order is clean. Table 6-2 shows the averaged
lead times and standard deviations during the reporting periods.
Table 6-2 The Averaged Lead Times and Standard Deviations
# of
reported
orders %
Averaged
lead time
(days) Stdev
P11 total 312 100 2.51 2.27
clean 167 53.53 1.93 1.58
incorrect 145 46.47 3.20 2.74
P12 total 384 100 1.97 1.49
clean 300 78.13 1.64 0.79
incorrect 84 21.88 3.30 2.52
P11-P12 total 696 100 2.21 1.9
clean 467 67.10 1.74 1.41
incorrect 229 32.90 3.24 2.66
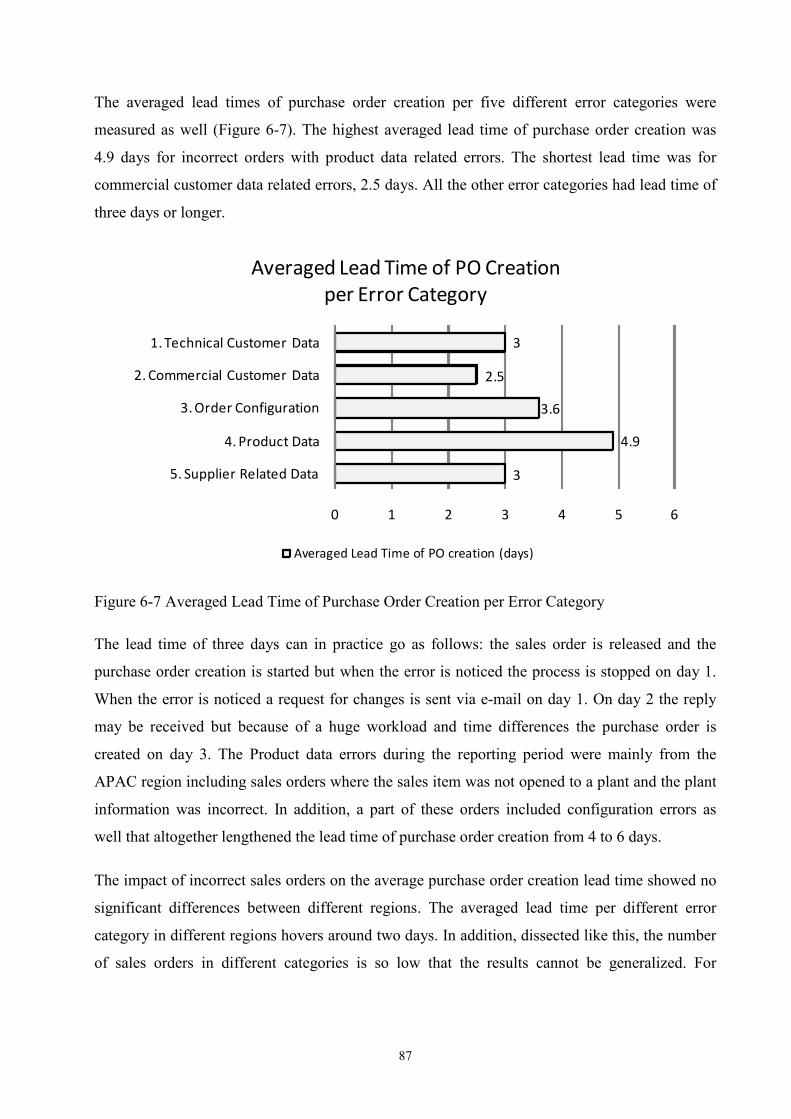
87
The averaged lead times of purchase order creation per five different error categories were
measured as well (Figure 6-7). The highest averaged lead time of purchase order creation was
4.9 days for incorrect orders with product data related errors. The shortest lead time was for
commercial customer data related errors, 2.5 days. All the other error categories had lead time of
three days or longer.
3
4.9
3.6
2.5
3
0 1 2 3 4 5 6
5. Supplier Related Data
4. Product Data
3. Order Configuration
2. Commercial Customer Data
1. Technical Customer Data
Averaged Lead Time of PO Creation
per Error Category
Averaged Lead Time of PO creation (days)
Figure 6-7 Averaged Lead Time of Purchase Order Creation per Error Category
The lead time of three days can in practice go as follows: the sales order is released and the
purchase order creation is started but when the error is noticed the process is stopped on day 1.
When the error is noticed a request for changes is sent via e-mail on day 1. On day 2 the reply
may be received but because of a huge workload and time differences the purchase order is
created on day 3. The Product data errors during the reporting period were mainly from the
APAC region including sales orders where the sales item was not opened to a plant and the plant
information was incorrect. In addition, a part of these orders included configuration errors as
well that altogether lengthened the lead time of purchase order creation from 4 to 6 days.
The impact of incorrect sales orders on the average purchase order creation lead time showed no
significant differences between different regions. The averaged lead time per different error
category in different regions hovers around two days. In addition, dissected like this, the number
of sales orders in different categories is so low that the results cannot be generalized. For
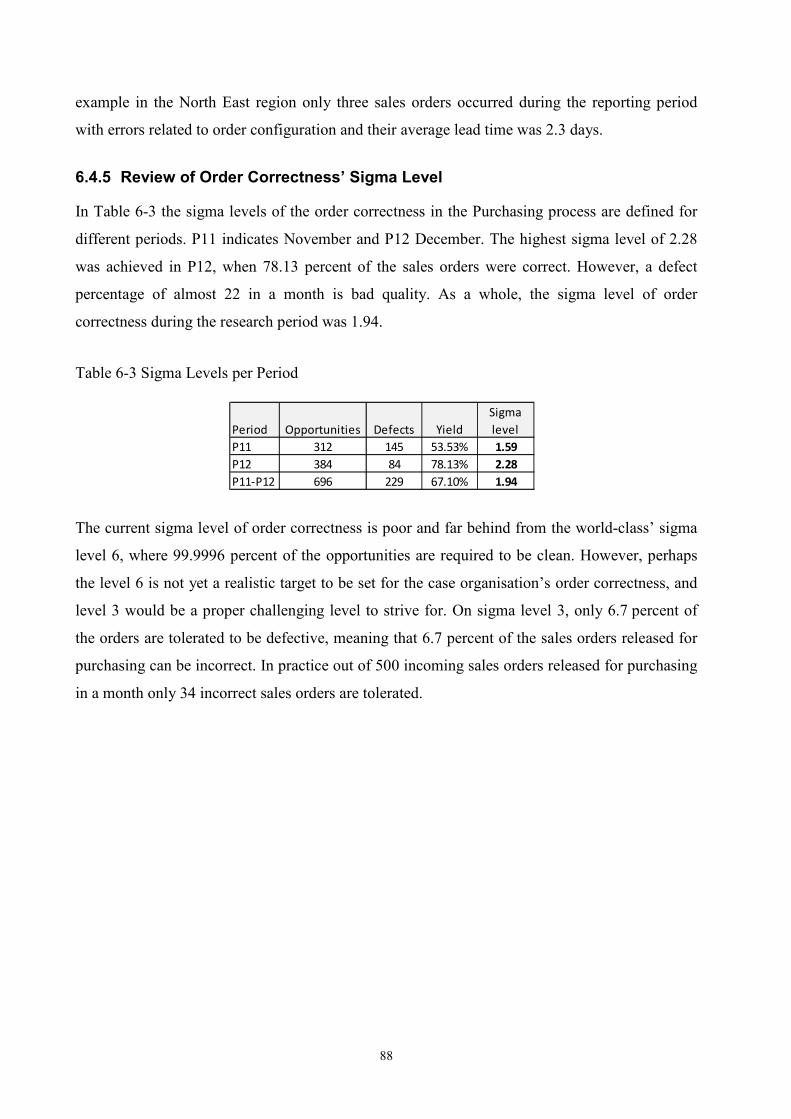
88
example in the North East region only three sales orders occurred during the reporting period
with errors related to order configuration and their average lead time was 2.3 days.
6.4.5 Review of Order Correctness’ Sigma Level
In Table 6-3 the sigma levels of the order correctness in the Purchasing process are defined for
different periods. P11 indicates November and P12 December. The highest sigma level of 2.28
was achieved in P12, when 78.13 percent of the sales orders were correct. However, a defect
percentage of almost 22 in a month is bad quality. As a whole, the sigma level of order
correctness during the research period was 1.94.
Table 6-3 Sigma Levels per Period
Period Opportunities Defects Yield
Sigma
level
P11 312 145 53.53% 1.59
P12 384 84 78.13% 2.28
P11-P12 696 229 67.10% 1.94
The current sigma level of order correctness is poor and far behind from the world-class’ sigma
level 6, where 99.9996 percent of the opportunities are required to be clean. However, perhaps
the level 6 is not yet a realistic target to be set for the case organisation’s order correctness, and
level 3 would be a proper challenging level to strive for. On sigma level 3, only 6.7 percent of
the orders are tolerated to be defective, meaning that 6.7 percent of the sales orders released for
purchasing can be incorrect. In practice out of 500 incoming sales orders released for purchasing
in a month only 34 incorrect sales orders are tolerated.
89
7 Research Findings and Conclusions
Here, in Chapter 7, the theoretical and empirical research findings as well as conclusions derived
from the results are illustrated. Also the managerial implications and recommendations for future
actions are demonstrated.
7.1 Theoretical Findings
The objective of the study was to create a framework for the continuous improvement of the
purchase process and order correctness performance by exploring the impacts of incorrect sales
orders on the purchase order handling process. The theoretical background of the study was
constructed to support this objective consisting of two main parts. The first one included a
review of the fundamental management philosophies related to quality and the means to improve
it continually. These have an effect on the order-delivery process quality and the internal order
correctness of a company. High quality ensures that the costs are minimized through doing
things right at the first time, which is definitely cheaper than doing the same things over and over
again and fixing errors. The second part concentrated on aspects of performance measurement
and continuous improvement as well as the methods to analyze the performance measurement
data to create quality control.
In a broad sense, continuous improvement is about improving the quality of operations,
processes and the ways of working of a company, all the time seeking for better ways of
operational performance. Based on this, the first part of the theoretical review of the study was
begun by a discussion about what quality in essence is. The review of the main principles of
Total Quality Management was included to illustrate those key issues that should be considered
in the application and creation of a framework for continuous improvement. The main principles
of TQM focusing on increasing customer satisfaction and reducing costs were covered and
viewed much in the same manner as in the covered literature including only minor differences
between each other. It was found that quality and productivity are inextricably linked as
improved quality and increased productivity go together as do targeted performance and
customer satisfaction.
As a summary of the principles of people-focused management system TQM, it was shown that
any quality improvement practice would have to be based on customer needs and that
organisation-wide involvement is needed to generate the best improvement ideas most
90
efficiently. The high importance of focusing on process improvement and gaining top
management support for improvement practices was also put forward.
A company’s internal order-delivery process quality, including purchase process performance
and order correctness, is not the outcome of its internal functions only. To improve the
purchasing process performance a company must look outside the company. Due to this Supply
Chain Management as a management philosophy and its importance on total performance was
covered. While the knowledge of the main principles of TQM was shown to be coherent, the
concepts of SCM are different depending on which source is referred to. This is because SCM as
a concept is fairly new at least if compared to the concept of quality, having its origins in
functional silos and the nature of the concept is also very wide-ranging.
Despite the differences of the definitions of SCM, the underlying idea of the philosophy is
nevertheless clear. In order to be and stay competitive, a company must manage the processes
across the supply chain. In the context of this study and in practice this means constantly
focusing on to identify the impacts of order correctness on the purchasing process to the supplier
and customer satisfaction and continuously to commence needed actions for improvement.
Managing processes between organisations is a key component of SCM. Therefore, Process
Management as a management philosophy was covered. Process Management has many points
in common with TQM and SCM and it was covered separately to show its importance in creating
value for the customer. Processes have customers who are to receive a specific output from the
process. Thus, it was shown that processes must be designed based on customer needs.
Especially in the context of this study the quality of the internal order-delivery process impacts
on the level of purchase process performance. In essence, the minimized lead time of a purchase
order handling process as a consequence of the order correctness in a process is the outcome of
the level of operational quality the organisation has been able to achieve in its different functions
and processes. Therefore, processes must be constantly measured and continuously improved to
keep process quality and performance on a high level.
In short, improving the quality of logistics operations is about process development. As the
underlying goal of this study was to examine the quality of the order-delivery process and
identify improvement opportunities, two practices related to developing and managing quality
were illustrated. The first was controlling the quality and operational performance of key
processes and using systematic methods to identify variations, determining root causes, and
91
making corrections in operational performance and quality. The second related to continuous
improvement of processes to achieve better quality, lead time, and overall operational
performance.
In terms of process design an important factor was found; the extent to which services and
products are standardised has an influence on optimal process design. Organisations can
establish several different delivery processes according to various customer needs and segments,
everything between standardised and customised order-delivery processes based on customer
needs.
Exploring the components of order cycle time, evidence exists that the longer the pipeline from
the source of materials to the final user is, the less responsive to changes in demand the system
will be. Furthermore, the order processing system is full of possibilities to seek out and remove
non-value-adding activities. Therefore, the goal should be to combine steps in the processes, to
integrate separate tasks and to simplify processes. This includes the requirement that non-value
adding work is minimized which in return improves service and reduces cost.
The second part of the theoretical review was about models and practices related to performance
measurement with emphasis on continuous improvement. Furthermore, because improvement
cannot be perceived without measurement, a discussion about the importance of measurement,
and the value of information in designing an effective performance measurement system was
given. Also the methods to analyze the performance measurement data to create quality control
were described.
As operational control is about measuring performance, the target area for improvement needs to
be accurately measured. This ensures a proper focus for the objective, visualises the
development, provides information on decision-making and pushes the company towards the
objective. Specifically purchasing performance measurement may lead to a greater recognition
by all other business functions. Interestingly enough it was found that management of
organisational culture and motivation may be the key to improve performance. It was also
discussed how extraordinarily difficult and often unreliable it can be to measure phenomena as
complex as performance as organisations are rapidly changing and thus results and measures
quickly become obsolete.
92
Changes in customer requirements, particularly related to speed, reliability and quality, have
profoundly affected performance measurement in supply chains. In many industries short lead
times and six sigma quality in delivered items have become the norm.
The theoretical review continued with a coverage of the relation of continuous improvement
practices to performance improvement and ended with considerations about how measurement
practices are connected to continuous improvement. A number of models of continuous
improvement were covered. To execute continuous improvement the following alternative and
complementary methods were illustrated; Kaizen as a process of continuous smaller-scale,
people-based improvements, Deming’s PDCA cycle to specify the connection between
productivity and quality, quality cost information to identify major opportunities for cost
reduction, a root cause analysis for problem solving and the philosophy of Six Sigma to provide
information of the current state.
The key finding from this review was that the covered models tended to stay on quite generic
level and were not targeted at any specific operational area or common problem. In other words,
the effectiveness of these models depends largely on the companies’ ability to apply them to
their own specific business settings and problems at hand. Furthermore, the covered models of
continuous improvement did not include explanations about who primarily should be responsible
for solving a problem, creating a solution, implementing it or monitoring the effectiveness of the
created solution. The reason for this is the generic nature of the models aimed to provide a
framework for continuous improvement in general, not solely for a certain key problem area in a
company. It was mentioned that sometimes an innovative way to combine different problem-
solving tools brings to the best results, instead of concentrating on only one method.
The theoretical framework for the continuous improvement of purchase process was based on the
previously covered theoretical aspects. A theoretical framework was created for the practical
execution of continuous improvement of purchase process in the case organisation. The
importance of effective internal communication and information flows was brought up as a
separate matter related to achieving the goal of purchase process improvement.
7.2 Empirical Findings and Managerial Implications
The results of the error follow-up of all incoming sales orders during two months were
devastating but still according to what was expected. Although the time period was somewhat
short, the results presented strong evidence that
93
1. The order correctness quality is poor
2. The impacts of incorrect sales orders accumulates in the purchase process step loading
overwhelming pressures on the employees in the form of extra work
3. The order-delivery process including purchase order process requires improvement.
Also, any improvement in order quality in terms of order correctness can easily and in short time
bring good results in the improvement of lead times and customer satisfaction.
The extent of organisation-wide participation on the analysis process is a key factor affecting the
results of applying continuous improvement efforts. A disciplined and systematic approach is
required. A challenge is to make sure that people who are responsible for measurement and
analysis are active and live up to their role to identify effectively the root causes for incorrect
order. In practice this means ensuring that the needed actions are constructed rapidly and that
they improve performance permanently; in other words, provide a cure for the real root cause.
The scope of different issues that affect the final order correctness and purchase process
performance is wide. All the players in an order-delivery chain have to take care of their own
responsibilities with high quality so that the customers receive their deliveries without delays and
with the agreed quality requirements. Therefore, the participation of all the functional units in
continuous improvement practices is needed to achieve high levels of performance. This is in
accordance with the widely used methods of continuous improvement such as Total Quality
Management and Six Sigma emphasizing employee involvement and teamwork, as well as
measuring and systematizing processes, and reducing errors and lead times.
In the following, a root cause analysis, a check-list for the LCs to prevent the eliminable errors, a
new quality control method and a cost analysis of incorrect sales orders are described as
empirical results and recommendations for actions. All these are based on the finding that the
very first thing the case organisation can improve is the information quality of order correctness.
This holds an assumption that with providing feedback from the back-end to the front-end with
reliable and truthful error data the errors made in the front-end will eventually diminish.
7.2.1 Root Cause Analysis
The high number of errors contributed positively to the need to identify the root causes of
incorrect sales orders. The following Table 7-1 provides 3 examples of the identified problems
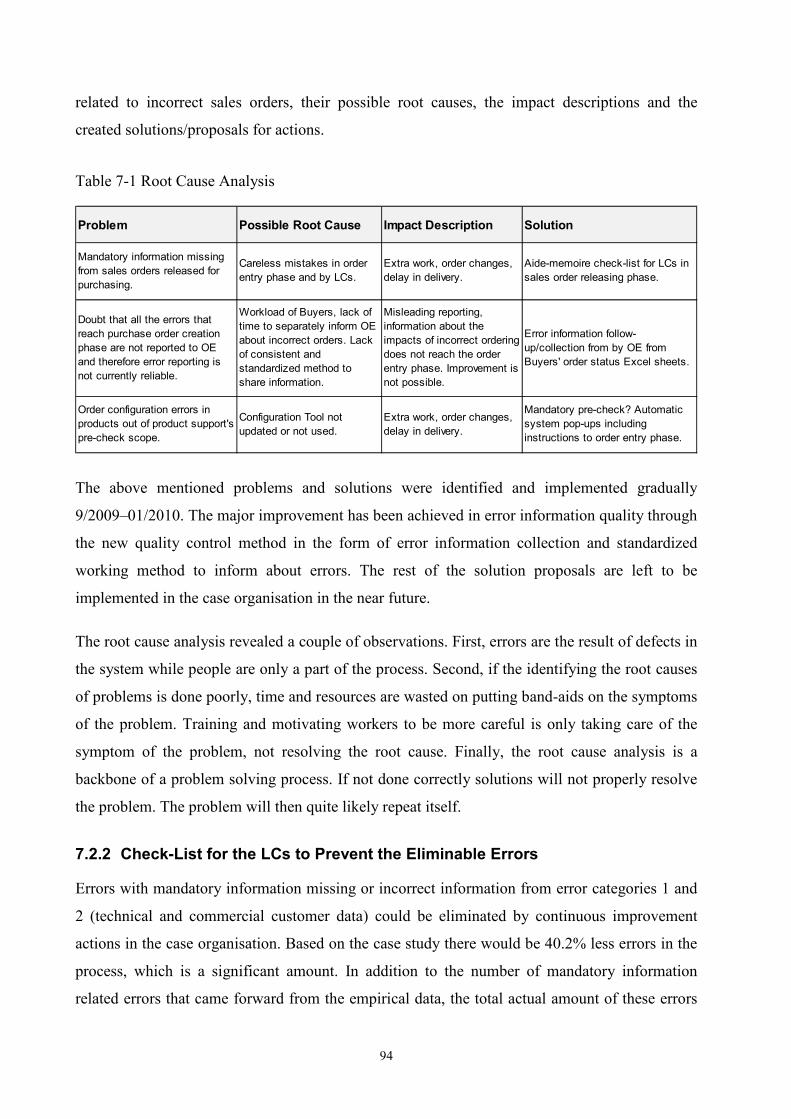
94
related to incorrect sales orders, their possible root causes, the impact descriptions and the
created solutions/proposals for actions.
Table 7-1 Root Cause Analysis
Problem Possible Root Cause Impact Description Solution
Mandatory information missing
from sales orders released for
purchasing.
Careless mistakes in order
entry phase and by LCs.
Extra work, order changes,
delay in delivery.
Aide-memoire check-list for LCs in
sales order releasing phase.
Doubt that all the errors that
reach purchase order creation
phase are not reported to OE
and therefore error reporting is
not currently reliable.
Workload of Buyers, lack of
time to separately inform OE
about incorrect orders. Lack
of consistent and
standardized method to
share information.
Misleading reporting,
information about the
impacts of incorrect ordering
does not reach the order
entry phase. Improvement is
not possible.
Error information follow-
up/collection from by OE from
Buyers' order status Excel sheets.
Order configuration errors in
products out of product support's
pre-check scope.
Configuration Tool not
updated or not used.
Extra work, order changes,
delay in delivery.
Mandatory pre-check? Automatic
system pop-ups including
instructions to order entry phase.
The above mentioned problems and solutions were identified and implemented gradually
9/2009–01/2010. The major improvement has been achieved in error information quality through
the new quality control method in the form of error information collection and standardized
working method to inform about errors. The rest of the solution proposals are left to be
implemented in the case organisation in the near future.
The root cause analysis revealed a couple of observations. First, errors are the result of defects in
the system while people are only a part of the process. Second, if the identifying the root causes
of problems is done poorly, time and resources are wasted on putting band-aids on the symptoms
of the problem. Training and motivating workers to be more careful is only taking care of the
symptom of the problem, not resolving the root cause. Finally, the root cause analysis is a
backbone of a problem solving process. If not done correctly solutions will not properly resolve
the problem. The problem will then quite likely repeat itself.
7.2.2 Check-List for the LCs to Prevent the Eliminable Errors
Errors with mandatory information missing or incorrect information from error categories 1 and
2 (technical and commercial customer data) could be eliminated by continuous improvement
actions in the case organisation. Based on the case study there would be 40.2% less errors in the
process, which is a significant amount. In addition to the number of mandatory information
related errors that came forward from the empirical data, the total actual amount of these errors
95
could be even higher than 40% as specifically these errors can be hidden in self-improving
processes. As described in Chapter 6.2 the technical and commercial customer data errors are
errors that can be defined as self-correcting and not considered as errors by the Buyers because
they are so common and relatively easy to fix.
Currently it seems that the Logistics Coordinator does not always know and identify the
requirements of a purchase order that should be found from the sales order. Still, the Order
Handling and Logistics team is responsible for holding the sales order as long as the order
content is correct, including information about plants, shipping points, item categories, delivery
grouping and all the mandatory information needed for purchasing. Therefore, the Buyers will
start to require better quality from the LCs. From the Buyers’ point of view, a check list for
mandatory information before the sales order is released to the Buyer could be an appropriate
method to eliminate mandatory information related errors.
Based on the empirical results of this case study the Order Handling and Logistics team is
challenged to be responsible for preventing and eliminating the mandatory information related
errors from error categories 1 and 2. The target should be that all the mandatory information
related errors are eliminated and no such errors are tolerated in the future. The check-list should
be integrated into standardised working practices being an essential part of every LC’s work.
The most common errors in the technical customer data category were missing site installation
address or waiver form or incorrect or missing serial number of original purchase order or base
unit. Also errors where care manager contact information was missing or incorrect occurred. In
the commercial customer data category the most common errors were missing deal identification
for one main supplier and missing, incorrect delivery address and errors where the requested
delivery date was not according to the product lead time.
In addition, the LCs, OE and OCS should be set to work even more closely and effectively than
currently in order to minimize the incorrect sales orders for the Buyers. In practice this means for
example that the LCs should communicate more with the Order Configuration Support before
releasing the sales order for purchasing.
7.2.3 New Quality Control Method
In essence, the minimized lead time of a purchase order handling process as a consequence of
order correctness in the process is the outcome of the level of operational quality the organisation
96
has been able to achieve in its different teams and functions. The level of cooperation between
different teams is a key factor affecting the performance of the organisation. Fluent cooperation
between different functions in an organisation presupposes in practice well-designed processes
and ways of working.
As was discovered during this study, the sharing of information about the number of incorrect
sales orders in the Purchasing team was not effective and led to unreliable order correctness
reports. Therefore an information collection method was needed to give feedback on the errors to
the front-end of the process. The requirement was that the quality control method would require
as little efforts as possible from the Buyers. Finally, an idea of an order status Excel template for
the Buyers came up.
The error follow-up tool as a new quality control method was implemented in the Purchasing
team in the beginning of January 2010. The purpose was to improve the communication of the
incorrect sales orders to OE and thus with the help of OE to give feedback on the errors to the
Customer teams. Based on the empirical study this is one of the main ways that the Buyers as
well as the case organisation can improve to minimize the number of incorrect sales orders
released for purchasing.
The new quality control method is based on this study’s data collection method of errors. It
includes basic information about the sales orders in the process that helps the Buyers to handle
the orders in everyday work. Two columns were added to follow-up the incorrect orders;
whether the order is clean or incorrect and the error description field. The order status Excels are
saved by each Buyer by name and located in shared folders where OE’s Birgitta can collect the
data to run the reports about order correctness. If needed, she can ask for additional information.
The information content of the new order status Excel sheets serves mainly the Buyers and OE,
but also the LCs, Line Managers and Category Specialists. The template of an order status Excel
is demonstrated in Appendix 4.
The fact that facilitated the implementation of the new quality control method was that it
replaced the old order status Excels that previously had different contents depending on the
Buyer. The threshold to introducing was also lowered by the error follow-up during November
and December 2009. The order status Excels with identical contents ease the holidays and other
periods of substitution as it is easier to read and interpret every Buyers’ status Excels. Birgitta
also assisted in creating an error description list of the 20 most commonly occurring errors to
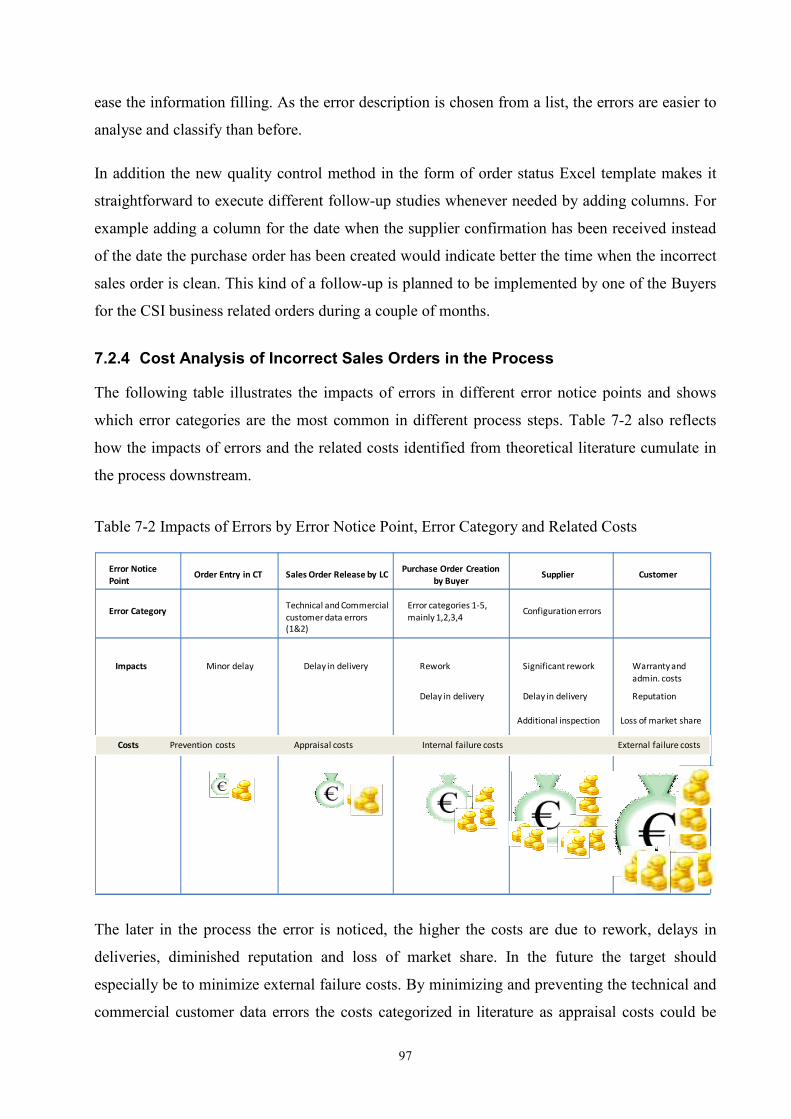
97
ease the information filling. As the error description is chosen from a list, the errors are easier to
analyse and classify than before.
In addition the new quality control method in the form of order status Excel template makes it
straightforward to execute different follow-up studies whenever needed by adding columns. For
example adding a column for the date when the supplier confirmation has been received instead
of the date the purchase order has been created would indicate better the time when the incorrect
sales order is clean. This kind of a follow-up is planned to be implemented by one of the Buyers
for the CSI business related orders during a couple of months.
7.2.4 Cost Analysis of Incorrect Sales Orders in the Process
The following table illustrates the impacts of errors in different error notice points and shows
which error categories are the most common in different process steps. Table 7-2 also reflects
how the impacts of errors and the related costs identified from theoretical literature cumulate in
the process downstream.
Table 7-2 Impacts of Errors by Error Notice Point, Error Category and Related Costs
Error Notice
PointOrder Entry in CT Sales Order Release by LC
Costs
Impacts
Error Category
Purchase Order Creation
by BuyerSupplier
Configuration errorsTechnical and Commercial
customer data errors
(1&2)
Error categories 1-5,
mainly 1,2,3,4
Rework
Customer
Warranty and
admin. costs
Reputation
Loss of market share
Delay in deliveryDelay in delivery
Delay in deliveryMinor delay Significant rework
Additional inspection
Costs Prevention costs Appraisal costs Internal failure costs External failure costs
The later in the process the error is noticed, the higher the costs are due to rework, delays in
deliveries, diminished reputation and loss of market share. In the future the target should
especially be to minimize external failure costs. By minimizing and preventing the technical and
commercial customer data errors the costs categorized in literature as appraisal costs could be
98
diminished. This should be added into the Order Handling and Logistics team’s responsibilities.
Accordingly, in the purchase order creation notice point, the Buyers should be responsible for
preventing internal failure costs.
By preventing the order configuration errors, which are the errors that most commonly reach the
supplier, both the internal and external failure costs could be diminished. At this notice point the
amount of spared rework is significant in terms of costs. The Order Configuration Support teams
should be responsible for preventing the order configuration errors.
7.3 Other Observations
During this assignment thesis project it became evident from various references that the source
of errors appeared most often to be in the Customer teams and Solution managers. Therefore, as
a part of continuous improvement, more training should be provided in the critical phases of the
process to the front-end. There should also be presentations about the whole process and the
responsibilities of different working roles to everyone involved to leverage information about the
impacts and consequences of the errors done in the front-end on the entire order-delivery
process.
It was discovered that the long process with several separated responsibilities and tasks bends
badly when things do not go as planned. Especially in the case of an incorrect sales order noticed
in the later phase of the process the fixing process takes as many process steps and people
involved backwards in the order-delivery process as it takes normally to one direction.
Compared to a short process the lead time eventually becomes the longer the more process steps
and people with specific working responsibilities and rights are involved.
Better information and communication standards are needed to guarantee the effective and on-
time information flow between the stakeholders in a complex order-delivery process. As the
work in the case company is very e-mail intense some company-wide rules for communication
would be useful to minimize the extensive load of incoming e-mails and eventually ease the
workload. Agreed standards along with effective working practices in different working roles
would benefit the performance of the process and improve the lead time.
The empirical results of this case study can be compared to the history data of incorrect sales
orders collected by OE. As mentioned, the incorrect sales orders were previously reported via e-
mail to OE. During the data collection of this research the incorrect sales orders were marked in
99
the Buyers’ order status Excel sheets. It can be assumed that the data collecting method with the
help of order status Excel sheets is more effective than e-mailing giving more reliable
information about the number of incorrect sales orders.
The impact of different data collection methods of incorrect sales orders on OE’s monthly
reports is presented in Appendix 2. Because the incorrect sales orders were reported to OE by the
new collection method during November and December 2009 due to the data collection for this
research, the proportion of incorrect sales orders showed a change in the trend. For example with
the previous error collection method the share of incorrect sales order was 25% in September and
20% in October whereas in November it was 46% and in December 31%. As the number of
incorrect sales orders can be assumed to be somewhat stable regardless of the reporting month
and depending mainly on the total number of incoming sales orders, the high variation of order
correctness level can be seen as an indicator of an ineffective information collection method.
100
8 Discussion
Order correctness guaranteeing that the customer receives what has been agreed on is one
important factor affecting customer satisfaction. The importance of prompt deliveries according
to the original customer order has increased as companies are streamlining supply chains and
seeking new ways to fulfill customers’ increasing demands. Companies that cannot keep their
order correctness of order-delivery process performance consistently on a high level will fall
behind of their competitors and risk losing customers. A highly competitive market environment
leaves no room for errors. In order to improve customer satisfaction, it is a necessity to improve
process lead time and quality.
However, long supply chains and global ordering processes including 3rd party suppliers are
major challenges that make this axiomatic target a demanding task. Therefore, effective
continuous improvement practices are needed to react to changes in factors that impact order
correctness and eventually customer satisfaction. More importantly, they are needed to exceed
the previous performance levels and strive for higher quality in purchase process performance.
This study explored the impacts of incorrect sales orders on the purchase order process in a
global case organisation functioning in the telecommunications industry. The focus was to find
ways the case organisation could continuously improve to minimize the number of incorrect
sales orders. The objectives were to describe the current situation to support decision-making,
identify the errors of incorrect sales orders, and find out the time and the cost of extra work spent
on cleaning the sales orders. The empirical purpose was to find out the number of incorrect sales
orders released for purchasing, how the incorrect sales orders are processed and measure the lead
time of handling incorrect sales orders in the purchasing process. The empirical research was
carried out as a case study by collecting error related data of sales orders released for purchasing,
as well as through interviews, an inquiry and by participation-observation in the case
organisation.
The research framework described how to improve quality, operational performance, and
customer satisfaction by continuous improvement of internal processes by minimizing the order
processing costs and improving internal order correctness. The theoretical section was build on
the basis of literature on Total Quality Management, Supply Chain Management, Process
101
Management, Continuous Improvement, Performance Measurement and Information
Management.
8.1 Research Progress and Contribution
The width of the problem of incorrect sales orders is well-known in the case company. Wherever
in the company the author was asked about the subject of the thesis, a toothy smile or
incredulous sneer was followed when the concept of “incorrect sales orders” was mentioned. In
addition to this, because of the length and complexity of the global order-delivery process, the
focus and objectives of this study were set to be specially from the case organisation’s and
Buyers’ perspective, focusing on how the case organisation and Buyers could improve to
minimize the number of incorrect sales orders. It became evident that the solution cannot solely
be something that just pushes the problem to the previous step of the process blaming only others
for bad quality. Therefore, several methods for the case organisation and Buyers to continuously
improve the purchase process were explored in this study.
This research project had two goals from two quarters’ needs and expectations. First, the
objective was to write a thesis from scientific perspectives and fulfill the educational
requirements. Also, as an assignment for the case company, the objective of this project was to
find ways and target areas to improve that could ease the workload of the Purchasing team
related to incorrect sales orders and finally create a real-life contribution.
The main contribution of this thesis in the case organisation is the new quality control method
that forwards reliable information about the incorrect sales orders released for purchasing to OE
and finally to the Customer teams. The quality control method was implemented in the
Purchasing team as a part of continuous improvement to improve the reporting of errors and
information flow quality. The company has to take charge of how the feedback will be exploited
to minimize the incorrect orders in the future.
One valuable finding based on the error categorization and empirical data analysis was that
40 percent of the errors related to missing mandatory information that reach the purchasing could
be eliminated by the case organisation with small efforts. This was calculated as a total sum of
technical customer data errors and commercial customer data errors. The share of these errors
can be understood to be significant and the result reliable because parallel results have been
measured before by OE. This study recommends a check-list for the LCs sales order releasing
working phase to prevent mandatory information related errors.
102
The research results showed that 33% of the sales orders were incorrect during the data
collection period. This was lower than expected based on mutual estimation before the data
collection. The finding that the incorrect sales orders lengthened the lead time of purchase order
creation from the 1 day’s target to 3.2 days was as assumed. However, the surprising result was
that even the clean orders’ purchase order creation lead time was 1.7 days during the reporting
period. It soon became clear that this result showed more evidence of the true impacts of
incorrect sales orders. It can be stated that the processing time spent on incorrect sales orders
with the current resources deteriorates the order handling performance of clean sales orders.
It was assumed by the Buyers and author that the most time-consuming errors are related to
incorrect or unclear configuration. The results showed this wrong as the incorrect configuration
errors’ lead time was in average 3.6 days whilst the product data related errors had unexpectedly
the longest lead time, 4.9 days. These product data errors during the reporting period were
mainly from the APAC region where the volume of sales orders is high. A part of these sales
orders included also configuration errors that altogether lengthened the lead time of purchase
order creation from four to six days.
The impact of incorrect sales orders on the averaged purchase order creation lead time showed
no significant differences between the different regions. This can be interpreted as consistency in
the working performance of the Buyers or the reporting period of two months was too short to
show significant differences.
Although the data was collected only for two months the total number of reported sales orders
was adequate for a case study, 696. The time frame of 6 months for this research was too short to
execute an extended follow-up on how the new quality control method affects OE’s monthly
reports about the incorrect sales orders in the case organisation. This study could have included
an examination of variability in the process as mentioned in Chapter 2.3 because variability
degrades performance depending on where in the process it occurs. This would have offered an
interesting viewpoint and it would have deepened the examination in finding even more effective
ways to minimize the incorrect sales orders. Also the impacts and additional efforts of supplier-
specific cooperation could have been examined to unite with the correct product information
with the order creation level and to improve order correctness.
As described a long and complex process with several separated responsibilities and tasks bends
badly to changes. This led to the conclusion that better information and communication
103
standards are needed to guarantee the effective and on-time information flow between different
stakeholders. Furthermore, agreed standards and effective working practices in different working
roles would benefit the performance of the process and improve the lead time. However, creating
standardized practices may prove to be a demanding task as the process itself is complex and full
of special situations and practices due to highly customized system products.
In the beginning of this project it was noticed that it is hard to find sales and purchase order
handing related literature. However, it was soon realized that the subject is so dependent on the
products, processes, customers and other environment related issues that general order handling
information is almost impossible to define. Still, the main concepts of order and lead time in the
order-delivery process are well-known and have the same characteristics regardless of industry
related factors. Because of this it can be stated that the framework seems applicable for
evaluating the implications of incorrect sales orders in the purchase process of a
telecommunications company and could be applied to other industries’ internal order correctness
process performance improvement efforts as well. However, what comes to analyzing the results
of performance, the special characteristics of customized system products and complex order-
delivery processes might make the application to other environments a challenging task.
Six Sigma is a widely used measure to determine the current state of a process. The sigma level
of order correctness in the Purchasing team was 1.94, which is an unsatisfactory result from a
company that is one of the leading players in its field. The appropriate level to strive for from
these starting points would be sigma level 3, which means that the acceptable error level is
6.7 percent.
The purpose of this research was to identify and explore where the case organisation currently is
and how to achieve the three principles mentioned by the CEO in everyday work: customer-
driven focus and outside-in thinking, speed and simplified ways of working as well as
empowerment, responsibility and accountability. If the outcome of this research is applied to
these three principles, it can be stated that improving process quality and lead time will
eventually increase customer satisfaction. If we see the output of the internal processes through
the customer’s eyes the benefits of customer-driven focus and outside-in thinking can be
expected. Improved lead time is concretely speaking speed but it is also a result of simplified
ways of working. Continuous improvement efforts require teamwork and company-wide
empowerment because in the end the maintenance of quality and prevention of the costs of bad
quality is in everyone’s hands in the future.
104
Therefore, this study built a model for the continuous improvement of the purchase process and
order correctness performance by exploring the impacts of incorrect sales orders on the purchase
order handling process. It was also noticed that any improvement in order quality through order
correctness can easily and in a short time bring good results in the improvement of lead times
and customer satisfaction. Therefore, from now on, it is fundamental how the results of this
study are exploited in the case organisation. Finally, management support is required to ensure
that the empirical results are exploited as continual efforts toward improvement.
8.2 Suggestions for Future Research
In the continuous battle against incorrect sales orders the case organisation could research further
customer satisfaction of the lead time and overall performance. Also subjects such as what are
the customer requirements and expectations in different regions and what customers consider as
good-quality features of a product and the order-delivery process of those features. In addition,
the profit impacts of customer satisfaction market share changes as a result of changes in
customer satisfaction could be examined as well. The focus should be chosen reckoning with that
one of the main indicators of customer satisfaction is process quality and order correctness. It
would be important to share this kind of information from the end-customers to the case
organisation and all its employees so that the results would not stay only in the management
level. Impacts of employee satisfaction on customer satisfaction could be researched as well, as
based on this study the Buyers experienced the handling and fixing the incorrect sales orders
very frustrating, especially in the current situation where the workload is felt to be huge.
This research could be repeated again, but calculating the lead time from the sales order release
date to the date when the supplier confirmation has been received instead of purchase order
creation date. As a lesson learned from this study the date the confirmation has been received
indicates better the time the order is finally correct than the purchase order creation date, as the
error can be noticed after the purchase order creation. Also the impact of incorrect sales orders
on the lead time of purchase order creation could be examined from different suppliers’
perspective. The objective could be to find out how different suppliers’ special characteristics,
processes, products, delivery terms etc. affect order correctness. Further, also a research how
suppliers regard the incorrect sales orders relating mainly to incorrect configuration and how this
affects overall supplier satisfaction could be carried out.

105
In the future, in case any improving actions or changes like education, training or additional
working resources are placed in the order entry phase, the impacts of these actions on the
purchase order creation phase should be measured. Monitoring is needed to reveal improvement
or deterioration. It must be understood that any action made anywhere in the order-delivery
process has impacts on the entire process.
106
References
Alsmadi, S.A. (2009) “Kaizen strategy and the drive for competitiveness: challenges and
opportunities”, Competitiveness Review: An International Business Journal, Vol. 19, No. 3, pp.
203-211.
Brunet, A.P. & New, S. (2003) “Kaizen in Japan: an empirical study”, International Journal of
Operations & Production Management, Vol. 23, No. 12, pp. 1426-1446.
Brown, S., Blackmon, K., Cousins, P. & Maylor, H. (2001) Operations Management: Policy,
Practice and Performance Improvement, Butterworth-Heinemann, Oxford, 439 p.
Chan, F.T.S., Lau, H.C.W., Ip, R.W.L., Chan, H.K., and Kong, S. (2005) “Implementation of
total productive maintenance: a case study”, International Journal of Production Economics,
Vol. 95, No. 1, pp. 71-94.
Christopher, M. (1998) Logistics and Supply Chain Management: Strategies for Reducing Cost
and Improving Service, Financial Time Prentice-Hall, New York, 294 p.
Clark, T.J. (1999) Success Through Quality: Support Guide for the Journey to Continuous
Improvement, ASQ Quality Press, Milwaukee, 132 p.
Collin J. & Lorenzin D. (2006) “Plan for supply chain agility at Nokia”, International Journal of
Physical Distribution & Logistics Management, Vol. 36, No. 6, pp. 418-430.
Cooper, M.C., Lambert, D.M. & Pagh, J.D. (1997) “Supply Chain Management: More Than a
New Name for Logistics”, International Journal of Logistics Management, Vol. 8, Issue 1, pp. 1-
14.
Cooper, M.C. & Lambert, D.M. (2000) “Issues in Supply Chain Management”, Industrial
Marketing Management, Vol. 29, Issue 1, pp. 65-83.
Crosby, P.B. (1984) Quality without Tears, McGraw-Hill, New York, 205 p.
Croxton, K., Garcia-Dastugue, S., Lambert, D. & Rogers, D. (2001) “The Supply Chain
Management Processes”, International Journal of Logistics Management, Vol. 12, No. 2, pp. 13-
36.
Doolen,, T.L., Van Aken E.M., Farris, J.A., Worley J.M., Huwe J. (2008) “Kaizen events and
organisational performance: a field study”, International Journal of Productivity and
Performance Management, Vol. 57, No. 8, pp. 637-658.
Dorsch, J.J., Yasin, M.M. & Czuchry, A.J. (1997) “Application of Root Cause Analysis in a
Service Delivery Operational Environment”, International Journal of Service Industry
Management, Vol. 8, No. 4, pp. 268-289.
Evans, J.R. & Lindsay W.M. (2005) The Management and Control of Quality, Thomson South-
Western, Singapore, 760 p.
107
Fawcett, S.E., Wallin, C., Allred, C. & Magnan G. (2009) “Supply chain information-sharing:
benchmarking a proven path”, Benchmarking: An International Journal, Vol. 16, No. 2, pp. 222-
246.
Gopalakrishnan, J. (2006) “Manage the Kaizen way”, Intercom, Vol. 53, No. 6, pp. 21-24.
Halachmi, A. (2002) “Performance measurement, accountability, and improved performance,
Public Productivity and Management Review, Vol. 25, No. 4, pp. 370-374.
Halachmi, A. (2005) “Performance measurement is only one way of managing performance”,
International Journal of Productivity and Performance Management, Vol. 54, No. 7, pp. 502-
516.
Heikkilä, J. (2002) “From supply to demand chain management: efficiency and customer
satisfaction”, Journal of Operations Management, Vol. 20, p. 747-767.
Hopp, W.J. & Spearman, M.L. (2001) Factory Physics – Foundations of Manufacturing
Management 2nd
ed., Irwin/McGraw-Hill, New York, 698 p.
IBM and Crosby, P.B. (1980) First Time Right, IBM.
Iloranta, K. & Pajunen-Muhonen, H. (2008) Procurement Management – from Purchasing to
Supplier Management (in Finnish), Tietosanoma Oy, Jyväskylä, 498 p.
Imai, M. (1986) The Key to Japan’s Competitive Success, McGraw-Hill, New York, NY.
Kankkunen, K., Matikainen, E. & Lehtinen, L. (2005) Success Through Measures (in Finnish),
Talentum, Helsinki, 253 p.
Karrus, K.E. (2005) Logistics (in Finnish), WSOY, Helsinki, 412 p.
Koskinen, I., Alasuutari, P. & Peltonen, T. (2005) Qualitative Methods in Commercial Sciences
(in Finnish), Vastapaino, Tampere, 350 p.
Krajewski, L.J. & Ritzman, L.P. (2005) Operations Management: Processes and Value Chains,
Seventh edition. Pearson Prentice Hall, New Jersey, 805 p.
Krüger, V. (1996) “How can a company achieve improved levels of quality performance:
technology versus employees?” The TQM Magazine, Vol. 8, No. 3, pp. 11-20.
Kuglin, F.A.K. (1998) Customer-Centered Supply Chain Management, A Link-by-Link Guide,
American Management Association, New York, 267 p.
Laamanen, K. & Tinnilä, M. (2009) Terms and Concepts in Business Process Management,
Metalliteollisuuden Kustannus Oy, Helsinki, 144 p.
Lambert, D., Cooper, M. & Pugh, J. (1998) “Supply Chain Management: Implementation Issues
and Research Opportunities”, The International Journal of Logistics Management, Vol. 9, No. 2,
pp- 1-19.
Lecklin, O. (2006) Quality as a Success Factor of a Company (in Finnish), Kauppakaari,
Helsinki, 393 p.
108
Manos, A. (2007) “The benefits of Kaizen and Kaizen events”, Quality Progress, Vol. 40, No. 2,
pp. 47-48.
Monczka, R.M., Handfield, R.B., Giunipero, L.C. & Patterson, J.L. (2009) Purchasing and
Supply Chain Management, South-Western Cengage Learning, USA, 349 p.
Neese, M. (2007) “A foundation for continuous improvement”, Circuits Assembly, Vol. 18, No.
7, pp. 50-51.
Sajari, P. (2009) Interview of the Chief Executive Officer of the case company, Helsingin
Sanomat, 29.11.2009, B9.
Simchi-Levi, D., Kaminsky, P. & Simchi-Levi E. (2000) Designing and Managing the Supply
Chain, McGraw-Hill, Boston, 321 p.
Tarkkala, M. (2004) Operations Management, Lecture Series, Helsinki School of Economics.
Weele, A.J.V. (2005) Purchasing & Supply Chain Management, Analysis, Strategy, Planning
and Practice, Thomson Learning, Croatia, 358 p.
Wilcox, M. & Morton, R. (2006) “Optimizing efficiency with Kaizen blitz”, Process Cooling &
Equipment, November/December, pp. 21-25.
Wilson, P.F. (1996) “A Darwinian Future is Looming”, Quality Progress, Vol. 29, Iss. 7, pp. 45-
48.
Wilson, P.F., Dell, L.D. & Anderson, G.F. (1993) Root Cause Analysis: A Tool for Total Quality
Management, ASQC Quality Press, Milwaukee, 216 p.
Wilson, P.F. & Pearson R.C. (1995) Performance-Based Assessments, External, Internal, and
Self-Assessment Tools for Total Quality Management, ASQC Quality Press, Milwaukee, 202 p.
Yin, R.K. (2003) Case Study Research: Design and Methods, Sage Publications, Thousand
Oaks, 181 p.
109
Interviews, info-sessions, observations
Aki, Specialist, Logistics and Configuration, Order Configuration Support, Espoo,
10th November 2009
Birgitta, Logistics Manager, Order Engineering, Espoo, 19th October 2009
Harri, Head of Technical Support, Espoo, 9th November 2009
Pierre, Principal Software Designer, Kaizen workshop, Espoo, from 6th to 8
th October 2009
Regular Meetings in case organisation, Espoo, from 13th September 2009 to 12
th March 2010
Inquiry for Buyers, during September 2009
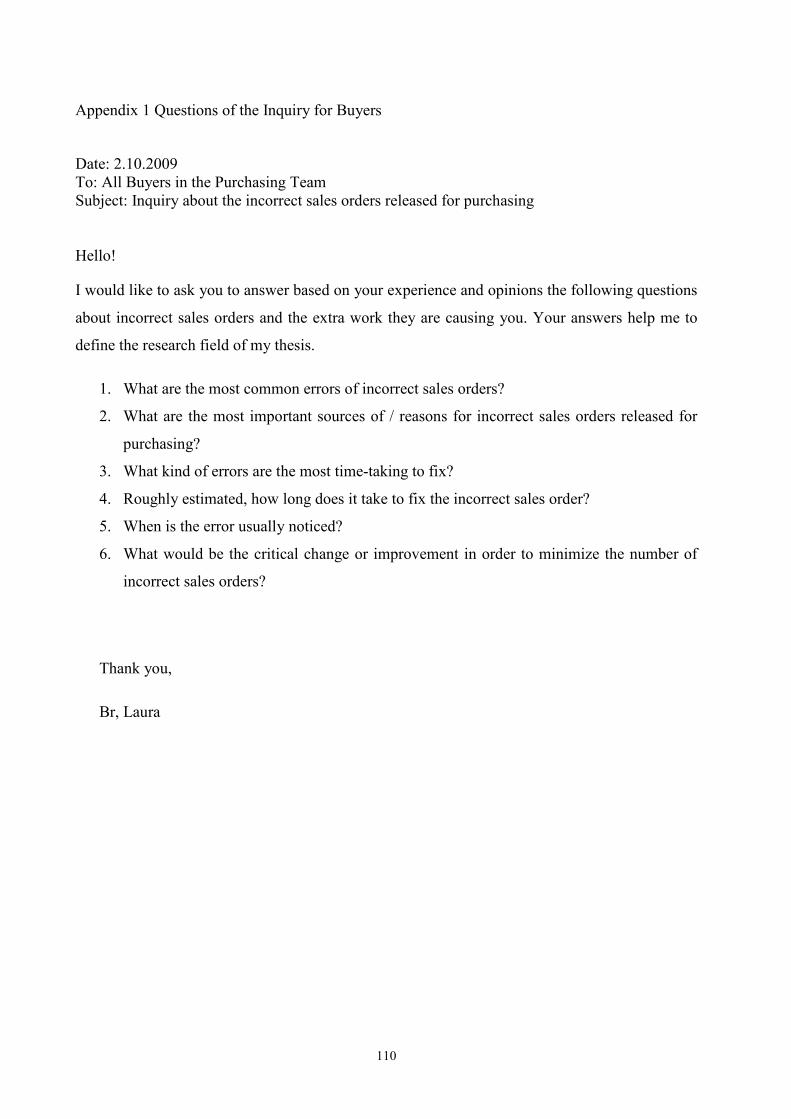
110
Appendix 1 Questions of the Inquiry for Buyers
Date: 2.10.2009
To: All Buyers in the Purchasing Team
Subject: Inquiry about the incorrect sales orders released for purchasing
Hello!
I would like to ask you to answer based on your experience and opinions the following questions
about incorrect sales orders and the extra work they are causing you. Your answers help me to
define the research field of my thesis.
1. What are the most common errors of incorrect sales orders?
2. What are the most important sources of / reasons for incorrect sales orders released for
purchasing?
3. What kind of errors are the most time-taking to fix?
4. Roughly estimated, how long does it take to fix the incorrect sales order?
5. When is the error usually noticed?
6. What would be the critical change or improvement in order to minimize the number of
incorrect sales orders?
Thank you,
Br, Laura
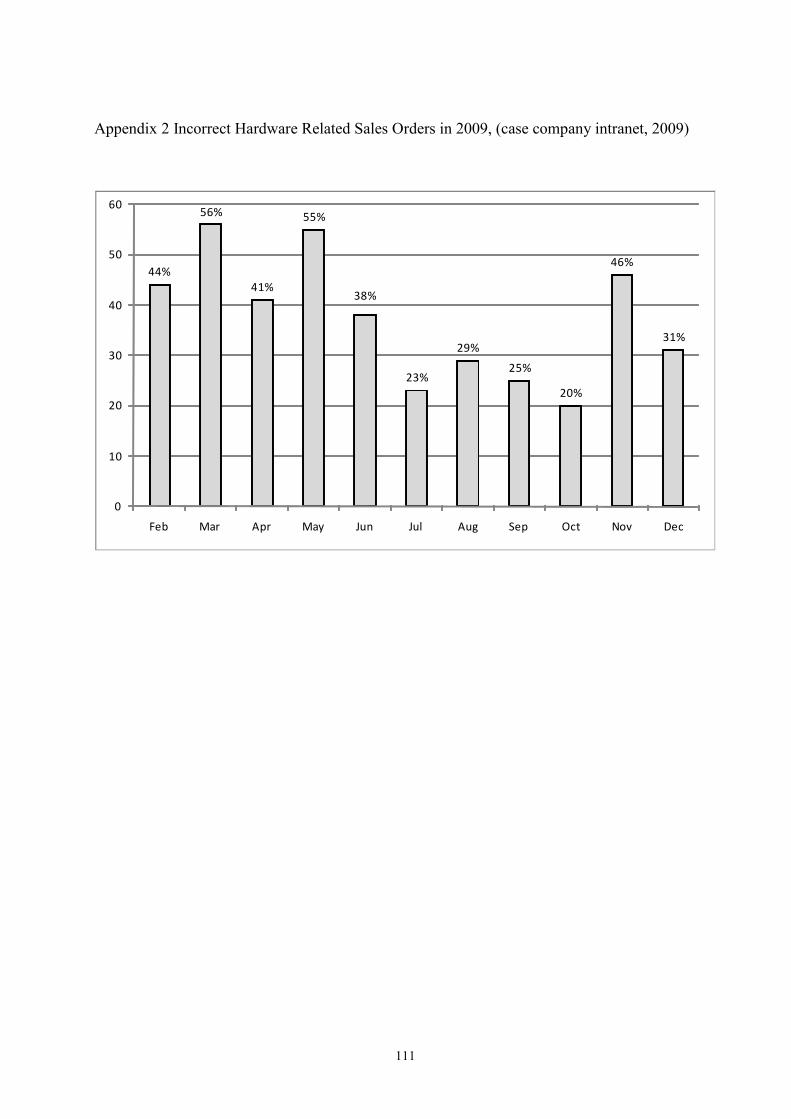
111
Appendix 2 Incorrect Hardware Related Sales Orders in 2009, (case company intranet, 2009)
44%
56%
41%
55%
38%
23%
29%
25%
20%
46%
31%
0
10
20
30
40
50
60
Feb Mar Apr May Jun Jul Aug Sep Oct Nov Dec

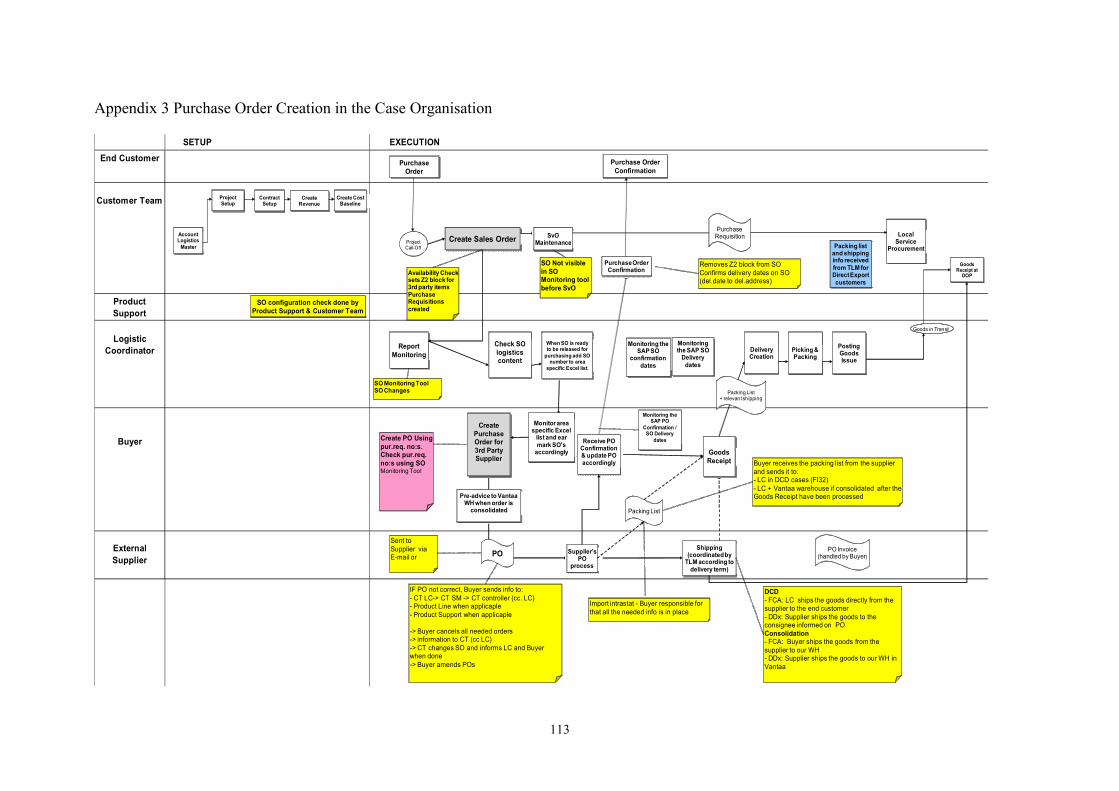
113
Appendix 3 Purchase Order Creation in the Case Organisation
End Customer
Product
Support
Logistic
Coordinator
Buyer
External
Supplier
SETUP EXECUTION
Customer Team
Account Logistics
Master
Create Cost Baseline
Create Revenue
Contract Setup
Project Setup
Create Sales Order
Create
Purchase Order for
3rd Party Supplier
Project Call-Off
SvO Maintenance
Report
Monitoring
SO Monitoring ToolSO Changes
Supplier's PO
process
Sent to
Supplier via E-mail or PO
Receive PO Confirmation & update PO accordingly
Removes Z2 block from SO
Confirms delivery dates on SO (del.date to del.address)
Availability Check sets Z2 block for 3rd party itemsPurchase Requisitions created
Goods
Receipt
Delivery Creation
Picking & Packing
Posting Goods Issue
Shipping(coordinated by TLM according to delivery term)
Goods in Transit
PO Invoice(handled by Buyer)
Goods Receipt at DOP
Local Service
Procurement
Purchase Requisition
Create PO Using
pur.req. no:s. Check pur.req.
no:s using SO Monitoring Tool
Packing List
SO Not visible
in SO Monitoring tool
before SvO
Purchase
Order
Purchase Order Confirmation
SO configuration check done by
Product Support & Customer Team
Check SO
logistics content
When SO is ready to be released for
purchasing add SO number to area
specific Excel list.
IF PO not correct, Buyer sends info to:
- CT LC-> CT SM -> CT controller (cc. LC)- Product Line when applicaple
- Product Support when applicaple
-> Buyer cancels all needed orders-> information to CT (cc LC)
-> CT changes SO and informs LC and Buyer when done
-> Buyer amends POs
Buyer receives the packing list from the supplier
and sends it to:- LC in DCD cases (FI32)
- LC + Vantaa warehouse if consolidated after the Goods Receipt have been processed
Purchase Order
Confirmation
Packing List+ relevant shipping
Pre-advice to Vantaa WH when order is consolidated
Packing list and shipping info received from TLM for Direct Export customers
Import intrastat - Buyer responsible for
that all the needed info is in place
Monitoring the SAP SO
confirmation dates
Monitoring the SAP PO
Confirmation / SO Delivery
dates
Monitoring the SAP SODelivery dates
DCD
- FCA: LC ships the goods directly from the supplier to the end customer
- DDx: Supplier ships the goods to the consignee informed on PO
Consolidation- FCA: Buyer ships the goods from the
supplier to our WH- DDx: Supplier ships the goods to our WH in
Vantaa
Monitor area specific Excel list and ear mark SO's accordingly
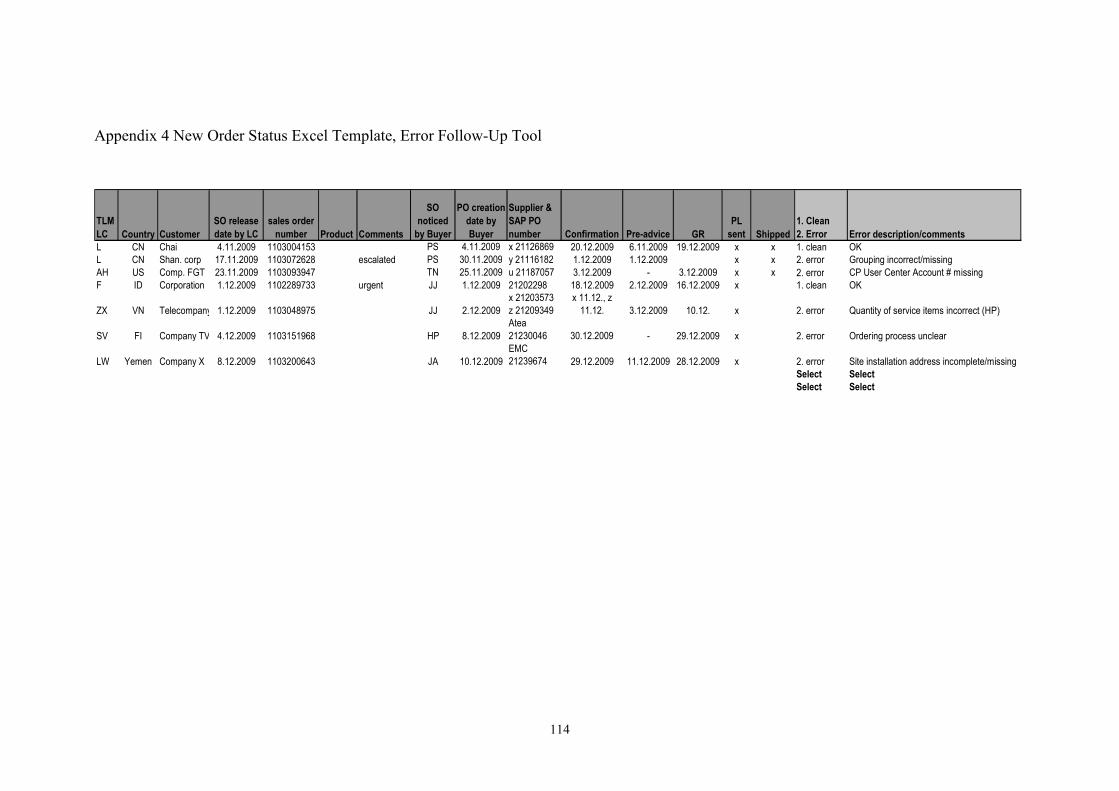
114
Appendix 4 New Order Status Excel Template, Error Follow-Up Tool
TLM
LC Country Customer
SO release
date by LC
sales order
number Product Comments
SO
noticed
by Buyer
PO creation
date by
Buyer
Supplier &
SAP PO
number Confirmation Pre-advice GR
PL
sent Shipped
1. Clean
2. Error Error description/comments
L CN Chai 4.11.2009 1103004153 PS 4.11.2009 x 21126869 20.12.2009 6.11.2009 19.12.2009 x x 1. clean OK
L CN Shan. corp 17.11.2009 1103072628 escalated PS 30.11.2009 y 21116182 1.12.2009 1.12.2009 x x 2. error Grouping incorrect/missing
AH US Comp. FGT 23.11.2009 1103093947 TN 25.11.2009 u 21187057 3.12.2009 - 3.12.2009 x x 2. error CP User Center Account # missing
F ID Corporation 1.12.2009 1102289733 urgent JJ 1.12.2009 21202298 18.12.2009 2.12.2009 16.12.2009 x 1. clean OK
ZX VN Telecompany 1.12.2009 1103048975 JJ 2.12.2009
x 21203573
z 21209349
x 11.12., z
11.12. 3.12.2009 10.12. x 2. error Quantity of service items incorrect (HP)
SV FI Company TV 4.12.2009 1103151968 HP 8.12.2009
Atea
21230046 30.12.2009 - 29.12.2009 x 2. error Ordering process unclear
LW Yemen Company X 8.12.2009 1103200643 JA 10.12.2009
EMC
21239674 29.12.2009 11.12.2009 28.12.2009 x 2. error Site installation address incomplete/missing
Select Select
Select Select