Embed Size (px)
Citation preview

The Impact of Vertical FDI on DomesticInvestment: Firm-level Evidence from South
Korea
Kwang Soo Kim1 Aslı Leblebicioglu2
1University of Texas at Dallas
2University of Texas at Dallas
June 3, 2016

FDI and Capital Accumulation
I It is commonly agreed that FDI relaxes credit constraints for firms that receivecapital transfers, and allows them to invest more.
I However, there is no consensus on the impact of FDI on the overall domesticcapital accumulation.
I There is a large body of literature that uses aggregate data to study the effects
of FDI on investment. Some examples of this literature include:I Crowding-in effects: Bosworth et al (1999); Tang et al (2008); Farla et al
(2014)I Crowding-out effects: Agosin and Machado (2005); Mutenyo et al (2010);
Morrissey and Udomkerdmongkol (2012)
I We contribute to the literature by analyzing how FDI can affect domestic firms’investment decisions using firm level data from South Korea for the 2006-2014period.

Our Contribution
I We combine the firm-level data-set, which contains information on thepercentage of equity owned by foreigners, with the input-output tables providedby the Bank of Korea to construct industry level measures of foreign presence inthe horizontally and vertically integrated industries.
I We estimate investment Euler equations for domestic firms augmented withthese foreign presence measures.
I We find a positive and significant effect of foreign presence in both horizontallyand vertically linked industries on domestic firm’s investment rate, with largereffects arising from multinational presence in the supplying sectors.
I We also show that there is heterogeneity in the impact of FDI based on thefirm’s size, and exporting status, as well as the financial constraints it is facing.

Related Literature
1. Productivity and FDI: There is a growing body of literature that uses firm-leveldata to analyze the effects of FDI on firms productivity. Some of the seminalexamples include Aitken and Harrison (1999), Markusen and Venables (1999),Javorcik (2004), Blalock and Gertler (2008), Keller and Yeaple (2009).
2. Financial Constraints and FDI: A related strand of the literature employsinvestment Euler equations to study the impact of FDI on firms’ creditconstraints. Some of the seminal examples include Harrison and McMillan(2003), Harrison, Love and McMillan (2004), Javorcik and Spatareanu (2009).

Investment Decisions
I The firm chooses investment, Iit , in period t in order to maximize the netpresent value of profits:
Vit(Kit−1) = max
Πit − G (Kit , Iit)− Iit + βVit+1(Kit)
subject to Kit = (1− δ)Kit−1 + Iit
I G (Kit , Iit): convex adjustment costs
I Πit : maximum profit obtained by choosing the optimal level of variableinputs and the output price
I Optimal investment decision yields the usual Euler equation:
1+∂G (Kit−1, Iit)
∂Iit= βEt
[∂Πit+1
∂Kit−∂G (Kit , Iit+1)
∂Kit+ (1− δ)
(1 +
∂G (Kit , Iit+1)
∂Iit+1
)]

Marginal profitability of capital and Multinational presence
I The firm maximizes expected profits:
Πt = maxpit ,Lit
Et−1 pitxit − wtLt
subject to: xit = F (Kit−1, Lit)
where the demand firm faces is xit =(
pitPt
)−θXt .
I Marginal profitability of capital is given by
∂Πit
∂Kit−1=
[1
Kit−1
(xitpit
ψi− wtLit
)| Ωt−
]
where ψi = θθ−1
is the firm’s mark-up.
I Multinational presence in the vertically and horizontally linked industries can
affect investment decisions through ∂Πit∂Kit−1
.

Investment equation
I Combining the investment Euler equation, the expression for the marginalprofitability of capital, and assuming quadratic adjustment costs, we obtain anon-linear equation in variables of interest.
I We linearize the Euler equation using a first-order Taylor approximation aroundthe steady-state, which yields the following investment equation:
Iit
Kit−1= Et
[φ0 + φ1
Iit+1
Kit+ φ2
Sit+1
Kit− φ3
Zit+1
Kit
]
Ijit : investment
Sit : sales
Zit : variable input costs

Empirical Investment Equation and Its Estimation
I As our empirical investment equation, we use:
Iijt
Kijt−1= α1
Iijt−1
Kijt−2+ α2
Sijt
Kijt−1+ α3
Cijt
Kijt−1+ α4FDIHjt + α5FDIBjt + α5FDIFjt
+υi + ηt + τjt + εijt
I We estimate the dynamic investment equation using the System GMM(Arellano and Bover (1995) and Bond and Blundell (1998)) which allows us tocontrol for unobservable firm effects and the endogeneity of lagged investment,sales, cash flows and exposure.

Firm-level DataI Our data for the South Korean manufacturing firms comes from Korean
Information Services, Inc. (KIS).
I The data are obtained from the balance-sheet of public and private firms. KIScompiles data on all firms conforming to one of several criteria (based on assetsize, liabilities and number of employees), as required by the Act of ExternalAudit of Joint-Stock Corporations.
I The data-set includes information on sales, costs, book value of fixed assets(capital), as well as percentage of foreign ownership.
I We follow Kim, Tesar, and Zhang (2015) in constructing real investment and
real capital stock.I Real investment: change in the book value of capital (tangible assets -
land and lease) plus depreciation costs, deflated by the capital goods priceindex
I Real capital: constructed using the perpetual inventory method
I In order to maximize the coverage of firms included in the sample, we choose2006 as the initial year.
I We classify a firm as domestic if it has foreign equity less than 10%.Consequently, we use information on 6,430 unique firms for the 2006-2014period.

FDI measures
I We follow Javorcik (2004) in constructing the measures of horizontal andvertical FDI.
I The proxies for horizontal and vertical linkages are constructed at the two-digitindustry level, as defined by the Bank of Korea.
I Horizontal FDI (FDIHjt ): measures the extent of foreign presence in the samesector as the firm is operating in.
FDIHjt =
∑for all i∈j
ForeignShareit ∗ Sit∑for all i∈j
Sit
I ForeignShareit : percentage of firm i owned by foreign firms
I Sit : real sales of firm i

Table: Horizontal FDI–Top and Bottom Three
Industry name Horizontal FDI
Glass products 45.02Petroleum and coal products 36.16Basic chemical product 28.91
Leather products 1.11Telecommunication, video, and audio equipment 0.59Ship building 0.40

FDI measures
I Backward FDI (FDIBjt ): measures the extent of foreign presence in downstreamindustries, where the multinationals are supplied by the domestic firms.
FDIBjt =∑k,k 6=j
γjktFDIHjt
I γjkt : fraction of sector j ’s output supplied to sector k during year t; obtainedfrom the input-output matrix

Table: Backward FDI–Top and Bottom Three
Industry name Backward FDI
Basic chemical products 13.87Plastic products 8.32Synthetic resin and rubber 8.19
Other transportation equipment 0.03Beverage 0.03Tobacco product manufacturing 0.00Ship building 0.00

FDI measures
I Forward FDI (FDIFjt ): measures the foreign presence in the upstream industries,where foreign multinationals provide inputs to the domestic firms.
FDIFjt =∑
m,m 6=j
σjmt
∑for all i∈m
ForeignShareit ∗ (Sit − Xit)∑for all i∈m
(Sit − Xit)
I σjmt : share of inputs purchased by industry j from industry m during year t intotal inputs used by sector j
I Xit : exports of firm i

Table: Forward FDI–Top and Bottom Three
Industry name Forward FDI
Synthetic resin and rubber 16.95Chemical fiber 9.81Other chemical products 7.36
Tobacco product manufacturing 1.11Food 1.05Petroleum and coal products 0.84
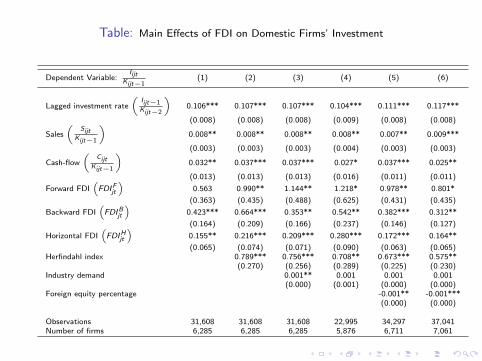
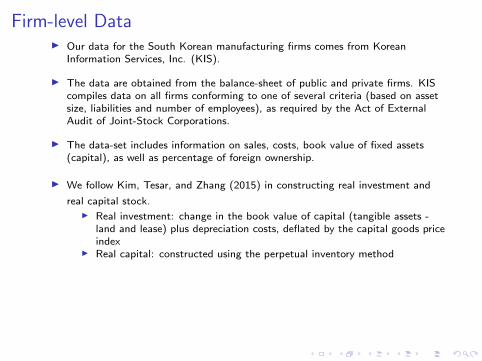
Table: Main Effects of FDI on Domestic Firms’ Investment
Dependent Variable:Iijt
Kijt−1(1) (2) (3) (4) (5) (6)
Lagged investment rate
(Iijt−1Kijt−2
)0.106*** 0.107*** 0.107*** 0.104*** 0.111*** 0.117***
(0.008) (0.008) (0.008) (0.009) (0.008) (0.008)
Sales
(Sijt
Kijt−1
)0.008** 0.008** 0.008** 0.008** 0.007** 0.009***
(0.003) (0.003) (0.003) (0.004) (0.003) (0.003)
Cash-flow
(Cijt
Kijt−1
)0.032** 0.037*** 0.037*** 0.027* 0.037*** 0.025**
(0.013) (0.013) (0.013) (0.016) (0.011) (0.011)
Forward FDI(FDIFjt
)0.563 0.990** 1.144** 1.218* 0.978** 0.801*
(0.363) (0.435) (0.488) (0.625) (0.431) (0.435)
Backward FDI(FDIBjt
)0.423*** 0.664*** 0.353** 0.542** 0.382*** 0.312**
(0.164) (0.209) (0.166) (0.237) (0.146) (0.127)
Horizontal FDI(FDIHjt
)0.155** 0.216*** 0.209*** 0.280*** 0.172*** 0.164**
(0.065) (0.074) (0.071) (0.090) (0.063) (0.065)Herfindahl index 0.789*** 0.756*** 0.708** 0.673*** 0.575**
(0.270) (0.256) (0.289) (0.225) (0.230)Industry demand 0.001** 0.001 0.001 0.001
(0.000) (0.001) (0.000) (0.000)Foreign equity percentage -0.001** -0.001***
(0.000) (0.000)
Observations 31,608 31,608 31,608 22,995 34,297 37,041Number of firms 6,285 6,285 6,285 5,876 6,711 7,061

Main Effects of FDI
I The estimated coefficient of 1.144 on FDIFjt implies that a 2 p.p. (1 st.dev.)increase in the foreign presence of multinational suppliers, domestic firmsincrease investment rate by 2.29 p.p. Given that the average investment rate inthe sample is 22.38 percent, this increase corresponds to a 10.27 percentincrease in the investment rate.
I A similar 2 p.p. increase in the foreign presence in the downstream sectors raisesinvestment by 0.71 percentage points, corresponding to a 3.15 percent increasein the investment rate.
I At 0.209, the coefficient on FDIHt implies an addition of 0.42 percentage pointsto the investment rate following a similar 2 percentage point increase in theforeign presence in the domestic firm’s own industry.

Firm Characteristics
1. Firm size: We define a large firm dummy variable that takes on a value one ifthe firm is categorized as a large enterprize by the Korean Small and MediumBusiness Administration. The classification is based on industry-specific salescut-offs or total asset values.
2. Chaebol: We define a chaebol dummy that takes on a value one if the firm ispart of a conglomerate.
3. Exporting status: We define exporting status as the average exports to totalsale ratio for each firm.
4. We interact these indicators with the three FDI measures.

Table: Firm Characteristics
Dependent Variable:Iijt
Kijt−1(1) (2) (3)
Forward FDI(FDIFjt
)1.268** 1.172** 1.279**
(0.492) (0.500) (0.504)
Forward FDI*Large firm dummy(FDIFjt ∗ LFi
)-0.575***
(0.194)
Forward FDI*Chaebol dummy(FDIFjt ∗ CHi
)-0.448
(0.277)
Forward FDI*Average Exports(FDIFjt ∗ EXi
)-0.753**
(0.300)
Backward FDI(FDIBjt
)0.316* 0.309* 0.317*
(0.183) (0.169) (0.177)
Backward FDI*Large firm dummy(FDIBjt ∗ LFi
)0.171
(0.182)
Backward FDI*Chaebol dummy(FDIBjt ∗ CHi
)0.844*
(0.481)
Backward FDI*Average Exports(FDIBjt ∗ EXi
)0.266
(0.318)
Horizontal FDI(FDIHjt
)0.213** 0.208*** 0.186**
(0.083) (0.072) (0.078)
Horizontal FDI*Large firm dummy(FDIHjt ∗ LFi
)-0.038
(0.077)
Horizontal FDI*Chaebol dummy(FDIHjt ∗ CHi
)-0.065
(0.109)
Horizontal FDI*Average Exports(FDIHjt ∗ EXi
)0.108
(0.094)

Financial Constraints
I Heterogeneity in the impact of FDI on investment can also depend on thefinancial constraints that the domestic firm faces.
I Domestic firms that are credit constrained may or may not be able to increaseinvestment given a surge in the number of multinational customers, dependingtheir ability to become suppliers.
I FDI into the upstream industries can have a larger impact on the financiallyconstrained firms, since the marginal profitability of their capital would improveby more given the lower cost of inputs generated by the increase in the presenceof multinational suppliers.
I We consider three measures of financial constraints and interact them with the
FDI measures:I External finance dependence measure (Braun, 2003)I Publicly traded status of the firmI Cash-flow of the firm

Table: Financial Constraints
Dependent Variable:Iijt
Kijt−1(1) (2) (3)
Forward FDI(FDIFjt
)0.804* 1.240** 1.658**
(0.416) (0.490) (0.675)
Forward FDI*External Finance Dependence(FDIFjt ∗ EFDj
)1.397**
(0.550)
Forward FDI*Public dummy(FDIFjt ∗ Pi
)-0.421**
(0.200)
Backward FDI(FDIBjt
)0.643*** 0.364** 0.525**
(0.217) (0.174) (0.254)
Backward FDI*External Finance Dependence(FDIBjt ∗ EFDj
)-1.305***
(0.469)
Backward FDI*Public dummy(FDIBjt ∗ Pi
)-0.142
(0.213)
Horizontal FDI(FDIHjt
)0.091 0.200*** 0.305***
(0.067) (0.076) (0.097)
Horizontal FDI*External Finance Dependence(FDIHjt ∗ EFDj
)0.231**
(0.110)
Horizontal FDI*Public dummy(FDIHjt ∗ Pi
)0.031
(0.077)
Table: Financial Constraints
Dependent Variable:Iijt
Kijt−1(1) (2) (3)
Forward FDI(FDIFjt
)0.804* 1.240** 1.658**
(0.416) (0.490) (0.675)
Forward FDI*External Finance Dependence(FDIFjt ∗ EFDj
)1.397**
(0.550)
Forward FDI*Public dummy(FDIFjt ∗ Pi
)-0.421**
(0.200)
Backward FDI(FDIBjt
)0.643*** 0.364** 0.525**
(0.217) (0.174) (0.254)
Backward FDI*External Finance Dependence(FDIBjt ∗ EFDj
)-1.305***
(0.469)
Backward FDI*Public dummy(FDIBjt ∗ Pi
)-0.142
(0.213)
Backward FDI*Cash flow
(FDIBjt ∗
CijtKijt−1
)-0.372
(0.258)
Horizontal FDI(FDIHjt
)0.091 0.200*** 0.305***
(0.067) (0.076) (0.097)
Horizontal FDI*External Finance Dependence(FDIHjt ∗ EFDj
)0.231**
(0.110)
Horizontal FDI*Public dummy(FDIHjt ∗ Pi
)0.031
(0.077)

Table: Financial Constraints
Dependent Variable:Iijt
Kijt−1(1) (2) (3)
Cash-flow
(Cijt
Kijt−1
)0.037*** 0.037*** 0.083***
(0.013) (0.013) (0.027)
Forward FDI(FDIFjt
)0.804* 1.240** 1.658**
(0.416) (0.490) (0.675)
Forward FDI*Cash flow
(FDIFjt ∗
CijtKijt−1
)-0.860*
(0.481)
Backward FDI(FDIBjt
)0.643*** 0.364** 0.525**
(0.217) (0.174) (0.254)
Backward FDI*Cash flow
(FDIBjt ∗
CijtKijt−1
)-0.372
(0.258)
Horizontal FDI*Cash flow
(FDIHjt ∗
CijtKijt−1
)-0.094*
(0.055)

Conclusion
I We find a positive and significant effect of foreign presence in both horizontallyand vertically linked industries on domestic firm’s investment rate, with largereffects arising from forward FDI, i.e., multinational presence in the upstreamsectors.
I A 2 pp increase in the presence of multinational suppliers increases the domesticfirms investment rate by 2.29 pp. This effect is larger for small and mediumsized firms, private firms, non-exporters and for firms in external financedependent industries.
I A similar 2 pp increase in the foreign presence in downstream sectors increasesthe investment rate of domestic suppliers by 0.71 pp. This effect is larger if thedomestic firm is part of a chaebol, or is in a less external finance dependentindustry.
I The effect of a 2 pp increase in horizontal FDI is also positive but small at 0.42pp.