Embed Size (px)
Citation preview
Is it vertical or is it horizontal? The type of FDI across Sectors∗
Banu Demir
Oxford University
Selin Sayek
Bilkent University
November 2008
Abstract
Using firm-level data of more than 17,000 firms investing in 38 developing economies we analyze thelocation choice of multinational enterprises (MNE). The analysis allows identification of the factorsthat influence the location choice of MNEs, with a focus on how the results vary across differentsectors. The nested logit and conditional logit framework of [McFadden1974] are used to study thelocation choice of firms in aggregated sectors such as tradables versus nontradables, sectors definedaccording to their technology-intensities, as well as 2-digit ISI-classified sectors. Such detailed sectoralclassifications adds to the literature that mostly focuses on very aggregated sectoral classificationsor only the manufacturing sector in analyzing the location choice of MNEs. Results suggest thatthe factors that drive the location choice of foreign firms differ across the sectors, hence a rigoroustheoretical or empirical analysis of the economic geography of foreign direct investment (FDI) shouldtake into account the sectoral composition of FDI rather than lumping the sectors in one framework.
JEL Classification: F23, R38Foreign direct investment, location choice, multinational enterprises, sectors.
∗Corresponding author: Selin Sayek, Department of Economics, Bilkent University, Bilkent Ankara 06800 Turkey,
[email protected]. Banu Demir, Oxford University, Okford, UK, [email protected]. We thank the Sci-
entific and Technical Research Council of Turkey for the research support under the grant SOBAG-107K142. We would
also like to thank Ali Bayar, Emre Deliveli, Hasan Ersel, Yusuf Isik, Guven Sak and seminar participants at Economic
Policy Research Institute (TEPAV — EPRI), and International Conference in Economics of the TEA for helpful comments.
The project was funded by TUBITAK. The efforts of Ercument Akar, Burak Aycan, Gulnur Baybas, Yurdanur Baybas,
Giray Bulut, Sinem Erkilic, Ozan Erol, Utku Kabil, Alp Kacar, Ajdan Kucukciftci, Ipek Mumcu, Baris Ozdemir, Damla
Ozdemir, Burak Ozkum, Onur Can Sert, Ali Sumer, Koray Tastankaya, Alper Turkmendag, Can Unlu in collecting and
organizing the data at the early stages of the work as well as Ipek Aktas and Can Cetins supervision and coordination of
this effort also remains to be thanked. The usual disclaimer applies: The authors are responsible for any remaining errors.
1 Introduction
Over the past decade the world has witnessed a significant increase in foreign direct investment (FDI).
The worldwide FDI has risen from an annual average of US$181 billion between 1985 and 1995 to an
annual average of US$310 billion between 1992 and1997, and to approximately US$600 billion in 2004.
The same increasing trend is evident when one considers the share of FDI in gross fixed capital formation
in the world. While this share was on average 3.9 percent annually between 1985 and 1995 it has risen
to on average 5.5 percent annually between 1992 and 1997, and to above 9 percent in 2004.1 This
trend has been parallel with increased interest among both academics and policy-makers to discuss the
determinants and effects of the increased FDI flows, both at a theoretical and empirical level. However,
because of data deficiencies both the determinants and effects of FDI have been mostly analyzed using
aggregate FDI levels, with little or close to no mention of the sectoral composition or characteristics of
the investments.
Yet, the evolution of the sectoral composition of FDI renders the aggregation of FDI flows data across
sectors problematic. As is evident in Figure 1 there has been a worldwide shift in the composition of
FDI from manufacturing to services related foreign investments over the past decade. The share of
services in total FDI inflows has considerably increased worldwide, a phenomena experienced in both
the developed and the developing countries. The increase seems much more prominent in the developing
countries, for which the share of services FDI in total FDI flows increased from 37 percent to 55 percent,
from the early 1990s to the early 2000s. The same ratio has increased from 58 percent to 73 percent
over the same period for the developed countries. The increase in the share of services FDI has been
mirrored by a declining share of manufacturing FDI, while the share of primary sector FDI has remained
relatively stable.
INSERT FIGURE 1 ABOUT HERE
Looking into the sectoral composition of FDI at a much more disaggregated country level one
observes that while there seems to be similar trends in the evolution of the sectoral composition of FDI1UNCTAD, Foreign Direct Investment Database.
1
across aggregated classifications of countries, the experience of each country within the classification
can be very different than the others. Table 1 provides information on the sectoral distribution of
cross border mergers and acquisitions (M&A) sales in developing countries in 2004, suggesting that the
sectoral composition of FDI in the form of M&As shows significant variation across developing countries
as well. For example, while 63 percent of the M&As by foreign firms in Africa occurred in the primary
sector the same ratio was a mere 4 percent in Latin America and the Caribbean. The same divergence
is evident in the share of M&As in the services sectors; while 12 percent of the M&As by foreign firms
in Africa occurred in the services sector the same ratio was around six fold that in the Latin American
and Caribbean economies, at 65 percent.
INSERT TABLE 1 ABOUT HERE
Figure 2 further provides insight into the divergence across geographic regions in the sectoral com-
position of FDI flows. The figure provides information on the stock of FDI inflows in 2004, showing the
differences across developed as well as developing countries. While the share of services was significantly
larger than the share of manufacturing sector FDI stocks in the European Union (EU) and the US the
figures are reversed in Canada, where the share of the FDI stock in manufacturing far exceeds that in
services sectors. The diversity is even more relevant when one considers within developing countries
variations. While the share of manufacturing sector FDI stocks is much larger than other sectors in
the East Asia and Pacific region, the services sector dominates the FDI stocks in Europe and Central
Asia, and Latin American and Caribbean countries. For Africa the primary sector remains to be the
main sector attracting FDI flows. The same story is echoed when one compares the FDI flows sectoral
composition across countries. For example, as is shown in table 2, the sectoral composition of FDI
inflows in 2002 differs significantly between Chile and Brazil. In Chile the primary sector FDI inflows
dominates the flows in 2002, whereas in Brazil manufacturing sector FDI inflows dominate.
INSERT FIGURE 2 AND TABLE 2 ABOUT HERE
The evidence strongly suggests that the sectoral composition of FDI differs across countries, more
2
aggregated geographic regions, as well as country groups classified according to their economic devel-
opment levels. This paper attempts to provide an explanation to the underlying reasons for these
differences in the sectoral composition of FDI flows across countries by asking the following questions:
What are the factors that determine the economic geography of multinational enterprises (MNEs) in
different sectors? Are there sectoral differences in the determination of the locational choice of MNEs?
These questions are of interest for both academic considerations and policy-making regarding FDI. Iden-
tification of the differential determinants of MNE activity across sectors will point to the importance of
modeling the detailed characteristics of foreign firms, especially those related to the sector of operation
of the MNE, in theoretical frameworks. Such findings will also have important implications regarding
the empirical investigation of the effects of FDI. If the below analysis provides evidence that the sector
of operation matters in the economic geography and decision-making of MNEs this could point to the
underlying reason for the differential impact of FDI to the recipient countries. Alongside its important
contributions to the academic discussion of FDI, the analysis will also provide a strong basis for policy
formulation.
While this issue is of interest from a geographical perspective it can also be linked to the literature
discussing whether FDI is horizontal or vertical in nature. In the broadest sense firms choose to invest in
foreign economies either to produce a similar good in different locations or to produce different stages of
the final good at different locations, making the former horizontal and the latter vertical FDI in nature.2
While through horizontal FDI the MNE is able to avoid transportation and trade costs when serving a
foreign market the fragmented production process leads to reduced economies of scale most of the time.
Similarly, while vertical FDI through geographic dispersion of the production process allows the MNE
to minimize production costs and achieve strategic advantages, it can be associated with increased trade
and transportation costs. The eventual decision of foreign investment, both in the case of vertical and
horizontal FDI, requires that the MNE consider these costs and benefits.
Horizontal and vertical FDI differ in their effects on the host economy, both their spillover effects2We will also refer to the terminology by [Dunning1993] regarding the incentives to carry out foreign investment,
including (i) market-seeking, (ii) efficiency- seeking, and (iii) resource-seeking foreign investments.
3
on productivity and labor market implications will differ. As such an interesting question remains as
to what type of FDI dominates the worldwide flows. Early evidence suggested that at the aggregate
FDI level such international economic activity is dominated by horizontal FDI (see [Brainard1997];
[Markusen and Venables1996]; [Markusen and Venables1998], and [Markusen and Maskus2002]). Re-
cent evidence suggests vertical FDI also seems to be evident (see [Carr et al.2001], [Carr et al.2003];
[Hanson et al.2005]; [Alfaro and Charlton2007]). Whereas several papers suggest a mix of horizontal
and vertical FDI is best depicting the aggregate FDI trends, known as the knowledge-capital model
([Blonigen et al.2003]). Recently [Davies2008] suggests that the empirical testing of the three mod-
els has so far predicted different patterns of FDI due to mostly improper specifications. More rel-
evant for our perspective the studies in the literature provide some preliminary evidence that the
type of investments might differ across countries as well as across sectors (further see [Waldkirch2004];
[Feinberg and Keane2001]; and [Yeaple2003]). The following empirical analysis takes its cue from this
last point, with the goal of providing further evidence that in fact the motives for foreign investment
of MNEs differ significantly across sectors and this fits in line with the evidence regarding vertical and
horizontal FDI. In fact, classifying the factors that drive FDI under two broad categories of those re-
lated to vertical and those related to horizontal investments the below results can provide further direct
evidence regarding the nature (i.e. horizontal versus vertical) of investments across a range of sectors
in developing countries. This evidence is of value added to the literature as the above papers neither
focus on a sample of developing countries nor on a wide range of sectors. Taking a different perspective
on the question of identifying the type of investment, expanding the host country list of FDI to include
38 developing countries, and studying the question for several sectoral classifications the below analysis
reiterates the conclusion that some sectors are dominated by vertical while others are dominated by
horizontal FDI.
The literature has posed questions regarding the geographic distribution of FDI flows using two
alternative measures of the presence of MNEs in a region. The former measure focuses on the entry
decision of a firm in investing in a foreign country, whereas the latter measure focuses on the quantity
of investment the MNE undertakes. The choice between studying the entry decision and the quantity
4
decision of the MNEs determines the econometric framework of the analysis. The quantity approach has
its data limitations given the MNEs diverse and creative ways to hide away their investment from being
taxed or being subject to various government regulations.3 As such the FDI flow or stock measures
originating from the balance-of-payments data could heavily underestimate the true extent of MNE
activities. Given the possible measurement problems with the quantity of FDI flows the below analysis
will use the former approach, studying the entry decision of MNEs across regions. There is a sprawling
literature on the reason of existence of MNEs, whereas studies on the locational choices of MNEs and
the economic geography of FDI has only recently been re-emphasized. 4 Of the studies that analyze
the economic geography of FDI most are limited to within-nation locational choice of MNEs or within a
certain geographic region such as the transition economies or the EU. Furthermore, these studies mostly
ignore the possible differences in the factors that govern the location choice of MNEs across different
sectors. The existing studies in the literature tend to focus mostly on the economic geography of MNEs
in the manufacturing sector.
The goal of the below analysis is to fill this gap in the literature by studying the location choice of
around 17,000 MNEs investing in 38 countries. Unlike previous cross-country analysis, we conduct a
detailed sectoral analysis, one that is not just limited to the manufacturing sector and discussing the
spatial economic geography of these MNEs across different sectors. The analysis allows for a discussion of
the expected sectoral profile of FDI that will flow into a country based on that country’s characteristics.
In this respect, this paper fits into the former group of studies mentioned above, in which the
issue has been studied using firm-level data and identifying the factors that affect the probability of
a firm investing in a specific country/region. There are several studies that look into the economic
geography of MNEs within a country. For example [Coughlin et al.1991] and [Woodward1992] have
studied foreign firms behavior when investing in the USA, while [Deichmann et al.2003] have carried
out the same analysis for foreign firms in Turkey, and [Guimaraes and Woodward2000] for foreign firms
in Portugal. Some of these studies have analyzed the decision-making process of the multinational firms3For example, it is widely known that in many countries, MNEs prefer lending to their foreign subsidiaries to finance
their investment. This alone would heavily underestimate FDI.4See, for example, [Navaretti and Venables2004].
5
across different sectors. However, since they each focus on foreign firms in a single country it is difficult
to generalize their findings across countries. The analysis below allows for such a generalization by
including several countries in the same analysis, and as such will add value to the existing literature.
Furthermore, the sectoral focus of the studies so far has been relatively limited. Many studies, includ-
ing but not limited to those by [Coughlin et al.1991], [Woodward1992], [Mariotti and Piscitello1995],
[Resmini2000], [Guimaraes and Woodward2000] and [Kim et al.2003], have focused on explaining the
economic geography of firms in the manufacturing sector. Other studies have classified sectors in very
broad categorizations. When studying the location choice of MNEs within Turkey [Deichmann et al.2003]
have looked at the decision across firms in the primary, tertiary and services sectors. Similarly,
[Pusterla and Resmini2005] and [Basile et al.] both classify the sectors according to their technology in-
tensities while studying the MNEs location choice in transition economies and in EU, respectively. Aside
from these studies that assume broad categorizations of sectors there is a limited number of studies that
undertake a more detailed sub-sectoral analysis. For example, [Kolstad and Villanger2004] study the
subsectors of the services sector, while [Resmini2000], [Choe2000], [Carlton1983] and [Luger and Shetty1985]
study the subsectors of the manufacturing sector, and [Gross et al.2005] study the locational choice of
MNEs in both the manufacturing and service sectors in Japan.
As the above discussion points out, while there is an extensive literature on the location choice of
MNEs the studies are either limited in their country or region coverages, or in their sectoral analysis.
This study fills this void in the literature by addressing both issues; studying the location choice of
MNEs across 38 countries, not limited by geography or economic systems, and across several sectors
that are defined either in very rough categorizations or in detail. To the best of our knowledge, this is
so far the most comprehensive sectoral analysis of the economic geography of MNEs across a wide-range
of developing countries.
The remainder of the paper is organized as follows: The relevant literature is surveyed in detail
in section 2, allowing for identification of the necessary variables to be included in the econometric
analysis. Section 3 discusses the data used in the analysis, while section 4 presents the methodology
used. In section 5 the results are discussed and analyzed in detail, across a variety of sectors. Section
6
6 concludes.
2 Decision-making by MNEs
[Markusen and Venables1998] and [Markusen and Venables2000] construct models that incorporate the
features of the new trade theory, allowing for imperfect market structures in the models, and show the
ranges of parameters where multinational firms that are horizontal investors in nature operate. The
model suggests that measures of market size, in this case defined as the differences in country size and
in relative endowments by the authors, and the level of trade- transportation- and investment-related
costs are the major determinants of the extent of MNE activities.5 On the other hand, [Helpman1984]
introduces vertical FDI into a Heckscher-Ohlin trade model where the overseas operations of the MNE
are modeled as a separate stage of production, and allow creation of a third tradable good and an
additional trading opportunity. This theoretical framework points to the complementarity of trade and
FDI, suggesting that MNEs that carry out vertical FDI are driven by cost differences, where the costs
include both factor costs, and trade and transportation costs.6 These theoretical findings provide a
basis for the empirical discussion of the determinants of FDI flows, which we detail below.
In a very concise table [Markusen and Maskus2002] summarize the expected signs of each variable.
In short they argue that the knowledge capital and horizontal models would suggest a positive relation-
ship between the sum of GDP of host and home countries and FDI flows, whereas vertical FDI would
suggest no relationship. In other words, factor endowments do not affect vertical FDI but do affect
FDI that can be modeled as knowledge capital and horizontal FDI. On the other hand cost indicators,
which they classify as trade related and investment-climate related affect all types of FDI similarly.
While a full testing of the vertical, horizontal and knowledge-capital models requires information on
both the home and host country of investment one can argue that the factors relevant to the investment5Chapter 3 of [Navaretti and Venables2004] provides an overview of the horizontal FDI models and their predictions,
where the discussion is mainly drawn from [Markusen and Venables1998] and [Markusen and Venables2000].6Chapter 4 of [Navaretti and Venables2004] provides an overview of the vertical FDI models and their predications,
where the discussion is mainly drawn from [Helpman1984] and is built on a perfect competition and constant returns to
scale model rather than the imperfect market structure models used in modeling horizontal FDI.
7
decision of the multinational firms can be classified under those related to the factor endowments and
those related to the costs related to these investments. We follow a similar grouping of factors, taking
a more liberal perspective on which specific variables to include under both sets of factors. The specific
variables are chosen following a very rich empirical literature on the determinants of FDI. Given the
extent of this literature below we focus our attention to studies that mostly have a sectoral focus.
Factor Endowments
The empirical studies that do test for which model best fits the data in explaining FDI use real GDP
and skill endowments as factors that capture the factor endowments of the economies’. In fact, previous
studies of FDI-determinants find consistently that larger markets and markets with higher purchasing
power tend to attract significantly more FDI and there is higher probability that a MNE would invest
in that region. While studies that use aggregate FDI flows as a dependent variable tend to find market
related variables are important in attracting FDI, the limited sectoral studies suggest differential effects
of the market-related variables on the location choice of MNEs (see [Kolstad and Villanger2004] and
Resmini2000 who find contradictory results). 7 These findings regarding the differential impact of
market related factors across different sectors instigates the need to include these measures in the below
analysis, which will allow testing the effect of a larger market size in attracting MNEs within a wide
range of sectors.
One can also explain the differential response of investments to market size considering the differen-
tial motives of foreign investment. Although a priori one would expect that firms would choose larger
and richer markets to invest in, both the sign and the magnitude of the relationship between these
variables and the probability of a MNE investing in a region depends on the motivation of investment.
For example, if the firm is resource-seeking or is in search for a low-cost export base environment for7Although many of the studies have found a positive effect of market-related variables on FDI, several studies also suggest
the impact of the market size in increasing the attractiveness of a region to MNEs could be insignificant. For example,
while [Mollick et al.2006] and [Coughlin et al.1991] find that GDP per capita positively and significantly contributes to a
region attracting more MNE presence, [Hogenbirk and Narula2004] and [Mariotti and Piscitello1995] find evidence to the
contrary.
8
production then the local market size and richness need not significantly affect the location choice of
the foreign firm. However, if the purpose were to market-seek then a priori one would expect that
the foreign firms location choice would significantly and positively be affected by the market poten-
tial of the foreign country. This is also parallel to the findings of [Markusen and Venables1998] and
[Markusen and Venables2000] who argue that measures of market size, which they label as differences
in country size are of importance in FDI that is horizontal in nature. One could envisage that the
motivation of investment by foreign firms would differ across the sectors the firms operate in, which
could well be reflected in whether the investment is horizontal or vertical, further justifying the need
to formally test the relationship between the location choice of MNEs and the market related measures
across different sectors. In summary, [Markusen and Maskus2002] suggest that the market size matters
for horizontal and knowledge capital FDI but not for vertical FDI. Below we test for which sectors such
relationships are evident in.8
Other factor endowments frequently included in the analysis of FDI determinants include human
capital, physical capital, and institutional endowments. Below we detail each of these variables. A priori,
availability of skilled and educated labor force would be expected to have a positive influence on FDI,
and also affect the type of investment as suggested by the empirical testing of the horizontal, vertical
and knowledge-capital models in [Markusen and Maskus2002]9 [Woodward1992], using the median year
of schooling completed, finds that the presence of educated labor force is a significant factor to explain
FDI at county level. On the other hand, [Mariotti and Piscitello1995] use share of managers and office
staff in total employees in manufacturing and level of schooling (ratio of students enrolled in secondary
schools to the total resident population) as proxies for labor quality to find both variables to have8Given the sectoral focus of the below study we extend the interpretation of market-related indicators to go beyond
the usual market size and purchasing power. We hypothesize that the foreign firms not only look at the size of the overall
market when choosing their investment site, but they also consider the economic structure. For example, if the sector the
MNE is planning on investing in has been growing in the foreign country the firm could interpret this as market potential
in that specific sector. As such, in the below analysis, we include the growth rate of the value added by the specific sector
as long as data permits.9See page 700, table 1 where the signs of the interaction terms depend on the skill endowments and also differ across
the three models.
9
minor effects on attracting FDI into Italian provinces. Finally, [Deichmann et al.2003] use the student
per teacher ratio as such a proxy and find that regions in Turkey with higher labor quality attract
MNEs with a higher probability, with differences in results across broad categories of sectors.
Several studies suggest that the physical infrastructure could also affect the profitability of a foreign
firm and could influence the location choice. For example, studies including those by [Gholami et al.2006],
[Mollick et al.2006], [Deichmann et al.2003] and [Coughlin et al.1991] find positive causal relation be-
tween different types of physical capital and FDI inflows.10 On the other hand, both [Mariotti and Piscitello1995]
and [Hogenbirk and Narula2004] do not find transportation facilities as a significant determinant of FDI
for manufacturing in Italy and general FDI for the Netherlands, respectively. This discrepancy in find-
ings can indeed be on account of an aggregate analysis, justifying further need for a more sectorally
disaggregated analysis. The below empirical analysis will include several of these infrastructure indica-
tors alongside domestic investment, as a proxy for agglomeration effects as well.
Existence of well-operating institutions, which can be included among the factor endowments of
the host country, creates better business climate for foreign as well as local firms, although it is often
argued that foreign firms are usually disadvantaged in dealing with negative institutional factors. As
support for this idea, [Aykut and Ratha2004] have shown that MNEs from emerging markets are more
likely to invest in developing countries than MNEs from developed countries, possibly suggesting that
they are more familiar with the institutional structures in the host countries of similar income level
as their originating source countries. In order to take the effect of well-functioning institutions into
account, a variety of proxies are used in the literature. For instance, [Campos and Kinoshita2003]
use indices of rule of law and quality of bureaucracy to find that countries with better institutions
attract more FDI inflows. [Kolstad and Villanger2004] use a wider range of institutional variables
(composite indices for macroeconomic stability, political risk rating, institutional quality and democratic
accountability) and find varying results for the effects of these variables on FDI, though not robust to10These physical capital measures include information and communication technologies (ICT) investment, number of res-
idential and non-residential telephone connections per person and traditional measures of infrastructure like transportation
facilities.
10
different specifications, sample or methodology. Finally, [Brada et al.2006] show the importance of
political stability in driving FDI patterns. In the below analysis, in line with the literature, we include
measures of institutional quality and risk indicators compiled by the Political Risk Services (PRS) under
the International Country Risk Guides (ICRG).
Cost related factors
Both empirical testings of horizontal, vertical and knowledge-capital models of FDI and determinants of
FDI flows and their geographic location have included several cost indicators among their independent
variables in the analysis. In the broadest sense these costs cover the investment related cost factors
such as labor costs, and taxes, as well as trade and transportation related costs.
While [Carlton1983], [Campos and Kinoshita2003], [Kim2003], [Coughlin et al.1991] and [Luger and Shetty1985]
find that low wage rate is an important factor to attract FDI in a region, [Choe2000] finds a positive
and significant effect of wages on FDI. However, Choes analysis is limited to one manufacturing sub-
sector, whereas other studies, i.e.[Resmini2000], have found that that the reaction of firms in different
sectors to wages shows a very diverse pattern. Her results show that wage differential is a key factor
in traditional sectors, while it has a minor effect in technology and capital intensive sectors. Finally,
[Mollick et al.2006] [Mariotti and Piscitello1995] find that wage differential is not a significant factor
to explain the differences in the amount of FDI that flows into Mexican states and Italian regions, re-
spectively. These results are suggestive that the relationship between labor cost and FDI is not robust
across different specifications and estimations, and the results could in fact depend on the sector of
investment.11
Given the multinational nature of the foreign firms in question including the exchange rate among
the cost-related factors that would affect the location choice of the MNEs is only natural. The foreign11 It is important to note the relation between labor-related variables and FDI is far from covered when one only focuses
on the cost of labor. While several studies examine the relationship between the unemployment rate and FDI, many
institutional and government policy-related variables such as flexibility of hiring and firing or union presence have been
emphasized by academics and policymakers alike in recent years as key investment climate variables and important factors
in effecting firms ease of doing business. The role of such factors is yet to be explored and due to limited consistent data
across countries will not be explored in the below analysis.
11
currency composition of the firms income statement depends on the final product market the firms
are serving, i.e. local or international. In other words, the currency the firms revenue and costs are
denominated in is determined by the trade-orientation of the firms production, which could differ across
the sectors (i.e. tradables versus nontradables, manufacturing versus services, etc.). For example, if the
firms revenues and costs are denominated in different currencies then, ex ante, we expect that indicators
of the exchange rate would affect the firms location choice significantly. Two such indicators are the
stability of the exchange rate and the level of the exchange rate. Using foreign acquisitions information
at detailed sectoral level, [Blonigen1997] finds that real dollar depreciations increase the probability
that Japanese firms will acquire US firms, especially the firms that have more firm-specific assets. This
result forms the basis of the below analysis, where our hypothesis is that the extent of firm- specific
assets differs across sectors, and therefore a priori one would expect that the reaction of the location
choice of firms to the exchange rate level will differ across sectors.12
Another controversy in the literature is with respect to the effect of tax rates on FDI, a variable
capturing an important dimension of the cost-related aspect of the location choice of foreign firms. Some
studies, such as [Kim2003] maintain that tax rates have a positive and significant effect on FDI. This
seemingly counterintuitive result is explained by the fact that some foreign firms receive tax credits
at home against tax payments in host country and that this policy reduces tax aversion. On the
other hand, [Luger and Shetty1985] find that the effect of taxes on FDI varies across industries, with
a negative impact on FDI in drug manufacturing, a positive impact for motor vehicle production and
an insignificant impact in the industrial machinery sector. In another study, [Carlton1983] notes that
taxes do not exert any considerable influence on FDI; interpreting this finding as being a result of the
fact that the effect of tax differentials is offset by the differences in remuneration of immobile factors
of production. Alternatively, the variable used in the study may not reflect the actual tax paid by
the foreign firms, as tax rates are usually different from actual taxes paid by big companies, especially12While [Blonigen1997] assumes imperfect goods markets to capture the differential wealth effects of exchange rate
changes on the domestic and foreign firms [Froot and Stein1991] assume imperfect capital markets to capture the wealth
effects of exchange rates.
12
MNEs. Despite the difficulty of finding the effective tax rates on investment by the MNEs across
countries, the above discussion is suggestive of the differential impact of taxes on foreign firms across
sectors, which leads us to include a measure of statutory corporate tax rates as an independent variable
in the analysis.
Agglomeration
The persistence in the location choice of firms bring to mind the question of whether or not agglomeration
plays any role in the decisions of the MNEs. While the theory underlying the question arises from the
new trade theory literature, the empirical studies are more pertinent to the below discussion. The broad
categories of proxies for agglomeration are measures related to the labor-market or employment and mea-
sures related to past foreign and domestic firm activities. [Carlton1983], [Luger and Shetty1985], and
[Guimaraes and Woodward2000], among others, can be included among the former group of studies mea-
suring agglomeration by labor-related measures. Whereas, [Campos and Kinoshita2003], [Choe2000],
[Kim et al.2003], [Deichmann et al.2003], and [Hogenbirk and Narula2004] are included among the lat-
ter group of studies measuring agglomeration with the extent of previous foreign and domestic firm
activities in the region.
Studies using labor related measures all find a positive and significant agglomeration effect in the
FDI flows (see [Carlton1983], [Luger and Shetty1985] and [Guimaraes and Woodward2000] among other
studying the issue across several sectors). Using past FDI activity as an agglomeration indicator,
Furthermore, several studies in the literature have used the population density as a measure of
agglomeration, mostly finding a negative relation between this measure of urbanization and the location
of foreign direct investment (see for example, [Mariotti and Piscitello1995] and [Kim et al.2003], among
others). The hypothesis is that the availability of infrastructure, information and services are much
more extensive in the more densely populated, i.e. more urbanized regions. However, the negative
relationship between FDI and the rate of urbanization suggests that the population density might be
a poor proxy of agglomeration economies, however might capture other economic conditions related to
the market potential and availability of labor force. As such, we include the population density as an
13
additional independent variable in the below analysis, keeping in mind that it might be capturing either
the extent of agglomeration economies, better market potential or a saturated labor market.13
International Trade
As was discussed above, vertical and horizontal FDI have different implications regarding the relation-
ship between international trade and FDI; in other words regarding the complementarity of trade and
FDI. As [Blonigen2001] points out trade and FDI are envisaged as substitutes according to the standard
trade theory, while [Helpman1984] notes that modeling vertical FDI in a standard trade theory would
suggest that trade and FDI are complements. While several empirical testings of the relationship finds
strong evidence of complementarity between international trade and investment, [Blonigen2001] finds
substantial evidence for both substitutability and complementarity between trade and investment, using
Japanese and US data. These divergent patterns observed render testing whether or not the differential
findings are due to differences across sectors important. Furthermore, given our hypothesis that the
nature of investment (whether it is vertical or horizontal) differs across sectors, we include measures of
the openness of regions to international trade to test for the differential relationship between FDI and
trade across sectors.
Not only do we include a measure of overall trade openness of the country but we also test for
the possible relationship between the sectoral composition of the countrys exports and the sectoral
composition of the FDI the country receives. We do so by including the world market share of the
country in the good it exports, i.e. the export of that sector by the country as a share of the total
exports of the good in the world market, as long as data permits. This sectoral dimension of the
openness measure not only allows capturing the extent of trade but could also be envisaged as the13When data permits, to furthermore allow for the agglomeration economies to be sector specific, given our focus of
analyzing the sectoral differences in the geographic location of MNEs, we include the ratio of the value added of the sector
in question to GDP as an alternative measure of agglomeration. As much as the value added share of each sector in GDP
could be capturing agglomeration economies, it could also be suggestive of the extent of competition in the region. For
example, an MNE could view high levels of the value added share measure as indicative of a conducive environment for
investments in that sector they could also interpret it as a highly saturated market, one that would be difficult to penetrate.
The below analysis considers both possible interpretations.
14
market power of the country in the sector of analysis. This latter interpretation is based on the fact
that the export-share measure included in the analysis measures the size of the countrys trade in a
sector relative to the world market.
This detailed discussion motivates the independent variables to be included in the analysis. The
most important implication of this discussion for the below study is that the factors that influence the
geographic pattern of MNEs should heavily depend on the sector of investment, justifying the need for a
general framework that would allow for studying the determinants of FDI across a wide range of sectors
which the following study does. In the next section we discuss the data that is used in the analysis.
3 Data
As detailed above, the below analysis studies the factors that influence the geographic distribution of
MNEs across different sectoral groupings using firm level data. Carrying out the analysis with firm level
data allows us to get around the possible biases caused by the measurement of the quantity of FDI.
Below we detail the data used in the analysis. We start by discussing the firm level information.
Firm level data on FDI is obtained from Business Monitor International (BMI).14 The FDI database
of BMI includes comprehensive information on company characteristics such as number of employees,
sales volume, industry and business activity as well as details of the investment (e.g. year, industry, local
competitors) undertaken in the host country. Data covers major FDI of multinational enterprises on
global scope. Although the data collected by the BMI is very comprehensive, company characteristics
are not completely provided for each firm. Specifically, we had to eliminate firms for which the year
of investment in the host country or the industry of operation are not reported. Given that the below
analysis will be studying the entry decision of the MNE, information on the year of investment is of
utmost importance. After elimination, we are able to include 17,775 companies and 38 host countries
that these companies have invested in during the period 1980-2004 in the below analysis.
The distribution of companies, included in the analysis, across countries is presented in Table 3.
China, Hong Kong and Singapore have the highest number of multinational firms while Bahamas,14http://www.businessmonitor.com
15
Lithuania and Estonia have the lowest in our dataset. Almost 43 percent of the firms in our dataset
have invested in countries from the East Asia and Pacific region. The second most popular region for
multinational firms in this dataset is East Europe and Central Asia. Sub-Saharan Africa has the lowest
share of FDI inflows in our dataset. The detailed distribution across the 38 countries is provided in
Table 4.
INSERT TABLES 3 AND 4 ABOUT HERE
One concern about the BMI dataset is that it only has information on MNEs investing in developing
countries. The analysis will be built on the premise that a MNE considering investing in a developing
country will compare the locational features of these 38 countries.15 While the choice of the countries
included in the analysis is limited by the availability of data from the BMI dataset, FDI flows to these
38 countries encompass more than 85% of all FDI inflows to the developing countries. In fact, as is
evident in Figure 3, this ratio increases to above 90% starting in the early 1990s.16
INSERT FIGURE 3 ABOUT HERE
Another issue is whether the coverage of the MNEs in the BMI database is reflective of the MNEs
existing in the host countries. Although not all foreign firms are registered in the BMI dataset, Figure 5
suggests that the coverage of the firms in the manufacturing and services sectors are very close in their
sectoral distribution patterns to the information reported by [UNCTAD2005] World Investment Report
regarding the foreign establishments. In fact, the correlations of the sectoral composition of the foreign
firms as reported by the BMI and [UNCTAD2005] across different regions are above 90% across the
board. Specifically, the sectoral composition of the foreign firms in the BMI and UNCTAD datasets are
correlated 95% for the Latin American and Caribbean economies, 97% for the West Asian countries,
99% for the South, East, and South-East Asian economies, and 98% for the South-East Europe and CIS15As long as MNEs are deciding to invest in a developing country in a nested fashion, lack of developed country data
does not bias our results.16As a share of worldwide FDI these 38 countries have been receiving more than 30% of the total FDI flows since the
early 1990s.
16
countries. Such high correlations and Figure 4 suggest that the BMI dataset is a good representative
of the MNEs in the countries in the dataset, specifically the BMI dataset allows for selection of an
appropriate sample of MNEs from the population of MNEs worldwide when the sectoral composition
is considered. Furthermore, one has to test whether the distribution of firms across host countries is
reflective of the realized patterns, not creating any such selection bias in the BMI dataset. Due to lack
of information on the number of firms across individual countries we instead calculate the Spearman’s
rank correlation between the FDI inflows data (in millions of USD) from UNCTAD and the number
of firms data we have from the BMI and find that the rank correlation is around 65% and statistically
significant. Again, this also is suggestive that the use of the BMI dataset should not be ridden by any
selection bias.
INSERT FIGURE 4 ABOUT HERE
The sectors available in the dataset are listed in Table 5. While the dataset allows for discussion
of the location choices of firms at the 2-digit ISI-Classification level, the analysis is also carried out
at more aggregated levels. As discussed in detail in section 5, aggregation is conducted according
to the tradability of the final products and the technology-intensity of the industries. In the former
classification, the sectors are simply identified as tradables or nontradables. For the latter classification
the UNIDO classification system is applied, grouping the sectors as resource-based, low technology
intensive and medium and high-technology intensive sectors.17 The shares of these two agglomerated
classifications are provided in Table 5 as well.
INSERT TABLE 5 ABOUT HERE17The technology-intensity of the sectors are consistently defined with those in the UNIDO Global Report, Statistical
Annex, 1997. The sectors included in the tradables are manufacture of food, beverages and tobacco (31), textile, wearing
apparel and leather (32), manufacture of wood and paper products (33 and 34), manufacture of chemicals (35), manufacture
of non-metallic and metallic products (36 and 37), manufacture of machinery and equipment (38); while those included in
the nontradables are mining and quarrying (22), construction (50), retail and wholesale trade (61 and 62), transport and
storage (71), communication (72), financial institutions and insurance (81 and 82), real estate, business (83) and Other
Services.
17
Since in section 2 the discussion of the independent variables was undertaken in great detail the list
and definitions of, as well as the sources of, the independent variables used in the analysis are provided
in Appendix II. A detailed discussion of the link between the expected signs of each variable and the
literature will be provided when we interpret the results in section 5.
4 Methodology
The econometric framework is built on the premise, following [Dunning1993], that MNEs, similar to
the domestic firms, are primarily motivated by net worth maximization. The net worth of the firm
is a reflection of the firms current discounted value of profits. As such, a firm choosing between two
alternative locations for investment, will prefer the investment site where the firms relative present value
of discounted profits is higher. In other words, denoting the profits of the ith firm investing in the jth
region can be defined as follows:
πij = βijz + εj (1)
If alternatively the firm invests in region k, its profit function becomes:
πik = βikz + εk (2)
where z is a vector of characteristics for the particular region (country in this case), including the
variables discussed in section 2 above. The probability that a firm chooses to invest in region j instead
of region k, where Y = 1, therefore depends on the relative profits as defined in equation (3):
Prob[Y = 1|z] = Prob[πij > πik|z] (3)
Using the conditional logit estimation, widely used in the analysis of industrial activity locations
and market research, the analysis below extracts information from the dataset on which of the regional
or sectoral characteristics included in vector z plays an important role in the firms location choice.
Specifically, the model is built on the basis that the dependent variable in the analysis takes the value
18
of 1 for the region/country where the company chooses to invest and the value of 0 for the rest of the
regions/countries. This dichotomous dependent variable coded as 1/0 is used in the conditional logit
model, which performs maximum likelihood estimation. As shown in [McFadden1974], under certain
assumptions, if one assumes that Yi is a random variable that indicates the choice made, then:
Prob(Yi = j) =eβ′zj∑eβ′zj
(4)
The vector z is defined to include both region-specific and sector-specific characteristics. The frame-
work acknowledges that the profitability of the foreign firms investment not only depends on a set of
variables that capture the economy-wide characteristics of the host country, but also the sector-specific
characteristics of the region. For example, if a specific firm decided to invest in Turkey, our dependent
variable Y takes the value of 1 for Turkey, and the value of 0 for the remaining 37 countries. This
locational choice of the firm depends on the vector z, which can be decomposed as zj = [xj , wj ], where
xj includes the economy-wide indicators, while wj contains the sectoral characteristics of the region.
To the best of our knowledge, almost all similar studies in the literature define the unit of analysis
as the firm and the region as sub national, either as a city or as a state within the nation. Further-
more, while there are some studies that carry out a similar analysis across a group of countries, for
example [Pusterla and Resmini2005]; [Basile et al.2003], among others, the below analysis is the most
encompassing one; including a very large sample of developing countries. Our study differs and adds to
the literature in this perspective, as our unit of analysis is still the firm but the region of analysis is at
the national level. Previous studies that have used the nation as the regional unit have carried out the
analysis using the amount of foreign investment as the measure of the extent of foreign firm activity,
whereas the following analysis measures the extent of foreign firm activity by looking at whether the
firm locates to a region (country in this case) and not the amount of investment. Therefore, to reit-
erate, this study is not subject to measurement error problems from using the quantity of FDI as the
dependent variable that other studies that have used the nation as the regional unit have suffered from.
The unique nature of the database allows us to model the location choice of a firm at the sectoral and
19
locational depth not used in studies using a similar methodology.
In the estimation, we adopt the following procedure: We first use the conditional logit model. One
caveat of the conditional logit model is that the model necessitates the independence of irrelevant
alternatives (IIA), which implies that the choice between two alternatives should be independent of the
attributes of all other alternatives. As such we test the IIA assumption using the specification test of
[Hausmann1978].18
5 Results
We use the conditional logit model for each of the two-digit sectors as well as the sectoral aggregations
as described in Section 3. Our workhorse, as described in the previous section, is the conditional logit
model unless the IIA assumption is violated. In fact, The test results reported below suggest that the
IIA assumption holds across all sector classifications, rendering the conditional logit sufficient in the
empirical testings of the hypotheses.19
When interpreting the below results we will make reference to two classifications. First, identifying
the statistically significant factors that influence the probability of foreign firms investing in a region we
will classify these reasons as those that would suggest most investments being market-seeking, efficiency-
seeking or cost-reduction-seeking. Second, in reference to the theoretical models of horizontal, vertical
and knowledge-capital FDI we interpret the significance of factor endowments as suggestive of horizontal
FDI dominating a sector, the significance of cost factors as suggestive of vertical FDI, and a mix of both
results as suggestive of knowledge-capital FDI dominating the sector of analysis.20
18Hausmann’s specification test can be used to test for IIA because [Hausmann and McFadden1984] suggest that if a
subset of the choice set is irrelevant with respect to the other alternatives, omitting it will not lead to inconsistent estimates.19In testing for the IIA assumption’s validity we either exclude Latin American countries or China from the regressions.
Both groups of countries are always high in the list of countries that attract FDI. In fact, over time the presence of China
has been on the rise. To account for this, when running regressions for the 1980-1994 period we exclude Latin American
countries while when running regressions for the 1995-2004 period we exclude China. In all regressions the IIA assumption
holds allowing for use of the conditional logit estimations across the board and also suggesting our results are robust to
the exclusion of China, Argentina or Brazil.20All regressions also include fixed region effects and regional income classification dummies. When these fixed effects
and dummies are not included in the analysis the IIA assumption is violated. Under these circumstances the nested logit
20
5.1 Tradeables and Non-tradeables Sectors
We start by analyzing the location decision of firms that in sectors that are classified as producing
tradable or nontradables. Results (reported in table 6) suggest that for the period 1980-2004 factor
endowments, institutional quality, less political and economic risk, lower costs and less trade openness
increases the probability a firm invests in a region, regardless of whether the firm is in a sector producing
tradable goods or in one producing nontradable goods. The results regarding agglomeration are mixed,
not suggesting any clear pattern of persistence in FDI in the tradables and nontradables producing
sectors. The significance of both factor endowments and cost related factors suggest that the most
suitable theoretical model to explain these results would be the knowledge- capital model. Similarly,
the results do suggest that foreign firms in both sectors have incentives to reduce costs as well as market
seek. However, this finding and the following interpretations could also be attributed to the fact that
aggregation at this extent might still be masking significant sectoral differences.
Both the extent of FDI and the geographic composition of it has evolved significantly in the 1990s.
To test for whether the factors that govern the location choice of foreign firms have changed over time
the sample is split into two sub-periods, namely 1980-1994 and 1995-2004. While a majority of the
factors remain significant across the two sub-periods the importance of several factors seems to change
over time. Below we only discuss these factors for which the statistical significance differs across the
two time periods.
The bureaucratic quality, included as a measure of institutional quality, is found to be a significant
factor as having influenced foreign firms’ location choice in the earlier sample while not having any
significant impact in the latter part of the sample, i.e. post 1995. In other words, for foreign firms in
both sectors that produce tradables and nontradables while corruption is a deterrent throughout the
1980s and the 1990s the quality of institutions no longer seems to matter contrary to the 1980s.
The foreign firms in the nontradables producing sectors are found to prefer locations with larger
market sizes during the earlier time period. However, post 1995 the results suggest that the location
framework is used, suggesting that the nests are best defined by the regional characteristics which are captured by the
fixed effects in the following regressions.
21
choice of foreign firms in these sectors is not significantly affected by the market size. The alternative
factor endowment indicator included in the analysis, the human capital endowment of the region, prevails
as a significant factor in the decision of the firms over both time periods.
Similarly, for the foreign firms in the tradable goods producing sectors the real exchange rate and
trade openness are found not to have been significant factors in these foreign firms’ location choices
during the 1980s. However, both the exchange rate level and the extent of trade openness are found to be
significant factors that have governed the location choice of multinationals during the post 1995 period.
In fact results suggest that the probability that a foreign firm invests in a region increases with an
appreciated local currency and a less internationally integration of that region. The latter finding could
be interpreted as suggesting that firms in both sectors view international trade as increased competition
and would prefer protected business environments. The evidence can also be interpreted as suggesting
substitution between trade and investment activities of MNEs has increased over time. The former
finding on the other hand could be suggestive of the existence of wealth effects due to real exchange rate
changes. This could be on account of the wealth effect of the real exchange rate changes through its
differential impact on the revenue and costs of the firms (see [Blonigen1997] or through its differential
impact on external and internal financing terms (see [Froot and Stein1991], leading to decreased foreign
investment probability in the region.21 Taking the view that the imperfect goods market assumption
dominates, then one could interpret the finding that the probability a foreign firm invests in a region is
positively affected by the depreciation of the local currency of that region for firms in both the tradable
and nontradable sectors could be indicative of the extensive use of intermediate inputs alongside serving
of the local markets with the final goods produced, where the cost and revenues of the firm are mostly
denominated in different currencies. In such a currency composition of revenues and cost one would
expect a local currency depreciation to reduce the probability of foreign firms investing in a region. This
interpretation holds for the firms in both the nontradables and the tradables sectors during the post
1995 period, and also for the earlier time period for the firms in the nontradables producing sectors.21 In both [Blonigen1997] and [Froot and Stein1991] the wealth effects are modeled to induce foreign acquisition of
domestic assets, the opposite sign of what we find above.
22
To summarize, the results regarding the location choice of firms in the tradables and nontradables
sectors do not suggest clear differences across sectors. In fact, given the significance of almost all the
variables one suspects that the aggregation of very different two-digit sectors under broad categories such
as tradables and nontradables producing sectors could mask more detailed sectoral differences. Taking
cue from this interpretation we further classify the sectors according to their technology-intensities, and
follow that analysis with regressions at the two-digit sector level.
5.2 Technology Intensity
The location choice of the firms might not only differ across the sectors with different trade-orientation,
but could also differ according to their technology-intensities. Grouping the sectors according to
UNIDOs classification, three categories are formed: sectors that are resource-based, sectors that are
low-technology intensive, and sectors that are medium- and high- technology intensive. Results pre-
sented in table 7 suggest that the factors that govern the location choice of the firms operating in these
three categories differ in important ways.
Among the three sectors firms in both medium-high technology intensive sectors and resource-based
sectors invest in regions with a larger market size and more human capital, suggesting firms in both
sectors can be depicted as market-seeking or carrying out investments best depicted by horizontal
FDI models where factor endowments matter most. The evidence suggests that market-seeking and
horizontal FDI prevails throughout both the 1980s and the 1990s and early 200s in the medium and
high technology intensive sectors. However, the importance of factor endowments in the location choice
of foreign firms in both resource-based and low-technology intensive sectors are found to change over
time. In fact, in the resource-based sectors only after post 1995 do factor endowments seem to matter.
An even more mixed and unintuitive over time pattern is evident in the role of factor endowments in
the geographic choices of foreign firms in the low-technology sectors. In short, given the significance of
factor endowments in the location decision of foreign firms in the medium and high-technology sectors
(MHT) and not in any other suggests that the MHT is dominated by horizontal FDI while others might
be dominated by FDI that is vertical in nature.
23

Firms in all three sector classifications are found to be deterred by higher corporate taxes, suggesting
the cost factors matter across all three sector classifications, and across all time periods of analysis.
Foreign firms investing in resource-based sectors do not seem to be affected by the institutional
quality as suggested by the insignificance of the bureaucratic quality and corruption indicators. The
firms investing in low-technology intensive sectors however seem to prefer investing in regions where
corruption is less, with not much concern about the quality per se of the institutions. On the contrary,
foreign firms investing in medium and high-technology sectors seem to care more about the bureaucratic
quality rather than the extent of corruption. However, it is important to note that the institutional
features that foreign firms care about in the region they are investing in seems to evolve over time.
For example, while corruption did not influence the location choice of foreign firms in low-technology
intensive sectors during the 1980s it has become a significant factor in governing their location choice
post 1995.
All foreign firms, regardless of the technology intensity of the sector they are operating in, prefer
investing in regions with lower political risk. A similar finding prevails for their preference of a more
stable, except for firms in low-technology intensive sectors. It is important to note that the importance
of these risk factors also evolve over time. While both less political and economic risk is preferred by
firms in the MHT sectors at all times, firms in the resource-based sectors have started to care less about
both over time.
The negative sign we find for the trade variable is suggestive that trade and FDI are substitutes
across all sectors. While this finding prevails over time for both the resource-based and MHT sectors,
the substitutability between trade and FDI is found to be a relatively new phenomena in low-technology
sectors. Finally, the results on agglomeration does not suggest any strong and clear role of persistence
of foreign investment, neither across sector nor across time.
5.3 ISIC 2-digit Sectoral Classifications
While the analysis of aggregated sectoral groupings suggest differences across firms location choice
depending on the sector they operate in, a more disaggregated sectoral analysis could allow identification
24
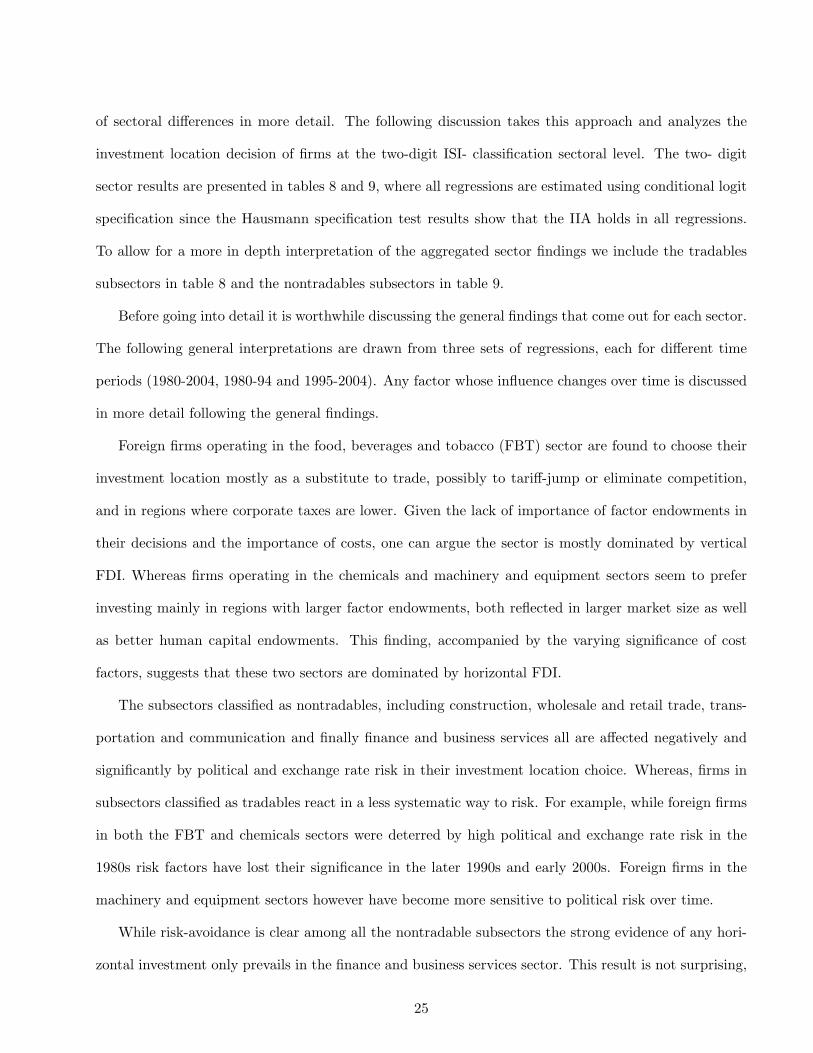
of sectoral differences in more detail. The following discussion takes this approach and analyzes the
investment location decision of firms at the two-digit ISI- classification sectoral level. The two- digit
sector results are presented in tables 8 and 9, where all regressions are estimated using conditional logit
specification since the Hausmann specification test results show that the IIA holds in all regressions.
To allow for a more in depth interpretation of the aggregated sector findings we include the tradables
subsectors in table 8 and the nontradables subsectors in table 9.
Before going into detail it is worthwhile discussing the general findings that come out for each sector.
The following general interpretations are drawn from three sets of regressions, each for different time
periods (1980-2004, 1980-94 and 1995-2004). Any factor whose influence changes over time is discussed
in more detail following the general findings.
Foreign firms operating in the food, beverages and tobacco (FBT) sector are found to choose their
investment location mostly as a substitute to trade, possibly to tariff-jump or eliminate competition,
and in regions where corporate taxes are lower. Given the lack of importance of factor endowments in
their decisions and the importance of costs, one can argue the sector is mostly dominated by vertical
FDI. Whereas firms operating in the chemicals and machinery and equipment sectors seem to prefer
investing mainly in regions with larger factor endowments, both reflected in larger market size as well
as better human capital endowments. This finding, accompanied by the varying significance of cost
factors, suggests that these two sectors are dominated by horizontal FDI.
The subsectors classified as nontradables, including construction, wholesale and retail trade, trans-
portation and communication and finally finance and business services all are affected negatively and
significantly by political and exchange rate risk in their investment location choice. Whereas, firms in
subsectors classified as tradables react in a less systematic way to risk. For example, while foreign firms
in both the FBT and chemicals sectors were deterred by high political and exchange rate risk in the
1980s risk factors have lost their significance in the later 1990s and early 2000s. Foreign firms in the
machinery and equipment sectors however have become more sensitive to political risk over time.
While risk-avoidance is clear among all the nontradable subsectors the strong evidence of any hori-
zontal investment only prevails in the finance and business services sector. This result is not surprising,
25
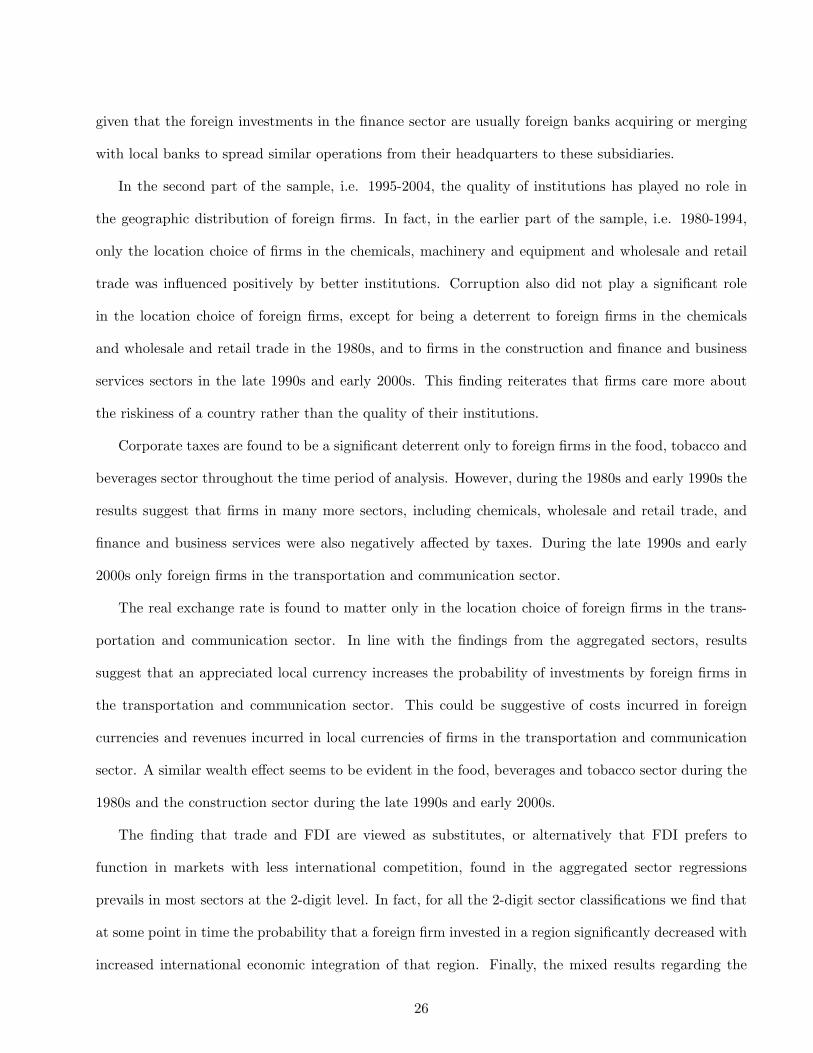
given that the foreign investments in the finance sector are usually foreign banks acquiring or merging
with local banks to spread similar operations from their headquarters to these subsidiaries.
In the second part of the sample, i.e. 1995-2004, the quality of institutions has played no role in
the geographic distribution of foreign firms. In fact, in the earlier part of the sample, i.e. 1980-1994,
only the location choice of firms in the chemicals, machinery and equipment and wholesale and retail
trade was influenced positively by better institutions. Corruption also did not play a significant role
in the location choice of foreign firms, except for being a deterrent to foreign firms in the chemicals
and wholesale and retail trade in the 1980s, and to firms in the construction and finance and business
services sectors in the late 1990s and early 2000s. This finding reiterates that firms care more about
the riskiness of a country rather than the quality of their institutions.
Corporate taxes are found to be a significant deterrent only to foreign firms in the food, tobacco and
beverages sector throughout the time period of analysis. However, during the 1980s and early 1990s the
results suggest that firms in many more sectors, including chemicals, wholesale and retail trade, and
finance and business services were also negatively affected by taxes. During the late 1990s and early
2000s only foreign firms in the transportation and communication sector.
The real exchange rate is found to matter only in the location choice of foreign firms in the trans-
portation and communication sector. In line with the findings from the aggregated sectors, results
suggest that an appreciated local currency increases the probability of investments by foreign firms in
the transportation and communication sector. This could be suggestive of costs incurred in foreign
currencies and revenues incurred in local currencies of firms in the transportation and communication
sector. A similar wealth effect seems to be evident in the food, beverages and tobacco sector during the
1980s and the construction sector during the late 1990s and early 2000s.
The finding that trade and FDI are viewed as substitutes, or alternatively that FDI prefers to
function in markets with less international competition, found in the aggregated sector regressions
prevails in most sectors at the 2-digit level. In fact, for all the 2-digit sector classifications we find that
at some point in time the probability that a foreign firm invested in a region significantly decreased with
increased international economic integration of that region. Finally, the mixed results regarding the
26
agglomeration effects are further evident at the 2-digit level as well, where there is no clear persistence
pattern in the geographic choice of foreign firms.
6 Conclusions
The analysis contributes to the literature by analyzing the location choice of a very large sample of
multinational firms (17,000 firms), and by undertaking a very detailed analysis of the differences in
these locational choices across a wide range of sectors, both aggregated according to the characteristics
of the final product and the 2-digit ISI-classification. In summary, the findings suggest that the factors
that govern the location choice of multinational firms differ across sectors. This result suggests that the
countries with different characteristics, or in other words different comparative advantages, will succeed
in attracting foreign firms from different sectors.
Understanding the economic geography of multinational firms across different sectors is of great
importance for policy-makers. As [Aykut and Sayek2007] and [Alfaro2003] show, the growth effects of
FDI extensively depend on the sectoral composition of the FDI inflows. Therefore, understanding the
factors that govern the sectoral composition of the foreign investments is of relevance in identifying the
benefits that accrue from these foreign investments. As competition among countries to attract the
larger share of the worldwide FDI pie intensifies, understanding the geographic dispersion of foreign
investment at the micro and more detailed level gains increased importance. This paper contributes to
both the academic and the policy discussions regarding the topic.
References
[Alfaro2003] Alfaro, L. (2003). Foreign direct investment and growth: Does the sector matter? 2003.
[Alfaro and Charlton2007] Alfaro, L. and Charlton, A. (2007). Intra-industry foreign direct investment.
(13447).
[Aykut and Ratha2004] Aykut, D. and Ratha, D. (2004). South-south fdi flows: How big are they?
Transnational Corporations, 13(1).
27
[Aykut and Sayek2007] Aykut, D. and Sayek, S. (2007). Do Multinationals Feed Local Development
and Growth?, chapter The Role of Sectoral Composition of Foreign Direct Investment on Growth.
Elsevier.
[Basile et al.] Basile, R., Castellani, D., and Zanfei, A. Location choices of multinational firms in
europe: the role of national boundaries and eu policy. Quaderni di Economia, Matematica e Statistica,
Universit di Urbino, n. 78, 2003.
[Basile et al.2003] Basile, R., Giunta, A., and Nugent, J. B. (2003). Foreign expansion by italian
manufacturing firms in the nineties: An ordered probit analysis. Review of Industrial Organization,
23(1):1–24.
[Blonigen1997] Blonigen, B. A. (1997). Firm-specific assets and the link between exchange rates and
foreign direct investment. American Economic Review, 87(3):447–465.
[Blonigen2001] Blonigen, B. A. (2001). In search of substitution between foreign production and exports.
Journal of International Economics, 53(1):81–104.
[Blonigen et al.2003] Blonigen, B. A., Davies, R. B., and Head, K. (2003). Estimating the knowledge-
capital model of the multinational enterprise: Comment. American Economic Review, 93(3):980–994.
[Brada et al.2006] Brada, J. C., Kutan, A., and Yigit, T. M. (2006). The effects of transition and
political instability on foreign direct investment inflows: Central europe and the balkans. Economics
of Transition.
[Brainard1997] Brainard, S. L. (1997). An empirical assessment of the proximity-concentration tradeoff
between multinational sales and trade. American Economic Review, Vol. 87, no. 4:520–544.
[Campos and Kinoshita2003] Campos, N. F. and Kinoshita, Y. (2003). Why does fdi go where it goes?
new evidence from the transitional economies.
28
[Carlton1983] Carlton, D. W. (1983). The location and employment choices of new firms: An econo-
metric model with discrete and continuous endogenous variable. Review of Economics and Statistics,
65(3):440–9.
[Carr et al.2001] Carr, D. L., Markusen, J. R., and Maskus, K. E. (2001). Estimating the knowledge-
capital model of the multinational enterprise. American Economic Review, 91(3):693–708.
[Carr et al.2003] Carr, D. L., Markusen, J. R., and Maskus, K. E. (2003). Estimating the knowledge-
capital model of the multinational enterprise: Reply. American Economic Review, 93(3):995–1001.
[Choe2000] Choe, J.-I. (2000). Japanese foreign direct investment in electrical machinery and appli-
ances in the united states: A combined industrial organization and location theory approach. Asian
Economic Journal, 14(3):301–315.
[Coughlin et al.1991] Coughlin, C. C., Terza, J. V., and Aromdee, V. (1991). State characteristics and
the location of foreign direct investment within the united states. Review of Economics and Statistics,
73(4):675–683.
[Davies2008] Davies, R. B. (2008). Hunting high and low for vertical fdi. Review of International
Economics, 16(2):250–267.
[Deichmann et al.2003] Deichmann, J., Karidis, S., and Sayek, S. (2003). Foreign direct investment in
turkey: Regional determinants. Applied Economics, 35(16):1767–1778.
[Dunning1993] Dunning, J. (1993). Multinational Enterprises and the Global Economy. Addison-Wesley
Publishing Company: Wokingham.
[Feinberg and Keane2001] Feinberg, S. E. and Keane, M. P. (2001). U.s.-canada trade liberalization
and mnc production location.
[Froot and Stein1991] Froot, K. A. and Stein, J. C. (1991). Exchange rates and foreign direct invest-
ment: An imperfect capital markets approach. Quarterly Journal of Economics, 106(4):1191–1217.
29
[Gholami et al.2006] Gholami, R., Lee, S.-Y. T., and Heshmati, A. (2006). The causal relationship
between information and communication technology and foreign direct investment. World Economy,
29(1):43–62.
[Gross et al.2005] Gross, D. M., Raff, H., and Ryan, M. (2005). Inter- and intra-sectoral linkages in
foreign direct investment: Evidence from japanese investment in europe. Journal of the Japanese and
International Economies, 19(1):110–134.
[Guimaraes and Woodward2000] Guimaraes, P., F. O. and Woodward, D. (2000). Agglomeration and
the location of foreign direct investment in portugal. Journal of Urban Economics, 47:115–35.
[Hanson et al.2005] Hanson, G. H., Mataloni, R. J., and Slaughter, M. J. (2005). Vertical production
networks in multinational firms. The Review of Economics and Statistics, 87(4):664–678.
[Hausmann1978] Hausmann, J. (1978). Specification tests in econometrics. Econometrica, 46:1251–
1271.
[Hausmann and McFadden1984] Hausmann, J. and McFadden, D. (1984). Specification tests for the
multinomial logit model. Econometrica, 52:1219–1240.
[Helpman1984] Helpman, E. (1984). A simple theory of international trade with multinational corpo-
rations. Journal of Political Economy, 92(3):451–471.
[Hogenbirk and Narula2004] Hogenbirk, A. and Narula, R. (2004). Location and agglomeration of fdi in
the netherlands: Implications for policy. MERIT-Infonomics Research Memorandum Series Working
Paper.
[Kim2003] Kim, L. (2003). The dynamics of technology development: Lessons from the korean experi-
ence. In Lall, S. and Urata, S., editors, Competitiveness, FDI and technological activity in East Asia,
pages 143–167. Elgar in association with the World Bank, Korea U.
[Kim et al.2003] Kim, S.-H., Pickton, T. S., and Gerking, S. (2003). Foreign direct investment: Agglom-
eration economies and returns to promotion expenditures. Review of Regional Studies, 33(1):61–72.
30
[Kolstad and Villanger2004] Kolstad, I. and Villanger, E. (2004). Determinants of foreign direct in-
vestment in services. CMI Working Papers WP 2004: 2, CMI (Chr. Michelsen Institute), Bergen,
Norway.
[Luger and Shetty1985] Luger, M. and Shetty, S. (1985). Determinants of foreign plant start-ups in the
united states: Lessons for policy makers in the southeast. Vanderbilt Journal of Transnational Law,
18:223–245.
[Mariotti and Piscitello1995] Mariotti, S. and Piscitello, L. (1995). Information costs and location of
fdis within the host country: empirical evidence from italy. Journal of International Business Studies,
26(4):815–41.
[Markusen and Maskus2002] Markusen, J. R. and Maskus, K. E. (2002). Discriminating among alter-
native theories of the multinational enterprise. Review of International Economics, 10(4):694–707.
[Markusen and Venables1996] Markusen, J. R. and Venables, A. J. (1996). The theory of endowment,
intra-industry, and multinational trade.
[Markusen and Venables1998] Markusen, J. R. and Venables, A. J. (1998). Multinational firms and the
new trade theory. Journal of International Economics, 46(2):183–203.
[Markusen and Venables2000] Markusen, J. R. and Venables, A. J. (2000). The theory of endowment,
intra-industry and multi-national trade. Journal of International Economics, 52(2):209–234.
[McFadden1974] McFadden, D. L. (1974). chapter Conditional Logit Analysis of Qualitative Choice
Behavior in Frontier in Econometrics ,, pages 105–42. Academic Press, New York and London.
[Mollick et al.2006] Mollick, A. V., Ramos-Duran, R., and Silva-Ochoa, E. (2006). Infrastructure and
FDI inflows into Mexico: A panel data approach. Global Economy Journal, 6(1):1–25.
[Navaretti and Venables2004] Navaretti, G. B. and Venables, A. J. (2004). Multinational Firms in the
World Economy. Princeton: Princeton University Press.
31
[Pusterla and Resmini2005] Pusterla, F. and Resmini, L. (September 2005). Where do foreign firms
locate in transition countries? an empirical investigation. ISLA Working Papers 20, ISLA, Centre
for research on Latin American Studies and Transition Economies, Universita’ Bocconi, Milano,
Italy.
[Resmini2000] Resmini, L. (2000). The determinants of foreign direct investment in the ceecs: New
evidence from sectoral patterns. Economics of Transition, 8(3):665–689.
[UNCTAD2005] UNCTAD (2005). Handbook of Statistics. UNCTAD, New York: United Nations.
[Waldkirch2004] Waldkirch, A. (2004). Vertical fdi? a host country perspective.
[Woodward1992] Woodward, D. P. (1992). Locational determinants of japanese manufacturing start-
ups in the united states. Southern Economic Journal, 58:690–708.
[Yeaple2003] Yeaple, S. R. (2003). The complex integration strategies of multinationals and cross coun-
try dependencies in the structure of foreign direct investment. Journal of International Economics,
60(2):293–314.
32
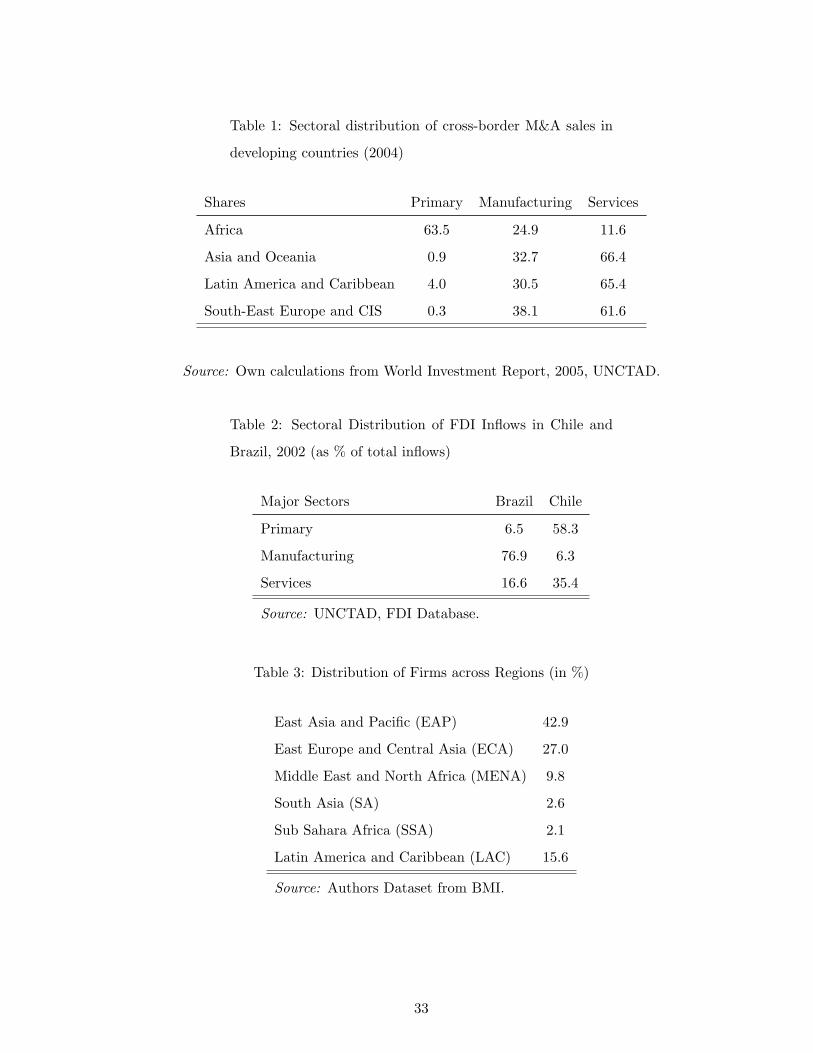
Table 1: Sectoral distribution of cross-border M&A sales in
developing countries (2004)
Shares Primary Manufacturing Services
Africa 63.5 24.9 11.6
Asia and Oceania 0.9 32.7 66.4
Latin America and Caribbean 4.0 30.5 65.4
South-East Europe and CIS 0.3 38.1 61.6
Source: Own calculations from World Investment Report, 2005, UNCTAD.
Table 2: Sectoral Distribution of FDI Inflows in Chile and
Brazil, 2002 (as % of total inflows)
Major Sectors Brazil Chile
Primary 6.5 58.3
Manufacturing 76.9 6.3
Services 16.6 35.4
Source: UNCTAD, FDI Database.
Table 3: Distribution of Firms across Regions (in %)
East Asia and Pacific (EAP) 42.9
East Europe and Central Asia (ECA) 27.0
Middle East and North Africa (MENA) 9.8
South Asia (SA) 2.6
Sub Sahara Africa (SSA) 2.1
Latin America and Caribbean (LAC) 15.6
Source: Authors Dataset from BMI.
33
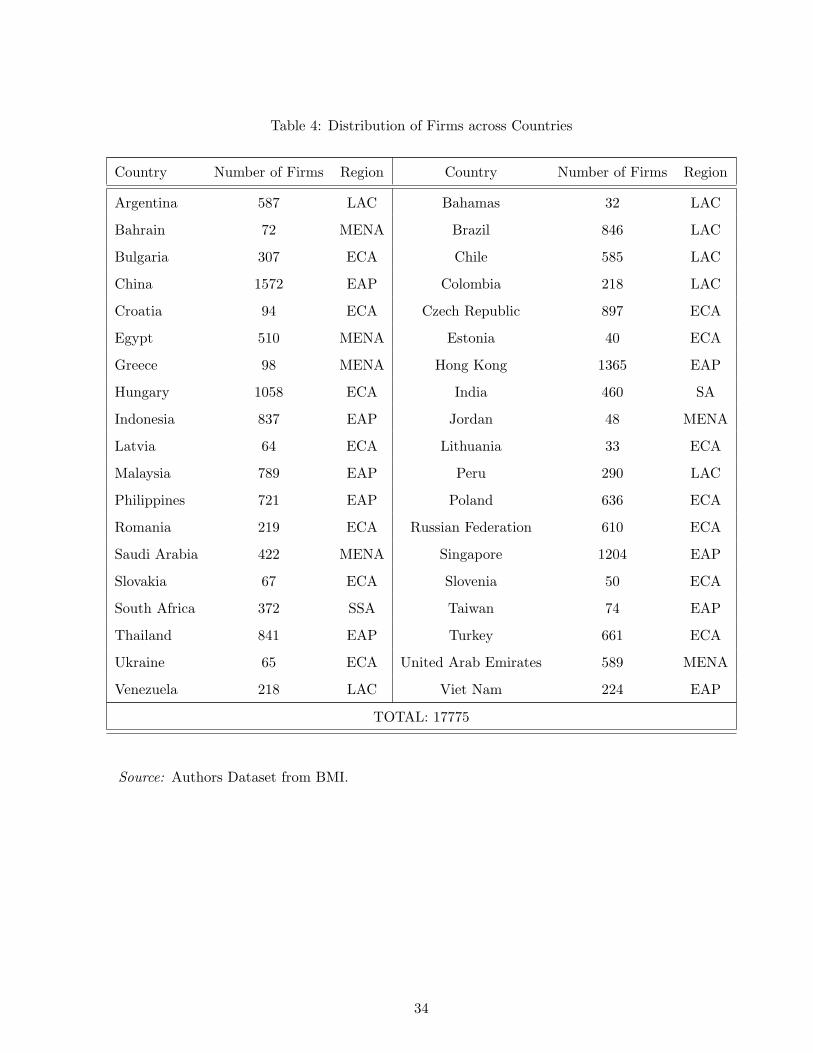
Table 4: Distribution of Firms across Countries
Country Number of Firms Region Country Number of Firms Region
Argentina 587 LAC Bahamas 32 LAC
Bahrain 72 MENA Brazil 846 LAC
Bulgaria 307 ECA Chile 585 LAC
China 1572 EAP Colombia 218 LAC
Croatia 94 ECA Czech Republic 897 ECA
Egypt 510 MENA Estonia 40 ECA
Greece 98 MENA Hong Kong 1365 EAP
Hungary 1058 ECA India 460 SA
Indonesia 837 EAP Jordan 48 MENA
Latvia 64 ECA Lithuania 33 ECA
Malaysia 789 EAP Peru 290 LAC
Philippines 721 EAP Poland 636 ECA
Romania 219 ECA Russian Federation 610 ECA
Saudi Arabia 422 MENA Singapore 1204 EAP
Slovakia 67 ECA Slovenia 50 ECA
South Africa 372 SSA Taiwan 74 EAP
Thailand 841 EAP Turkey 661 ECA
Ukraine 65 ECA United Arab Emirates 589 MENA
Venezuela 218 LAC Viet Nam 224 EAP
TOTAL: 17775
Source: Authors Dataset from BMI.
34
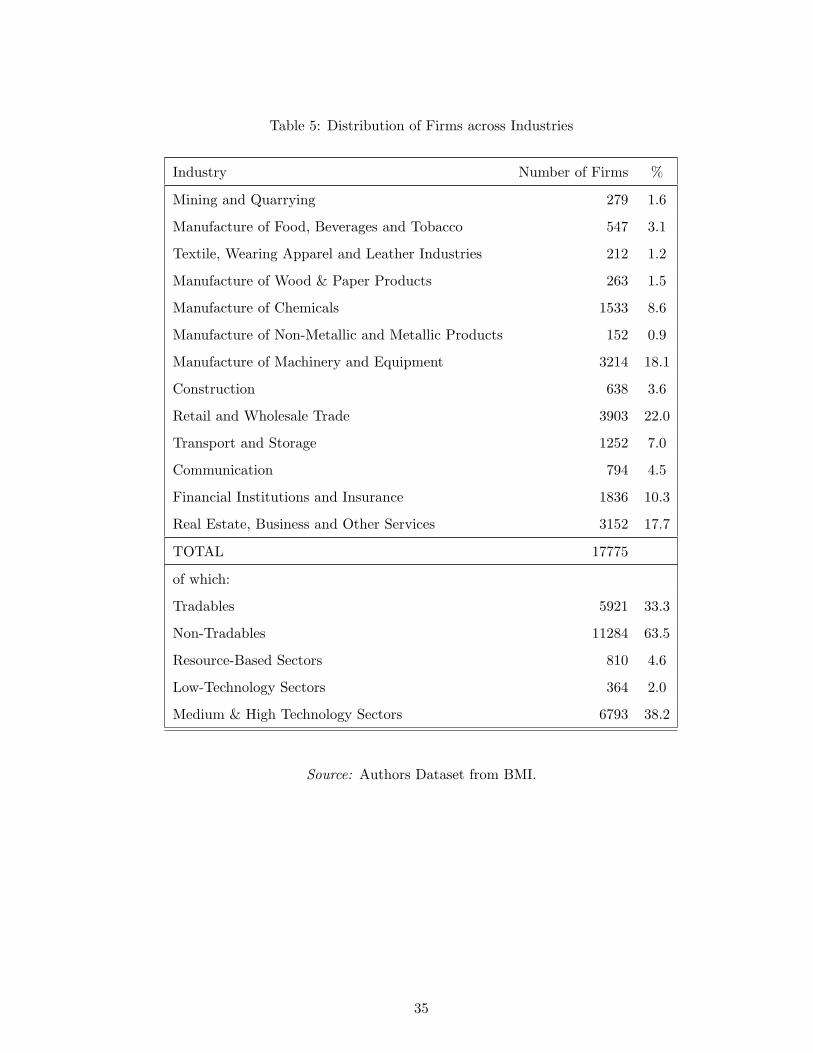
Table 5: Distribution of Firms across Industries
Industry Number of Firms %
Mining and Quarrying 279 1.6
Manufacture of Food, Beverages and Tobacco 547 3.1
Textile, Wearing Apparel and Leather Industries 212 1.2
Manufacture of Wood & Paper Products 263 1.5
Manufacture of Chemicals 1533 8.6
Manufacture of Non-Metallic and Metallic Products 152 0.9
Manufacture of Machinery and Equipment 3214 18.1
Construction 638 3.6
Retail and Wholesale Trade 3903 22.0
Transport and Storage 1252 7.0
Communication 794 4.5
Financial Institutions and Insurance 1836 10.3
Real Estate, Business and Other Services 3152 17.7
TOTAL 17775
of which:
Tradables 5921 33.3
Non-Tradables 11284 63.5
Resource-Based Sectors 810 4.6
Low-Technology Sectors 364 2.0
Medium & High Technology Sectors 6793 38.2
Source: Authors Dataset from BMI.
35
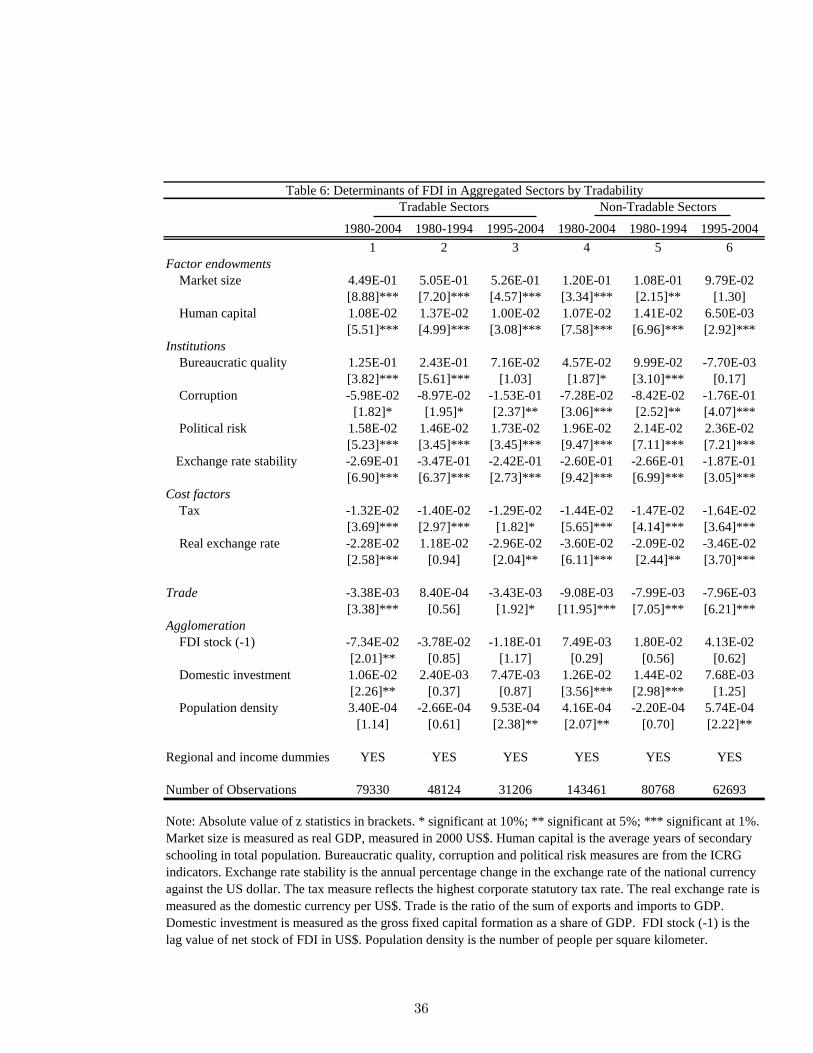
1980-2004 1980-1994 1995-2004 1980-2004 1980-1994 1995-2004
1 2 3 4 5 6
Factor endowments
Market size 4.49E-01 5.05E-01 5.26E-01 1.20E-01 1.08E-01 9.79E-02
[8.88]*** [7.20]*** [4.57]*** [3.34]*** [2.15]** [1.30]
Human capital 1.08E-02 1.37E-02 1.00E-02 1.07E-02 1.41E-02 6.50E-03
[5.51]*** [4.99]*** [3.08]*** [7.58]*** [6.96]*** [2.92]***
Institutions
Bureaucratic quality 1.25E-01 2.43E-01 7.16E-02 4.57E-02 9.99E-02 -7.70E-03
[3.82]*** [5.61]*** [1.03] [1.87]* [3.10]*** [0.17]
Corruption -5.98E-02 -8.97E-02 -1.53E-01 -7.28E-02 -8.42E-02 -1.76E-01
[1.82]* [1.95]* [2.37]** [3.06]*** [2.52]** [4.07]***
Political risk 1.58E-02 1.46E-02 1.73E-02 1.96E-02 2.14E-02 2.36E-02
[5.23]*** [3.45]*** [3.45]*** [9.47]*** [7.11]*** [7.21]***
Exchange rate stability -2.69E-01 -3.47E-01 -2.42E-01 -2.60E-01 -2.66E-01 -1.87E-01
[6.90]*** [6.37]*** [2.73]*** [9.42]*** [6.99]*** [3.05]***
Cost factors
Tax -1.32E-02 -1.40E-02 -1.29E-02 -1.44E-02 -1.47E-02 -1.64E-02
[3.69]*** [2.97]*** [1.82]* [5.65]*** [4.14]*** [3.64]***
Real exchange rate -2.28E-02 1.18E-02 -2.96E-02 -3.60E-02 -2.09E-02 -3.46E-02
[2.58]*** [0.94] [2.04]** [6.11]*** [2.44]** [3.70]***
Trade -3.38E-03 8.40E-04 -3.43E-03 -9.08E-03 -7.99E-03 -7.96E-03
[3.38]*** [0.56] [1.92]* [11.95]*** [7.05]*** [6.21]***
Agglomeration
FDI stock (-1) -7.34E-02 -3.78E-02 -1.18E-01 7.49E-03 1.80E-02 4.13E-02
[2.01]** [0.85] [1.17] [0.29] [0.56] [0.62]
Domestic investment 1.06E-02 2.40E-03 7.47E-03 1.26E-02 1.44E-02 7.68E-03
[2.26]** [0.37] [0.87] [3.56]*** [2.98]*** [1.25]
Population density 3.40E-04 -2.66E-04 9.53E-04 4.16E-04 -2.20E-04 5.74E-04
[1.14] [0.61] [2.38]** [2.07]** [0.70] [2.22]**
Regional and income dummies YES YES YES YES YES YES
Number of Observations 79330 48124 31206 143461 80768 62693
Note: Absolute value of z statistics in brackets. * significant at 10%; ** significant at 5%; *** significant at 1%.
Market size is measured as real GDP, measured in 2000 US$. Human capital is the average years of secondary
schooling in total population. Bureaucratic quality, corruption and political risk measures are from the ICRG
indicators. Exchange rate stability is the annual percentage change in the exchange rate of the national currency
against the US dollar. The tax measure reflects the highest corporate statutory tax rate. The real exchange rate is
measured as the domestic currency per US$. Trade is the ratio of the sum of exports and imports to GDP.
Domestic investment is measured as the gross fixed capital formation as a share of GDP. FDI stock (-1) is the
lag value of net stock of FDI in US$. Population density is the number of people per square kilometer.
Tradable Sectors Non-Tradable Sectors
Table 6: Determinants of FDI in Aggregated Sectors by Tradability
36
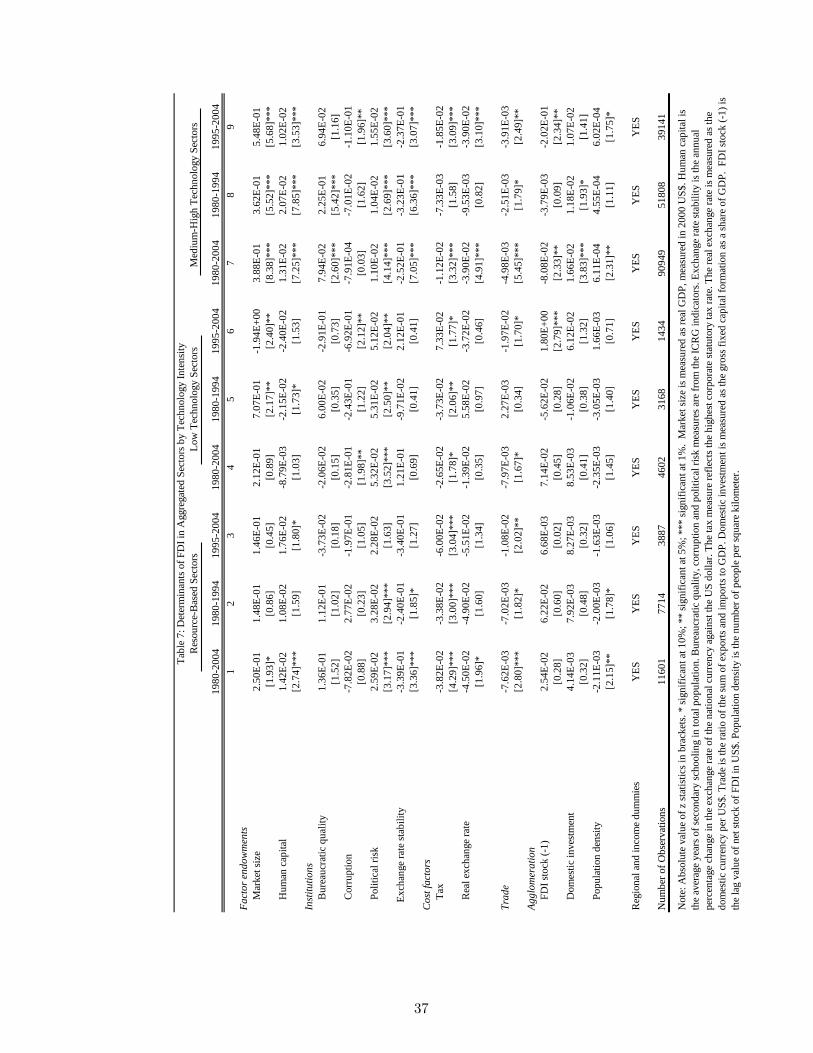
19
80
-20
04
19
80
-19
94
19
95
-20
04
19
80
-20
04
19
80
-19
94
19
95
-20
04
19
80
-20
04
19
80
-19
94
19
95
-20
04
12
34
56
78
9
Fa
cto
r en
do
wm
ents
M
arket
siz
e2
.50
E-0
11
.48
E-0
11
.46
E-0
12
.12
E-0
17
.07
E-0
1-1
.94
E+
00
3.8
8E
-01
3.6
2E
-01
5.4
8E
-01
[1.9
3]*
[0.8
6]
[0.4
5]
[0.8
9]
[2.1
7]*
*[2
.40
]**
[8.3
8]*
**
[5.5
2]*
**
[5.6
8]*
**
H
um
an c
apit
al1
.42
E-0
21
.08
E-0
21
.76
E-0
2-8
.79
E-0
3-2
.15
E-0
2-2
.40
E-0
21
.31
E-0
22
.07
E-0
21
.02
E-0
2
[2.7
4]*
**
[1.5
9]
[1.8
0]*
[1.0
3]
[1.7
3]*
[1.5
3]
[7.2
5]*
**
[7.8
5]*
**
[3.5
3]*
**
Inst
itu
tio
ns
B
ure
aucr
atic
qu
alit
y1
.36
E-0
11
.12
E-0
1-3
.73
E-0
2-2
.06
E-0
26
.00
E-0
2-2
.91
E-0
17
.94
E-0
22
.25
E-0
16
.94
E-0
2
[1.5
2]
[1.0
2]
[0.1
8]
[0.1
5]
[0.3
5]
[0.7
3]
[2.6
0]*
**
[5.4
2]*
**
[1.1
6]
C
orr
up
tion
-7.8
2E
-02
2.7
7E
-02
-1.9
7E
-01
-2.8
1E
-01
-2.4
3E
-01
-6.9
2E
-01
-7.9
1E
-04
-7.0
1E
-02
-1.1
0E
-01
[0.8
8]
[0.2
3]
[1.0
5]
[1.9
8]*
*[1
.22
][2
.12
]**
[0.0
3]
[1.6
2]
[1.9
6]*
*
P
oli
tica
l ri
sk2
.59
E-0
23
.28
E-0
22
.28
E-0
25
.32
E-0
25
.31
E-0
25
.12
E-0
21
.10
E-0
21
.04
E-0
21
.55
E-0
2
[3.1
7]*
**
[2.9
4]*
**
[1.6
3]
[3.5
2]*
**
[2.5
0]*
*[2
.04
]**
[4.1
4]*
**
[2.6
9]*
**
[3.6
0]*
**
E
xch
ange
rate
sta
bil
ity
-3.3
9E
-01
-2.4
0E
-01
-3.4
0E
-01
1.2
1E
-01
-9.7
1E
-02
2.1
2E
-01
-2.5
2E
-01
-3.2
3E
-01
-2.3
7E
-01
[3.3
6]*
**
[1.8
5]*
[1.2
7]
[0.6
9]
[0.4
1]
[0.4
1]
[7.0
5]*
**
[6.3
6]*
**
[3.0
7]*
**
Co
st f
act
ors
T
ax-3
.82
E-0
2-3
.38
E-0
2-6
.00
E-0
2-2
.65
E-0
2-3
.73
E-0
27
.33
E-0
2-1
.12
E-0
2-7
.33
E-0
3-1
.85
E-0
2
[4.2
9]*
**
[3.0
0]*
**
[3.0
4]*
**
[1.7
8]*
[2.0
6]*
*[1
.77
]*[3
.32
]***
[1.5
8]
[3.0
9]*
**
R
eal
exch
ange
rate
-4.5
0E
-02
-4.9
0E
-02
-5.5
1E
-02
-1.3
9E
-02
5.5
8E
-02
-3.7
2E
-02
-3.9
0E
-02
-9.5
3E
-03
-3.9
0E
-02
[1.9
6]*
[1.6
0]
[1.3
4]
[0.3
5]
[0.9
7]
[0.4
6]
[4.9
1]*
**
[0.8
2]
[3.1
0]*
**
Tra
de
-7.6
2E
-03
-7.0
2E
-03
-1.0
8E
-02
-7.9
7E
-03
2.2
7E
-03
-1.9
7E
-02
-4.9
8E
-03
-2.5
1E
-03
-3.9
1E
-03
[2.8
0]*
**
[1.8
2]*
[2.0
2]*
*[1
.67
]*[0
.34
][1
.70
]*[5
.45
]***
[1.7
9]*
[2.4
9]*
*
Ag
glo
mer
ati
on
F
DI
stock
(-1
)2
.54
E-0
26
.22
E-0
26
.68
E-0
37
.14
E-0
2-5
.62
E-0
21
.80
E+
00
-8.0
8E
-02
-3.7
9E
-03
-2.0
2E
-01
[0.2
8]
[0.6
0]
[0.0
2]
[0.4
5]
[0.2
8]
[2.7
9]*
**
[2.3
3]*
*[0
.09
][2
.34
]**
D
om
esti
c in
ves
tmen
t4
.14
E-0
37
.92
E-0
38
.27
E-0
38
.53
E-0
3-1
.06
E-0
26
.12
E-0
21
.66
E-0
21
.18
E-0
21
.07
E-0
2
[0.3
2]
[0.4
8]
[0.3
2]
[0.4
1]
[0.3
8]
[1.3
2]
[3.8
3]*
**
[1.9
3]*
[1.4
1]
P
op
ula
tion
den
sity
-2.1
1E
-03
-2.0
0E
-03
-1.6
3E
-03
-2.3
5E
-03
-3.0
5E
-03
1.6
6E
-03
6.1
1E
-04
4.5
5E
-04
6.0
2E
-04
[2.1
5]*
*[1
.78
]*[1
.06
][1
.45
][1
.40
][0
.71
][2
.31
]**
[1.1
1]
[1.7
5]*
Reg
ion
al a
nd
in
com
e d
um
mie
sY
ES
YE
SY
ES
YE
SY
ES
YE
SY
ES
YE
SY
ES
Nu
mb
er o
f O
bse
rvat
ion
s1
16
01
77
14
38
87
46
02
31
68
14
34
90
94
95
18
08
39
14
1
Res
ou
rce-
Bas
ed S
ecto
rsL
ow
Tec
hn
olo
gy S
ecto
rsM
ediu
m-H
igh
Tec
hn
olo
gy S
ecto
rs
Tab
le 7
: D
eter
min
ants
of
FD
I in
Aggre
gat
ed S
ecto
rs b
y T
ech
nolo
gy I
nte
nsi
ty
Note
: A
bso
lute
val
ue
of
z st
atis
tics
in
bra
cket
s. *
sig
nif
ican
t at
10
%;
** s
ign
ific
ant
at 5
%;
*** s
ign
ific
ant
at 1
%. M
arket
siz
e is
mea
sure
d a
s re
al G
DP
, m
easu
red
in
20
00
US
$. H
um
an c
apit
al i
s
the
aver
age
yea
rs o
f se
con
dar
y s
chooli
ng i
n t
ota
l p
op
ula
tion
. B
ure
aucr
atic
qu
alit
y, co
rru
pti
on
an
d p
oli
tica
l ri
sk m
easu
res
are
from
th
e IC
RG
in
dic
ators
. E
xch
ange
rate
sta
bil
ity i
s th
e an
nu
al
per
cen
tage
chan
ge
in t
he
exch
ange
rate
of
the
nat
ion
al c
urr
ency
agai
nst
th
e U
S d
oll
ar. T
he
tax
mea
sure
ref
lect
s th
e h
igh
est
corp
ora
te s
tatu
tory
tax
rat
e. T
he
real
ex
chan
ge
rate
is
mea
sure
d a
s th
e
dom
esti
c cu
rren
cy p
er U
S$
. T
rad
e is
th
e ra
tio o
f th
e su
m o
f ex
port
s an
d i
mp
ort
s to
GD
P. D
om
esti
c in
ves
tmen
t is
mea
sure
d a
s th
e gro
ss f
ixed
cap
ital
form
atio
n a
s a
shar
e of
GD
P. F
DI
stock
(-1
) is
the
lag v
alu
e of
net
sto
ck o
f F
DI
in U
S$
. P
op
ula
tion
den
sity
is
the
nu
mb
er o
f p
eop
le p
er s
qu
are
kil
om
eter
.
37
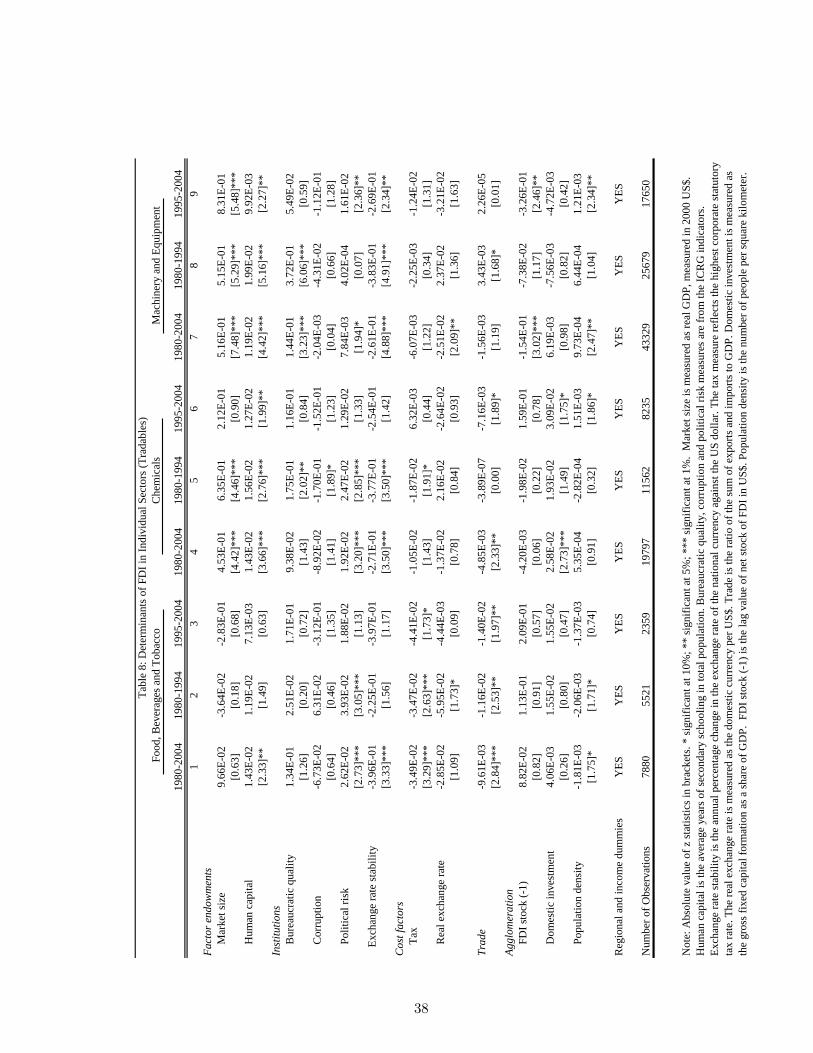
1980
-200
419
80
-19
94
19
95
-20
04
19
80
-20
04
19
80
-19
94
19
95
-20
04
19
80
-20
04
198
0-1
994
19
95
-20
04
12
34
56
78
9
Fact
or
end
ow
men
ts
Mar
ket
siz
e9
.66E
-02
-3.6
4E
-02
-2.8
3E
-01
4.5
3E
-01
6.3
5E
-01
2.1
2E
-01
5.1
6E
-01
5.1
5E
-01
8.3
1E
-01
[0.6
3]
[0.1
8]
[0.6
8]
[4.4
2]*
**
[4.4
6]*
**
[0.9
0]
[7.4
8]*
**
[5.2
9]*
**
[5.4
8]*
**
Hum
an c
apit
al1
.43E
-02
1.1
9E
-02
7.1
3E
-03
1.4
3E
-02
1.5
6E
-02
1.2
7E
-02
1.1
9E
-02
1.9
9E
-02
9.9
2E
-03
[2.3
3]*
*[1
.49
][0
.63
][3
.66
]***
[2.7
6]*
**
[1.9
9]*
*[4
.42
]***
[5.1
6]*
**
[2.2
7]*
*
Inst
itu
tion
s
Bure
aucr
atic
qual
ity
1.3
4E
-01
2.5
1E
-02
1.7
1E
-01
9.3
8E
-02
1.7
5E
-01
1.1
6E
-01
1.4
4E
-01
3.7
2E
-01
5.4
9E
-02
[1.2
6]
[0.2
0]
[0.7
2]
[1.4
3]
[2.0
2]*
*[0
.84
][3
.23
]***
[6.0
6]*
**
[0.5
9]
Corr
upti
on
-6.7
3E
-02
6.3
1E
-02
-3.1
2E
-01
-8.9
2E
-02
-1.7
0E
-01
-1.5
2E
-01
-2.0
4E
-03
-4.3
1E
-02
-1.1
2E
-01
[0.6
4]
[0.4
6]
[1.3
5]
[1.4
1]
[1.8
9]*
[1.2
3]
[0.0
4]
[0.6
6]
[1.2
8]
Poli
tica
l ri
sk2
.62E
-02
3.9
3E
-02
1.8
8E
-02
1.9
2E
-02
2.4
7E
-02
1.2
9E
-02
7.8
4E
-03
4.0
2E
-04
1.6
1E
-02
[2.7
3]*
**
[3.0
5]*
**
[1.1
3]
[3.2
0]*
**
[2.8
5]*
**
[1.3
3]
[1.9
4]*
[0.0
7]
[2.3
6]*
*
E
xch
ange
rate
sta
bil
ity
-3.9
6E
-01
-2.2
5E
-01
-3.9
7E
-01
-2.7
1E
-01
-3.7
7E
-01
-2.5
4E
-01
-2.6
1E
-01
-3.8
3E
-01
-2.6
9E
-01
[3.3
3]*
**
[1.5
6]
[1.1
7]
[3.5
0]*
**
[3.5
0]*
**
[1.4
2]
[4.8
8]*
**
[4.9
1]*
**
[2.3
4]*
*
Co
st f
act
ors
Tax
-3.4
9E
-02
-3.4
7E
-02
-4.4
1E
-02
-1.0
5E
-02
-1.8
7E
-02
6.3
2E
-03
-6.0
7E
-03
-2.2
5E
-03
-1.2
4E
-02
[3.2
9]*
**
[2.6
3]*
**
[1.7
3]*
[1.4
3]
[1.9
1]*
[0.4
4]
[1.2
2]
[0.3
4]
[1.3
1]
Rea
l ex
chan
ge
rate
-2.8
5E
-02
-5.9
5E
-02
-4.4
4E
-03
-1.3
7E
-02
2.1
6E
-02
-2.6
4E
-02
-2.5
1E
-02
2.3
7E
-02
-3.2
1E
-02
[1.0
9]
[1.7
3]*
[0.0
9]
[0.7
8]
[0.8
4]
[0.9
3]
[2.0
9]*
*[1
.36
][1
.63]
Tra
de
-9.6
1E
-03
-1.1
6E
-02
-1.4
0E
-02
-4.8
5E
-03
-3.8
9E
-07
-7.1
6E
-03
-1.5
6E
-03
3.4
3E
-03
2.2
6E
-05
[2.8
4]*
**
[2.5
3]*
*[1
.97
]**
[2.3
3]*
*[0
.00
][1
.89
]*[1
.19]
[1.6
8]*
[0.0
1]
Agglo
mer
ati
on
FD
I st
ock
(-1
)8
.82E
-02
1.1
3E
-01
2.0
9E
-01
-4.2
0E
-03
-1.9
8E
-02
1.5
9E
-01
-1.5
4E
-01
-7.3
8E
-02
-3.2
6E
-01
[0.8
2]
[0.9
1]
[0.5
7]
[0.0
6]
[0.2
2]
[0.7
8]
[3.0
2]*
**
[1.1
7]
[2.4
6]*
*
Dom
esti
c in
ves
tmen
t4
.06E
-03
1.5
5E
-02
1.5
5E
-02
2.5
8E
-02
1.9
3E
-02
3.0
9E
-02
6.1
9E
-03
-7.5
6E
-03
-4.7
2E
-03
[0.2
6]
[0.8
0]
[0.4
7]
[2.7
3]*
**
[1.4
9]
[1.7
5]*
[0.9
8]
[0.8
2]
[0.4
2]
Popula
tio
n d
ensi
ty-1
.81E
-03
-2.0
6E
-03
-1.3
7E
-03
5.3
5E
-04
-2.8
2E
-04
1.5
1E
-03
9.7
3E
-04
6.4
4E
-04
1.2
1E
-03
[1.7
5]*
[1.7
1]*
[0.7
4]
[0.9
1]
[0.3
2]
[1.8
6]*
[2.4
7]*
*[1
.04
][2
.34
]**
Reg
ion
al a
nd i
nco
me
du
mm
ies
YE
SY
ES
YE
SY
ES
YE
SY
ES
YE
SY
ES
YE
S
Num
ber
of
Ob
serv
atio
ns
78
80
55
21
23
59
19
79
71
15
62
82
35
433
29
25
67
91
76
50
Foo
d,
Bev
erag
es a
nd
To
bac
coC
hem
ical
sM
ach
iner
y a
nd
Eq
uip
men
t
Note
: A
bso
lute
val
ue
of
z st
atis
tics
in
bra
cket
s. *
sig
nif
ican
t at
10
%;
** s
ign
ific
ant
at 5
%;
*** s
ign
ific
ant
at 1
%.
Mar
ket
siz
e is
mea
sure
d a
s re
al G
DP
, m
easu
red
in
20
00 U
S$
.
Hum
an c
apit
al i
s th
e av
erag
e yea
rs o
f se
con
dar
y s
choo
lin
g i
n t
ota
l p
op
ula
tio
n.
Bu
reau
crat
ic q
ual
ity,
corr
up
tio
n a
nd
po
liti
cal
risk
mea
sure
s ar
e fr
om
th
e IC
RG
ind
icat
ors
.
Exch
ange
rate
sta
bil
ity i
s th
e an
nu
al p
erce
nta
ge
chan
ge
in t
he
exch
ange
rate
of
the
nat
ion
al c
urr
ency
agai
nst
th
e U
S d
oll
ar.
Th
e ta
x m
easu
re r
efle
cts
the
hig
hes
t co
rpo
rate
sta
tuto
ry
tax r
ate.
The
real
exch
ange
rate
is
mea
sure
d a
s th
e do
mes
tic
curr
ency
per
US
$.
Tra
de
is t
he
rati
o o
f th
e su
m o
f ex
po
rts
and
im
po
rts
to G
DP
. D
om
esti
c in
ves
tmen
t is
mea
sure
d a
s
the
gro
ss f
ixed
cap
ital
fo
rmat
ion
as
a sh
are
of
GD
P.
FD
I st
ock
(-1
) is
th
e la
g v
alu
e o
f n
et s
tock
of
FD
I in
US
$.
Po
pu
lati
on
den
sity
is
the
nu
mb
er o
f p
eople
per
squ
are
kil
om
eter
.
Tab
le 8
: D
eter
min
ants
of
FD
I in
In
div
idu
al S
ecto
rs (
Tra
dab
les)
38
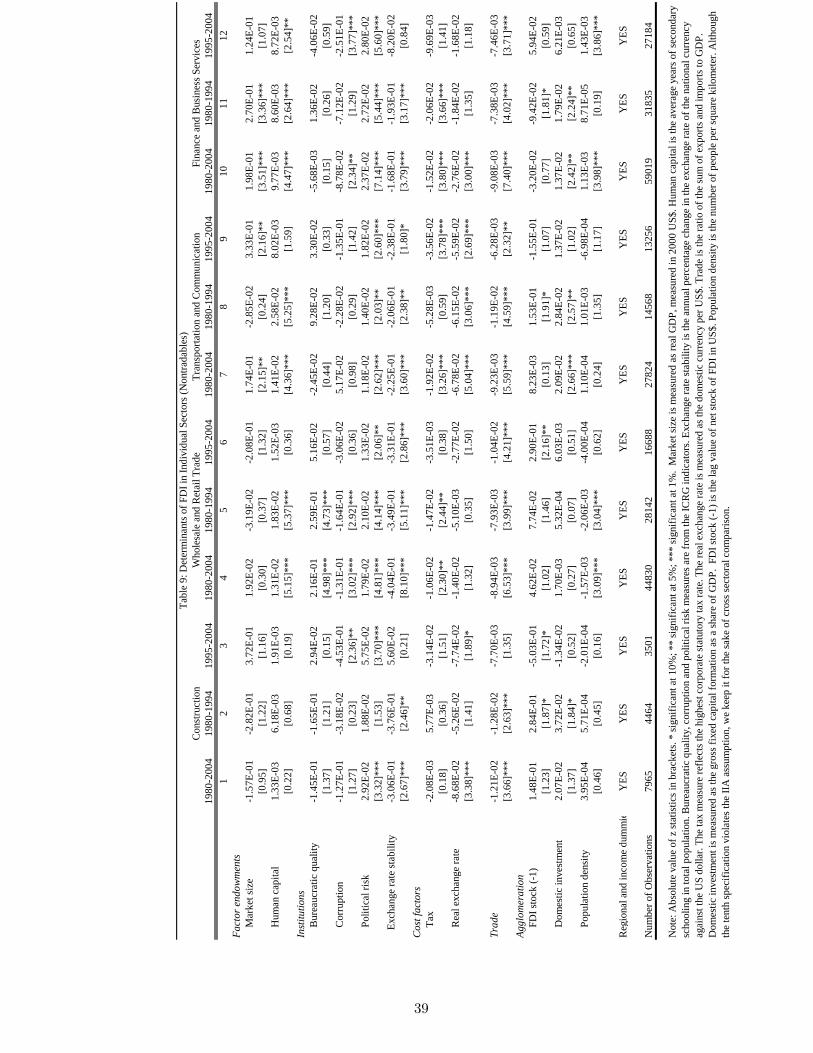
19
80
-20
04
19
80
-19
94
19
95
-20
04
19
80
-20
04
19
80
-19
94
19
95
-20
04
19
80
-20
04
19
80
-19
94
19
95
-20
04
19
80
-20
04
19
80
-19
94
19
95
-20
04
12
34
56
78
91
01
11
2
Fa
cto
r en
do
wm
ents
M
ark
et s
ize
-1.5
7E
-01
-2.8
2E
-01
3.7
2E
-01
1.9
2E
-02
-3.1
9E
-02
-2.0
8E
-01
1.7
4E
-01
-2.8
5E
-02
3.3
3E
-01
1.9
8E
-01
2.7
0E
-01
1.2
4E
-01
[0.9
5]
[1.2
2]
[1.1
6]
[0.3
0]
[0.3
7]
[1.3
2]
[2.1
5]*
*[0
.24
][2
.16
]**
[3.5
1]*
**
[3.3
6]*
**
[1.0
7]
H
um
an c
apit
al1
.33
E-0
36
.18
E-0
31
.91
E-0
31
.31
E-0
21
.83
E-0
21
.52
E-0
31
.41
E-0
22
.58
E-0
28
.02
E-0
39
.77
E-0
38
.60
E-0
38
.72
E-0
3
[0.2
2]
[0.6
8]
[0.1
9]
[5.1
5]*
**
[5.3
7]*
**
[0.3
6]
[4.3
6]*
**
[5.2
5]*
**
[1.5
9]
[4.4
7]*
**
[2.6
4]*
**
[2.5
4]*
*
Inst
itu
tio
ns
B
ure
aucr
atic
qual
ity
-1.4
5E
-01
-1.6
5E
-01
2.9
4E
-02
2.1
6E
-01
2.5
9E
-01
5.1
6E
-02
-2.4
5E
-02
9.2
8E
-02
3.3
0E
-02
-5.6
8E
-03
1.3
6E
-02
-4.0
6E
-02
[1.3
7]
[1.2
1]
[0.1
5]
[4.9
8]*
**
[4.7
3]*
**
[0.5
7]
[0.4
4]
[1.2
0]
[0.3
3]
[0.1
5]
[0.2
6]
[0.5
9]
C
orr
up
tion
-1.2
7E
-01
-3.1
8E
-02
-4.5
3E
-01
-1.3
1E
-01
-1.6
4E
-01
-3.0
6E
-02
5.1
7E
-02
-2.2
8E
-02
-1.3
5E
-01
-8.7
8E
-02
-7.1
2E
-02
-2.5
1E
-01
[1.2
7]
[0.2
3]
[2.3
6]*
*[3
.02
]***
[2.9
2]*
**
[0.3
6]
[0.9
8]
[0.2
9]
[1.4
2]
[2.3
4]*
*[1
.29
][3
.77
]***
P
oli
tica
l ri
sk2
.92
E-0
21
.88
E-0
25
.75
E-0
21
.79
E-0
22
.10
E-0
21
.33
E-0
21
.18
E-0
21
.40
E-0
21
.82
E-0
22
.37
E-0
22
.72
E-0
22
.80
E-0
2
[3.3
2]*
**
[1.5
3]
[3.7
0]*
**
[4.8
1]*
**
[4.1
4]*
**
[2.0
6]*
*[2
.62
]***
[2.0
3]*
*[2
.60
]***
[7.1
4]*
**
[5.4
4]*
**
[5.6
0]*
**
E
xch
ange
rate
sta
bil
ity
-3.0
6E
-01
-3.7
6E
-01
5.6
0E
-02
-4.0
4E
-01
-3.4
9E
-01
-3.3
1E
-01
-2.2
5E
-01
-2.0
6E
-01
-2.3
8E
-01
-1.6
8E
-01
-1.9
3E
-01
-8.2
0E
-02
[2.6
7]*
**
[2.4
6]*
*[0
.21
][8
.10
]***
[5.1
1]*
**
[2.8
6]*
**
[3.6
0]*
**
[2.3
8]*
*[1
.80
]*[3
.79
]***
[3.1
7]*
**
[0.8
4]
Co
st f
act
ors
T
ax-2
.08
E-0
35
.77
E-0
3-3
.14
E-0
2-1
.06
E-0
2-1
.47
E-0
2-3
.51
E-0
3-1
.92
E-0
2-5
.28
E-0
3-3
.56
E-0
2-1
.52
E-0
2-2
.06
E-0
2-9
.69
E-0
3
[0.1
8]
[0.3
6]
[1.5
1]
[2.3
0]*
*[2
.44
]**
[0.3
8]
[3.2
6]*
**
[0.5
9]
[3.7
8]*
**
[3.8
0]*
**
[3.6
6]*
**
[1.4
1]
R
eal
exch
ange
rate
-8.6
8E
-02
-5.2
6E
-02
-7.7
4E
-02
-1.4
0E
-02
-5.1
0E
-03
-2.7
7E
-02
-6.7
8E
-02
-6.1
5E
-02
-5.5
9E
-02
-2.7
6E
-02
-1.8
4E
-02
-1.6
8E
-02
[3.3
8]*
**
[1.4
1]
[1.8
9]*
[1.3
2]
[0.3
5]
[1.5
0]
[5.0
4]*
**
[3.0
6]*
**
[2.6
9]*
**
[3.0
0]*
**
[1.3
5]
[1.1
8]
Tra
de
-1.2
1E
-02
-1.2
8E
-02
-7.7
0E
-03
-8.9
4E
-03
-7.9
3E
-03
-1.0
4E
-02
-9.2
3E
-03
-1.1
9E
-02
-6.2
8E
-03
-9.0
8E
-03
-7.3
8E
-03
-7.4
6E
-03
[3.6
6]*
**
[2.6
3]*
**
[1.3
5]
[6.5
3]*
**
[3.9
9]*
**
[4.2
1]*
**
[5.5
9]*
**
[4.5
9]*
**
[2.3
2]*
*[7
.40
]***
[4.0
2]*
**
[3.7
1]*
**
Ag
glo
mer
ati
on
F
DI
stock
(-1
)1
.48
E-0
12
.84
E-0
1-5
.03
E-0
14
.62
E-0
27
.74
E-0
22
.90
E-0
18
.23
E-0
31
.53
E-0
1-1
.55
E-0
1-3
.20
E-0
2-9
.42
E-0
25
.94
E-0
2
[1.2
3]
[1.8
7]*
[1.7
2]*
[1.0
2]
[1.4
6]
[2.1
6]*
*[0
.13
][1
.91
]*[1
.07
][0
.77
][1
.81
]*[0
.59
]
D
om
esti
c in
ves
tmen
t2
.07
E-0
23
.72
E-0
2-1
.34
E-0
21
.70
E-0
35
.32
E-0
46
.03
E-0
32
.09
E-0
22
.84
E-0
21
.37
E-0
21
.37
E-0
21
.79
E-0
26
.21
E-0
3
[1.3
7]
[1.8
4]*
[0.5
2]
[0.2
7]
[0.0
7]
[0.5
1]
[2.6
6]*
**
[2.5
7]*
*[1
.02
][2
.42
]**
[2.2
4]*
*[0
.65
]
P
op
ula
tion d
ensi
ty3
.95
E-0
45
.71
E-0
4-2
.01
E-0
4-1
.57
E-0
3-2
.06
E-0
3-4
.00
E-0
41
.10
E-0
41
.01
E-0
3-6
.98
E-0
41
.13
E-0
38
.71
E-0
51
.43
E-0
3
[0.4
6]
[0.4
5]
[0.1
6]
[3.0
9]*
**
[3.0
4]*
**
[0.6
2]
[0.2
4]
[1.3
5]
[1.1
7]
[3.9
8]*
**
[0.1
9]
[3.8
6]*
**
Reg
ional
and
inco
me
dum
mie
sY
ES
YE
SY
ES
YE
SY
ES
YE
SY
ES
YE
SY
ES
YE
SY
ES
YE
S
Num
ber
of
Ob
serv
atio
ns
79
65
44
64
35
01
44
83
02
81
42
16
68
82
78
24
14
56
81
32
56
59
01
93
18
35
27
18
4
Const
ruct
ion
Whole
sale
and
Ret
ail
Tra
de
Tra
nsp
ort
atio
n a
nd
Com
munic
atio
nF
inan
ce a
nd
Busi
nes
s S
ervic
es
Tab
le 9
: D
eter
min
ants
of
FD
I in
Ind
ivid
ual
Sec
tors
(N
ontr
adab
les)
Note
: A
bso
lute
val
ue
of
z st
atis
tics
in b
rack
ets.
* s
ignif
ican
t at
10
%;
** s
ignif
ican
t at
5%
; *** s
ignif
ican
t at
1%
. M
ark
et s
ize
is m
easu
red
as
real
GD
P, m
easu
red
in 2
00
0 U
S$
. H
um
an c
apit
al i
s th
e av
erag
e yea
rs o
f se
cond
ary
schooli
ng i
n t
ota
l p
op
ula
tion. B
ure
aucr
atic
qual
ity, co
rrup
tion a
nd
poli
tica
l ri
sk m
easu
res
are
from
the
ICR
G i
nd
icat
ors
. E
xch
ange
rate
sta
bil
ity i
s th
e an
nual
per
centa
ge
chan
ge
in t
he
exch
ange
rate
of
the
nat
ional
curr
ency
agai
nst
the
US
doll
ar. T
he
tax m
easu
re r
efle
cts
the
hig
hes
t co
rpora
te s
tatu
tory
tax
rat
e. T
he
real
exch
ange
rate
is
mea
sure
d a
s th
e d
om
esti
c cu
rren
cy p
er U
S$
. T
rad
e is
the
rati
o o
f th
e su
m o
f ex
port
s an
d i
mp
ort
s to
GD
P.
Dom
esti
c in
ves
tmen
t is
mea
sure
d a
s th
e gro
ss f
ixed
cap
ital
form
atio
n a
s a
shar
e of
GD
P. F
DI
stock
(-1
) is
the
lag v
alue
of
net
sto
ck o
f F
DI
in U
S$
. P
op
ula
tion d
ensi
ty i
s th
e num
ber
of
peo
ple
per
sq
uar
e k
ilom
eter
. A
lthough
the
tenth
sp
ecif
icat
ion v
iola
tes
the
IIA
ass
um
pti
on, w
e k
eep
it
for
the
sak
e of
cross
sec
tora
l co
mp
aris
on.
39
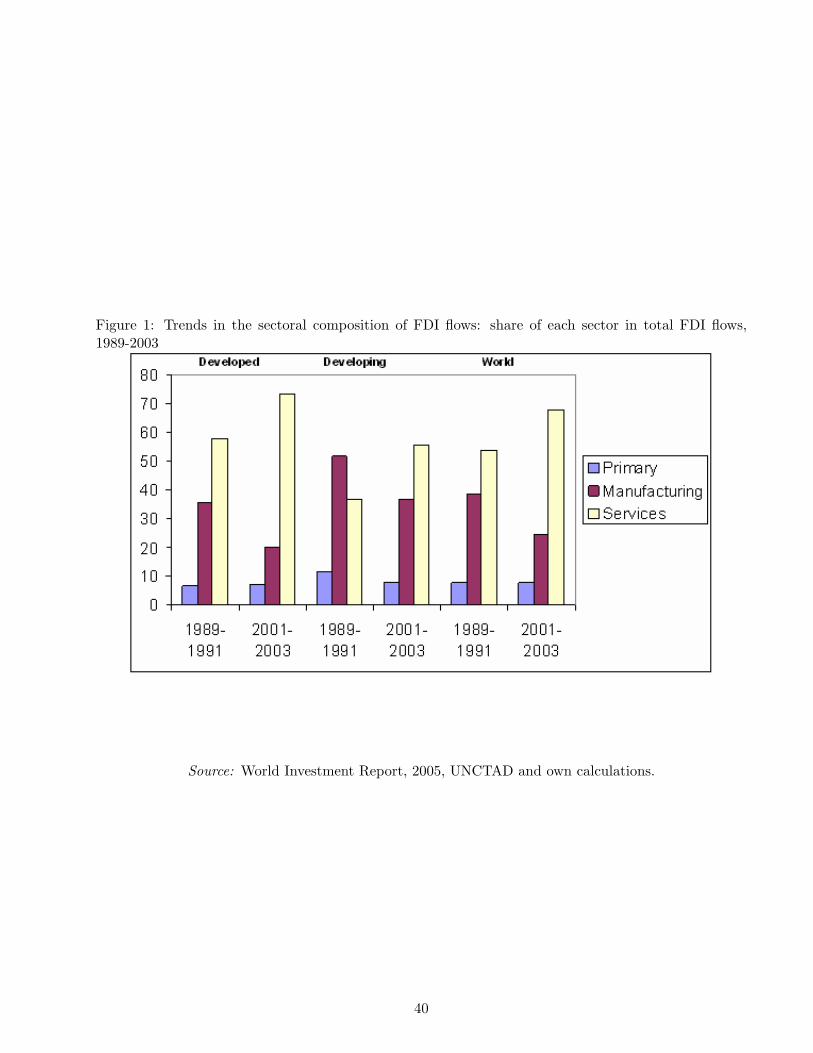
Figure 1: Trends in the sectoral composition of FDI flows: share of each sector in total FDI flows,1989-2003
Source: World Investment Report, 2005, UNCTAD and own calculations.
40
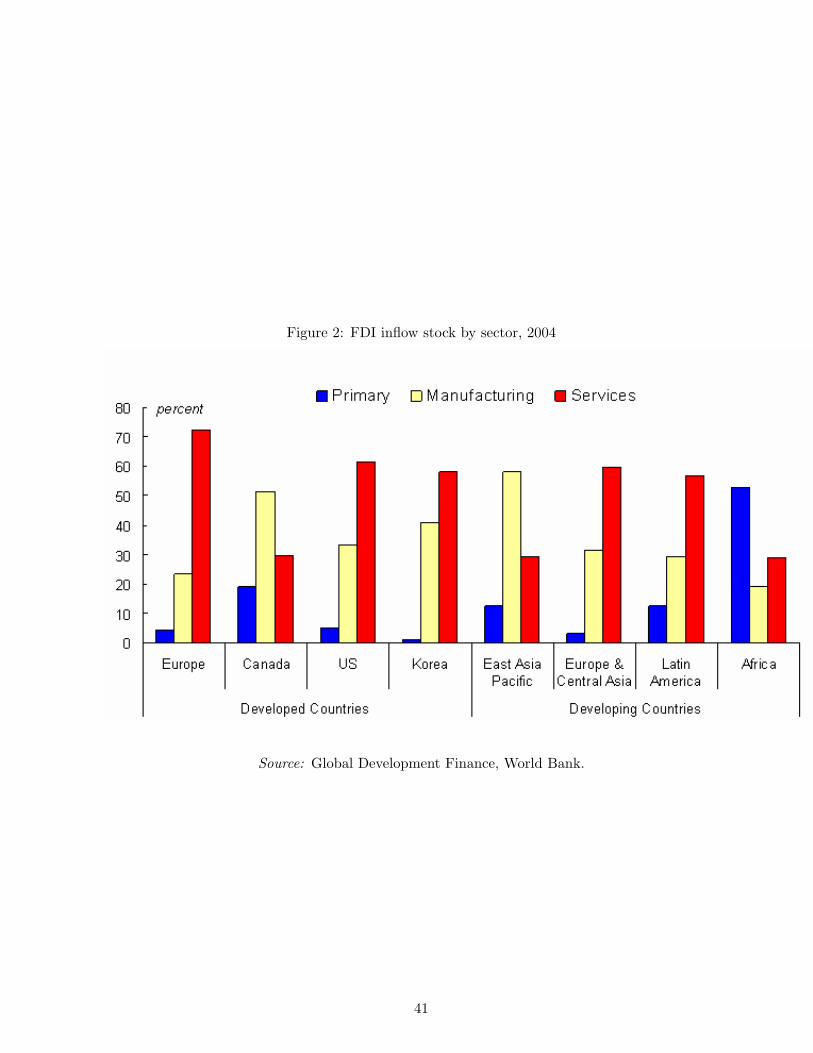
Figure 2: FDI inflow stock by sector, 2004
Source: Global Development Finance, World Bank.
41
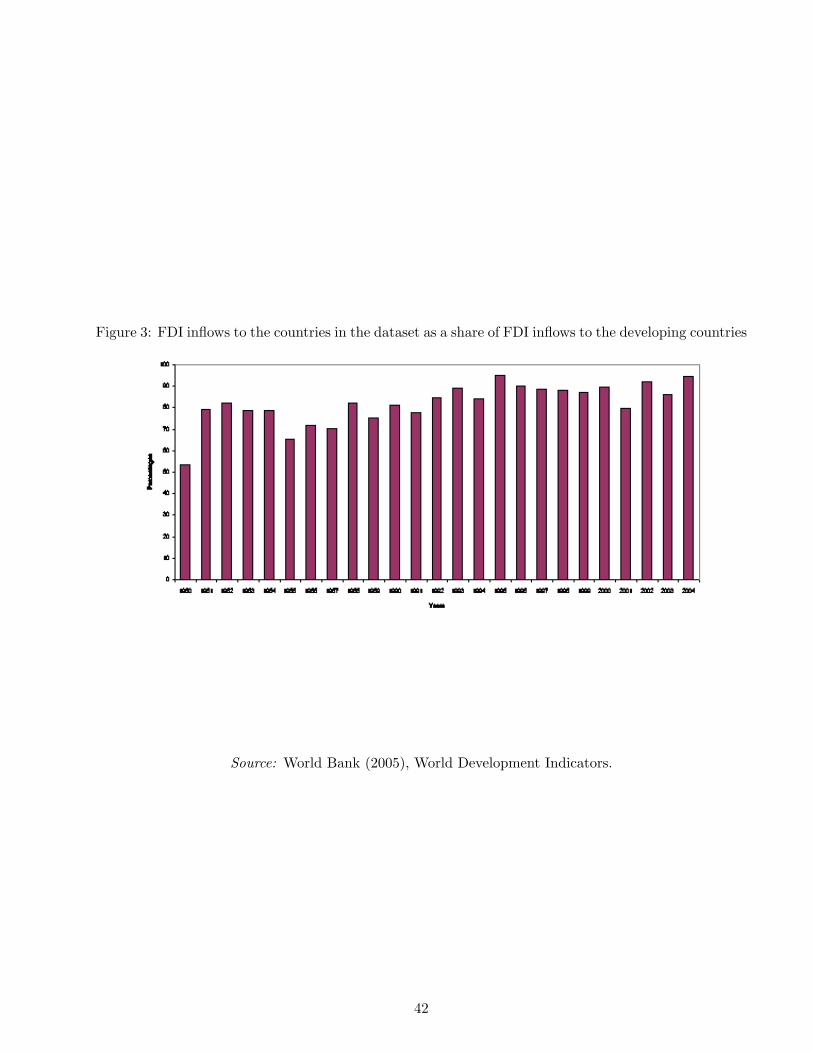
Figure 3: FDI inflows to the countries in the dataset as a share of FDI inflows to the developing countries
Source: World Bank (2005), World Development Indicators.
42
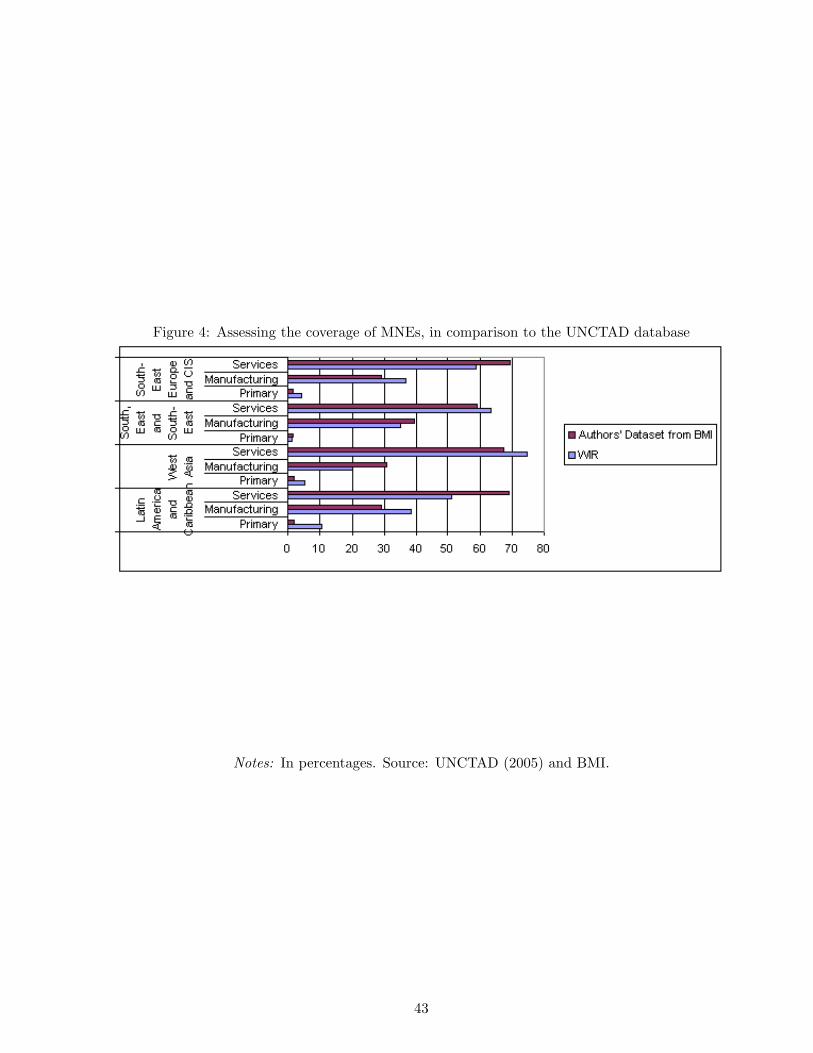
Figure 4: Assessing the coverage of MNEs, in comparison to the UNCTAD database
Notes: In percentages. Source: UNCTAD (2005) and BMI.
43
Appendix: Data Sources and Descriptions
• Human capital (HK): average years of secondary schooling in total population. Source: Barro and
Lee (1996), updated version downloadable from: http://www.cid.harvard.edu/ciddata/ciddata.html
• FDI: sum of equity capital, reinvestment of earnings, other long-term capital, and short-term
capital as shown in the balance of payments. Source: World Development Indicators (WDI).
• FDI per GDP: net inflows of FDI as a share of GDP. Source: World Development Indicators
(WDI).
• Structural, Political and Economic Indices: data is drawn from two risk methodologies: ”Political
Risk Services” and the ”International Country Risk Guide”. The included indices are bureaucracy
quality (BCI), composite risk rating (CRI), corruption (CI), democratic accountability (DAI),
economic risk rating (ERI), exchange rate stability (ERSI), external conflict (ECI), financial risk
rating (FRI), government stability (GSI), internal conflict (ICI), international liquidity (ILI),
investment profile (IPI), law & order (LOI), military in politics (MPI), political risk rating (PRI),
risk points for budget balance (RBBI), risk points for current account as % of GDP (RCAGI), risk
points for current account as % of export of goods (RCAEI), risk points for debt service (RDI),
risk points or exchange rate stability (RERSI), risk points for foreign debt (RFDI), risk points for
GDP growth (RGGI), risk points for GDP per head of population (RGPI), risk points for inflation
(RII), risk points for international liquidity (RILI), socioeconomic conditions (SCI). Three indices
were constructed using principal component analysis (PCA). These are indices for international
liquidity, exchange rate stability and overall risk of the country. The following table shows the
PCA results. Source: International Country Risk Guide (ICRG).
• Exchange rate stability: Annual percentage change in the exchange rate of the national currency
against the US dollar (against the euro in the case of the USA). Source: International Country
Risk Guide (ICRG).
• Real GDP: the sum of gross value added by all resident producers in the economy plus any
44
product taxes and minus any subsidies not included in the value of the products. Source: World
Development Indicators (WDI).
• Gross Fixed Capital Formation (GFCF): includes land improvements (fences, ditches, drains, and
so on); plant, machinery, and equipment purchases; and the construction of roads, railways, and
the like, including schools, offices, hospitals, private residential dwellings, and commercial and
industrial buildings. According to the 1993 SNA, net acquisitions of valuables are also considered
capital formation. Source: World Development Indicators (WDI).
• Corporate Tax (tax): the highest corporate statutory tax rate. Source: Tax Database of Michigan
Ross School of Business.
45