Embed Size (px)
Citation preview

THE IMPACT OF URBAN STORM WATER RUNOFF AND DOMESTIC WASTE
EFFLUENT ON WATER QUALITY OF LAKE TANA AND LOCAL
GROUNDWATER NEAR THE CITY OF BAHIR DAR, ETHIOPIA
A Thesis
Presented to the Faculty of the Graduate School
of Cornell University
in Partial Fulfillment of the Requirements for the Degree of
Master of Professional Studies
by
Tenagne Addisu Wondie
May 2009

© 2009 Tenagne Addisu Wondie
ABSTRACT
In urban areas, the main task of town planners and engineers is providing drainage
structures to prevent flooding. Recently the effect of these drainage structures on water
quality has become a concern. However, little is known about the magnitude of the
pollution. There fore the objective of this study is to characterize pollution loads from
one Ethiopian urban area, Bahir Dar, on the southern end of Lake Tana which is
experiencing dramatic expansion. In particular this research measured the quantity and
quality of storm runoff and ground water. To determine the pollutant concentration
and its effect on the quality of ground water, three shallow wells were installed. Urban
storm water runoffs at six storm drains, which empty to Lake Tana, were instrumented
for discharge and water quality measurements. The quality parameters considered
were the total coliform, dissolved oxygen, total solids (TS), total suspended solids
(TSS), biological and chemical oxygen demand (BOD/COD), total nitrogen (TN),
total phosphorus (TP), pH, and conductivity. Three-rainfall event samples were taken
in each month during rainy season (July, August, September and October) for a total
of 9 rainfall events. Magnitude of pollutant load concentration flowing in to Lake
Tana during low and high storm flow and contributions to groundwater were
determined. In addition low flow characteristics (base flow) was determined once in a
month. The results indicate that the water quality parameters like total nitrogen; total
phosphorus and total suspended solids are found to be high with an average
concentration load of 22.8mg/l, 0.46mg/l and 365mg/l respectively. The average
concentration for dissolved solid, electric conductivity, dissolved oxygen COD, and
total coliform are178mg/l, 338µ/cm, 2.8mg/l, and 3.28mg/l and169coli/100ml
respectively. From the six sub watersheds assessed in this study, the sub watershed
that drains the hotel discharge (station-5) had the elevated concentration for all

pollutant except dissolved oxygen. All runoff concentration means found in this study
area except the mean recorded for chemical oxygen demand, are higher than the
means found in the data base for North American cities (CDM and NURP) and it
shows that the Bahir Dar storm water runoff pollutant load is in excess of the North
American cities.

iii
BIOGRAPHICAL SKETCH
Tenagne Addisu Wondie was born in Gojjam, Ethiopia to his mother, Asinakech
Yalew Gebiru, and father, Addisu Wondie Tesemma, in 1970.
He received an Advanced Diploma in Irrigation Engineering & Drainage from
Arbaminch Water Technology Institute in 1990 and his first degree in Hydraulics
Engineering from Arbaminch University in 2005. He has been working as a water
engineer for the last 17 years in Amhara Region, Ethiopia and carried out many water
development projects in the rural part of the country.
Tenagne is very keen for new ideas, especially problem solving and researchable
issues, and he believes that every success is a reflection of hard work.

iv
ACKNOWLEDGEMENT
First of all I would like to express my deep and sincere gratitude to Professor Tammo
Steenhuis for giving me the opportunity of carrying out this research project. His
certainty to provide the necessary information and read the whole paper at all stages
and giving his sincere guidance, comments and suggestions to bring this study to this
form at the expense of his invaluable time enriched my professional performance a lot.
To put it in a nut shell, this thesis paper would not have been completed like this
without his mentioned contribution. Thanks for trusting on me.
I further take this opportunity to express my deep feeling and gratitude to Dr. Amy S.
Colik for her support throughout the period that I spent in Cornell/BDU master
program. Thanks for your help on getting this study into this shape; you have a great
part on it.
I am very grateful to Amhara Region Water Resource Development Bureau, Bahir Dar
Town Water Supply and Sewerage Service Office and Bahir Dar University for
providing me their water quality laboratory to carry out the required laboratory
analysis work. Many thanks to all my friends, they have enriched my life with new,
different, good and bad experiences, all part of life, which made my stay in BDU.
Last but certainly not the least, my very special, warm and deep thanks to my family
for offering me their perpetual love, support, and encouragement throughout my life
and mainly during the last 2 years. To my wife Asmeret thanks for your commitment
and patience. To my children, Betty, Tigist and Eueal, thanks for bring us happiness
and innocence.
v
TABLE OF CONTENTS
BIOGRAPHICAL SKETCH ......................................................................................... iii
ACKNOWLEDGEMENT ............................................................................................. iv
TABLE OF CONTENTS ............................................................................................... v
LIST OF FIGURES ...................................................................................................... vii
LIST OF TABLES ...................................................................................................... viii
1. INTRODUCTION .................................................................................................. 1
1.1 Background ..................................................................................................... 1
1.2 Objectives of the research .............................................................................. 3
2. LITERATURE REVIEW ....................................................................................... 4
2.1 General concept .............................................................................................. 4
2.2 Constituents of Urban Storm water runoff ..................................................... 5
2.2.1 Conventional Water quality Parameter /constituents/ ............................ 5
2.2.2 Aggregates .............................................................................................. 7
2.2.3 Nutrients ............................................................................................... 10
2.2.4 Biochemical Oxygen Demand/ Chemical oxygen Demand ................. 11
2.3 Urban runoff and Best management practices (BMPs) ............................... 12
3. METHODS ........................................................................................................... 14
3.1 Study Area and climate ................................................................................. 14
3.2 Study methodology and approach ................................................................ 15
3.2.1 Data Availability .................................................................................. 15
3.2.2 Area characterization and Site Selection .............................................. 16
3.2.3 Runoff Quantity Measurement ............................................................. 18
3.2.4 Runoff Water Quality Sampling and Analysis ..................................... 19
4. RESULT ............................................................................................................... 22
vi
4.1 Statistical comparison between sampling station results ............................. 26
5. DISCUSSIONS .................................................................................................... 28
5.1 Statistical comparison of water quality parameters between sampling
stations ...................................................................................................................... 28
6. CONCLUSION, MANAGEMENT IMPLICATION AND
RECOMMENDATIONS ............................................................................................. 33
6.1 Conclusion .................................................................................................... 33
6.2 Management implication and recommendations .......................................... 34
7. REFERENCES ..................................................................................................... 36
8. APPENDIXES: ..................................................................................................... 38
8.1 Appendix A: Laboratory Analytical Results ................................................ 38
8.2 Appendix B: Statistical summary .................................................................. 41
8.3 Appendix C: Data of Environmental Features ............................................. 48
8.3.1 I Rain fall .............................................................................................. 48
vii
LIST OF FIGURES
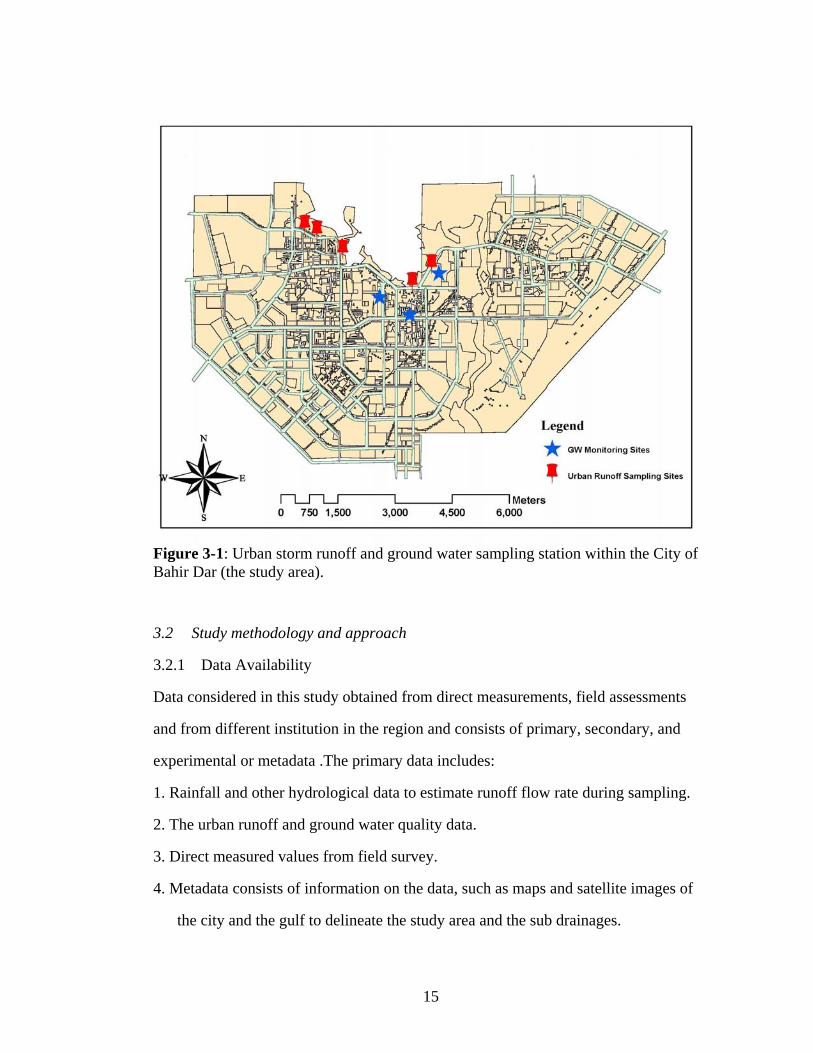
Figure 3-1: Urban storm runoff and ground water sampling station within the City of
Bahir Dar (the study area). ........................................................................................... 15
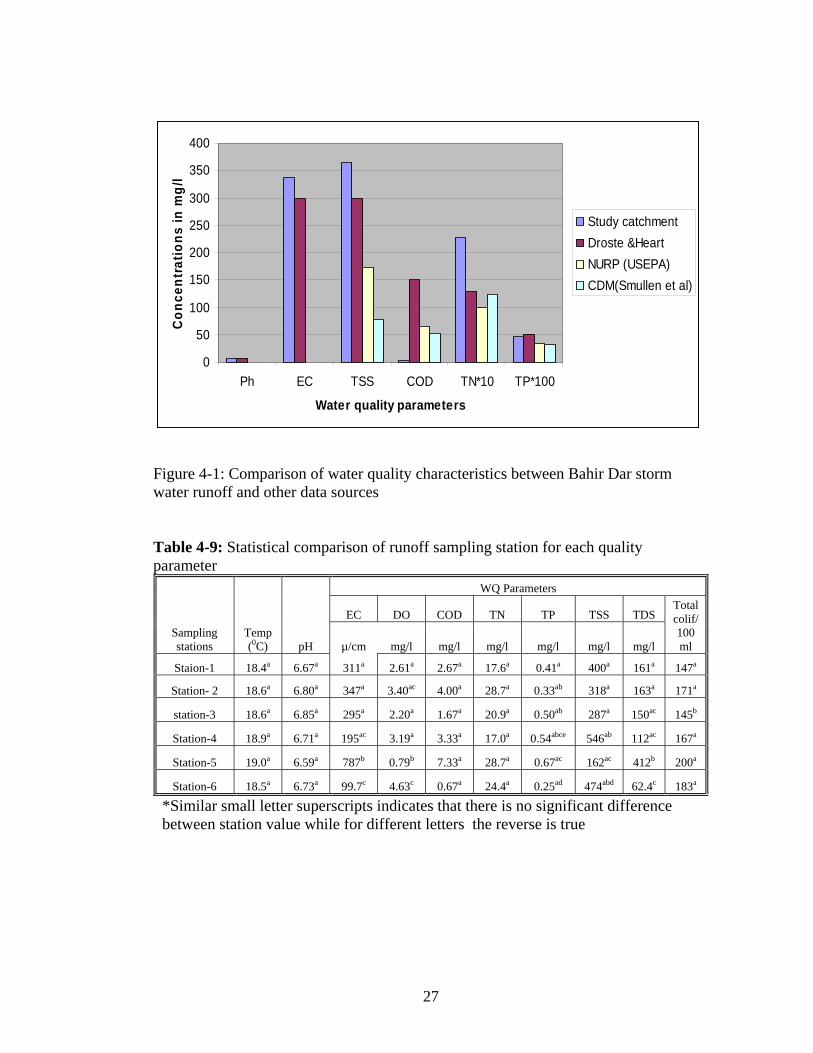
Figure 4-1: Comparison of water quality characteristics between Bahir Dar storm
water runoff and other data sources .............................................................................. 27
viii
LIST OF TABLES
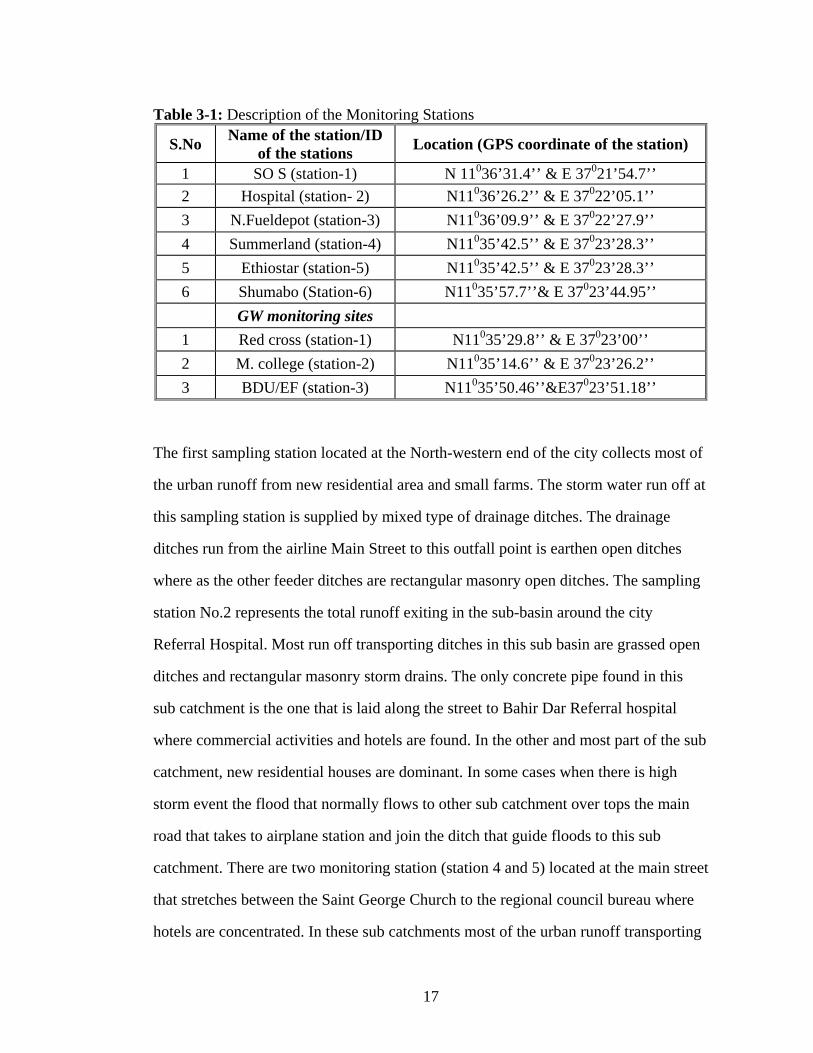
Table 3-1: Description of the Monitoring Stations ....................................................... 17
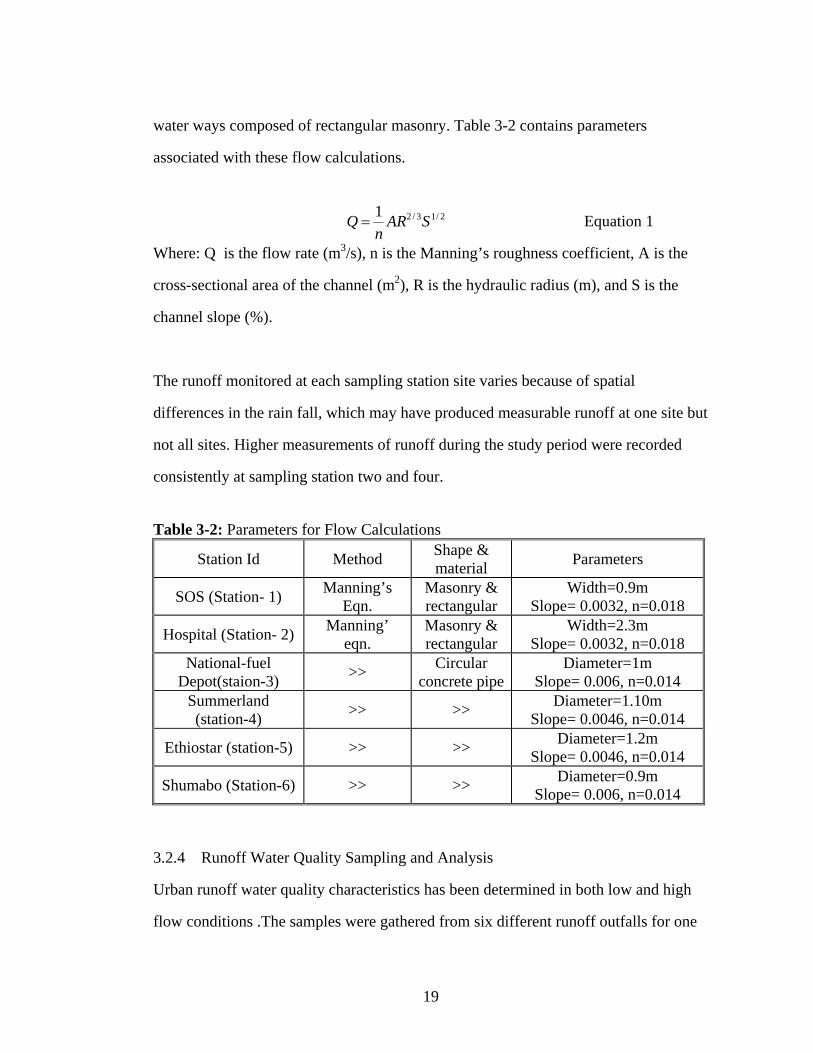
Table 3-2: Parameters for Flow Calculations ............................................................... 19
Table 4-1: Water quality data and average concentration load collected in July, 200822
Table 4-2: Water quality data & average concentration load collected in August, 2008
...................................................................................................................................... 22
Table 4-3: Water quality data and average concentration load collected in September -
October, 2008 ............................................................................................................... 23
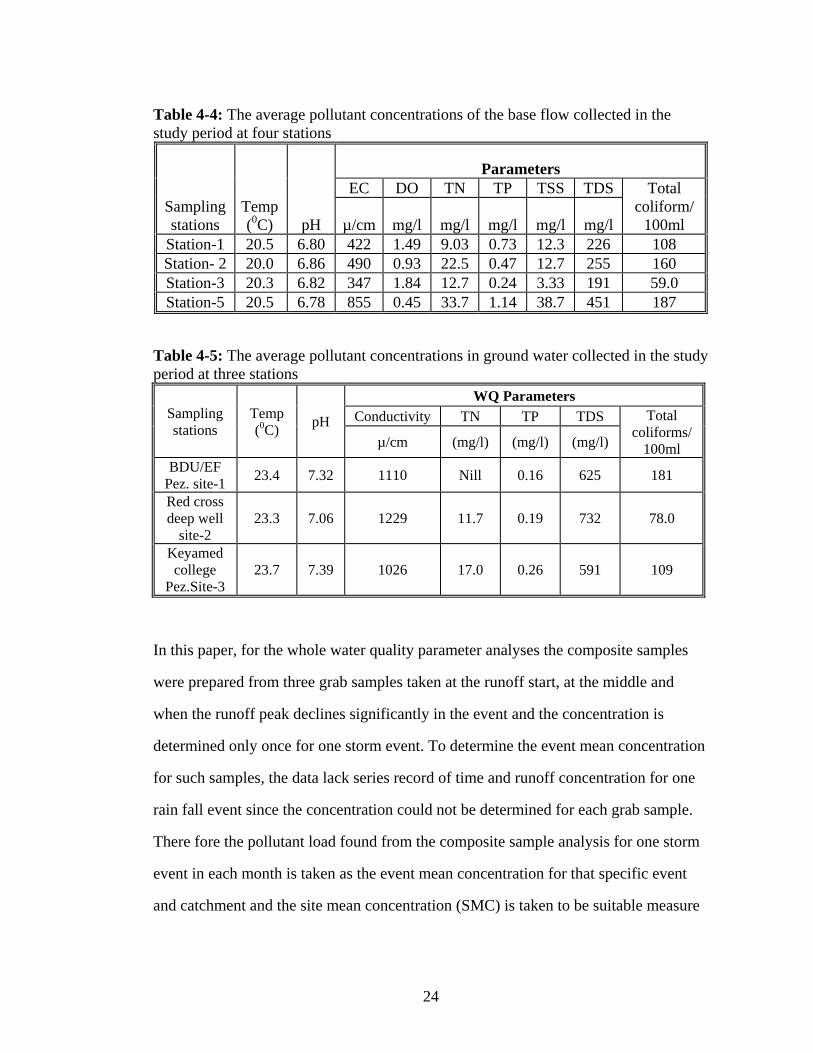
Table 4-4: The average pollutant concentrations of the base flow collected in the study
period at four stations ................................................................................................... 24
Table 4-5: The average pollutant concentrations in ground water collected in the study
period at three stations .................................................................................................. 24
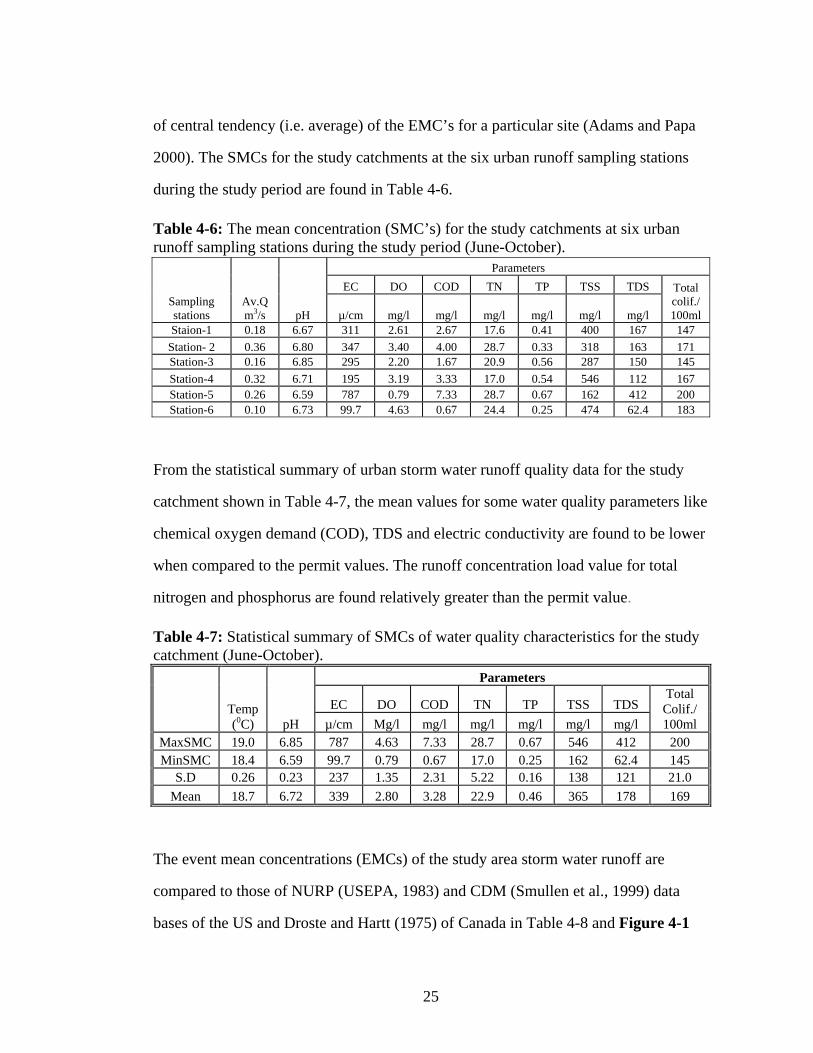
Table 4-6: The mean concentration (SMC’s) for the study catchments at six urban
runoff sampling stations during the study period (June-October). ............................... 25
Table 4-7: Statistical summary of SMCs of water quality characteristics for the study
catchment (June-October). ........................................................................................... 25
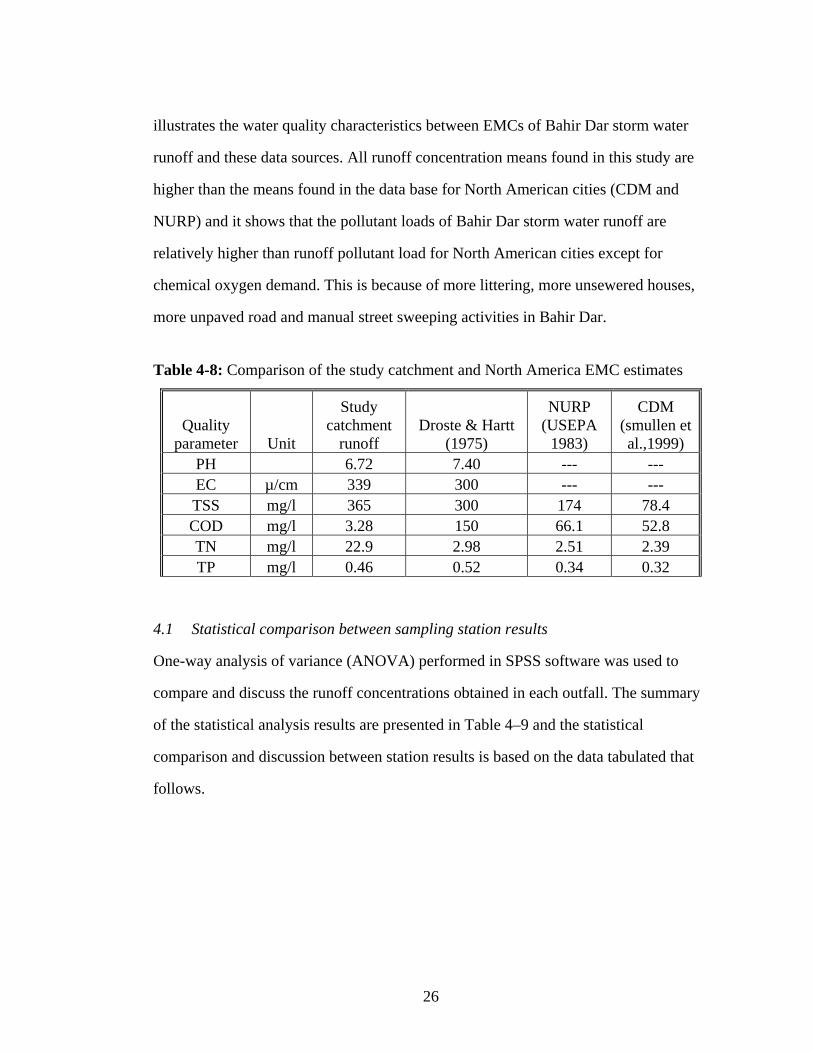
Table 4-8: Comparison of the study catchment and North America EMC estimates .. 26
Table 4-9: Statistical comparison of runoff sampling station for each quality parameter
...................................................................................................................................... 27
1
CHAPTER ONE
1. INTRODUCTION
1.1 Background
The city of Bahir Dar in Amhara region of Ethiopia is the study area. Lake Tana is the
water body receiving most of the urban runoff and sanitary effluents drained from this
city. The city of Bahir Dar is situated on the southern shore of Lake Tana at latitude of
11035’N and longitude of 37023’E. It is a rapidly expanding city and has no particular
parts where commercial or other activities are concentrated. Shops and residences are
generally present in all sectors. There are no major industries in the contributing areas;
the textile factory and two tanneries are located outside the watershed that contributes
to the urban storm water and sanitary sewer joining the lake. In 2005, the city of Bahir
Dar had approximately 250,000 inhabitants. According to the Ethiopian Meteorology
Agency the annual mean precipitation for Bahir Dar is 900 mm. The urban storm
runoff and domestic waste effluent receiving water body, Lake Tana, with surface area
of 3150 km2 is the largest fresh water body in the country and the source of Blue Nile
(Eshetie Dejen, 2003).
In the last few years, the lake has undergone large changes in chemistry and biology as
a result of growing human interferences. Currently the lake ecosystem is in danger due
various factors like deforestation, erosion, sedimentation in the catchment, water level
reduction, erratic rain fall, pressure of growing population and the connected impact of
urban storm runoff and other unmanaged domestic wastes.
The degradation of Lake Tana water quality caused by urban storm runoff is a serious
problem and affecting the ecosystem of the lake and significant portion of the
2
community living around the gulf principally Bahir Dar city residents. In the study
area, human activities are directly and indirectly generating a drastic change in the
ecosystem of the lake. For instance the dramatic expansion of the city has resulted in
increase of the area that does not have the capacity to store and infiltrate water
(impervious surface). The transformations of these natural land surfaces in to
impervious surfaces (like streets, parking lots, foot path and other pavements etc) are
radically decreasing the rate of infiltration and thereby increasing surface runoff
volume from precipitation. This change in land use increases impervious cover lead to
flooding, erosion, habitat degradation, and water quality impairment. Researches have
identified storm water runoff as a major contributor to water quality degradation in
urbanizing water shed (Field & Pitt, 1990). Every day activities such as excavation at
construction site, driving, maintaining vehicles, disposing of wastes, collecting wastes
in failed septic systems and sewer structures contribute substantial amount of
contaminant to runoff. Sediment that comes from active construction sites and wash-
off of particulate materials from impervious surface is one of the most common and
potentially damaging pollutants found in urban runoff (Earl Shaver, Richard Horner,
Joseph Skupien, Chris May, Graeme Ridiey, 2007). Generally discharge of large storm
event may shock the receiving water body many times greater than the small but
steady sanitary effluent (Loehr, 1974; Bedient et al., 1978; WEF and ASCE, 1998: Lee
and Bang, 2000).
Another factor for the degradation of water quality assessed in this urban catchment is
seepage of liquid wastes from septic tanks and its impact on ground water quality.
Most of the domestic waste collecting tanks in Bahir Dar are constructed using dry
masonry without any lining materials that can leak all the liquid waste to the ground
and can be a cause for nitrate pollution of ground water or over flow to open ditches

3
when the ground water rises to the surface during the rainy season. The mass
movements of these wastes together with urban storm water runoff to the lake may
cause significant change in the ecosystem and water quality of the lake.
All these stresses on the lake and ground water will have serious and irreversible
effect on the ecosystem and water quality in the future. To remedy this situation, this
study proposes critical pollution source assessment of the lake of an urban area.
1.2 Objectives of the research
The general objective of this research is to assess the non-point pollution source and
characterizing the water quality of urban runoff at both high and low flow condition.
Our specific objectives are:
1. To assess the magnitude of the pollutant load in urban runoff imposed by Bahir
Dar city on Lake Tana
2. To asses the magnitude of ground water pollution
3. To provide recommendations for improving urban storm water runoff disposal
practices and develop effective methods for mitigation of storm and domestic
waste water pollution on Lake Tana ecosystem
4
CHAPTER TWO
2. LITERATURE REVIEW
2.1 General concept
Urban runoff is not simply clean rain that falls on the urban landscape and
subsequently flows away. Rain falling upon a catchment collects pollutants from the
air, road way surfaces, other catchment surfaces, and storm drains, and is thereafter
transformed into a type of municipal wastewater (Chambers et al. 1997; Adams and
Papa 2000). The most recent Water Quality Inventory reports that runoff from
urbanized areas is the leading source of water quality impairments to surveyed
estuaries and the third-largest source of impairments to surveyed lakes EPA (February,
2003). Increasing urbanization has led to significant changes in the natural systems of
the receiving water bodies. These changes include alterations in the hydrologic flow
regime as well as shifts in the chemical and biological makeup of storm water runoff
from these developing areas. As an area is developed, the natural ability of the
catchments to withstand natural hydrologic variability is removed. Infiltration capacity
is decreased due to the increase in impervious surface and disrupted native soils and
vegetation. Anthropogenic activity also introduces chemical and biological
constituents to the catchment. Trace metals, suspended solids, nutrients, pesticides,
petroleum products, and E. coli and fecal coliform bacteria are generally found in
higher concentrations in urbanized and urbanizing areas than in natural systems, due to
increased numbers of people, vehicles, roads, and building materials introduced into
the landscape. These constituents that storm water runoff carries is found to be a major
source of pollution to surface water quality and groundwater resources
5
2.2 Constituents of Urban Storm water runoff
2.2.1 Conventional Water quality Parameter /constituents/
pH: pH is the measure of the acidity or alkalinity of the water on a scale from 1 –14
(1 is very acidic, 7 neutral and 14 very alkaline). The pH of water affects the solubility
of many toxic and nutritive chemicals; therefore, the availability of these substances to
aquatic organisms is affected. As acidity increases, most metals become more water
soluble and more toxic. Toxicity of cyanides and sulfides also increases with a
decrease in pH (increase in acidity). Ammonia, however, becomes more toxic with
only a slight increase in pH (Environment Canterbury; Resource care guide -2005).
Runoff, sewage, geology (limestone is associated with more alkaline conditions); high
nutrient levels are some of the causes to acidity or alkalinity. High nutrient levels
cause excessive growth of algae and plants that will lift pH values. Outside what is
considered the normal pH range there may be a loss of sensitive species. If extremely
high or extremely low pH values occur, it would result in the death of all aquatic life.
Alkaline conditions can also increase the toxicity of other pollutants such as ammonia.
The safe aquatic habitat range is between 6.5 and 8.5.
Electric conductivity: The electric conductivity is the ability of a substance to conduct
electricity. The conductivity of water is a more-or-less linear function of the
concentration of dissolved ions. Conductivity itself is not a human or aquatic health
concern, but because it is easily measured, it can serve as an indicator of other water
quality problems (It is used to give an indication of the amount of inorganic materials
in the water including, calcium, bicarbonate, nitrogen, phosphorus, iron, sulfur and
others). If the conductivity of a stream suddenly increases, it indicates that there is a
source of dissolved ions in the vicinity. Therefore, conductivity measurements can be
6
used as a quick way to locate potential water quality problems. Conductivity is
measured in terms of conductivity per unit length, and meters or micro siemens/cm.
Storm water runoff, sewage effluent, catchment geology and agricultural effluent
running into streams have a significant influence on the conductivity of stream water
• Good for drinking by people and livestock 0-800ms/cm
• Drinkable but with salty taste. Some plants will not tolerate over
1500ms/cm (grapes/peas/apricots) 800 – 2,500
• Unsuitable for people, most livestock and crops 2,500 – 10,000
Temperature: Many of the physical and biological characteristics of waterways are
directly affected by temperature. Temperature is highly dependent on the depth of the
water, season, time of the day, cloudiness of the sky and the air temperature.
Discharges can also affect temperature e.g. cooling water. Changes in temperature
alter dissolved oxygen. (Higher temperatures mean the water holds less dissolved
oxygen). The distribution and number of aquatic species also changes as temperature
varies. A short period of high temperatures each year can make the water body
unsuitable for sensitive species even though during the rest of the year the temperature
is acceptable.
Optimal temperature range for trout 13-15°C
Critical temperature which if exceed will harm or kill fish 23°C
Total coliform: Total coliform include species that may inhabit the intestines of
warm-blooded animals or occur naturally in soil, vegetation, and water. They are
usually found in water polluted with fecal matter and are often associated with disease
outbreaks. Although they are not usually pathogenic themselves, their presence in
drinking and recreation water indicates the possible presence of pathogens. E. coli, one
7
species of the coliform group, is always found in feces and is, therefore, a more direct
indicator of fecal contamination and the possible presence of enteric pathogens
(USEPA, Sep, 2002). Some of the recommended coliform limits based on the median
value are:
o Drinking water < 1.0 E.Coli/100ml
o Contact recreation 126 E.Coli/100ml or 200 FC/100ml
2.2.2 Aggregates
Dissolved oxygen: Fish and other aquatic animals depend on dissolved oxygen (the
oxygen present in water) to live. The amount of dissolved oxygen in streams is
dependent on the water temperature, the quantity of sediment in the stream, the
amount of oxygen taken out of the system by respiring and decaying organisms, and
the amount of oxygen put back into the system by photosynthesizing plants, stream
flow, and aeration. Dissolved oxygen is measured in milligrams per liter (mg/l) or
parts per million (ppm). The temperature of stream water influences the amount of
dissolved oxygen present; less oxygen dissolves in warm water than cold water. For
this reason, there is cause for concern for streams with warm water. Trout need DO
levels in excess of 8 mg/liter, striped bass prefer DO levels above 5 mg/l, and most
warm water fish need DO in excess of 2 mg/l.
Solids
Solids in storm water runoff are classified using various methods, with most
dependent on size. Total solids (TS) encompass all solids found in runoff, both
suspended and dissolved. Solids enter storm water runoff through erosion of natural
soils. Both the amount of total solids present and the size distribution of those solids
depend on catchment land use, the extent of construction activities, and the time since
8
initial disturbance of the catchment (Minton, 2002). Solids also enter the runoff stream
from vehicle emissions, vehicle tire, engine and brake wear, as well as through
pavement wear and atmospheric deposition (Sansalone, 1998).
Total suspended solids (TSS) and total dissolved solids (TDS) are separated by what
does and does not pass through a 0.45-µm filter (APHA, 1998). A PSD analysis
further categorizes solids into size ranges. The American Association of State
Highway and Transportation Officials (AASHTO) divide size classes for solids into
gravel, sand, silt, and clay. Solids larger than 2,000 µm are referred to as gravel,
between 75 and 2000 µm as sand, 2 and 75 µm as silt, and less than 2 µm as clay, with
all particles less than 75 µm commonly referred to as fines (Das, 1998). Particles in
storm water runoff are referred to as colloidal if they are less than 1.0 micrometer
(µm) in diameter and macro colloidal if they are between 0.45 and 20 µm in diameter
(Characklis and Wiesner, 1997). The sizes of particles in storm water runoff can
significantly affect various physical and chemical processes. Fine particles may
agglomerate, causing PSD to vary along the longitudinal path of storm water runoff
(Minton, 2002). Larger particles settle faster than smaller particles. This settling
mechanism affects the relative concentrations of different sizes of particles depending
on runoff velocity and depth of flow.
Total Dissolved solids: “Dissolved solids” refer to any minerals, salts, metals, cations
or anions dissolved in water. This includes anything present in water other than the
pure water molecule and suspended solids. (Suspended solids are any
particles/substances that are neither dissolved nor settled in the water.) In general, the
total dissolved solids concentration is the sum of the cations (Positively charged) and
anions (negatively charged) ions in the water. Parts per million (PPM) is the weight to
9
weight ratio of any ion to water. Conductivity is usually about 100 times the total
cations or anions expressed as equivalents. Total dissolved solids (TDS) in mg/l
usually range from 0.5 to 1.0 times the electrical conductivity. Some dissolved solids
come from organic sources such as leaves, silt, plankton, and industrial waste and
sewage. Other sources come from runoff from urban areas, and fertilizers and
pesticides used on lawns and farms. Dissolved solids also come from inorganic
materials such as rocks and air that may contain calcium bicarbonate, nitrogen, iron
phosphorous, sulfur, and other minerals. Many of these materials form salts, which are
compounds that contain both a metal and a nonmetal. Salts usually dissolve in water
forming ions. Ions are particles that have a positive or negative charge. Water may
also pick up metals such as lead or copper as they travel through pipes used.
Total Suspended solid: Suspended solids refer to small solid particles, which remain
in suspension in water as a colloid or due to the motion of the water. Generally the
amount of particles that suspend in a sample of water is called total suspended solids
(TSS). It is used as one indicator of water quality. It is sometimes abbreviated SS, but
is not to be confused with settle able solids also abbreviated SS, which contribute to
the blocking of sewer pipes. Suspended solids are important as pollutants and
pathogens are carried on the surface of particles. The smaller the particle size, the
greater the surface area per unit mass of particle, and so the greater the pollutant load
that is likely to be carried. To remain permanently suspended in water (or suspended
for a long period of time), particles have to be light in weight (they must have a
relatively low density or specific gravity), be relatively small in size, and/or have a
surface area that is large in relation to their weight (have a shape like a sheet of paper).
The greater the TSS in the water, the higher its turbidity and the lower its transparency
(clarity).
10
2.2.3 Nutrients
Urbanization generally leads to higher nutrient concentration in storm runoff
(Omernik, 1976). Nutrients such as phosphorous and nitrogen are essential for the
growth of algae and other plants. Aquatic life is dependent upon these photo
synthesizers, which usually occur in low levels in surface water. Excessive
concentrations of nutrients, however, can over stimulate aquatic plant and algae
growth. Bacterial respiration and organic decomposition can use up dissolved oxygen,
depriving fish and invertebrates of available oxygen in the water (eutrophication).
Phosphorus: Phosphorus occurs naturally in low concentrations and is essential for
all forms of life. It comes from processes such as weathering of rock and the
decomposition of organic matter. Phosphorus indicates nutrient status, organic
enrichment and the consequent health of the water body. Increased levels may result
from erosion, discharge of sewage or detergents, urban runoff, and rural runoff
containing fertilizers, animal and plant matter. When concentrations are too high
problems such as algal blooms, excessive weed growth and the loss of species
diversity can occur. Abundant plant growth such as algal blooms leads to increased pH
and turbidity and sometimes to the production of toxins and odor.
o Algal growth in streams may occur 0.01 – 0.1mg/L (Total Phosphorus)
o Recreational use 0.006 mg/L (Dissolved Reactive Phosphorous)
o Aquatic ecosystem balance 0.001 mg/L (Dissolved Reactive Phosphorous)
Nitrogen: Nitrogen in urban runoff/streams occurs in three forms:
• Gaseous form (Nitrogen and Ammonia)
• Inorganic form (Nitrates, nitrites and Ammonium)
• Organic form (biological material e.g. protein)
11
Natural breakdown of vegetation, run-off from lawn and crop fertilizers and effluent
can contain nitrates. Run-off from feedlots can have concentrated ammonia and
nitrates. Inadequately treated sewage, poor septic tank systems and streams fed by
nitrate rich groundwater can all increase nitrogen in waterways. Ecosystems can be
affected when nitrogen concentrations become too high. This may result in algal
blooms and an overabundance of oxygen-dependant bacteria that deplete the water of
oxygen. Nitrate in high concentrations may be harmful to stock. Excessive nitrates in
drinking water can cause methaemoglobinaemia (blue baby) in bottle-fed infants. High
concentrations of ammonia are also very toxic to aquatic animals.
o Limit for algal growth 0.1- 0.75mg/l (Total Nitrogen)
o Limit for human consumption 11.3mg/l (Nitrate-nitrogen)
2.2.4 Biochemical Oxygen Demand/ Chemical oxygen Demand
Natural organic detritus and organic waste from urban and agricultural runoff, waste
water treatment plants, and failing septic systems acts as a food source for water-borne
bacteria. Bacteria decompose these organic materials using dissolved oxygen, thus
reducing the DO present for fish. Biochemical oxygen demand (BOD) is a measure of
the amount of oxygen that bacteria will consume while decomposing organic matter
under aerobic conditions. Biochemical oxygen demand is determined by incubating a
sealed sample of water for five days and measuring the loss of oxygen from the
beginning to the end of the test. Samples often must be diluted prior to incubation or
the bacteria will deplete all of the oxygen in the bottle before the test is complete. The
main focus of wastewater treatment plants is to reduce the BOD in the effluent
discharged to natural waters. Wastewater treatment plants are designed to function as
bacteria farms, where bacteria are fed oxygen and organic waste. The excess bacteria
grown in the system are removed as sludge, and this “solid” waste is then disposed of
12
on land. Chemical oxygen demand (COD) does not differentiate between biologically
available and inert organic matter, and it is a measure of the total quantity of oxygen
required to oxidize all organic material into carbon dioxide and water. COD values are
always greater than BOD values, but COD measurements can be made in a few hours
while BOD measurements take five days. If effluent with high BOD levels is
discharged into a stream or river, it will accelerate bacterial growth in the river and
consume the oxygen levels in the river. The oxygen may diminish to levels that are
lethal for most fish and many aquatic insects. As the river re-aerates due to
atmospheric mixing and as algal photosynthesis adds oxygen to the water, the oxygen
levels will slowly increase downstream. The drop and rise in DO levels downstream
from a source of BOD is called the DO sag curve.
2.3 Urban runoff and Best management practices (BMPs)
BMPs are any measure, practice, or control implemented to protect water quality and
reduce the pollutant content in storm water runoff. Legal entities are required to define
and implement a selection of BMPs to reduce the discharge of pollutants from their
storm drain system. The Permit requirement is applicable to both permanent and
temporary (construction) BMPs. Additionally; the BMPs may be applied to special
circumstance sites where there is a direct discharge into impaired receiving water with
an established TMDL for example in US.
BMP Categories
The general categories of BMPs are:
Permanent BMPs: Permanent controls are designed to control erosion and sediment
after construction and fulfill the general requirements in the Permit. Permanent BMPs
13
are either designed to control the pollution at the source or treat storm water runoff by
removing contaminates. The two types of permanent BMPs are:
a. Source Control Measures or Soil Stabilization BMPs: measures of control to prevent
pollutants from being entrained in runoff, thereby curtailing pollution at the source.
Most literature refers to these BMPs as Soil Stabilization BMPs.
b. Treatment Control Measures: Control measures to treat storm water runoff and
remove pollutants of concern before discharging into conveyance systems or receiving
water.
Temporary BMPs: Temporary or construction BMPs are the Best Conventional
Technology/Best Available Technology (BCT/BAT) based BMPs and are consistent
with the BMPs required under the General Permit.
14
CHAPTER THREE
3. METHODS
3.1 Study Area and climate
The city of Bahir Dar in Amhara region of Ethiopia is the study area (fig 3.1). Lake
Tana, which is found at the northern end of the city, is the water body receiving most
of the urban storm water run off and domestic waste effluents. Bahir Dar is a rapidly
expanding city and an important center where tourism and commercial activities are
taking place. There are no particular parts of the city where commercial or other
activities are concentrated. Shops and residences are generally present in all sectors.
Most of the houses especially old residential houses found in the city are not sewered.
People in this area collect their excreta and domestic wastes using dry pit latrine
prepared in their back yard. There are no major industries in the contributing areas; the
textile factory and two tanneries are located outside the watershed that contributes to
the urban storm water and sanitary sewer joining the lake. Most part of the city is
established on the vertisol found at the periphery of Lake Tana and Blue Nile. The city
has flat topography having a poor drainage network. According to the data obtained
from the city administration, the total road length in Bahir Dar is estimated to be
71km, of which about 26% asphalted, 57% graveled and the remaining17% is
unsurfaced. In 2005, the city had approximately 250,000 inhabitants. According to the
Ethiopian Meteorology Agency, Bahir Dar area has a mean annual rain fall is 900mm,
where 54% of the rain falls in July and August and only 3% falls during the dry
months, the rest fall in the remaining months. The mean annual temperature is 160C.
The maximum temperature usually occurs from March to May and at its lowest from
November to February.
15
Figure 3-1: Urban storm runoff and ground water sampling station within the City of Bahir Dar (the study area).
3.2 Study methodology and approach
3.2.1 Data Availability
Data considered in this study obtained from direct measurements, field assessments
and from different institution in the region and consists of primary, secondary, and
experimental or metadata .The primary data includes:
1. Rainfall and other hydrological data to estimate runoff flow rate during sampling.
2. The urban runoff and ground water quality data.
3. Direct measured values from field survey.
4. Metadata consists of information on the data, such as maps and satellite images of
the city and the gulf to delineate the study area and the sub drainages.
16
5. Other data collection were achieved through
- Intensive literature review
- Inspection of the pollution source points
3.2.2 Area characterization and Site Selection
The city of Bahir Dar has different topographical urban catchments that each convey
the urban storm runoff to separate outfalls. The storm collection network of the city is
a mixture of open and closed storm drains. Currently the urban runoff with other
domestic effluent is joining the lake at six identified outfalls. The pollution source
assessment & the magnitude of urban run off pollution & water quality at each
drainage outlet and the lake, will apply methodologies for the translation of the data in
to conclusion that could contribute to the recommendation of effective urban runoff
pollution control approach. Some of the procedure /activities that were carried out in
study area characterization and site selection include:
o GIS based watershed delineation was carried out to identify and delineate parts
of the town that contributes runoff and domestic waste to the established
monitoring sites/ sampling stations/.
o Six sampling stations were established to monitor the urban storm water runoff
quality and three pieziometers were installed as ground water monitoring site
at appropriate site that ground water is expected to be found at shallow depth.
The sampling stations are shown above on Figure 3-1 and the locations are
described in Table 3-1.
17
Table 3-1: Description of the Monitoring Stations
S.No Name of the station/ID of the stations Location (GPS coordinate of the station)
1 SO S (station-1) N 11036’31.4’’ & E 37021’54.7’’ 2 Hospital (station- 2) N11036’26.2’’ & E 37022’05.1’’ 3 N.Fueldepot (station-3) N11036’09.9’’ & E 37022’27.9’’ 4 Summerland (station-4) N11035’42.5’’ & E 37023’28.3’’ 5 Ethiostar (station-5) N11035’42.5’’ & E 37023’28.3’’ 6 Shumabo (Station-6) N11035’57.7’’& E 37023’44.95’’ GW monitoring sites 1 Red cross (station-1) N11035’29.8’’ & E 37023’00’’ 2 M. college (station-2) N11035’14.6’’ & E 37023’26.2’’ 3 BDU/EF (station-3) N11035’50.46’’&E37023’51.18’’
The first sampling station located at the North-western end of the city collects most of
the urban runoff from new residential area and small farms. The storm water run off at
this sampling station is supplied by mixed type of drainage ditches. The drainage
ditches run from the airline Main Street to this outfall point is earthen open ditches
where as the other feeder ditches are rectangular masonry open ditches. The sampling
station No.2 represents the total runoff exiting in the sub-basin around the city
Referral Hospital. Most run off transporting ditches in this sub basin are grassed open
ditches and rectangular masonry storm drains. The only concrete pipe found in this
sub catchment is the one that is laid along the street to Bahir Dar Referral hospital
where commercial activities and hotels are found. In the other and most part of the sub
catchment, new residential houses are dominant. In some cases when there is high
storm event the flood that normally flows to other sub catchment over tops the main
road that takes to airplane station and join the ditch that guide floods to this sub
catchment. There are two monitoring station (station 4 and 5) located at the main street
that stretches between the Saint George Church to the regional council bureau where
hotels are concentrated. In these sub catchments most of the urban runoff transporting

18
system is carried out with closed concrete pipe. At sampling station four
(Summerland) the western and central part of the sub catchments is monitored. The
concrete pipe laid along the street in this sub catchment carries most of the storm
water runoff in the area. The fifth sampling station found near the two big hotels
(Ethiostar and Summerland hotel) carries the waste discharged by these hotels and has
continues flow in the dry period. These sampling stations enabled an assessment of the
quantity and quality of runoff from the north eastern portion of this catchment area
and discharges from hotels. The two sampling station represents the total surface
runoff exiting in the sub-basin. In the other sub catchment run off quantity
measurements and samples for laboratory analysis were collected from the Shumabo
site (sampling station-6) at the outlet of a 90 cm diameter concrete pipe at the site
down stream of the fourth and fifth sampling station. Like the neighborhood stations,
shumabo monitoring sites is laid with concrete storm water pipes that collects the
runoff to the out fall point. There are no residential and commercial buildings in this
sub catchment and the urban runoff collected in this catchment is mainly from the
Engineering faculty Bahir Dar University and the streets found between the regional
council bureau and Shumabo recreation center.
3.2.3 Runoff Quantity Measurement
Water level data were used to calculate the average flow rate using Manning’s
equation at all sampling stations. The depth of flow (and, thus the related section
properties) in the storm runoff drainage pipe was physically measured with simple
scale during the runoff event simultaneously with sampling process, and pipe slope
were determined from record drawings and confirmed by field measurements.
Manning’s roughness coefficient has been taken the same for sampling station that
have similar pipe material ( concrete pipes) except for the stations 1 and 2 which have
19
water ways composed of rectangular masonry. Table 3-2 contains parameters
associated with these flow calculations.
2/13/21 SAR
nQ = Equation 1
Where: Q is the flow rate (m3/s), n is the Manning’s roughness coefficient, A is the
cross-sectional area of the channel (m2), R is the hydraulic radius (m), and S is the
channel slope (%).
The runoff monitored at each sampling station site varies because of spatial
differences in the rain fall, which may have produced measurable runoff at one site but
not all sites. Higher measurements of runoff during the study period were recorded
consistently at sampling station two and four.
Table 3-2: Parameters for Flow Calculations
Station Id Method Shape & material Parameters
SOS (Station- 1) Manning’s Eqn.
Masonry & rectangular
Width=0.9m Slope= 0.0032, n=0.018
Hospital (Station- 2) Manning’ eqn.
Masonry & rectangular
Width=2.3m Slope= 0.0032, n=0.018
National-fuel Depot(staion-3) >> Circular
concrete pipeDiameter=1m
Slope= 0.006, n=0.014 Summerland (station-4) >> >> Diameter=1.10m
Slope= 0.0046, n=0.014
Ethiostar (station-5) >> >> Diameter=1.2m Slope= 0.0046, n=0.014
Shumabo (Station-6) >> >> Diameter=0.9m Slope= 0.006, n=0.014
3.2.4 Runoff Water Quality Sampling and Analysis
Urban runoff water quality characteristics has been determined in both low and high
flow conditions .The samples were gathered from six different runoff outfalls for one
20
rain fall-run off event simultaneously with the runoff discharge. The urban runoff
sampling was done by collecting the runoff sample manually using PVC scoop that
received the entire flow and where then transferred to sampling bottles. For
bacteriological analysis, BOD/COD and other WQ parameters; 200-ML sterilized
plastic sampling bottles, 200ml Winkler standard bottle (black glass bottles) and 1-L
plastic sampling bottles that are free from any chemicals were used respectively. The
preparation of composite sample for one rainfall event was done by calibrating the
sampling bottle with equal volume for three grab samples and preparing one event
composite sample on site for that specific runoff event and sampling station. In each
month, three-runoff event were sampled during the 2008 rainy season (July, August,
September and October) for a total of 9 rainfall events. Grab samples in each runoff
event were collected at the start of the runoff, middle of the run off event and finally
when the storm water flows decreased significantly.
The composite samples were shipped to the Water Resource Development Bureau
Water Laboratory in Bahir Dar, Amhara Region, for water quality analyses. This
laboratory is used for much of the regulatory analyses required within the Region, and
thus maintains high test standard protocols. The Regional Laboratory provided a
complete water quality analysis of each composite sample throughout the three month
research program that consists of the following water quality characteristics: the total
coliform dissolved oxygen, total dissolved solids (TS), total suspended solids (TSS),
total nitrogen (TN), total phosphorus (TP), BOD/ COD, pH and conductivity. The
water quality analyses were generally conducted according to standard methods
appropriate for turbid samples. All samples were preserved in the laboratory under 40C
until analyzed. When the time between sample collection and analysis (the sample
holding time) exceeded that set out by standard methods, no test was conducted by this
21
Laboratory. Samples collected in September were analyzed by the Bahir Dar
University water quality laboratory for the same water quality parameter as the
regional laboratory performed.
For the whole water quality parameter analyses, cost considerations dictated that only
a composite sample would be used for analysis purposes. As a composite sample
provides only a mean concentration over the sampling interval, it was recognized and
accepted that less information could be derived using such a sample analysis protocol.
(e.g., it is not possible to generate a pollution load versus time graph from the results
of a composite analysis).
22
CHAPTER FOUR 4. RESULT
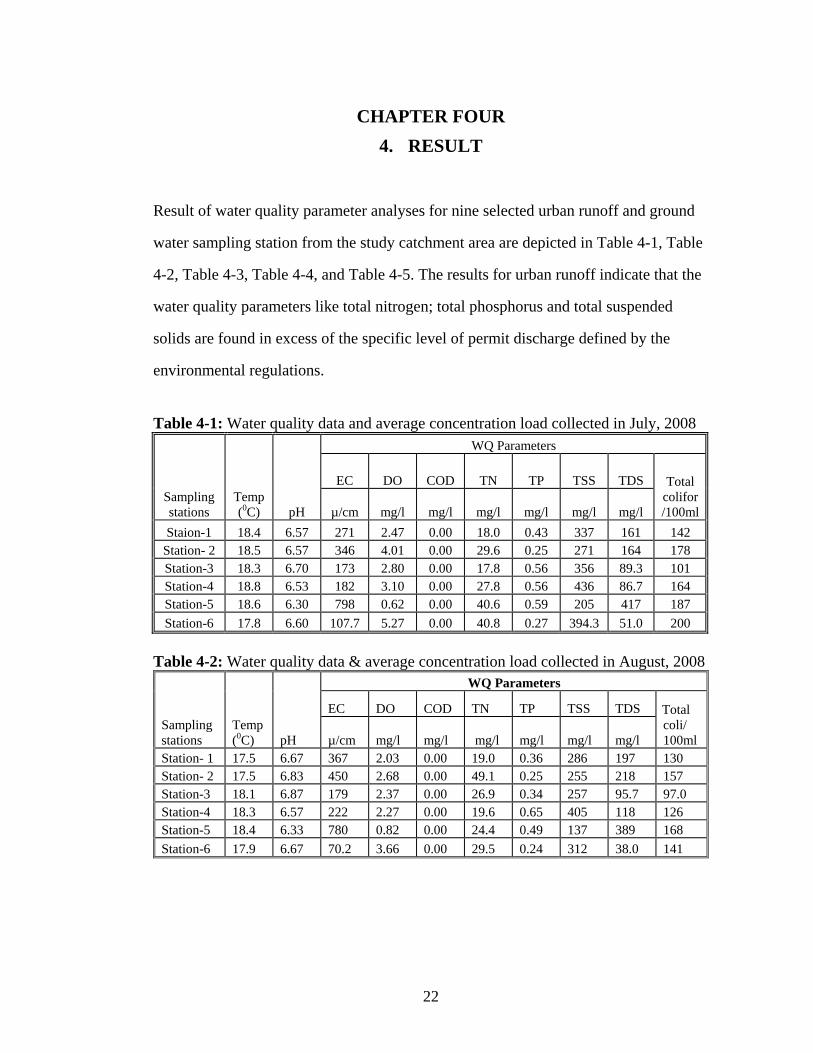
Result of water quality parameter analyses for nine selected urban runoff and ground
water sampling station from the study catchment area are depicted in Table 4-1, Table
4-2, Table 4-3, Table 4-4, and Table 4-5. The results for urban runoff indicate that the
water quality parameters like total nitrogen; total phosphorus and total suspended
solids are found in excess of the specific level of permit discharge defined by the
environmental regulations.
Table 4-1: Water quality data and average concentration load collected in July, 2008
Sampling stations
Temp (0C) pH
WQ Parameters
EC DO COD TN TP TSS TDS Total colifor/100ml
µ/cm mg/l mg/l mg/l mg/l mg/l mg/l
Staion-1 18.4 6.57 271 2.47 0.00 18.0 0.43 337 161 142 Station- 2 18.5 6.57 346 4.01 0.00 29.6 0.25 271 164 178 Station-3 18.3 6.70 173 2.80 0.00 17.8 0.56 356 89.3 101 Station-4 18.8 6.53 182 3.10 0.00 27.8 0.56 436 86.7 164 Station-5 18.6 6.30 798 0.62 0.00 40.6 0.59 205 417 187 Station-6 17.8 6.60 107.7 5.27 0.00 40.8 0.27 394.3 51.0 200
Table 4-2: Water quality data & average concentration load collected in August, 2008
Sampling stations
Temp (0C) pH
WQ Parameters
EC DO COD TN TP TSS TDS Total coli/ 100ml
µ/cm mg/l mg/l mg/l mg/l mg/l mg/l
Station- 1 17.5 6.67 367 2.03 0.00 19.0 0.36 286 197 130 Station- 2 17.5 6.83 450 2.68 0.00 49.1 0.25 255 218 157 Station-3 18.1 6.87 179 2.37 0.00 26.9 0.34 257 95.7 97.0 Station-4 18.3 6.57 222 2.27 0.00 19.6 0.65 405 118 126 Station-5 18.4 6.33 780 0.82 0.00 24.4 0.49 137 389 168 Station-6 17.9 6.67 70.2 3.66 0.00 29.5 0.24 312 38.0 141
23
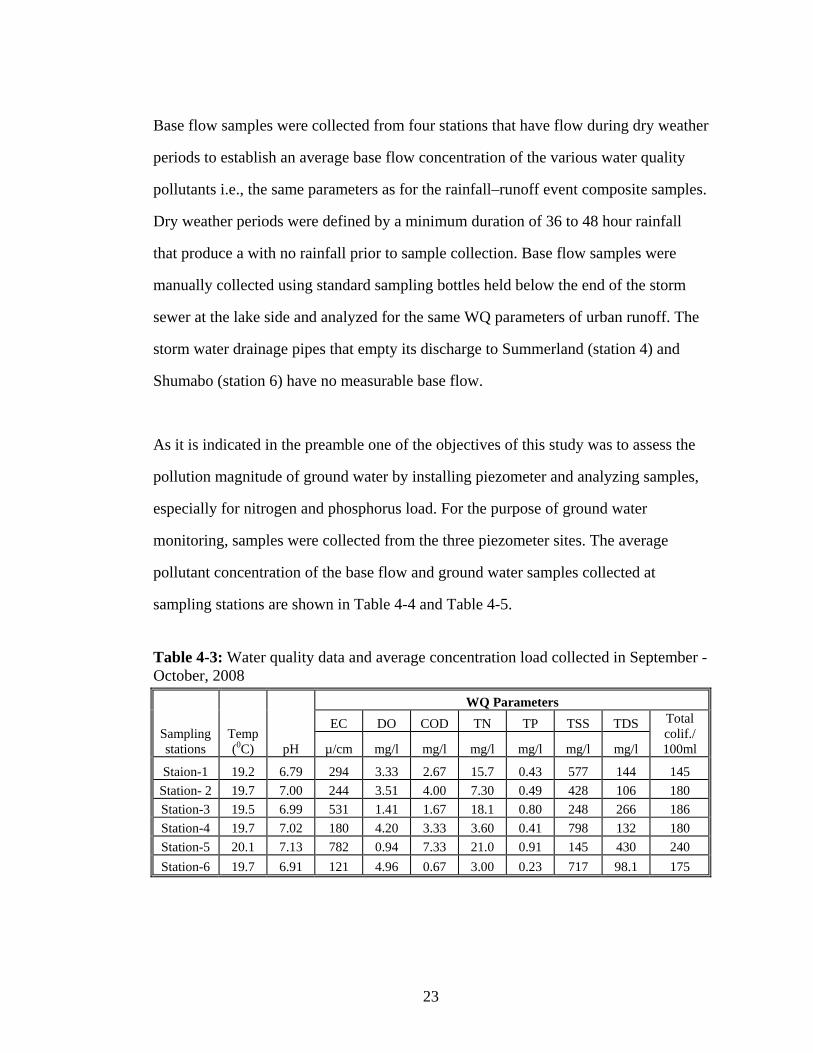
Base flow samples were collected from four stations that have flow during dry weather
periods to establish an average base flow concentration of the various water quality
pollutants i.e., the same parameters as for the rainfall–runoff event composite samples.
Dry weather periods were defined by a minimum duration of 36 to 48 hour rainfall
that produce a with no rainfall prior to sample collection. Base flow samples were
manually collected using standard sampling bottles held below the end of the storm
sewer at the lake side and analyzed for the same WQ parameters of urban runoff. The
storm water drainage pipes that empty its discharge to Summerland (station 4) and
Shumabo (station 6) have no measurable base flow.
As it is indicated in the preamble one of the objectives of this study was to assess the
pollution magnitude of ground water by installing piezometer and analyzing samples,
especially for nitrogen and phosphorus load. For the purpose of ground water
monitoring, samples were collected from the three piezometer sites. The average
pollutant concentration of the base flow and ground water samples collected at
sampling stations are shown in Table 4-4 and Table 4-5.
Table 4-3: Water quality data and average concentration load collected in September - October, 2008
Sampling stations
Temp (0C) pH
WQ Parameters EC DO COD TN TP TSS TDS Total
colif./ 100ml µ/cm mg/l mg/l mg/l mg/l mg/l mg/l
Staion-1 19.2 6.79 294 3.33 2.67 15.7 0.43 577 144 145 Station- 2 19.7 7.00 244 3.51 4.00 7.30 0.49 428 106 180 Station-3 19.5 6.99 531 1.41 1.67 18.1 0.80 248 266 186 Station-4 19.7 7.02 180 4.20 3.33 3.60 0.41 798 132 180 Station-5 20.1 7.13 782 0.94 7.33 21.0 0.91 145 430 240 Station-6 19.7 6.91 121 4.96 0.67 3.00 0.23 717 98.1 175
24
Table 4-4: The average pollutant concentrations of the base flow collected in the study period at four stations
Sampling stations
Temp (0C) pH
Parameters EC DO TN TP TSS TDS Total
coliform/ 100ml µ/cm mg/l mg/l mg/l mg/l mg/l
Station-1 20.5 6.80 422 1.49 9.03 0.73 12.3 226 108 Station- 2 20.0 6.86 490 0.93 22.5 0.47 12.7 255 160 Station-3 20.3 6.82 347 1.84 12.7 0.24 3.33 191 59.0 Station-5 20.5 6.78 855 0.45 33.7 1.14 38.7 451 187
Table 4-5: The average pollutant concentrations in ground water collected in the study period at three stations
Sampling stations
Temp (0C) pH
WQ Parameters Conductivity TN TP TDS Total
coliforms/ 100ml µ/cm (mg/l) (mg/l) (mg/l)
BDU/EF Pez. site-1 23.4 7.32 1110 Nill 0.16 625 181
Red cross deep well
site-2 23.3 7.06 1229 11.7 0.19 732 78.0
Keyamed college
Pez.Site-3 23.7 7.39 1026 17.0 0.26 591 109
In this paper, for the whole water quality parameter analyses the composite samples
were prepared from three grab samples taken at the runoff start, at the middle and
when the runoff peak declines significantly in the event and the concentration is
determined only once for one storm event. To determine the event mean concentration
for such samples, the data lack series record of time and runoff concentration for one
rain fall event since the concentration could not be determined for each grab sample.
There fore the pollutant load found from the composite sample analysis for one storm
event in each month is taken as the event mean concentration for that specific event
and catchment and the site mean concentration (SMC) is taken to be suitable measure
25
of central tendency (i.e. average) of the EMC’s for a particular site (Adams and Papa
2000). The SMCs for the study catchments at the six urban runoff sampling stations
during the study period are found in Table 4-6. Table 4-6: The mean concentration (SMC’s) for the study catchments at six urban runoff sampling stations during the study period (June-October).
From the statistical summary of urban storm water runoff quality data for the study
catchment shown in Table 4-7, the mean values for some water quality parameters like
chemical oxygen demand (COD), TDS and electric conductivity are found to be lower
when compared to the permit values. The runoff concentration load value for total
nitrogen and phosphorus are found relatively greater than the permit value. Table 4-7: Statistical summary of SMCs of water quality characteristics for the study catchment (June-October).
Temp (0C) pH
Parameters
EC DO COD TN TP TSS TDS Total Colif./ 100ml µ/cm Mg/l mg/l mg/l mg/l mg/l mg/l
MaxSMC 19.0 6.85 787 4.63 7.33 28.7 0.67 546 412 200 MinSMC 18.4 6.59 99.7 0.79 0.67 17.0 0.25 162 62.4 145
S.D 0.26 0.23 237 1.35 2.31 5.22 0.16 138 121 21.0 Mean 18.7 6.72 339 2.80 3.28 22.9 0.46 365 178 169
The event mean concentrations (EMCs) of the study area storm water runoff are
compared to those of NURP (USEPA, 1983) and CDM (Smullen et al., 1999) data
bases of the US and Droste and Hartt (1975) of Canada in Table 4-8 and Figure 4-1
Sampling stations
Av.Q m3/s pH
Parameters EC DO COD TN TP TSS TDS Total
colif./ 100ml
µ/cm mg/l mg/l mg/l mg/l mg/l mg/l
Staion-1 0.18 6.67 311 2.61 2.67 17.6 0.41 400 167 147 Station- 2 0.36 6.80 347 3.40 4.00 28.7 0.33 318 163 171 Station-3 0.16 6.85 295 2.20 1.67 20.9 0.56 287 150 145 Station-4 0.32 6.71 195 3.19 3.33 17.0 0.54 546 112 167 Station-5 0.26 6.59 787 0.79 7.33 28.7 0.67 162 412 200 Station-6 0.10 6.73 99.7 4.63 0.67 24.4 0.25 474 62.4 183
26
illustrates the water quality characteristics between EMCs of Bahir Dar storm water
runoff and these data sources. All runoff concentration means found in this study are
higher than the means found in the data base for North American cities (CDM and
NURP) and it shows that the pollutant loads of Bahir Dar storm water runoff are
relatively higher than runoff pollutant load for North American cities except for
chemical oxygen demand. This is because of more littering, more unsewered houses,
more unpaved road and manual street sweeping activities in Bahir Dar.
Table 4-8: Comparison of the study catchment and North America EMC estimates
4.1 Statistical comparison between sampling station results
One-way analysis of variance (ANOVA) performed in SPSS software was used to
compare and discuss the runoff concentrations obtained in each outfall. The summary
of the statistical analysis results are presented in Table 4–9 and the statistical
comparison and discussion between station results is based on the data tabulated that
follows.
Quality parameter Unit
Study catchment
runoff Droste & Hartt
(1975)
NURP (USEPA
1983)
CDM (smullen et al.,1999)
PH 6.72 7.40 --- --- EC µ/cm 339 300 --- --- TSS mg/l 365 300 174 78.4 COD mg/l 3.28 150 66.1 52.8 TN mg/l 22.9 2.98 2.51 2.39 TP mg/l 0.46 0.52 0.34 0.32
27
Figure 4-1: Comparison of water quality characteristics between Bahir Dar storm water runoff and other data sources Table 4-9: Statistical comparison of runoff sampling station for each quality parameter
Sampling stations
Temp (0C) pH
WQ Parameters
EC DO COD TN TP TSS TDS Total colif/ 100 ml
µ/cm mg/l mg/l mg/l mg/l mg/l mg/l
Staion-1 18.4a 6.67a 311a 2.61a 2.67a 17.6a 0.41a 400a 161a 147a
Station- 2 18.6a 6.80a 347a 3.40ac 4.00a 28.7a 0.33ab 318a 163a 171a
station-3 18.6a 6.85a 295a 2.20a 1.67a 20.9a 0.50ab 287a 150ac 145b
Station-4 18.9a 6.71a 195ac 3.19a 3.33a 17.0a 0.54abce 546ab 112ac 167a
Station-5 19.0a 6.59a 787b 0.79b 7.33a 28.7a 0.67ac 162ac 412b 200a
Station-6 18.5a 6.73a 99.7c 4.63c 0.67a 24.4a 0.25ad 474abd 62.4c 183a
*Similar small letter superscripts indicates that there is no significant difference between station value while for different letters the reverse is true
0
50
100
150
200
250
300
350
400
Ph EC TSS COD TN*10 TP*100
Water quality parameters
Con
cent
ratio
ns in
mg/
l
Study catchmentDroste &HeartNURP (USEPA)CDM(Smullen et al)
28
CHAPTER FIVE
5. DISCUSSIONS
5.1 Statistical comparison of water quality parameters between sampling stations
pH: By definition, pH is the negative logarithm of the hydrogen ion concentration.
Most natural waters will have pH values from pH 5.0 to pH 8.5. Fresh rainwater may
have a pH of 5.5 to 6.0. In this study the measurements carried out for pH in each
sampling station have the minimum value of 6.59 and a maximum value of 6.85. The
statistical results showed that there is no significant difference between the six
sampling stations. This result refers that the pH value for all analyzed samples were
with in the range of the acceptable limits.
Total coliforms: Total coliform counts in water bodies are an important parameter for
checking possible sewage contamination. Laboratory measurements at the beginning
of July sampling showed that the counts of total coliform were considerably high. The
laboratory result of the total coliform for all six stations on average basis was above
145colony/100ml and this is a clear evidence of domestic wastewater contamination in
all monitoring sites. For the month August there was a slightly decrease in total
coliform count but in September the total coliform counts again showed an increasing
trend in connection with the flow rate reduction that leads to concentrated pollutant
load. The minimum coliform count was recorded consistently through out the study
period for samples collected at station 3 (National fuel depot) and this station was
significantly different from the other 5 sampling stations. The total coliform for station
5 showed the highest value though there is no significant difference with station 1, 2, 4
and 6.The high values in coliform counts most probably arise from untreated domestic
wastewater that most hotels discharged in to the storm draining ditch.
29
Dissolved oxygen: WHO standards indicate that the acceptable range for dissolved
oxygen for fresh water is 10-12mg/l. The analyzed water quality data showed that the
dissolved Oxygen levels measured in all monitoring stations were not in the
acceptable range according to WHO. The three months measurements in Ethio-star
outfall (station 5) showed that the dissolved oxygen levels were consistently below the
limit. In contrast at Shumabo (station 6), the DO levels were found higher than the
other stations. As it can be shown in the statistical summary (Table 4-9), the result
found in stations 5 and 6 were significantly different from the other four stations .The
runoff water in all monitoring sites was not suitable to support aquatic life in terms of
DO levels.
Conductivity: The monthly conductivity values were not significantly different
between the stations. Laboratory measurements for conductivity showed an average
value of 786µ/cm levels in the highest measured stations of Ethiostar. The lowest
conductivity was recorded at Shumabo monitoring site in all rainfall events (100
µ/cm). After the laboratory analysis, the result of electric conductivity and total
dissolved solid were found to be highly correlated (correlation coefficient equal to
0.99). The increase in electric conductivity is completely associated with the amount
of dissolved solid in the analyzed samples. The conductivity of station 5 had a value
which is significantly greater than the other five sampling stations.
Total dissolved and Suspended Solids: The maximum total dissolved solid pollution
loads comes from the Ethiostar (station- 5) with an average load of 412mg/l and the
second highest load is from Hospital value of 162 mg/lit which is almost half of the
TDS of Ethiostar. Of course, for the third and second rainfall event sampling of July
30
and September, the TDS measurement at this station was above the recommended
value (500mg/l) (USEPA).The minimum load is recorded at Shumabo sampling
station with a load of 62 mg/l. There is a strong correlation between the total dissolved
solid and the conductivity. When the sample has high measurement of conductivity,
the TDS is also high with almost half and above the value of electric conductivity
consistently at all station .It is observed that total dissolved solids (TDS) in mg/l
ranges from 0.5 to 1.0 times the electrical conductivity in µ/cm. As it is indicated in
statistical summary the TDS of station 5 showed significance difference with the TDS
recorded for other five sampling stations. The TDS for station 6 was also significantly
different from station 1, 2 and 5 but not with station 3 and 4. As discussed above the
maximum and minimum conductivity TDS value was found in station 5 and 6
respectively.
The suspended solid (SS) pollution loads in all monitoring sites except in Ethiostar
sampling station are above 200mg/l, which exceeds the permit level of water quality
standard of 50mg/lit (USPCD, Vol. 113 Part 13 D, dated February 13, B.E.2539
(1996). The reason for such a high amount of SS from the five sampling station would
possibly originate from the erosion coming from active road construction sites from
the immediate vicinity. Because areas along the main streets that feed runoff to this
outfall points are excavated for pavement construction, therefore, the adverse effects
of surface runoff may cause increase in SS levels. The presence of unpaved roads in
this sub catchment may also be the other cause for high value of suspended solids.
The lowest suspended solid load recorded in station-5 carries the waste water from
Ethiostar hotel in a buried closed pipe. Therefore the runoff that sweeps most of the
main roads and walkways found in the sub watershed have no chance to join this
sewer line. Higher values of suspended solid were found in sampling stations where
31
urban storm runoff flow in open ditches or along the street curve stones. Except the
station-5 value that has significant difference with station 4 and 6, no significance
difference was observed in the remaining stations for total suspended solids.
Total phosphorus: The sampling station at Ethiostar was the highest with a
phosphorus load of 0.67mg/l. The elevated total P levels in the Ethiostar sampling
station could possibly result from soaps used by the hotels that discharge their
domestic effluents to the sewer pipe which drains the storm water runoff to this out
fall point (sampling station). The second highest level found in Summerland
monitoring site could be due to the closely located hotels, public housing wastewater
and detergent discharges to this drainage ditch. In the SOS and National fuel depot
sampling station the phosphorus levels measurements were also elevated. The average
total phosphorus levels recorded at each sampling station and summarized in Table
4-6 were in excess of 0.1mg/l limit for eutrophication (European Community
(80/778/EEC) Guide Level.
Total nitrogen: Nitrogen, generally as the two oxidized states nitrate and nitrite, is a
nutrient for algal and plant growth in streams; it can be deleterious, especially to
infants, when present at high levels in drinking water. Excess nitrogen in urbanized
catchment generally results from waste water (failing septic system), over-fertilization
of lawns, and fine sediment from erosion or street runoff. For surface waters the
acceptable value of nitrogen is 10 mg/ml. The nitrogen loads in all runoff and ground
water sampling station were found to be quite high. The average total nitrogen levels
in all sampling station were much higher than the surface water nitrogen level. The
high level of nitrogen would possibly arises from the direct discharge of house holds,
restaurants and other public service giving centers like recreation sites located in the

32
near by of the monitoring sites. Though there is no significant difference observed
between the six sampling stations, higher value of nitrogen was recorded at station 2
and 5 with load of 28.7 and 28.6 mg/l respectively.
33
CHAPTER SIX
6. CONCLUSION, MANAGEMENT IMPLICATION AND
RECOMMENDATIONS
6.1 Conclusion
This study was conducted with the main objective of assessing the magnitude of urban
storm runoff pollutant load and its impact on Lake Tana. From the result found during
the study period, major conclusions were drawn. Conclusions drawn from the site
assessment, data analyses, and assessment of results include the following:
1. The runoffs collected from areas where hotels and other commercial centers are
located have elevated value of nitrogen and phosphorus which are in excess of
concentration that causes eutrophication of the lake.
2. Sampling location in catchments with open drains had greater suspended solids
(TSS) concentration than those catchments with closed drains or grassed water way
3. The strongest correlation was observed among the parameters associated with
dissolved minerals (electric conductivity and dissolved solids).
4. The concentration of colliforms and other pollutant loads were found to be very
high when the discharge is low and there was a long dry period before the sample was
taken.
5. The conductivity and total dissolved solids found in ground water was greater than
in the urban runoff.
6. Generally the results found from sampled and analyzed runoff during the study
indicate that there is domestic wastewater contamination.
7. Pollutant concentrations in all mean except for COD were greater than the average
pollutant concentration for the cities in US.
34
6.2 Management implication and recommendations
Currently the city of Bahir Dar does not effectively manage its storm water. The city
service office constructed open ditches that collect the urban runoff that empty in Lake
Tana without any treatment and quality control. In view of the relatively large
pollutant load to Lake Tana from urban runoff, more attention should be given to the
water quality of this urban runoff and the source of pollution. This will require further
testing to quantify the load more precisely involving continuous water quality
monitoring programs consisting of standardized sampling and runoff measurement.
Obtaining reliable data is a prerequisite to implementing best management practices to
reduce these loads.
Tentative recommendations for improving urban storm water runoff quality using
management practices are summarized into the following two scenarios.
Scenario-1
Expensive treatment plants to treat the runoff water are feasible but can’t be practical
because they require a high initial investment, more importantly maintenance costs are
high and the necessary expertise for the plants is not available. Therefore under this
scenario an immediate option is proposed for improving the storm water quality using
natural wetlands. Bahir Dar is surrounded by wetlands and low laying lands that easily
can be converted to natural wetlands. Diverting the current storm water that drains into
Lake Tana will not only help conserve these wetlands from development pressures,
but at the same time treat the wastewater.

35
Scenario-2 (Future Scenario)
Improvement of storm water quality can also be obtained with urban best management
practices. These BMPs are either designed to control the pollution at the source or
treat storm water runoff by removing contaminates. This includes:
1. Construction of vegetated swales to promote infiltration and detention of runoff.
2. Remove pollutants before discharging into conveyance systems or Lake Tana. The
two tannery factories are of special concern though they are found outside the runoff
contributing area to Lake Tana since they uses toxic chemical to treat the hides.
Tanneries in the USA have a legacy of polluting river systems decades after they are
closed and have been proven.
3. There should be an institute responsible to set legal measures that minimize impact
from construction activities.
36
CHAPTER SEVEN
7. REFERENCES
Adams, B. J., and Papa, F. (2000). Urban storm water management planning with analytical probabilistic models, Wiley, Toronto, Ont., Canada. Chambers, P. A. (1997). “Impacts of municipal effluents on Canadian waters: A review.” Water Qual. Res. J. Canada, 32(4): 659–713. Characklis, G.W., and Wiesner, M.R. (1997). Particles, Metals, and Water Quality in Runoff from Large Urban Watershed. Journal of Environmental Engineering, 123(8): 753-759. Das, B.M. (1998). Principles of Geotechnical Engineering. PWS Publishing, Boston, Ma, 712 pp. Droste, R.L., Hartt, J.P. (1975). Quality and variation of pollutant loads in urban storm water runoff. Cdn J Civ Eng; 2:418 –429. Shaver E., Horner R., Skupien J, Chris M., and Ridiey G. (2007). Fundamentals of Urban runoff management. Eshetie Dejen. (2003). Lake Tana biodiversity potential and treats, ARARI, Bahir- Dar, Ethiopia. Field, Pitt. (1990). Water research: Effects of urban runoff from a detention pond on water quality. Field, Pitt. (1990). Water research: The impact of sediment fecal coliform in reservoirs. Lee, J.H., Bang, K.W. (2000). Characterization of urban storm water runoff. Water res; 34:1773-1780 Loehr. (1974), Bedien. (1978), WEF and ASCE. (1998) and Lee and Bang. (2000). Science of the total Environment: Pollution loads in urban runoff. Minton, G.R. (2002). Storm water Treatment: Biological, Chemical, and Engineering Principles. G. Minton, Seattle, Washington, 416 pp. Nix, S.J. (1994). Urban storm water modeling and simulation. Boca Raton, FL: Lewis Publishers

37
Omernik, J.M. (1976). The influence of land Use on Stream Nutrient Level.US-EPA- 600/2-76-014.Washington, DC. Smullen, J.T., Shallcross, A.L., Cave, K.A. (1999). Updating the US nationwide urban runoff quality data base. Water Sci. Technol., 39(12), 9 –16.
38
CHAPTER EIGHT
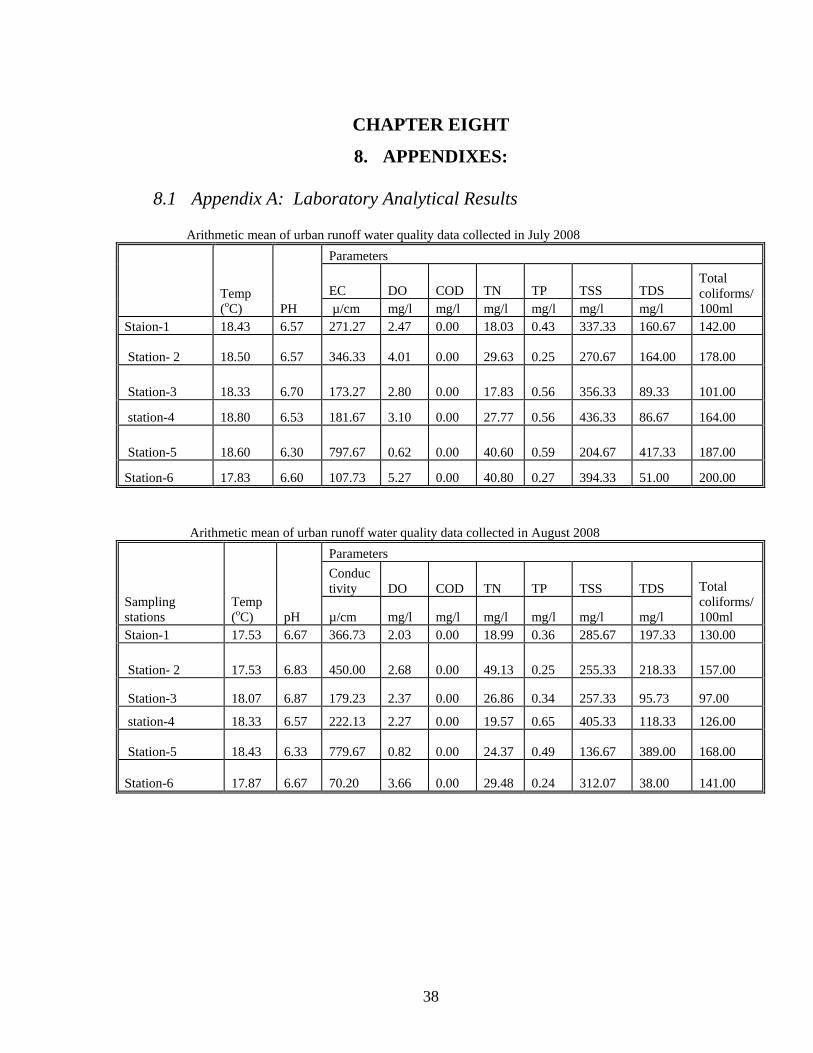
8. APPENDIXES: 8.1 Appendix A: Laboratory Analytical Results Arithmetic mean of urban runoff water quality data collected in July 2008
Temp (oC) PH
Parameters
EC DO COD TN TP TSS TDS Total coliforms/100ml µ/cm mg/l mg/l mg/l mg/l mg/l mg/l
Staion-1 18.43 6.57 271.27 2.47 0.00 18.03 0.43 337.33 160.67 142.00
Station- 2 18.50 6.57 346.33 4.01 0.00 29.63 0.25 270.67 164.00 178.00
Station-3 18.33 6.70 173.27 2.80 0.00 17.83 0.56 356.33 89.33 101.00
station-4 18.80 6.53 181.67 3.10 0.00 27.77 0.56 436.33 86.67 164.00
Station-5 18.60 6.30 797.67 0.62 0.00 40.60 0.59 204.67 417.33 187.00
Station-6 17.83 6.60 107.73 5.27 0.00 40.80 0.27 394.33 51.00 200.00 Arithmetic mean of urban runoff water quality data collected in August 2008
Sampling stations
Temp (oC) pH
Parameters Conductivity DO COD TN TP TSS TDS Total
coliforms/ 100ml
µ/cm mg/l mg/l mg/l mg/l mg/l mg/l
Staion-1 17.53 6.67 366.73 2.03 0.00 18.99 0.36 285.67 197.33 130.00
Station- 2 17.53 6.83 450.00 2.68 0.00 49.13 0.25 255.33 218.33 157.00
Station-3 18.07 6.87 179.23 2.37 0.00 26.86 0.34 257.33 95.73 97.00
station-4 18.33 6.57 222.13 2.27 0.00 19.57 0.65 405.33 118.33 126.00
Station-5 18.43 6.33 779.67 0.82 0.00 24.37 0.49 136.67 389.00 168.00
Station-6 17.87 6.67 70.20 3.66 0.00 29.48 0.24 312.07 38.00 141.00
39
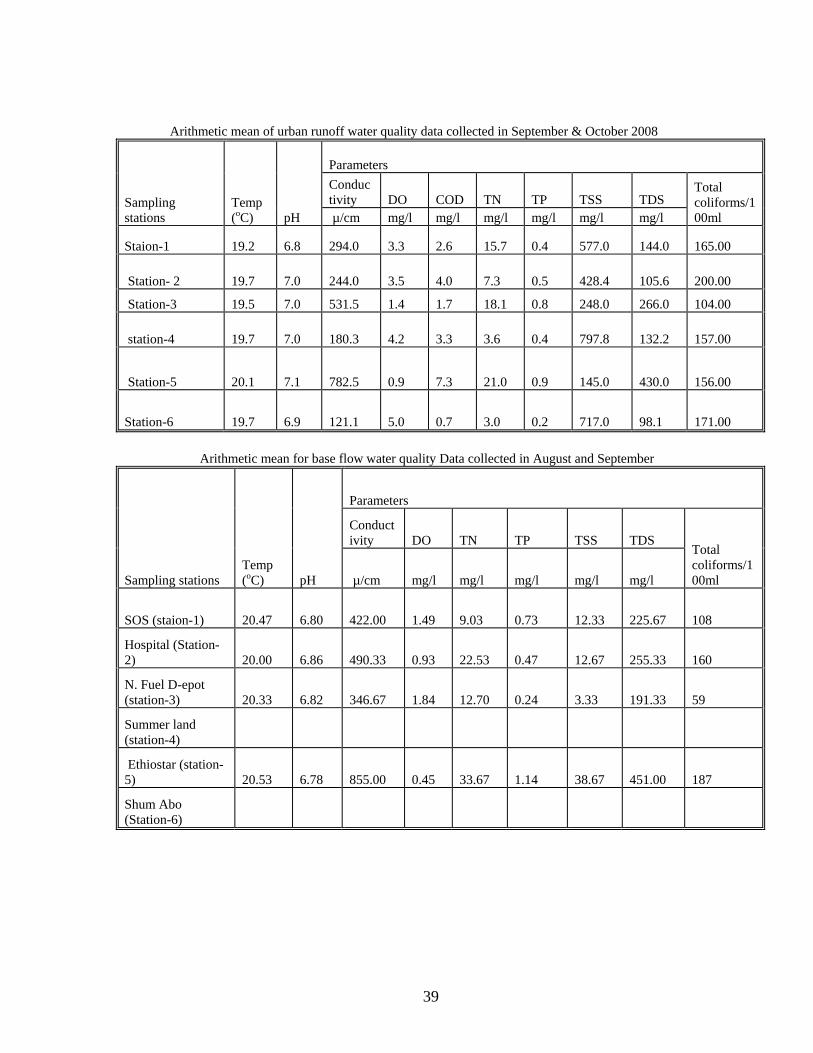
Arithmetic mean of urban runoff water quality data collected in September & October 2008
Sampling stations
Temp (oC) pH
Parameters Conductivity DO COD TN TP TSS TDS
Total coliforms/100ml µ/cm mg/l mg/l mg/l mg/l mg/l mg/l
Staion-1 19.2 6.8 294.0 3.3 2.6 15.7 0.4 577.0 144.0 165.00
Station- 2 19.7 7.0 244.0 3.5 4.0 7.3 0.5 428.4 105.6 200.00
Station-3 19.5 7.0 531.5 1.4 1.7 18.1 0.8 248.0 266.0 104.00
station-4 19.7 7.0 180.3 4.2 3.3 3.6 0.4 797.8 132.2 157.00
Station-5 20.1 7.1 782.5 0.9 7.3 21.0 0.9 145.0 430.0 156.00
Station-6 19.7 6.9 121.1 5.0 0.7 3.0 0.2 717.0 98.1 171.00 Arithmetic mean for base flow water quality Data collected in August and September
Sampling stations Temp (oC) pH
Parameters
Conductivity DO TN TP TSS TDS
Total coliforms/100ml
µ/cm mg/l mg/l mg/l mg/l mg/l
SOS (staion-1) 20.47 6.80 422.00 1.49 9.03 0.73 12.33 225.67 108
Hospital (Station- 2) 20.00 6.86 490.33 0.93 22.53 0.47 12.67 255.33 160
N. Fuel D-epot (station-3) 20.33 6.82 346.67 1.84 12.70 0.24 3.33 191.33 59
Summer land (station-4)
Ethiostar (station-5) 20.53 6.78 855.00 0.45 33.67 1.14 38.67 451.00 187
Shum Abo (Station-6)
40
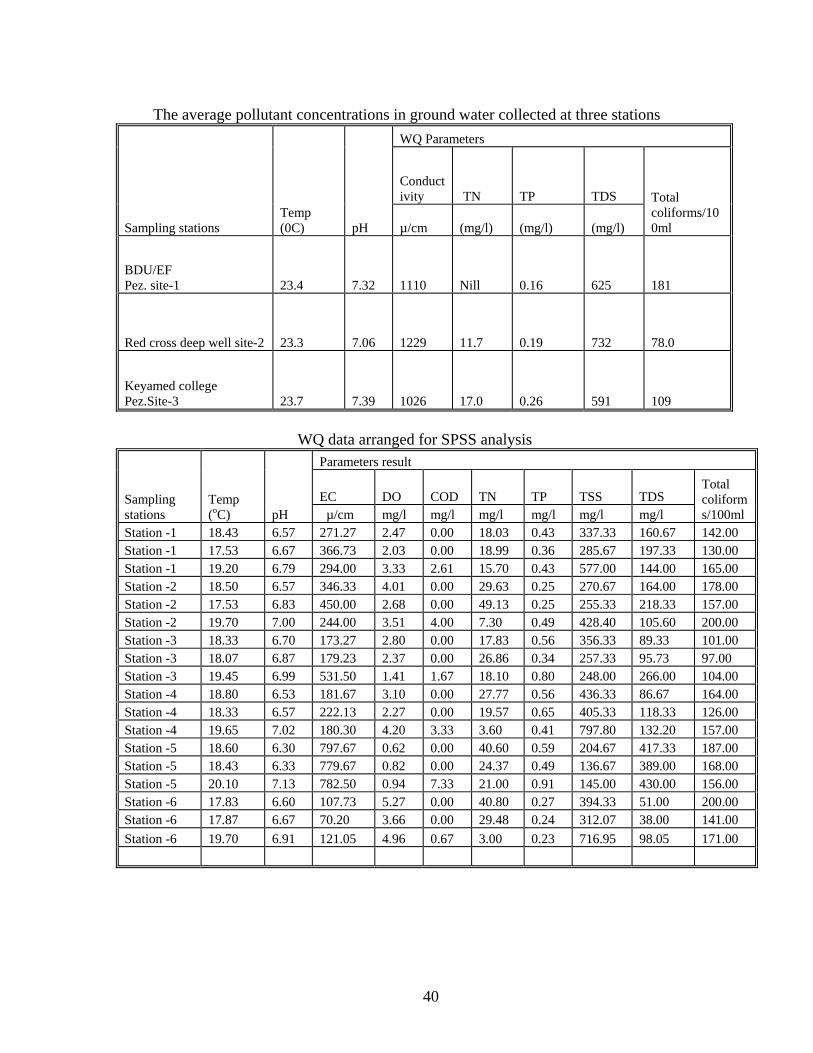
The average pollutant concentrations in ground water collected at three stations
Sampling stations Temp (0C) pH
WQ Parameters
Conductivity TN TP TDS Total
coliforms/100ml
µ/cm (mg/l) (mg/l) (mg/l)
BDU/EF Pez. site-1 23.4 7.32 1110 Nill 0.16 625 181
Red cross deep well site-2 23.3 7.06 1229 11.7 0.19 732 78.0
Keyamed college Pez.Site-3 23.7 7.39 1026 17.0 0.26 591 109
WQ data arranged for SPSS analysis
Sampling stations
Temp (oC) pH
Parameters result
EC DO COD TN TP TSS TDS Total coliforms/100ml µ/cm mg/l mg/l mg/l mg/l mg/l mg/l
Station -1 18.43 6.57 271.27 2.47 0.00 18.03 0.43 337.33 160.67 142.00 Station -1 17.53 6.67 366.73 2.03 0.00 18.99 0.36 285.67 197.33 130.00 Station -1 19.20 6.79 294.00 3.33 2.61 15.70 0.43 577.00 144.00 165.00 Station -2 18.50 6.57 346.33 4.01 0.00 29.63 0.25 270.67 164.00 178.00 Station -2 17.53 6.83 450.00 2.68 0.00 49.13 0.25 255.33 218.33 157.00 Station -2 19.70 7.00 244.00 3.51 4.00 7.30 0.49 428.40 105.60 200.00 Station -3 18.33 6.70 173.27 2.80 0.00 17.83 0.56 356.33 89.33 101.00 Station -3 18.07 6.87 179.23 2.37 0.00 26.86 0.34 257.33 95.73 97.00 Station -3 19.45 6.99 531.50 1.41 1.67 18.10 0.80 248.00 266.00 104.00 Station -4 18.80 6.53 181.67 3.10 0.00 27.77 0.56 436.33 86.67 164.00 Station -4 18.33 6.57 222.13 2.27 0.00 19.57 0.65 405.33 118.33 126.00 Station -4 19.65 7.02 180.30 4.20 3.33 3.60 0.41 797.80 132.20 157.00 Station -5 18.60 6.30 797.67 0.62 0.00 40.60 0.59 204.67 417.33 187.00 Station -5 18.43 6.33 779.67 0.82 0.00 24.37 0.49 136.67 389.00 168.00 Station -5 20.10 7.13 782.50 0.94 7.33 21.00 0.91 145.00 430.00 156.00 Station -6 17.83 6.60 107.73 5.27 0.00 40.80 0.27 394.33 51.00 200.00 Station -6 17.87 6.67 70.20 3.66 0.00 29.48 0.24 312.07 38.00 141.00 Station -6 19.70 6.91 121.05 4.96 0.67 3.00 0.23 716.95 98.05 171.00
41
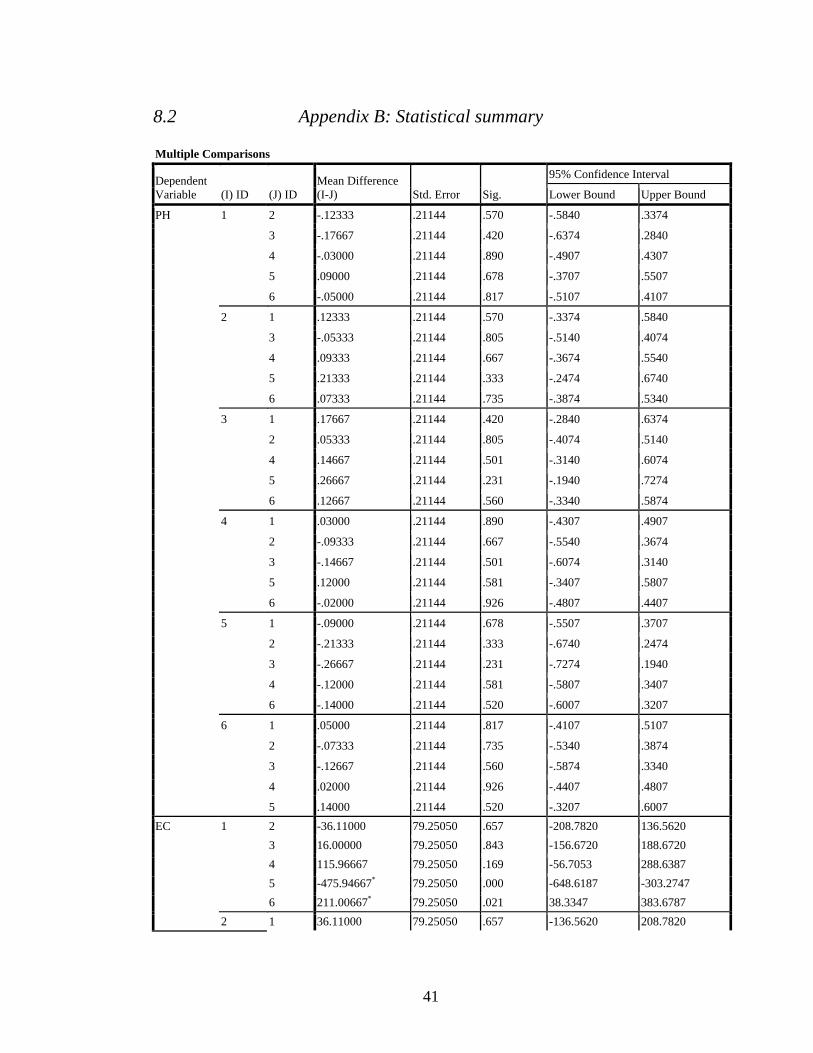
8.2 Appendix B: Statistical summary Multiple Comparisons
Dependent Variable (I) ID (J) ID
Mean Difference (I-J) Std. Error Sig.
95% Confidence Interval
Lower Bound Upper Bound
PH 1 2 -.12333 .21144 .570 -.5840 .3374
3 -.17667 .21144 .420 -.6374 .2840
4 -.03000 .21144 .890 -.4907 .4307
5 .09000 .21144 .678 -.3707 .5507
6 -.05000 .21144 .817 -.5107 .4107
2 1 .12333 .21144 .570 -.3374 .5840
3 -.05333 .21144 .805 -.5140 .4074
4 .09333 .21144 .667 -.3674 .5540
5 .21333 .21144 .333 -.2474 .6740
6 .07333 .21144 .735 -.3874 .5340
3 1 .17667 .21144 .420 -.2840 .6374
2 .05333 .21144 .805 -.4074 .5140
4 .14667 .21144 .501 -.3140 .6074
5 .26667 .21144 .231 -.1940 .7274
6 .12667 .21144 .560 -.3340 .5874
4 1 .03000 .21144 .890 -.4307 .4907
2 -.09333 .21144 .667 -.5540 .3674
3 -.14667 .21144 .501 -.6074 .3140
5 .12000 .21144 .581 -.3407 .5807
6 -.02000 .21144 .926 -.4807 .4407
5 1 -.09000 .21144 .678 -.5507 .3707
2 -.21333 .21144 .333 -.6740 .2474
3 -.26667 .21144 .231 -.7274 .1940
4 -.12000 .21144 .581 -.5807 .3407
6 -.14000 .21144 .520 -.6007 .3207
6 1 .05000 .21144 .817 -.4107 .5107
2 -.07333 .21144 .735 -.5340 .3874
3 -.12667 .21144 .560 -.5874 .3340
4 .02000 .21144 .926 -.4407 .4807
5 .14000 .21144 .520 -.3207 .6007 EC 1 2 -36.11000 79.25050 .657 -208.7820 136.5620
3 16.00000 79.25050 .843 -156.6720 188.6720 4 115.96667 79.25050 .169 -56.7053 288.6387 5 -475.94667* 79.25050 .000 -648.6187 -303.2747 6 211.00667* 79.25050 .021 38.3347 383.6787
2 1 36.11000 79.25050 .657 -136.5620 208.7820
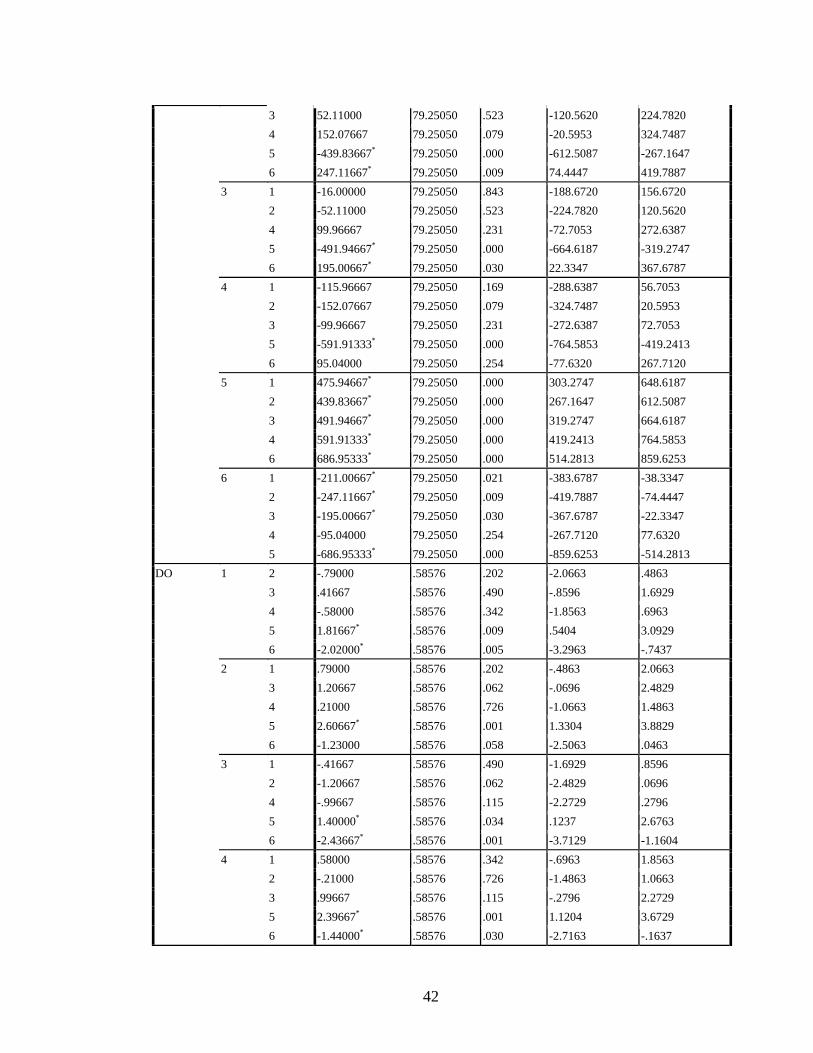
42
3 52.11000 79.25050 .523 -120.5620 224.7820 4 152.07667 79.25050 .079 -20.5953 324.7487 5 -439.83667* 79.25050 .000 -612.5087 -267.1647 6 247.11667* 79.25050 .009 74.4447 419.7887
3 1 -16.00000 79.25050 .843 -188.6720 156.6720 2 -52.11000 79.25050 .523 -224.7820 120.5620 4 99.96667 79.25050 .231 -72.7053 272.6387 5 -491.94667* 79.25050 .000 -664.6187 -319.2747 6 195.00667* 79.25050 .030 22.3347 367.6787
4 1 -115.96667 79.25050 .169 -288.6387 56.7053 2 -152.07667 79.25050 .079 -324.7487 20.5953 3 -99.96667 79.25050 .231 -272.6387 72.7053 5 -591.91333* 79.25050 .000 -764.5853 -419.2413 6 95.04000 79.25050 .254 -77.6320 267.7120
5 1 475.94667* 79.25050 .000 303.2747 648.6187 2 439.83667* 79.25050 .000 267.1647 612.5087 3 491.94667* 79.25050 .000 319.2747 664.6187 4 591.91333* 79.25050 .000 419.2413 764.5853 6 686.95333* 79.25050 .000 514.2813 859.6253
6 1 -211.00667* 79.25050 .021 -383.6787 -38.3347 2 -247.11667* 79.25050 .009 -419.7887 -74.4447 3 -195.00667* 79.25050 .030 -367.6787 -22.3347 4 -95.04000 79.25050 .254 -267.7120 77.6320 5 -686.95333* 79.25050 .000 -859.6253 -514.2813
DO 1 2 -.79000 .58576 .202 -2.0663 .4863 3 .41667 .58576 .490 -.8596 1.6929 4 -.58000 .58576 .342 -1.8563 .6963 5 1.81667* .58576 .009 .5404 3.0929 6 -2.02000* .58576 .005 -3.2963 -.7437
2 1 .79000 .58576 .202 -.4863 2.0663 3 1.20667 .58576 .062 -.0696 2.4829 4 .21000 .58576 .726 -1.0663 1.4863 5 2.60667* .58576 .001 1.3304 3.8829 6 -1.23000 .58576 .058 -2.5063 .0463
3 1 -.41667 .58576 .490 -1.6929 .8596 2 -1.20667 .58576 .062 -2.4829 .0696 4 -.99667 .58576 .115 -2.2729 .2796 5 1.40000* .58576 .034 .1237 2.6763 6 -2.43667* .58576 .001 -3.7129 -1.1604
4 1 .58000 .58576 .342 -.6963 1.8563 2 -.21000 .58576 .726 -1.4863 1.0663 3 .99667 .58576 .115 -.2796 2.2729 5 2.39667* .58576 .001 1.1204 3.6729 6 -1.44000* .58576 .030 -2.7163 -.1637
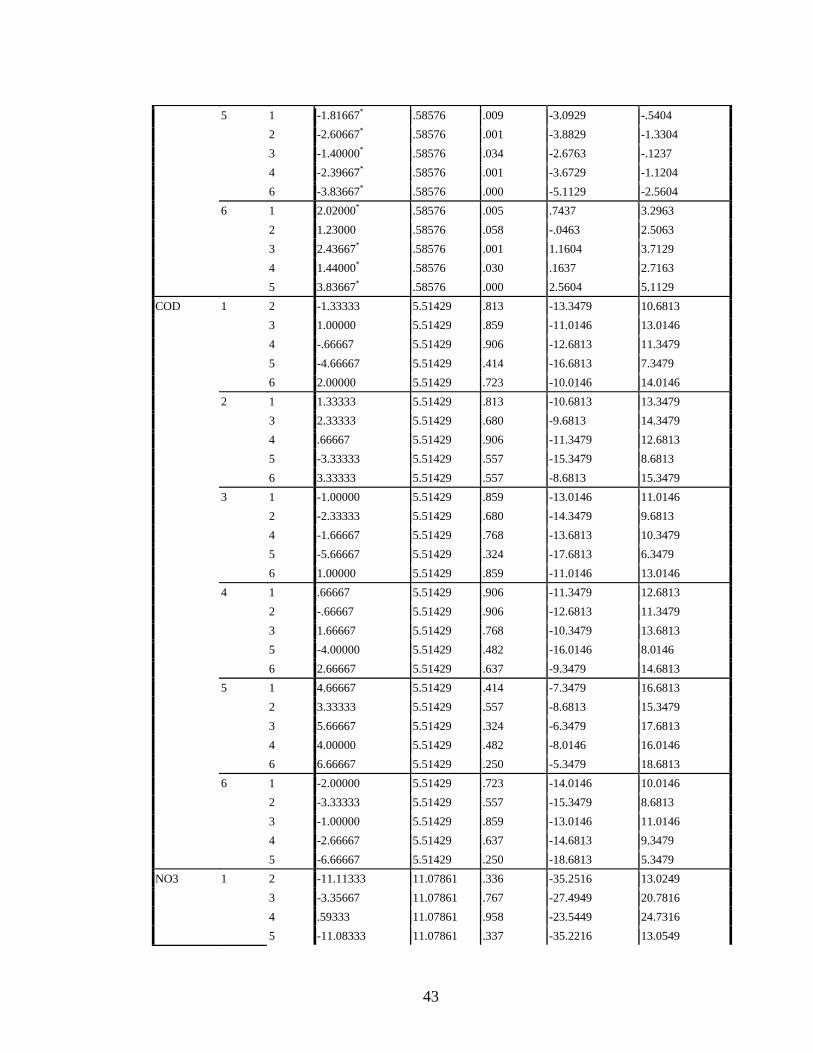
43
5 1 -1.81667* .58576 .009 -3.0929 -.5404 2 -2.60667* .58576 .001 -3.8829 -1.3304 3 -1.40000* .58576 .034 -2.6763 -.1237 4 -2.39667* .58576 .001 -3.6729 -1.1204 6 -3.83667* .58576 .000 -5.1129 -2.5604
6 1 2.02000* .58576 .005 .7437 3.2963 2 1.23000 .58576 .058 -.0463 2.5063 3 2.43667* .58576 .001 1.1604 3.7129 4 1.44000* .58576 .030 .1637 2.7163 5 3.83667* .58576 .000 2.5604 5.1129
COD 1 2 -1.33333 5.51429 .813 -13.3479 10.6813 3 1.00000 5.51429 .859 -11.0146 13.0146 4 -.66667 5.51429 .906 -12.6813 11.3479 5 -4.66667 5.51429 .414 -16.6813 7.3479 6 2.00000 5.51429 .723 -10.0146 14.0146
2 1 1.33333 5.51429 .813 -10.6813 13.3479 3 2.33333 5.51429 .680 -9.6813 14.3479 4 .66667 5.51429 .906 -11.3479 12.6813 5 -3.33333 5.51429 .557 -15.3479 8.6813 6 3.33333 5.51429 .557 -8.6813 15.3479
3 1 -1.00000 5.51429 .859 -13.0146 11.0146 2 -2.33333 5.51429 .680 -14.3479 9.6813 4 -1.66667 5.51429 .768 -13.6813 10.3479 5 -5.66667 5.51429 .324 -17.6813 6.3479 6 1.00000 5.51429 .859 -11.0146 13.0146
4 1 .66667 5.51429 .906 -11.3479 12.6813 2 -.66667 5.51429 .906 -12.6813 11.3479 3 1.66667 5.51429 .768 -10.3479 13.6813 5 -4.00000 5.51429 .482 -16.0146 8.0146 6 2.66667 5.51429 .637 -9.3479 14.6813
5 1 4.66667 5.51429 .414 -7.3479 16.6813 2 3.33333 5.51429 .557 -8.6813 15.3479 3 5.66667 5.51429 .324 -6.3479 17.6813 4 4.00000 5.51429 .482 -8.0146 16.0146 6 6.66667 5.51429 .250 -5.3479 18.6813
6 1 -2.00000 5.51429 .723 -14.0146 10.0146 2 -3.33333 5.51429 .557 -15.3479 8.6813 3 -1.00000 5.51429 .859 -13.0146 11.0146 4 -2.66667 5.51429 .637 -14.6813 9.3479 5 -6.66667 5.51429 .250 -18.6813 5.3479
NO3 1 2 -11.11333 11.07861 .336 -35.2516 13.0249 3 -3.35667 11.07861 .767 -27.4949 20.7816 4 .59333 11.07861 .958 -23.5449 24.7316 5 -11.08333 11.07861 .337 -35.2216 13.0549
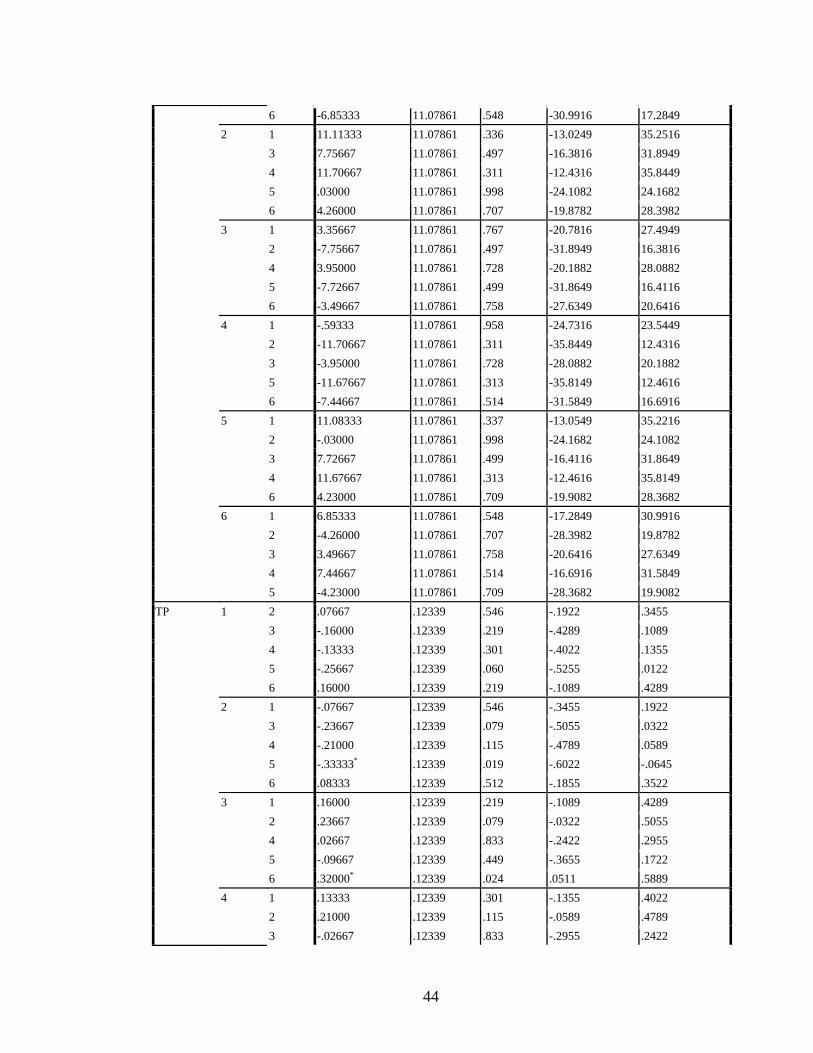
44
6 -6.85333 11.07861 .548 -30.9916 17.2849 2 1 11.11333 11.07861 .336 -13.0249 35.2516
3 7.75667 11.07861 .497 -16.3816 31.8949 4 11.70667 11.07861 .311 -12.4316 35.8449 5 .03000 11.07861 .998 -24.1082 24.1682 6 4.26000 11.07861 .707 -19.8782 28.3982
3 1 3.35667 11.07861 .767 -20.7816 27.4949 2 -7.75667 11.07861 .497 -31.8949 16.3816 4 3.95000 11.07861 .728 -20.1882 28.0882 5 -7.72667 11.07861 .499 -31.8649 16.4116 6 -3.49667 11.07861 .758 -27.6349 20.6416
4 1 -.59333 11.07861 .958 -24.7316 23.5449 2 -11.70667 11.07861 .311 -35.8449 12.4316 3 -3.95000 11.07861 .728 -28.0882 20.1882 5 -11.67667 11.07861 .313 -35.8149 12.4616 6 -7.44667 11.07861 .514 -31.5849 16.6916
5 1 11.08333 11.07861 .337 -13.0549 35.2216 2 -.03000 11.07861 .998 -24.1682 24.1082 3 7.72667 11.07861 .499 -16.4116 31.8649 4 11.67667 11.07861 .313 -12.4616 35.8149 6 4.23000 11.07861 .709 -19.9082 28.3682
6 1 6.85333 11.07861 .548 -17.2849 30.9916 2 -4.26000 11.07861 .707 -28.3982 19.8782 3 3.49667 11.07861 .758 -20.6416 27.6349 4 7.44667 11.07861 .514 -16.6916 31.5849 5 -4.23000 11.07861 .709 -28.3682 19.9082
TP 1 2 .07667 .12339 .546 -.1922 .3455 3 -.16000 .12339 .219 -.4289 .1089 4 -.13333 .12339 .301 -.4022 .1355 5 -.25667 .12339 .060 -.5255 .0122 6 .16000 .12339 .219 -.1089 .4289
2 1 -.07667 .12339 .546 -.3455 .1922 3 -.23667 .12339 .079 -.5055 .0322 4 -.21000 .12339 .115 -.4789 .0589 5 -.33333* .12339 .019 -.6022 -.0645 6 .08333 .12339 .512 -.1855 .3522
3 1 .16000 .12339 .219 -.1089 .4289 2 .23667 .12339 .079 -.0322 .5055 4 .02667 .12339 .833 -.2422 .2955 5 -.09667 .12339 .449 -.3655 .1722 6 .32000* .12339 .024 .0511 .5889
4 1 .13333 .12339 .301 -.1355 .4022 2 .21000 .12339 .115 -.0589 .4789 3 -.02667 .12339 .833 -.2955 .2422
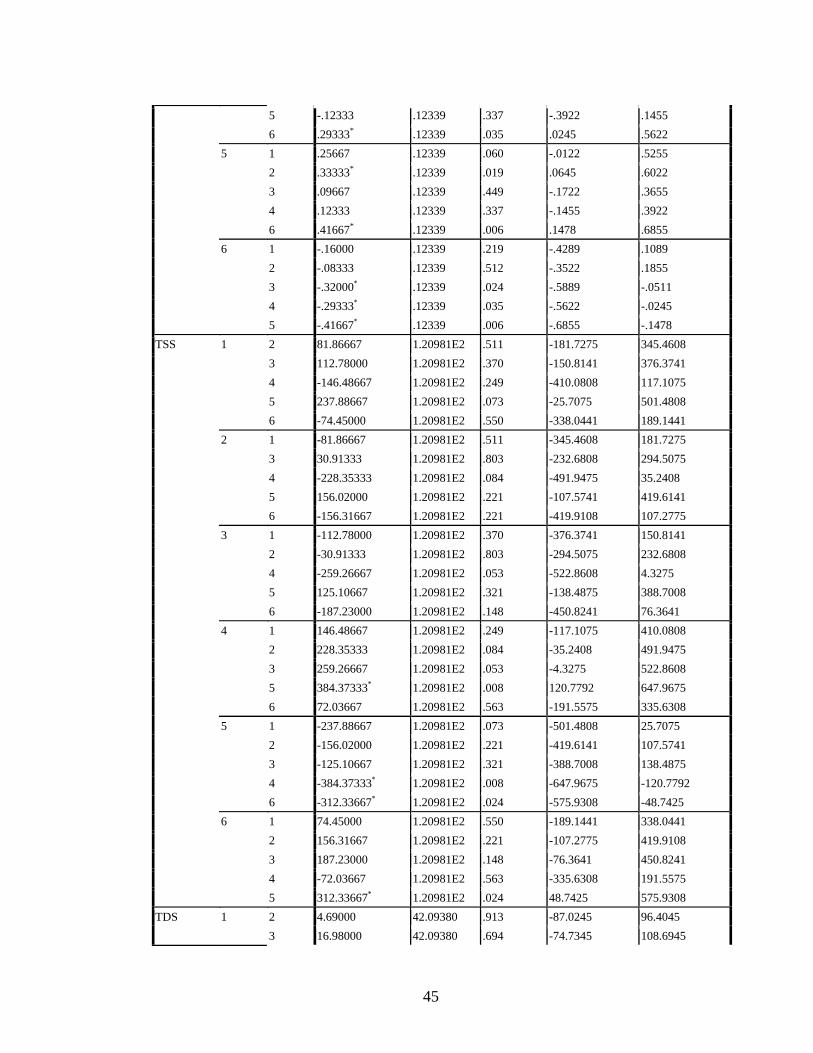
45
5 -.12333 .12339 .337 -.3922 .1455 6 .29333* .12339 .035 .0245 .5622
5 1 .25667 .12339 .060 -.0122 .5255 2 .33333* .12339 .019 .0645 .6022 3 .09667 .12339 .449 -.1722 .3655 4 .12333 .12339 .337 -.1455 .3922 6 .41667* .12339 .006 .1478 .6855
6 1 -.16000 .12339 .219 -.4289 .1089 2 -.08333 .12339 .512 -.3522 .1855 3 -.32000* .12339 .024 -.5889 -.0511 4 -.29333* .12339 .035 -.5622 -.0245 5 -.41667* .12339 .006 -.6855 -.1478
TSS 1 2 81.86667 1.20981E2 .511 -181.7275 345.4608 3 112.78000 1.20981E2 .370 -150.8141 376.3741 4 -146.48667 1.20981E2 .249 -410.0808 117.1075 5 237.88667 1.20981E2 .073 -25.7075 501.4808 6 -74.45000 1.20981E2 .550 -338.0441 189.1441
2 1 -81.86667 1.20981E2 .511 -345.4608 181.7275 3 30.91333 1.20981E2 .803 -232.6808 294.5075 4 -228.35333 1.20981E2 .084 -491.9475 35.2408 5 156.02000 1.20981E2 .221 -107.5741 419.6141 6 -156.31667 1.20981E2 .221 -419.9108 107.2775
3 1 -112.78000 1.20981E2 .370 -376.3741 150.8141 2 -30.91333 1.20981E2 .803 -294.5075 232.6808 4 -259.26667 1.20981E2 .053 -522.8608 4.3275 5 125.10667 1.20981E2 .321 -138.4875 388.7008 6 -187.23000 1.20981E2 .148 -450.8241 76.3641
4 1 146.48667 1.20981E2 .249 -117.1075 410.0808 2 228.35333 1.20981E2 .084 -35.2408 491.9475 3 259.26667 1.20981E2 .053 -4.3275 522.8608 5 384.37333* 1.20981E2 .008 120.7792 647.9675 6 72.03667 1.20981E2 .563 -191.5575 335.6308
5 1 -237.88667 1.20981E2 .073 -501.4808 25.7075 2 -156.02000 1.20981E2 .221 -419.6141 107.5741 3 -125.10667 1.20981E2 .321 -388.7008 138.4875 4 -384.37333* 1.20981E2 .008 -647.9675 -120.7792 6 -312.33667* 1.20981E2 .024 -575.9308 -48.7425
6 1 74.45000 1.20981E2 .550 -189.1441 338.0441 2 156.31667 1.20981E2 .221 -107.2775 419.9108 3 187.23000 1.20981E2 .148 -76.3641 450.8241 4 -72.03667 1.20981E2 .563 -335.6308 191.5575 5 312.33667* 1.20981E2 .024 48.7425 575.9308
TDS 1 2 4.69000 42.09380 .913 -87.0245 96.4045 3 16.98000 42.09380 .694 -74.7345 108.6945
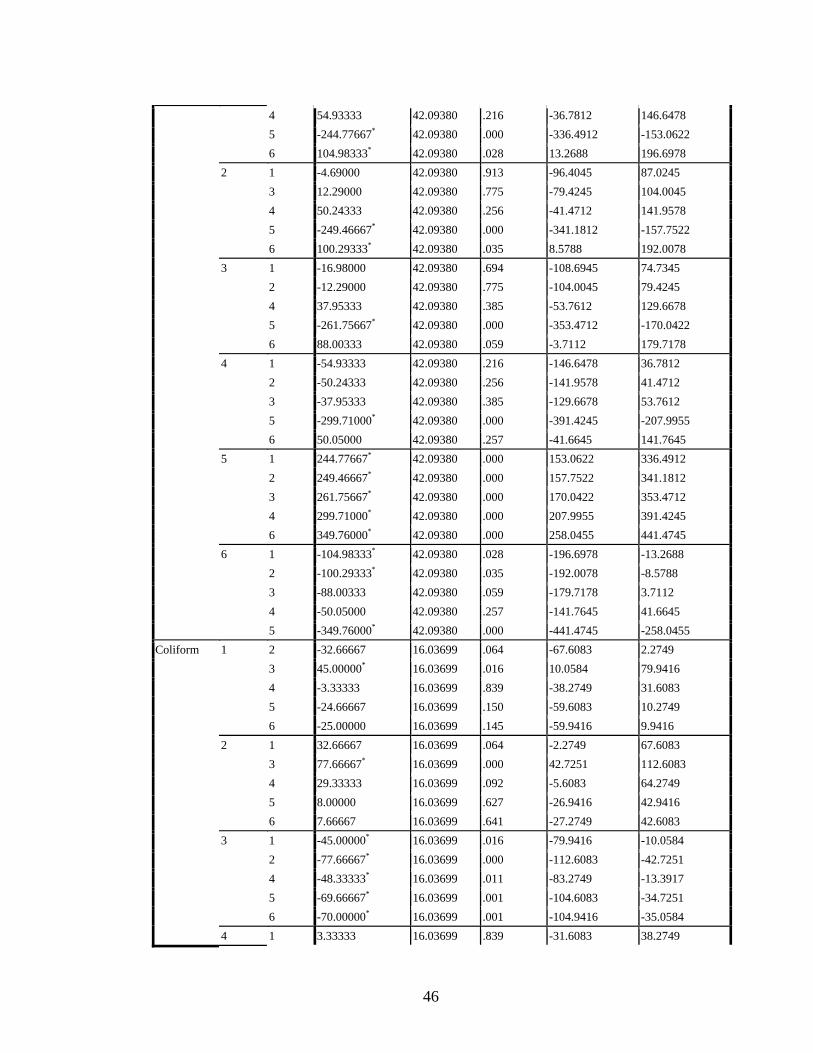
46
4 54.93333 42.09380 .216 -36.7812 146.6478 5 -244.77667* 42.09380 .000 -336.4912 -153.0622 6 104.98333* 42.09380 .028 13.2688 196.6978
2 1 -4.69000 42.09380 .913 -96.4045 87.0245 3 12.29000 42.09380 .775 -79.4245 104.0045 4 50.24333 42.09380 .256 -41.4712 141.9578 5 -249.46667* 42.09380 .000 -341.1812 -157.7522 6 100.29333* 42.09380 .035 8.5788 192.0078
3 1 -16.98000 42.09380 .694 -108.6945 74.7345 2 -12.29000 42.09380 .775 -104.0045 79.4245 4 37.95333 42.09380 .385 -53.7612 129.6678 5 -261.75667* 42.09380 .000 -353.4712 -170.0422 6 88.00333 42.09380 .059 -3.7112 179.7178
4 1 -54.93333 42.09380 .216 -146.6478 36.7812 2 -50.24333 42.09380 .256 -141.9578 41.4712 3 -37.95333 42.09380 .385 -129.6678 53.7612 5 -299.71000* 42.09380 .000 -391.4245 -207.9955 6 50.05000 42.09380 .257 -41.6645 141.7645
5 1 244.77667* 42.09380 .000 153.0622 336.4912 2 249.46667* 42.09380 .000 157.7522 341.1812 3 261.75667* 42.09380 .000 170.0422 353.4712 4 299.71000* 42.09380 .000 207.9955 391.4245 6 349.76000* 42.09380 .000 258.0455 441.4745
6 1 -104.98333* 42.09380 .028 -196.6978 -13.2688 2 -100.29333* 42.09380 .035 -192.0078 -8.5788 3 -88.00333 42.09380 .059 -179.7178 3.7112 4 -50.05000 42.09380 .257 -141.7645 41.6645 5 -349.76000* 42.09380 .000 -441.4745 -258.0455
Coliform 1 2 -32.66667 16.03699 .064 -67.6083 2.2749 3 45.00000* 16.03699 .016 10.0584 79.9416 4 -3.33333 16.03699 .839 -38.2749 31.6083 5 -24.66667 16.03699 .150 -59.6083 10.2749 6 -25.00000 16.03699 .145 -59.9416 9.9416
2 1 32.66667 16.03699 .064 -2.2749 67.6083 3 77.66667* 16.03699 .000 42.7251 112.6083 4 29.33333 16.03699 .092 -5.6083 64.2749 5 8.00000 16.03699 .627 -26.9416 42.9416 6 7.66667 16.03699 .641 -27.2749 42.6083
3 1 -45.00000* 16.03699 .016 -79.9416 -10.0584 2 -77.66667* 16.03699 .000 -112.6083 -42.7251 4 -48.33333* 16.03699 .011 -83.2749 -13.3917 5 -69.66667* 16.03699 .001 -104.6083 -34.7251 6 -70.00000* 16.03699 .001 -104.9416 -35.0584
4 1 3.33333 16.03699 .839 -31.6083 38.2749
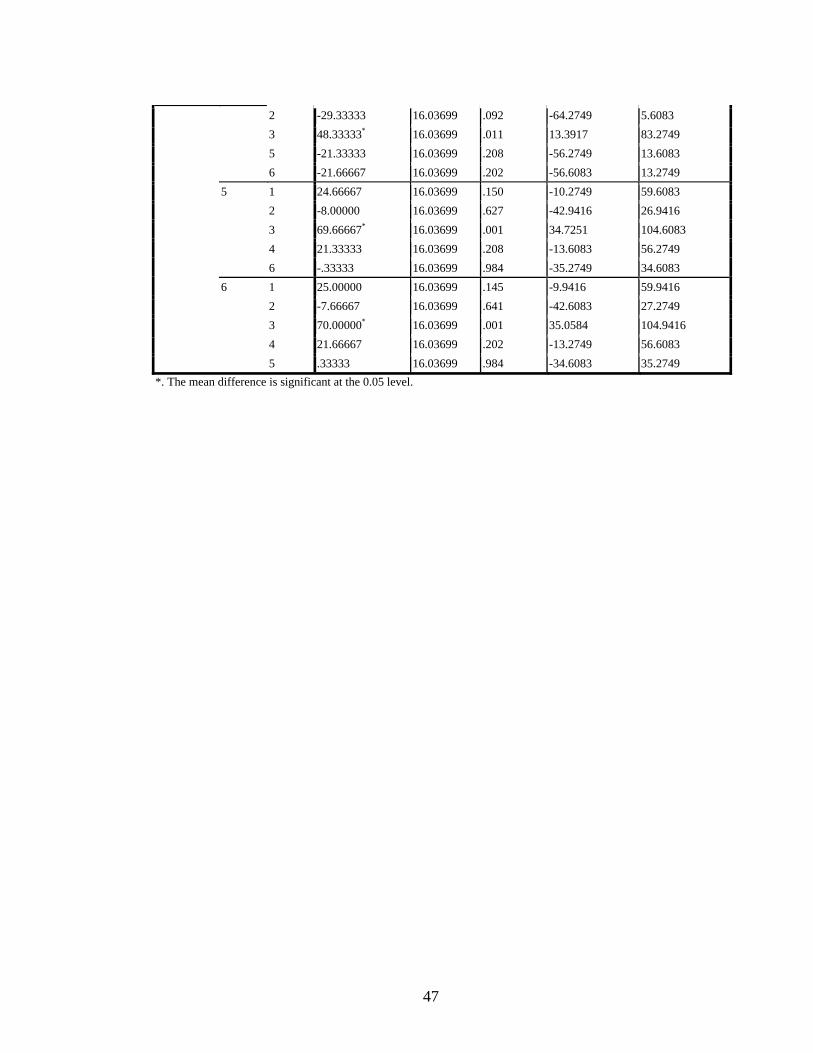
47
2 -29.33333 16.03699 .092 -64.2749 5.6083 3 48.33333* 16.03699 .011 13.3917 83.2749 5 -21.33333 16.03699 .208 -56.2749 13.6083 6 -21.66667 16.03699 .202 -56.6083 13.2749
5 1 24.66667 16.03699 .150 -10.2749 59.6083 2 -8.00000 16.03699 .627 -42.9416 26.9416 3 69.66667* 16.03699 .001 34.7251 104.6083 4 21.33333 16.03699 .208 -13.6083 56.2749 6 -.33333 16.03699 .984 -35.2749 34.6083
6 1 25.00000 16.03699 .145 -9.9416 59.9416 2 -7.66667 16.03699 .641 -42.6083 27.2749 3 70.00000* 16.03699 .001 35.0584 104.9416 4 21.66667 16.03699 .202 -13.2749 56.6083 5 .33333 16.03699 .984 -34.6083 35.2749
*. The mean difference is significant at the 0.05 level.
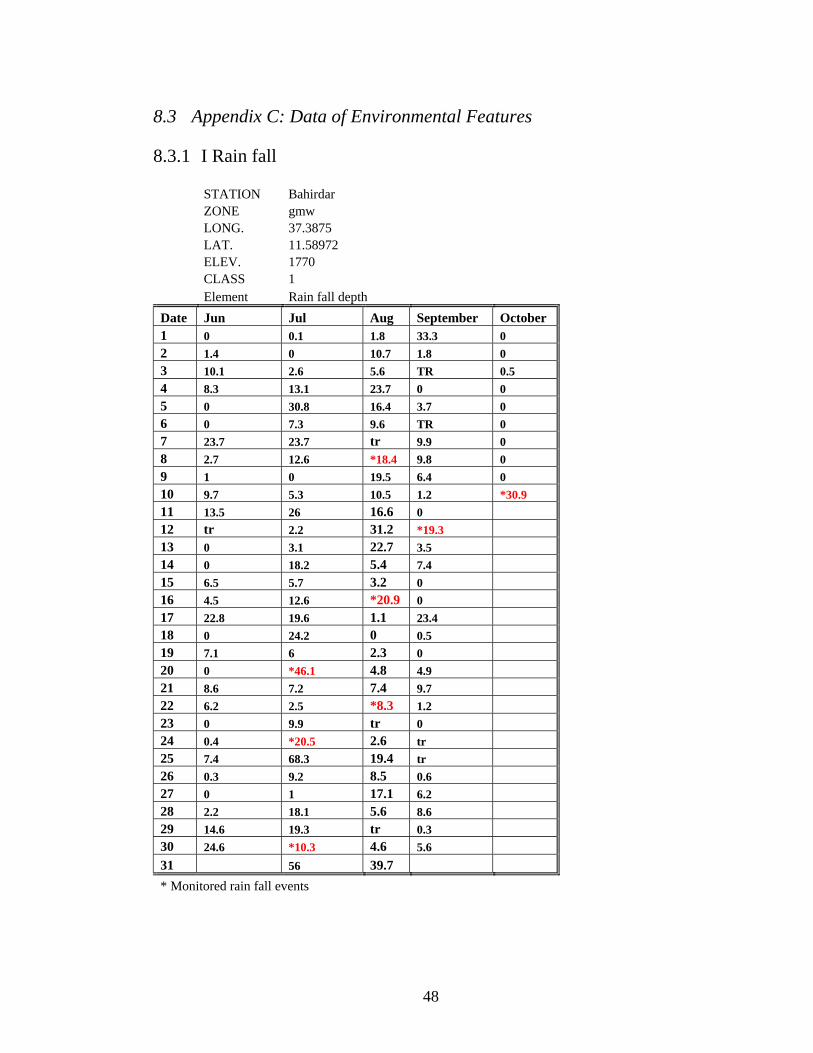
48
8.3 Appendix C: Data of Environmental Features 8.3.1 I Rain fall
STATION Bahirdar ZONE gmw LONG. 37.3875 LAT. 11.58972 ELEV. 1770 CLASS 1 Element Rain fall depth Date Jun Jul Aug September October 1 0 0.1 1.8 33.3 0 2 1.4 0 10.7 1.8 0 3 10.1 2.6 5.6 TR 0.5 4 8.3 13.1 23.7 0 0 5 0 30.8 16.4 3.7 0 6 0 7.3 9.6 TR 0 7 23.7 23.7 tr 9.9 0 8 2.7 12.6 *18.4 9.8 0 9 1 0 19.5 6.4 0 10 9.7 5.3 10.5 1.2 *30.9 11 13.5 26 16.6 0 12 tr 2.2 31.2 *19.3 13 0 3.1 22.7 3.5 14 0 18.2 5.4 7.4 15 6.5 5.7 3.2 0 16 4.5 12.6 *20.9 0 17 22.8 19.6 1.1 23.4 18 0 24.2 0 0.5 19 7.1 6 2.3 0 20 0 *46.1 4.8 4.9 21 8.6 7.2 7.4 9.7 22 6.2 2.5 *8.3 1.2 23 0 9.9 tr 0 24 0.4 *20.5 2.6 tr 25 7.4 68.3 19.4 tr 26 0.3 9.2 8.5 0.6 27 0 1 17.1 6.2 28 2.2 18.1 5.6 8.6 29 14.6 19.3 tr 0.3 30 24.6 *10.3 4.6 5.6 31 56 39.7 * Monitored rain fall events