Embed Size (px)
Citation preview
THE IMPACT OF URBAN LAND TAXATION
1
THE IMPACT OF URBANLAND TAXATION: THEPITTSBURGHEXPERIENCEWALLACE E. OATES * & ROBERT M.SCHWAB **
Abstract - In 1979–80, the city ofPittsburgh restructured its property taxsystem by raising the rate on land tomore than five times the rate onstructures. This paper explores theimpact of this tax reform on theeconomic development of the city.Following some background on thetheory of land taxation and Pittsburgh’shistorical setting, the paper presents anempirical analysis of the impact of thetax reform. Pittsburgh experienced inthe 1980s a dramatic increase in buildingactivity, far in excess of other cities inthe region. The analysis suggests that,while a shortage of commercial spacewas a primary driving force behind theexpansion, the reliance on increasedland taxation played an importantsupporting role by enabling the city toavoid rate increases in other taxes thatcould have impeded development.
INTRODUCTION
Land-value taxation occupies a curiousplace in the lexicon of public finance. Ithas a long and rich history among bothtax theorists and reformers who haveextolled its properties on grounds ofeconomic efficiency and equity. And itstill commands a certain respect andinterest on the part of both scholars andpractitioners. Yet it has not been widelyused, and public-finance economists donot have a good sense of its realpotential as an effective form oftaxation. Even so, it is under seriousconsideration as a revenue instrumentamong both hard-pressed city mayorsand, more surprisingly perhaps, emerg-ing governments in transition fromsocialism to market-oriented economies.1
There is, in the United States, a singlecase of major reliance on land taxationin a large city: the city of Pittsburgh in1979 and 1980 restructured its propertytax system to one in which land is taxedat more than five times the rate onstructures. With the passing of morethan 15 years, we are now in a positionto explore the effects that this taxreform has had on economic activity inthe city and metropolitan area.
*Department of Economics, University of Maryland, College
Park, MD 20742 and Resources for the Future, Washington,
D.C. 20036.**Department of Economics, University of Maryland, College
Park, MD 20742.
NATIONAL TAX JOURNAL VOL. L NO. 1
2
To assess this experience, it is essentialto have a clear understanding of thetheory of land-value taxation. There has,in fact, been some recent theoreticalwork that raises the possibility that land-value taxation need not be neutral in itseffects, as the standard theory main-tains. In the next section of the paper,we will review the theory of landtaxation to provide the conceptualcontext for our study of the Pittsburghexperience.
In the succeeding sections, we turn to adescription and analysis of the Pitts-burgh experiment with land-valuetaxation. The findings, taken at facevalue, are dramatic. Relative to 14 othercities in our sample, Pittsburgh is astriking outlier: it is the only city to haveexperienced a large and significantincrease in levels of building activityduring the 1980s. The interpretation ofthese basic findings is, however,complicated. There were other things,including a major urban renewalprogram, underway during this sameperiod. And it is hard to separate theeffects of tax reform from othereconomic events. But the alternative issimply to ignore this interesting episodein fiscal history—and this, it seems tous, would be a mistake.
To address the impact of land-valuetaxation in Pittsburgh, we have under-taken a careful study of the history ofthe Pittsburgh economy and the specificcharacter of the tax reform. These, wewill argue, are critical to a properinterpretation of the Pittsburgh experi-ence. To carry out the quantitativeanalysis, we have assembled twoindependent bodies of data on levels ofbuilding activity in Pittsburgh and in asample of other cities in the region.Each has its strengths and weaknesses.The first is a lengthy time series coveringthe period 1960–89, whose source is
Dun and Bradstreet figures on the valueof new building permits. The attractionof these data is their coverage overtime; they are, however, limited to thecity itself and provide no disaggregationamong different types of buildingactivity. The second set of data, whichwe have pulled together from U.S.Bureau of the Census sources, providescoverage for the entire metropolitanarea, broken down by city and suburbsand also disaggregated by type ofbuilding activity. Its coverage over timeis, however, more limited: 1974–89.Although the two data bases exhibit, incertain instances, some puzzlingdifferences, they yield much the samepicture of the Pittsburgh experiencerelative to the other cities in the region.
The analysis of these data, in thecontext of some other key economicvariables, suggests to us that thePittsburgh tax reform, properly under-stood, has played a significant support-ive role in the economic resurgence ofthe city. We shall work through anumber of pieces of evidence that leadus to this conclusion.
THE THEORY OF LAND TAXATION
Proponents of land-value taxation havecited a number of its appealing proper-ties, one of which is its neutrality withrespect to land use. As Netzer (1966)put it, “Location rents constitute asurplus, and taxing them will not reducethe supply of sites offered; instead, thesite value tax will be entirely neutralwith regard to landowners’ decisions,since no possible response to the taxcan improve the situation, assumingthat landowners have been makingmaximum use of their sites prior to theimposition of the tax” (pp. 204–5).
Conventional property taxation, incontrast, involves the taxation of both
THE IMPACT OF URBAN LAND TAXATION
3
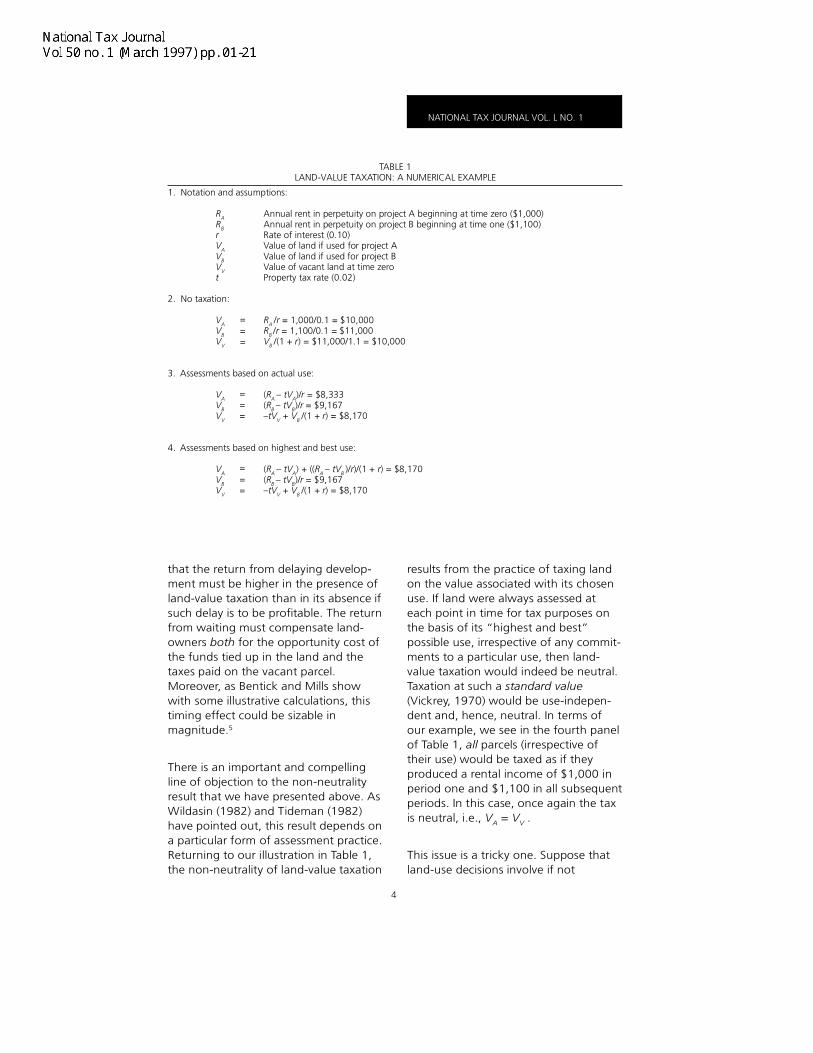
We present in Table 1 a simple numeri-cal example. The initial conditionsdescribe an equilibrium in land-usedecisions in the absence of any taxa-tion. Each landowner is indifferentbetween (1) development at the currenttime (use A) with a stream of rentalincome in perpetuity of $1,000 perperiod, or (2) waiting one period andemploying use B to receive a rent perperiod of $1,100. The present value ofeach of these alternatives is $10,000 atthe assumed rate of interest of tenpercent, i.e., VA = Vv .
Suppose we introduce a tax on landrents of 20 percent. The effect of thistax is simply to reduce the net rents oneach use, and hence the present valueof land in each use, by 20 percent. Thetax clearly has no allocative effects onland-use decisions. A tax on land rents isthus a neutral tax: its sole effect is toreduce the value of land holdings.4
Thus, once again we find VA = VV .
Now suppose we introduce a tax onland values of two percent. The impactof this tax depends crucially on the wayland is assessed. In the third panel ofTable 1, we assume that land is taxedaccording to its current use. Thus, forexample, land once developed for use Ais always taxed based on its value in useA. Here, we find that the tax depressesthe present value of use B relative tothat of use A, and hence will encouragea flow of land out of future use B andinto current use A. The rationale for thisresult is clear from the arithmetic. Underland-value taxation, future rentalincome manifests itself in current land-values with the result that future rentsare effectively taxed in advance of theirreceipt. As Bentick (1979) and Mills(1981) showed, this is equivalent toraising the rate of discount by theamount of the tax rate on land. Itimposes, in a sense, a tax on waiting so
land and improvements to the land; suchtaxes, as has long been recognized, areclearly not neutral as they place a levy onany structures on the land. A shift fromproperty to land taxation (or the move-ment to a “graded” tax system underwhich land is taxed at a higher rate thanthe structures on the land) will reducethe “penalty” on improvements andencourage more intensive land use.Brueckner (1986) has demonstrated thisproposition in a rigorous static analysis:the replacement of taxes on structures bylevies on land-value will result in a higherlevel of improvements to the land (i.e., ahigher capital-land ratio). We will refer tothis as the capital-intensity effect.2
In an intertemporal setting, land-valuetaxation can have a different sort ofeffect (apart from any tax on structures).In two interesting papers, Bentick (1979)and Mills (1981) have shown that land-value taxation need not be neutral withrespect to the timing and nature of landdevelopment. In particular, the taxing ofland-values may distort the choicebetween earlier and later developmentof unused land parcels in favor of thoseprojects that promise an earlier streamof net receipts. The implication of theirmodels is that a movement in thedirection of land taxation may hasteneconomic development, perhaps to anextent that is excessive on purelyefficiency grounds. This effect, however,depends upon an important andcontroversial assumption concerning theway in which land is valued for taxpurposes. Where this assumption issatisfied, land-value taxation can havewhat we will call a timing effect.
For purposes of exposition here, we willsimply work through an illustrative caseof land taxation. Since the capital-intensity effect is well understood, weshall focus our attention on the timingeffect.3
NATIONAL TAX JOURNAL VOL. L NO. 1
4
that the return from delaying develop-ment must be higher in the presence ofland-value taxation than in its absence ifsuch delay is to be profitable. The returnfrom waiting must compensate land-owners both for the opportunity cost ofthe funds tied up in the land and thetaxes paid on the vacant parcel.Moreover, as Bentick and Mills showwith some illustrative calculations, thistiming effect could be sizable inmagnitude.5
There is an important and compellingline of objection to the non-neutralityresult that we have presented above. AsWildasin (1982) and Tideman (1982)have pointed out, this result depends ona particular form of assessment practice.Returning to our illustration in Table 1,the non-neutrality of land-value taxation
results from the practice of taxing landon the value associated with its chosenuse. If land were always assessed ateach point in time for tax purposes onthe basis of its “highest and best”possible use, irrespective of any commit-ments to a particular use, then land-value taxation would indeed be neutral.Taxation at such a standard value(Vickrey, 1970) would be use-indepen-dent and, hence, neutral. In terms ofour example, we see in the fourth panelof Table 1, all parcels (irrespective oftheir use) would be taxed as if theyproduced a rental income of $1,000 inperiod one and $1,100 in all subsequentperiods. In this case, once again the taxis neutral, i.e., VA = VV .
This issue is a tricky one. Suppose thatland-use decisions involve if not
TABLE 1LAND-VALUE TAXATION: A NUMERICAL EXAMPLE
1. Notation and assumptions:
RA Annual rent in perpetuity on project A beginning at time zero ($1,000)RB Annual rent in perpetuity on project B beginning at time one ($1,100)r Rate of interest (0.10)VA Value of land if used for project AVB Value of land if used for project BVV Value of vacant land at time zerot Property tax rate (0.02)
2. No taxation:
VA RA /r = 1,000/0.1 = $10,000VB RB /r = 1,100/0.1 = $11,000VV VB /(1 + r) = $11,000/1.1 = $10,000
3. Assessments based on actual use:
VA (RA – tVA)/r = $8,333VB (RB – tVB)/r = $9,167VV –tVV + VB /(1 + r) = $8,170
4. Assessments based on highest and best use:
VA (RA – tVA) + ((RA – tVB )/r)/(1 + r) = $8,170VB (RB – tVB)/r = $9,167VV –tVV + VB /(1 + r) = $8,170
===
===
===
THE IMPACT OF URBAN LAND TAXATION
5
permanent at least very lengthy commit-ments to a specific form of usage. AsBentick (1982) argued, if we treat usesof land as (effectively) mutually exclu-sive, then the value of land at a particu-lar time will depend upon the use towhich it has been committed (see alsoBentick and Pogue, 1988). Much clearlydepends here on existing assessmentpractices: to the extent that the as-sessed value of parcels reflects decisionsas to their use, the timing effectbecomes potentially important. Thissuggests that any study of the actualeffects of land taxation must pay carefulattention to existing assessmentprocedures.6
To conclude our discussion of timingeffects, we note that the literature hassuggested two additional ways in whichland-value taxation hastens the develop-ment of unused parcels, one of whichwe think is probably of minor impor-tance and the other of which involvesan outright error. The first is the“liquidity effect.” Since land-valuetaxation requires the paying of taxes inadvance of any income from land to bedeveloped in the future, there can exist,in circumstances of constrained accessto credit markets, a cash-flow incentivefor premature development of unusedland parcels. But so long as land ownerseither have their own financial reservesor access to credit, such an effect shouldnot be of much importance. In thisregard, Bourassa (1990), in a recentempirical study of land-value taxationand housing development in threePennsylvania cities (including Pitts-burgh), was unable to find any evidenceof such a liquidity effect.
Second, one finds in the more popularliterature the claim that land-valuetaxation encourages earlier develop-ment of vacant land parcels by placing apenalty on undeveloped property. This is
simply incorrect. Land-value taxes placethe same penalty on land regardless ofwhether it is developed; indeed, it is forthis reason that the tax is neutral.7 Insum, if land assessments are not basedon actual use and if liquidity effects areunimportant, then land-value taxation isneutral: it will in itself have no directeffects on either the form or timing ofdevelopment of unused land parcels.
Finally, we raise a conceptual issue thatis critical for the interpretation of therole of land-value taxation in Pittsburgh.The analysis of a new tax (or an increasein an existing tax) can proceed in eitherof two ways (see Musgrave, 1959, ch.10). The increased revenues can becoupled with an expansion in the size ofthe public budget in which case we aredealing with a balanced-budget fiscalchange. In this case, the overall fiscaleffect depends both on the change inpublic expenditure and the effects ofthe change in taxes. Alternatively, wecan view an increase in one tax asproviding revenues that substitute forrevenues from an alternative sourcewith the size of the budget heldconstant. For such a case of differentialtax analysis, we compare the effects ofthe actual tax change relative to thoseof the revenue alternatives. It is impor-tant, as we shall see later, to realize thatthe Pittsburgh case involves mainly anexercise in differential tax analysis, forthe increase in the rate of land-valuetaxation was adopted as an alternativeto other proposed taxes.8
PITTSBURGH: THE SETTING AND FISCALREFORM9
In order to understand the effects ofland-value taxation in Pittsburgh, it isimportant to place this tax reform in thecontext of the ongoing economicevolution of the city and metropolitanarea. Pittsburgh has been undergoing a
NATIONAL TAX JOURNAL VOL. L NO. 1
6
very basic and far-reaching process ofeconomic transition. The economic coreof the city in the late nineteenth andearly twentieth centuries was its manu-facturing base with a heavy concentra-tion of steel mills. In recent decades,however, the Pittsburgh economy hasshifted away from this heavy reliance onmanufacturing toward a more white-collar oriented economic structure basedon light manufacturing and services. In1940, manufacturing employment inthe four-county Pittsburgh MetropolitanStatistical Area (MSA) accounted foralmost half of the total work force; in1981, manufacturing employmentconstituted less than one-quarter oftotal employment. And by 1985,manufacturing employment was downto only 16 percent of total employment.
As in many other major U.S. cities, thePittsburgh population has declinedsharply: the city’s population fell from ahigh of over 700,000 in 1950 to about400,000 in 1980. This reflected largely aprocess of suburbanization, with thetotal population of the metropolitanarea remaining roughly the same.Pittsburgh grew in its early years by aprocess of annexation and consolida-tion. However, there has been virtuallyno further annexation or consolidationsince World War II; suburban townshipshave retained their independence.
Pittsburgh has undergone a strikingprocess of urban renewal. This began inthe 1940s with Renaissance I, a majoreffort to clean up the environment ofthe city and to revitalize the centralbusiness district. Based on a series ofprojects involving a public-privatepartnership, Pittsburgh made majoradvances in cleaning up air quality, inflood control (which had been a realproblem with periodic heavy flooding ofthe central business district (CBD), andin the construction of new office
buildings in the Golden Triangle. It isinteresting that these efforts received amajor impetus from a severe shortage ofoffice space; from 1945 through 1952,Pittsburgh’s office occupancy rate was99 percent. Under the rubric of anUrban Redevelopment Authority (URA),the city’s political and business leaderslaunched a series of major constructionprojects that resulted in new officebuildings, parks, and some luxuryapartments. One-fourth of Pittsburgh’sdowntown was rebuilt within ten years.
Following an “interlude” characterizedby economic travails associated with thecontinuing collapse of the steel industryand mounting fiscal pressures, Pitts-burgh launched a new renewal effort inthe late 1970s: Renaissance II. Asbefore, the renewal effort involved anextensive partnership between publicand private agents, with a major focuson continued development of thecentral business district. Interestingly,this effort also seems to have beenencouraged by a severe shortage ofoffice space: occupancy rates of cityoffice space were again at the 99percent level in 1980. Several majorcorporations decided to expand theirheadquarters in Pittsburgh and, withpublic assistance, constructed a series ofmajor office complexes. The result was astriking surge in levels of commercialconstruction activity: there werecommercial contract awards in 1980 for9.5 million square feet of new spacewith (as we shall see) continued highlevels of building activity through mostof the decade.10
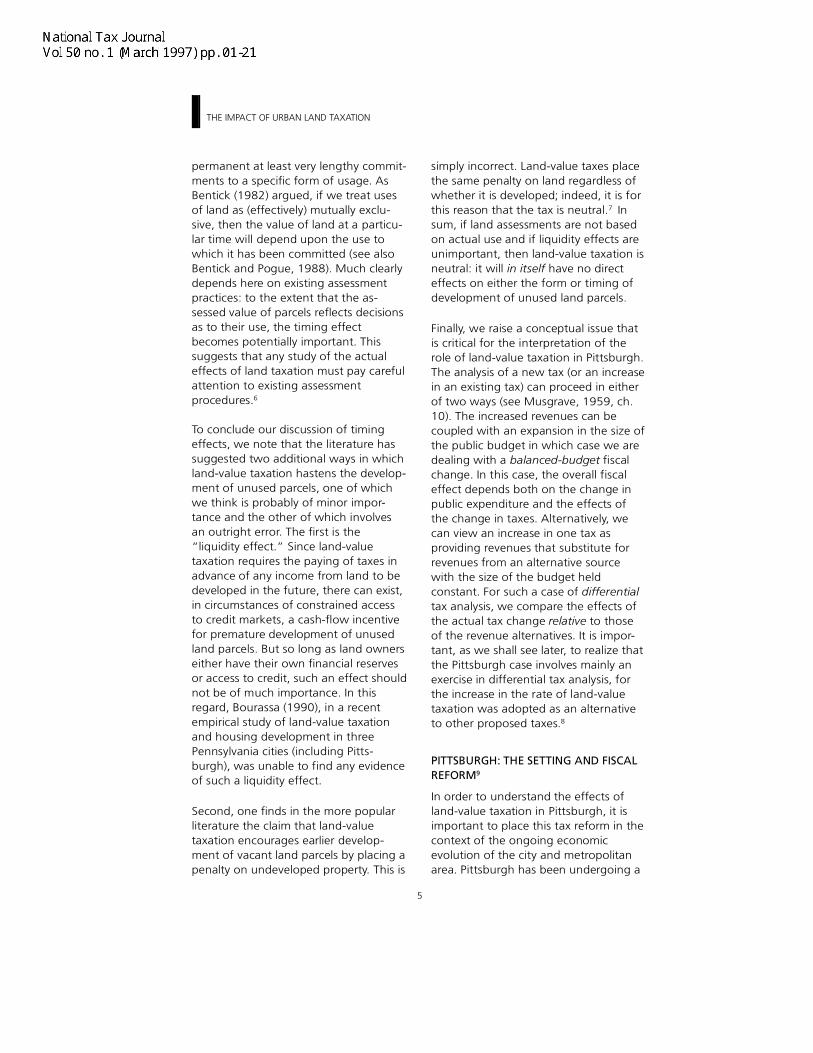
Pittsburgh, along with a handful ofsmaller cities in Pennsylvania, has had agraded property tax system in place formany decades, a system under whichland was taxed at a rate twice that ofthe structures on the land until 1979. AsTable 2 indicates, Pittsburgh introduced
THE IMPACT OF URBAN LAND TAXATION
7
a striking restructuring of the city’sproperty tax in 1979 and 1980, raisingthe tax rate on land to about five timesthe rate on structures. This increased“tilt” of rates has been maintained andeven increased slightly during thedecade following the restructuring. Wenote that the assessment-sales ratio inPittsburgh is 0.25 so that the nominaltax rates appearing in Table 2 must bedivided by four to obtain measures ofeffective tax rates.
Two aspects of this tax reform areparticularly important. First, we see inTable 2 that properties in the city ofPittsburgh are subject to taxation notonly by the city government, but also bythe county and the overlying schooldistrict. These latter two jurisdictions donot participate in the graded tax system:they employ a conventional property taxthat applies the same tax rate to land
and structures. As the last column of thetable indicates, this results in total taxrates on land in the city of Pittsburghthat are something more than twice therates on structures. Properties outsidethe city are, in contrast, subject toconventional property taxation.
Second, Table 2 suggests that the taxreform in 1979–80 involved raising therate on land while holding constant therate on structures. This is, however,misleading. What the table fails toreveal is that generous tax abatementswere granted for new construction,both commercial and residential, in thecity. Under these abatements, the citydid not tax the additional value fromnew construction for the first threeyears (Weir and Peters, 1986). The taxsavings amounted to several milliondollars. In addition, the URA offered lowinterest loans for commercial and
TABLE 2PROPERTY TAX RATES, CITY OF PITTSBURGH 1972–91
1972 53.0 26.5 15.5 23 91.5 65.0 1411973 51.0 25.5 15.5 23 89.5 64.0 1401974 51.0 25.5 15.5 23 89.5 64.0 1401975 49.5 24.75 15.5 23 88.0 63.25 1391976 49.5 24.75 15.5 29 94.0 69.25 1361977 49.5 24.75 21.375 29 99.875 75.125 1331978 49.5 24.75 21.375 29 99.875 75.125 1331979 97.5 24.75 19.365 29 145.865 73.115 2001980 125.5 24.75 23.0 29 177.5 76.75 2311981 125.5 24.75 28.0 41 194.5 93.75 2071982 133.0 32.0 29.0 36 198.0 97.0 2041983 151.5 27.0 29.0 36 216.5 92.0 2351984 151.5 27.0 29.0 40 220.5 96.0 2301985 151.5 27.0 29.0 40 220.5 96.0 2301986 151.5 27.0 31.25 40 222.75 98.25 2271987 151.5 27.0 31.25 46 228.75 104.25 2191988 151.5 27.0 31.25 46 228.75 104.25 2191989 151.5 27.0 35.0 46 232.5 108.0 2151990 184.5 32.0 36.5 46 267.0 114.5 2331991 36.5 46 267.0 114.5 233
Source: Office of the City Controller, City of Pittsburgh.Note: The tax rates in this table are nominal rates. The assessment-sales ratio in Pittsburgh is 0.25; thus, effectivetax rates are one-quarter of the nominal rates.
(a)
Land TaxRate
(Mills)
(b)
StructureTax Rate(Mills)
(c)
CountyTax Rate(Mills)
(d)SchoolDistrict
Tax Rate(Mills)Fiscal Year
(e)
Total LandTax Rate(Mills)
(f)Total
StructureTax Rate(Mills)
(g)
(e) as aPercent of
(f)
184.5 32.0
NATIONAL TAX JOURNAL VOL. L NO. 1
8
residential rehabilitation and construc-tion. Finally, it is worth noting that newfederal programs, notably the EconomicRecovery Tax Act of 1981, providedimportant incentives for the renovationof old structures by providing acceler-ated depreciation and tax credits. Taxreform in Pittsburgh thus entailedraising the tax rate on land and effec-tively reducing the rate on improve-ments for new structures.
AN ANALYSIS OF THE PITTSBURGHEXPERIENCE
Before turning to our work, we notethat there have been three earlierstudies of the effects of land-valuetaxation in Pittsburgh. Pollakowski(1982) was unable to find much in theway of “adjustment effects,” asmeasured by the number of propertytransactions. However, his data ex-tended only from 1976 through 1980.Bourassa (1987) explored the effects ofPittsburgh’s tax system on housingdevelopment. Using monthly data onthe value of new residential buildingpermits as his dependent variable,Bourassa found that the tax rate onimprovements, but not the rate on land,was a statistically significant determi-nant of the level of residential buildingactivity. Bourassa’s findings, while ofsome interest, are limited in scope, for,as we shall see, the major impetus todevelopment in Pittsburgh has been inthe non-residential sector. Of morerelevance to our concerns is an interest-ing study undertaken in the mid-1980sby the Pennsylvania Economy League(1985). At the request of Mayor RichardCaliguiri, the League examined theeffects of the graded tax on both thedevelopment of the city and the equityof the tax system. Drawing both onextensive interviews with “local develop-ment experts” and some quantitativeanalysis of the graded-tax ratio and
development of different properties, theLeague concluded that “The graded taxhas very little effect on development”(p. ii). We will draw on the League’sreport at various points in our discus-sion.11
We turn now to our study. To provide abaseline for comparative purposes, wehave assembled time-series data on newbuilding activity for a sample of 15 citiesand metropolitan areas in the generalregion containing Pittsburgh (the so-called “Rust Belt”). We begin theanalysis by simply presenting somesummary data on the average annualvalue of new building permits bothbefore and after 1979–80, the time ofthe new tax measures in Pittsburgh. Asnoted in the Introduction, we have twoindependent sources of data.12
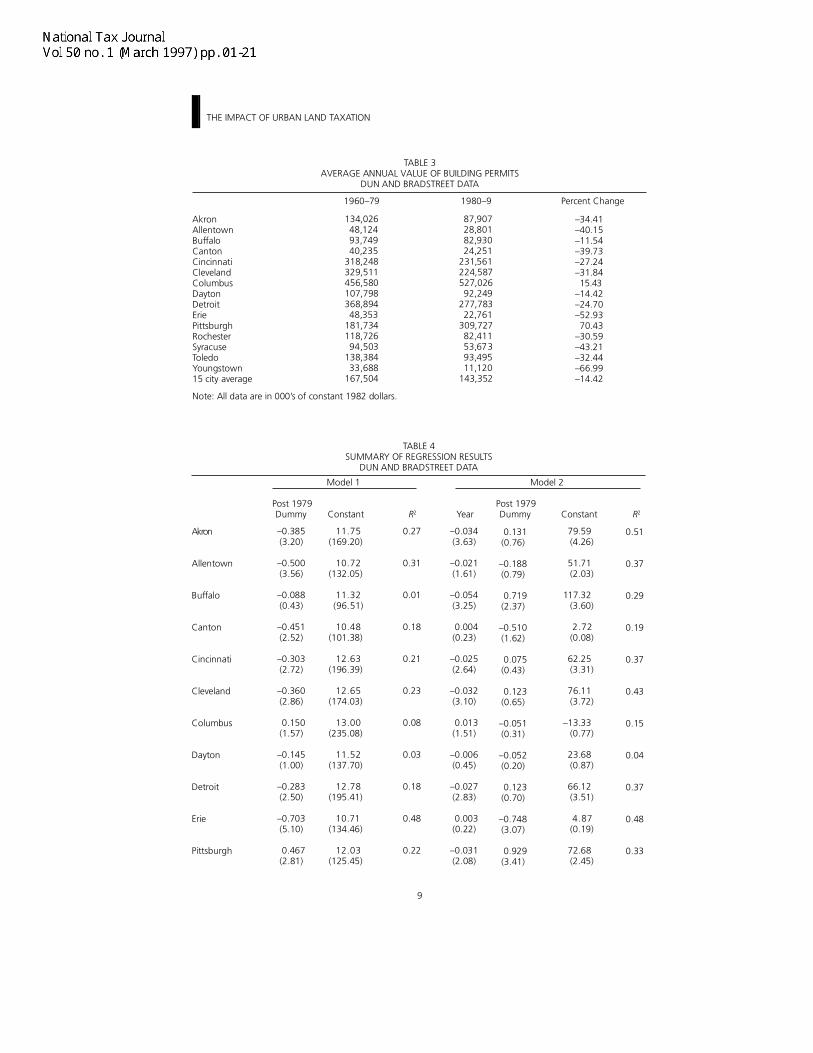
Table 3 presents figures for the realvalue of new building permits for the 15cities in our sample. We have calculatedthese figures from data provided by Dunand Bradstreet; these data extend backto 1960 but include only the city andnot the rest of the metropolitan area.The figures are quite striking: they reveala typically quite substantial decline inthe annual real level of building activityfrom the period 1960–79 to 1980–9.Only 2 of our 15 cities experienced anincrease. Columbus shows a slight rise.But Pittsburgh is a remarkable outlier;the real value of building permits on anannual basis rose by some 70 percent inthe 1980s relative to the 20-year periodpreceding the tax reform.
Table 4 provides some further analysis ofthe Dun and Bradstreet data. It presentsestimates of models in which we haveregressed the log of the Dun andBradstreet data on a constant and adummy variable with a value of one foryears 1980 and after and a value of zerofor earlier years (Model 1), or alterna-
THE IMPACT OF URBAN LAND TAXATION
9
TABLE 3AVERAGE ANNUAL VALUE OF BUILDING PERMITS
DUN AND BRADSTREET DATA
1960–79 1980–9 Percent Change
AkronAllentownBuffaloCantonCincinnatiClevelandColumbusDaytonDetroitEriePittsburghRochesterSyracuseToledoYoungstown15 city average
Note: All data are in 000’s of constant 1982 dollars.
134,02648,12493,74940,235
318,248329,511456,580107,798368,89448,353
181,734118,72694,503
138,38433,688
167,504
87,90728,80182,93024,251
231,561224,587527,02692,249
277,78322,761
309,72782,41153,67393,49511,120
143,352
–34.41–40.15–11.54–39.73–27.24–31.8415.43
–14.42–24.70–52.9370.43
–30.59–43.21–32.44–66.99–14.42
TABLE 4SUMMARY OF REGRESSION RESULTS
DUN AND BRADSTREET DATA
Model 1 Model 2
Post 1979 Post 1979Dummy Constant R2 Year Dummy Constant R2
Akron
Allentown
Buffalo
Canton
Cincinnati
Cleveland
Columbus
Dayton
Detroit
Erie
Pittsburgh
–0.385(3.20)
–0.500(3.56)
–0.088(0.43)
–0.451(2.52)
–0.303(2.72)
–0.360(2.86)
0.150(1.57)
–0.145(1.00)
–0.283(2.50)
–0.703(5.10)
0.467(2.81)
11.75(169.20)
10.72(132.05)
11.32(96.51)
10.48(101.38)
12.63(196.39)
12.65(174.03)
13.00(235.08)
11.52(137.70)
12.78(195.41)
10.71(134.46)
12.03(125.45)
0.27
0.31
0.01
0.18
0.21
0.23
0.08
0.03
0.18
0.48
0.22
–0.034(3.63)
–0.021(1.61)
–0.054(3.25)
0.004(0.23)
–0.025(2.64)
–0.032(3.10)
0.013(1.51)
–0.006(0.45)
–0.027(2.83)
0.003(0.22)
–0.031(2.08)
0.131(0.76)
–0.188(0.79)
0.719(2.37)
–0.510(1.62)
0.075(0.43)
0.123(0.65)
–0.051(0.31)
–0.052(0.20)
0.123(0.70)
–0.748(3.07)
0.929(3.41)
79.59(4.26)
51.71(2.03)
117.32(3.60)
2.72(0.08)
62.25(3.31)
76.11(3.72)
–13.33(0.77)
23.68(0.87)
66.12(3.51)
4.87(0.19)
72.68(2.45)
0.51
0.37
0.29
0.19
0.37
0.43
0.15
0.04
0.37
0.48
0.33
NATIONAL TAX JOURNAL VOL. L NO. 1
10
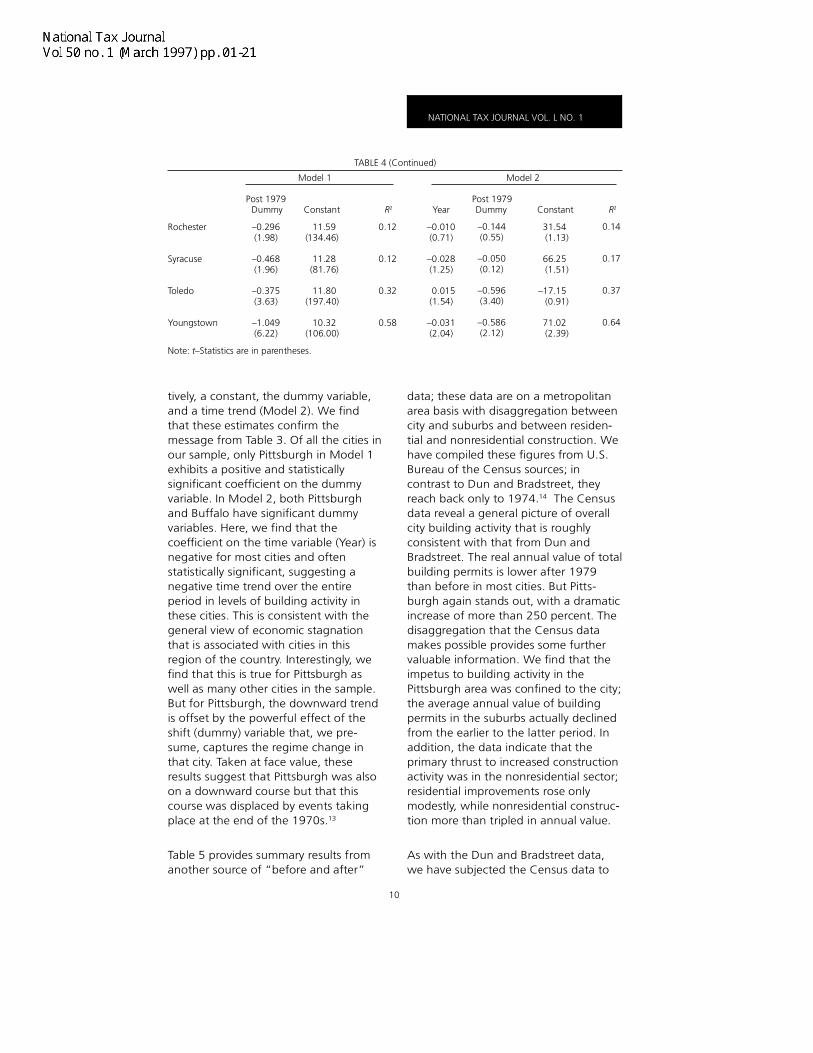
tively, a constant, the dummy variable,and a time trend (Model 2). We findthat these estimates confirm themessage from Table 3. Of all the cities inour sample, only Pittsburgh in Model 1exhibits a positive and statisticallysignificant coefficient on the dummyvariable. In Model 2, both Pittsburghand Buffalo have significant dummyvariables. Here, we find that thecoefficient on the time variable (Year) isnegative for most cities and oftenstatistically significant, suggesting anegative time trend over the entireperiod in levels of building activity inthese cities. This is consistent with thegeneral view of economic stagnationthat is associated with cities in thisregion of the country. Interestingly, wefind that this is true for Pittsburgh aswell as many other cities in the sample.But for Pittsburgh, the downward trendis offset by the powerful effect of theshift (dummy) variable that, we pre-sume, captures the regime change inthat city. Taken at face value, theseresults suggest that Pittsburgh was alsoon a downward course but that thiscourse was displaced by events takingplace at the end of the 1970s.13
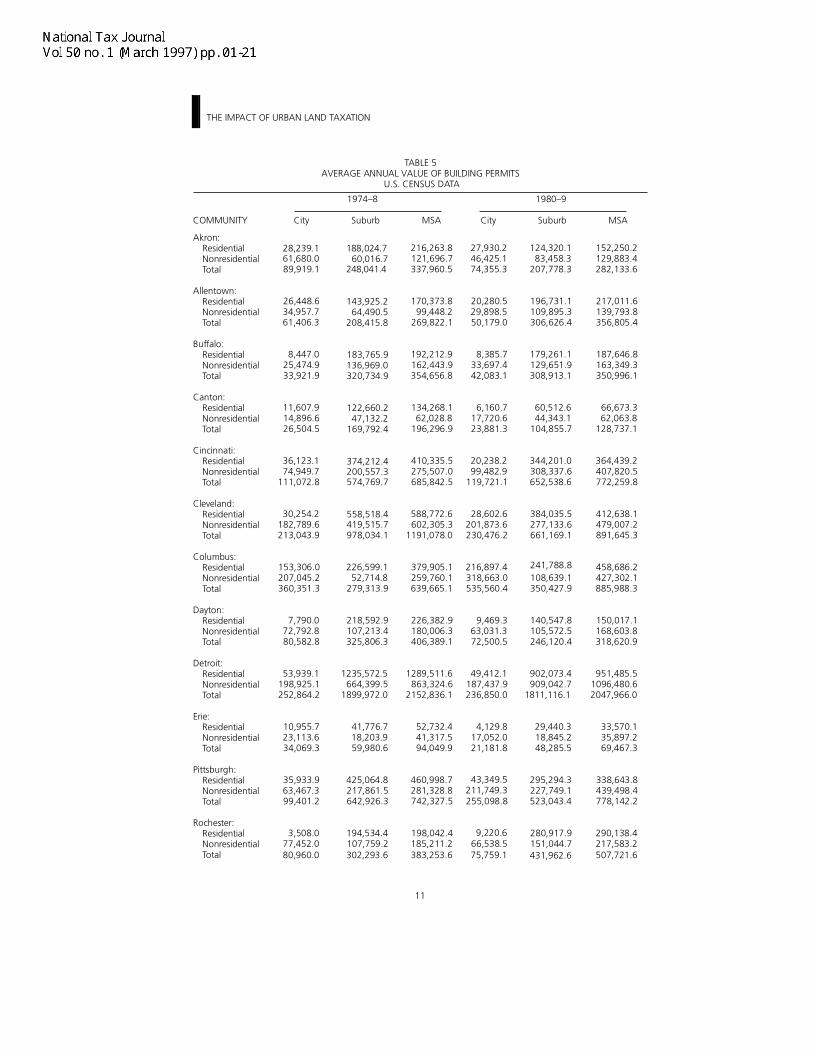
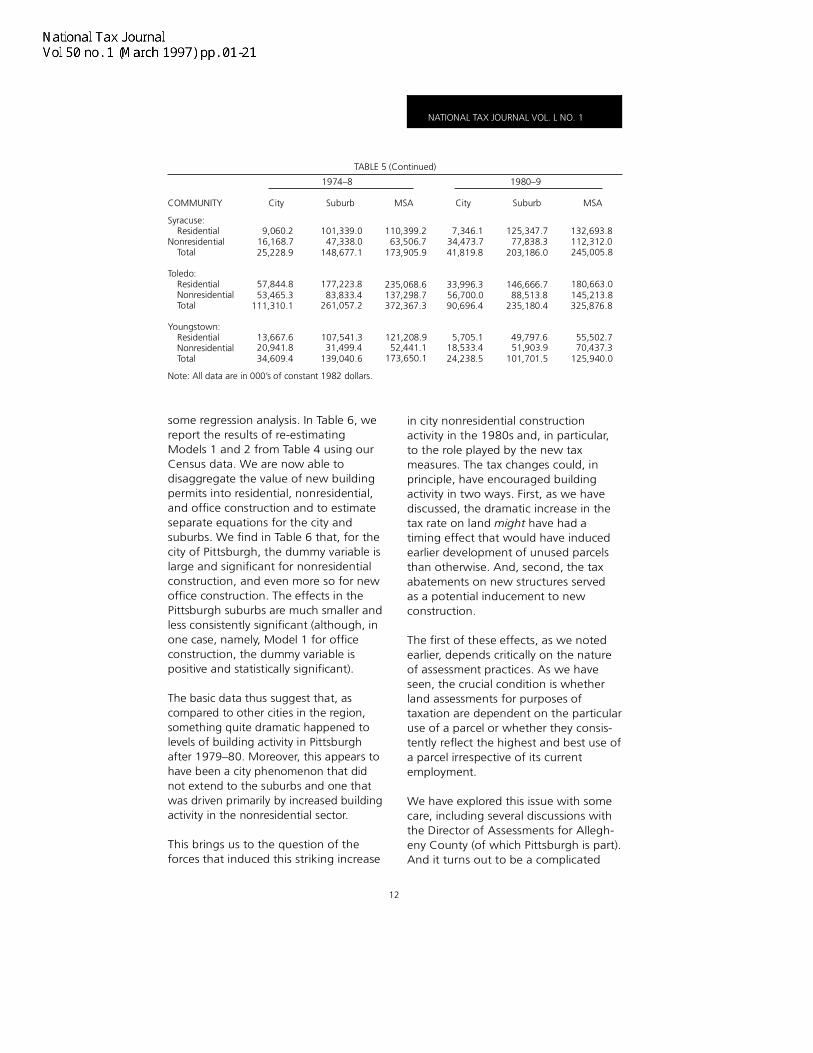
Table 5 provides summary results fromanother source of “before and after”
data; these data are on a metropolitanarea basis with disaggregation betweencity and suburbs and between residen-tial and nonresidential construction. Wehave compiled these figures from U.S.Bureau of the Census sources; incontrast to Dun and Bradstreet, theyreach back only to 1974.14 The Censusdata reveal a general picture of overallcity building activity that is roughlyconsistent with that from Dun andBradstreet. The real annual value of totalbuilding permits is lower after 1979than before in most cities. But Pitts-burgh again stands out, with a dramaticincrease of more than 250 percent. Thedisaggregation that the Census datamakes possible provides some furthervaluable information. We find that theimpetus to building activity in thePittsburgh area was confined to the city;the average annual value of buildingpermits in the suburbs actually declinedfrom the earlier to the latter period. Inaddition, the data indicate that theprimary thrust to increased constructionactivity was in the nonresidential sector;residential improvements rose onlymodestly, while nonresidential construc-tion more than tripled in annual value.
As with the Dun and Bradstreet data,we have subjected the Census data to
TABLE 4 (Continued)
Model 1 Model 2
Post 1979 Post 1979Dummy Constant R2 Year Dummy Constant R2
Rochester
Syracuse
Toledo
Youngstown
Note: t–Statistics are in parentheses.
–0.296(1.98)
–0.468(1.96)
–0.375(3.63)
–1.049(6.22)
11.59(134.46)
11.28(81.76)
11.80(197.40)
10.32(106.00)
0.12
0.12
0.32
0.58
–0.010(0.71)
–0.028(1.25)
0.015(1.54)
–0.031(2.04)
–0.144(0.55)
–0.050(0.12)
–0.596(3.40)
–0.586(2.12)
31.54(1.13)
66.25(1.51)
–17.15(0.91)
71.02(2.39)
0.14
0.17
0.37
0.64
THE IMPACT OF URBAN LAND TAXATION
11
TABLE 5AVERAGE ANNUAL VALUE OF BUILDING PERMITS
U.S. CENSUS DATA
1974–8 1980–9
COMMUNITY City Suburb MSA City Suburb MSA
Akron:ResidentialNonresidentialTotal
Allentown:ResidentialNonresidentialTotal
Buffalo:Residential NonresidentialTotal
Canton:ResidentialNonresidentialTotal
Cincinnati:ResidentialNonresidentialTotal
Cleveland:ResidentialNonresidential Total
Columbus:ResidentialNonresidential Total
Dayton:ResidentialNonresidentialTotal
Detroit:ResidentialNonresidentialTotal
Erie:ResidentialNonresidentialTotal
Pittsburgh:ResidentialNonresidentialTotal
Rochester:ResidentialNonresidentialTotal
152,250.2129,883.4282,133.6
217,011.6139,793.8356,805.4
187,646.8163,349.3
66,673.362,063.8
128,737.1
364,439.2407,820.5
350,996.1
772,259.8
412,638.1479,007.2891,645.3
458,686.2427,302.1885,988.3
150,017.1168,603.8318,620.9
951,485.51096,480.62047,966.0
33,570.135,897.269,467.3
338,643.8439,498.4778,142.2
290,138.4217,583.2
124,320.183,458.3
207,778.3
196,731.1109,895.3306,626.4
179,261.1129,651.9308,913.1
60,512.644,343.1
104,855.7
344,201.0308,337.6652,538.6
384,035.5277,133.6661,169.1
241,788.8108,639.1350,427.9
140,547.8105,572.5246,120.4
902,073.4909,042.7
1811,116.1
29,440.318,845.248,285.5
295,294.3227,749.1523,043.4
280,917.9151,044.7
27,930.246,425.174,355.3
20,280.529,898.550,179.0
8,385.733,697.442,083.1
6,160.717,720.623,881.3
20,238.299,482.9
119,721.1
28,602.6201,873.6230,476.2
216,897.4318,663.0535,560.4
9,469.363,031.372,500.5
49,412.1187,437.9236,850.0
4,129.817,052.021,181.8
43,349.5211,749.3255,098.8
9,220.666,538.5
216,263.8121,696.7337,960.5
170,373.899,448.2
269,822.1
192,212.9162,443.9354,656.8
134,268.162,028.8
196,296.9
410,335.5275,507.0685,842.5
588,772.6602,305.3
1191,078.0
379,905.1259,760.1639,665.1
226,382.9180,006.3406,389.1
1289,511.6863,324.6
2152,836.1
52,732.441,317.594,049.9
460,998.7281,328.8742,327.5
198,042.4185,211.2
188,024.760,016.7
248,041.4
143,925.264,490.5
208,415.8
183,765.9136,969.0320,734.9
122,660.247,132.2
169,792.4
374,212.4
558,518.4
1235,572.5
41,776.7
200,557.3574,769.7
419,515.7978,034.1
226,599.152,714.8
279,313.9
218,592.9107,213.4325,806.3
664,399.51899,972.0
18,203.959,980.6
425,064.8217,861.5642,926.3
194,534.4107,759.2
28,239.161,680.089,919.1
26,448.634,957.7
33,921.9
11,607.914,896.626,504.5
36,123.174,949.7
111,072.8
61,406.3
30,254.2182,789.6213,043.9
153,306.0207,045.2360,351.3
7,790.072,792.880,582.8
53,939.1198,925.1252,864.2
10,955.723,113.634,069.3
35,933.963,467.399,401.2
3,508.077,452.0
8,447.025,474.9
507,721.6431,962.675,759.1383,253.6302,293.680,960.0
NATIONAL TAX JOURNAL VOL. L NO. 1
12
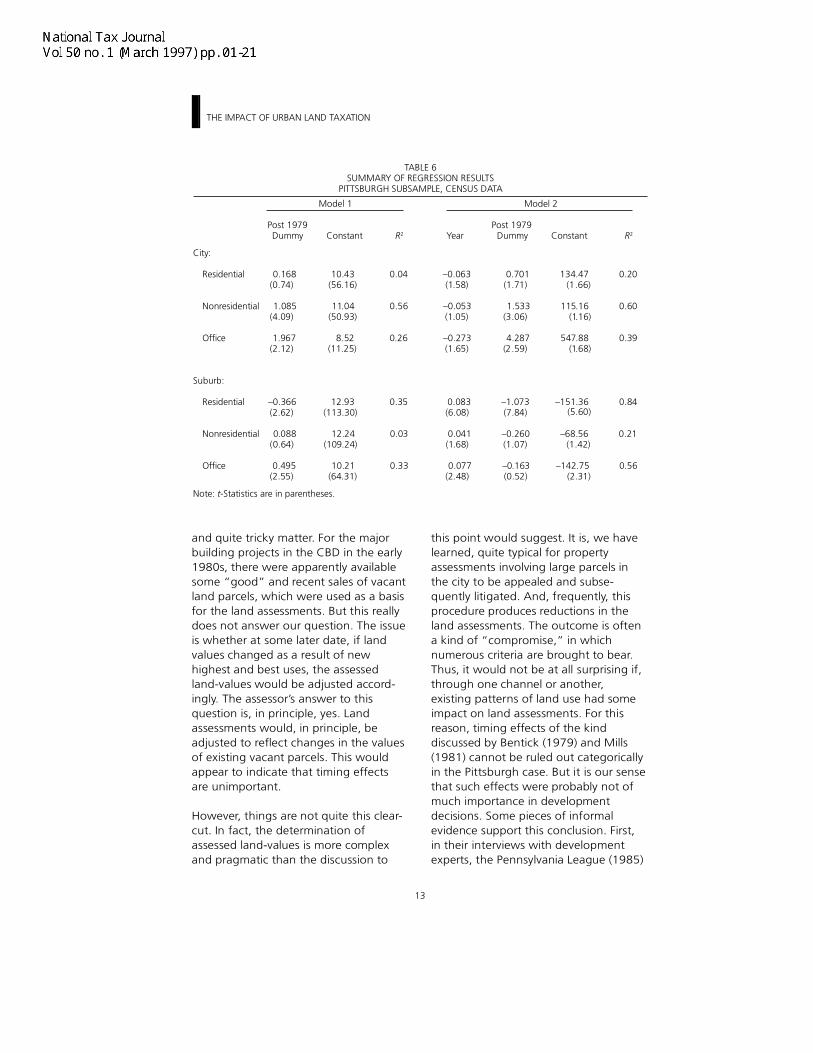
some regression analysis. In Table 6, wereport the results of re-estimatingModels 1 and 2 from Table 4 using ourCensus data. We are now able todisaggregate the value of new buildingpermits into residential, nonresidential,and office construction and to estimateseparate equations for the city andsuburbs. We find in Table 6 that, for thecity of Pittsburgh, the dummy variable islarge and significant for nonresidentialconstruction, and even more so for newoffice construction. The effects in thePittsburgh suburbs are much smaller andless consistently significant (although, inone case, namely, Model 1 for officeconstruction, the dummy variable ispositive and statistically significant).
The basic data thus suggest that, ascompared to other cities in the region,something quite dramatic happened tolevels of building activity in Pittsburghafter 1979–80. Moreover, this appears tohave been a city phenomenon that didnot extend to the suburbs and one thatwas driven primarily by increased buildingactivity in the nonresidential sector.
This brings us to the question of theforces that induced this striking increase
in city nonresidential constructionactivity in the 1980s and, in particular,to the role played by the new taxmeasures. The tax changes could, inprinciple, have encouraged buildingactivity in two ways. First, as we havediscussed, the dramatic increase in thetax rate on land might have had atiming effect that would have inducedearlier development of unused parcelsthan otherwise. And, second, the taxabatements on new structures servedas a potential inducement to newconstruction.
The first of these effects, as we notedearlier, depends critically on the natureof assessment practices. As we haveseen, the crucial condition is whetherland assessments for purposes oftaxation are dependent on the particularuse of a parcel or whether they consis-tently reflect the highest and best use ofa parcel irrespective of its currentemployment.
We have explored this issue with somecare, including several discussions withthe Director of Assessments for Allegh-eny County (of which Pittsburgh is part).And it turns out to be a complicated
TABLE 5 (Continued)
1974–8 1980–9
COMMUNITY City Suburb MSA City Suburb MSA
Syracuse:Residential
Nonresidential 16,168.7 47,338.0 63,506.7 34,473.7 77,838.3 112,312.0Total
Toledo:Residential 57,844.8 177,223.8NonresidentialTotal
Youngstown:Residential 13,667.6 107,541.3 49,797.6NonresidentialTotal
Note: All data are in 000’s of constant 1982 dollars.
245,005.8
180,663.0145,213.8325,876.8
55,502.770,437.3
125,940.0
203,186.0
146,666.788,513.8
235,180.4
101,701.5
41,819.8
33,996.356,700.090,696.4
5,705.118,533.4 51,903.924,238.5
235,068.6137,298.7372,367.3
121,208.952,441.1
173,650.1
83,833.4261,057.2
31,499.4139,040.6
9,060.2 132,693.8125,347.77,346.1110,399.2101,339.0
25,228.9 148,677.1 173,905.9
34,609.420,941.8
53,465.3111,310.1
THE IMPACT OF URBAN LAND TAXATION
13
and quite tricky matter. For the majorbuilding projects in the CBD in the early1980s, there were apparently availablesome “good” and recent sales of vacantland parcels, which were used as a basisfor the land assessments. But this reallydoes not answer our question. The issueis whether at some later date, if landvalues changed as a result of newhighest and best uses, the assessedland-values would be adjusted accord-ingly. The assessor’s answer to thisquestion is, in principle, yes. Landassessments would, in principle, beadjusted to reflect changes in the valuesof existing vacant parcels. This wouldappear to indicate that timing effectsare unimportant.
However, things are not quite this clear-cut. In fact, the determination ofassessed land-values is more complexand pragmatic than the discussion to
this point would suggest. It is, we havelearned, quite typical for propertyassessments involving large parcels inthe city to be appealed and subse-quently litigated. And, frequently, thisprocedure produces reductions in theland assessments. The outcome is oftena kind of “compromise,” in whichnumerous criteria are brought to bear.Thus, it would not be at all surprising if,through one channel or another,existing patterns of land use had someimpact on land assessments. For thisreason, timing effects of the kinddiscussed by Bentick (1979) and Mills(1981) cannot be ruled out categoricallyin the Pittsburgh case. But it is our sensethat such effects were probably not ofmuch importance in developmentdecisions. Some pieces of informalevidence support this conclusion. First,in their interviews with developmentexperts, the Pennsylvania League (1985)
TABLE 6SUMMARY OF REGRESSION RESULTS
PITTSBURGH SUBSAMPLE, CENSUS DATA
Model 1 Model 2
Post 1979 Post 1979Dummy Constant R2 Year Dummy Constant R2
City:
Residential 0.168 10.43 0.04 –0.063 0.701 134.47 0.20(0.74) (56.16) (1.58) (1.71) (1.66)
Nonresidential 1.085 11.04 0.56 –0.053 1.533 115.16 0.60(4.09) (50.93) (1.05) (3.06) (1.16)
Office 1.967 8.52 0.26 –0.273 4.287 547.88 0.39(2.12) (11.25) (1.65) (2.59) (1.68)
Suburb:
Residential –0.366 12.93 0.35 0.083 –1.073 –151.36 0.84(2.62) (113.30) (6.08) (7.84)
Nonresidential 0.088 12.24 0.03 0.041 –0.260 –68.56 0.21(0.64) (109.24) (1.68) (1.07) (1.42)
Office 0.495 10.21 0.33 0.077 –0.163 –142.75 (2.55) (64.31) (2.48) (0.52) (2.31)
Note: t-Statistics are in parentheses.
(5.60)
0.56
NATIONAL TAX JOURNAL VOL. L NO. 1
14
found no evidence that the increase inrates of land taxation exerted a notice-able impact on construction activity.“Most of those interviewed stated thatproperty taxes played a very small partin any development decision and thatthe effects of the graded tax werenegligible” (p. 20). And, second, theLeague found that several of the majorprojects that were begun in 1981 werewell along in the planning stages beforethe increase in the graded-tax ratio.15
There are obviously things other thanthe fiscal system that influenceddevelopment decisions in Pittsburgh.And we turn to them now. As men-tioned earlier, there was undertaken inthe late 1970s a concerted renewaleffort under the title of Renaissance II.Moreover, it is clearly important to lookfor elements in the general economic“climate” that might have favorablyinfluenced economic activity. Ofparticular importance is the state ofexcess demand for structures. As aproxy for this variable, we present inTable 7 data that we have assembled forten of our cities for selected years onvacancy rates in downtown officebuildings. The figures for Pittsburgh arestriking: they indicate that by 1980 thevacancy rate had fallen below onepercent, suggesting the existence ofconsiderable excess demand for newoffice space. The data indicate, more-over, that the construction of severalmassive new office buildings in the early1980s effectively remedied the situation,as office vacancy rates rose sharply bythe middle of the decade.
The excess demand for office spacewas undoubtedly an important con-tributor to the decisions to erect newoffice complexes in the city. However,the rest of Table 7 is of interest in thisrespect. Several other cities in oursample likewise exhibit quite low
downtown office vacancy rates. Butthey did not experience the buildingboom that characterized Pittsburgh inthe 1980s.
To look at this a bit more closely, wehave undertaken some regressionanalysis of the time-series data forPittsburgh, in which we allow for theeffects of both the vacancy rate and theregime change. In equations 1 and 2,we report the results of re-estimatingModels 1 and 2 using the log of theDun and Bradstreet data (LDB) andincluding, along with the dummyvariable (D) for the tax regime (and thetime variable (Y ) in Model 2), the annualoccupancy rate (R) for office buildings:
LDB = 6.69 + 0.597D + 0.057R(1.79) (3.90) (2.98)
R2 = 0.41
LDB = 45.96 + 0.870D – 0.020Y + 0.048R(1.58) (3.46) (1.35) (2.43)
R2 = 0.45
We find, first, that the estimatedcoefficient of the occupancy rate ispositive and significant in both equa-tions; a one-percentage-point increasein the occupancy rate raises real buildingpermits by roughly five percent. Second,the post-1979 dummy variable remainspositive and significant, though slightlysmaller than in Table 4. These results arethus consistent with the view that theshortage of office space, although animportant determinant, is not the soleexplanation of the building boom inPittsburgh in the 1980s.16
1
2
Model 1
Model 2
THE IMPACT OF URBAN LAND TAXATION
15
NATIONAL TAX JOURNAL VOL. L NO. 1
16
The dummy or regime-shift variable (D)in both Models 1 and 2 captures severalelements that we mentioned earlier—not only changes in the city’s tax system,but also other components of Renais-sance II. Of particular note was aprovision granting property tax abate-ments for new construction underwhich the city did not tax the value fromnew construction for the first threeyears. To get some sense of the order ofmagnitude of this tax concession, wehave made some crude calculations withwhat seem to us reasonable representa-tive values of the key parameters. Actualassessments of some of the major newprojects indicate that they were highlycapital-intensive, with the value ofstructures constituting about 90 percentof the total value of the property andwith land about ten percent of the totalvalue. Assuming a ten percent rate ofdiscount, we calculate that, for such arepresentative property, the provisionthat forgives the tax on structures forthe first three years serves to reduce thepresent discounted value of the futurestream of property tax liabilities byabout 15 to 20 percent. This, in turn,translates into something like a 1.5percent subsidy (reduction in price) tonew construction. We suspect that asubsidy of this magnitude, even withgenerous elasticity estimates, canaccount only for a modest fraction ofthe large increase in constructionactivity.
There remains the puzzle of the strikingdifference in construction behaviorbetween the residential and non-residential sectors. Why was the boomin building activity in the 1980s inPittsburgh concentrated in the commer-cial sector? To explore this issue, wecollected some additional data onresidential vacancy rates for both home-owner and rental units for the cities inour sample. The data indicate that
vacancy rates for residential units inPittsburgh are not unusually low; therates for both home-owner and rentalunits are comparable over this period tothose in other cities in the region. Forexample, the vacancy rate in rentaldwellings in 1980 was 7.1 percent inPittsburgh; this rate ranged from 5.7 to9.5 percent in 1980 for other cities inour sample. The explanation for thepuzzle thus seems to be that there wassignificant excess demand for new officespace in Pittsburgh but not for residen-tial dwellings. This would underscorethe importance of the state of themarket in determining levels of newconstruction. We note from Table 5,however, that residential construction(as measured by the value of newbuilding permits) did rise in Pittsburgh inthe 1980s relative to the precedingdecade, and this is in contrast to mostother cities in our sample, whichexperienced declines in both residentialand nonresidential construction. But theincrease in residential construction inPittsburgh was clearly dwarfed by whattook place in the nonresidential sector.The apparent explanation is the differ-ent levels of excess demand in the twosectors.
Interpretation and Conclusions
It is now time to try to draw togetherthe various strands of evidence andassess the role that land-value taxationhas played in the resurgence of buildingactivity in the 1980s in the city ofPittsburgh. There are obviously seriouslimitations inherent in any exercise thatinvolves the analysis of a single case ofany phenomenon. And we are acutelyaware that not only do we have a singlecase of land-value taxation, but the shiftof tax regimes that took place at theend of the 1970s was part of a largerprogram, Renaissance II, that aimed aturban renewal. It is clearly impossible to
THE IMPACT OF URBAN LAND TAXATION
17
disentangle fully the effects of all thevarious elements of the renewal effort.Nevertheless, theory and evidencetogether do, we believe, suggest areasonable interpretation of thePittsburgh experience. And we offerthat interpretation to conclude ourstudy.
The basic data are clear on certainthings. Following the change in regimesat the end of the 1970s, Pittsburghexperienced a striking building boom,far in excess of anything that took placein the other major cities in the region.The building boom was basically a cityphenomenon; it did not extend to therest of the metropolitan area. It was,moreover, a boom primarily in commer-cial building activity. The residentialsector experienced only a modestincrease in new construction (althougheven this is noteworthy in the context ofthe nationally depressed housingmarkets of the early 1980s). The centralthrust took the form of several majornew office buildings in the CBD inresponse to a marked shortage in officespace that characterized the transforma-tion of the Pittsburgh economic basefrom its earlier heavy manufacturingorientation to a more diversified,service-oriented economy.17
How do we account for the Pittsburghbuilding boom? It seems clear at theoutset that certain underlying economicconditions were favorable. By 1980–1,the downtown office vacancy rate hadfallen to less than one percent, suggest-ing an existing excess demand for officespace. Renaissance II appears to havemobilized this excess demand andtransformed it into new commercialconstruction. However, the excessdemand itself does not seem to be theentire story, as two pieces of evidencesuggest. First, as Table 7 indicates,Pittsburgh was not the only city in the
region with low office vacancy rates inthe late 1970s. But the other cities inour sample did not experience anexpansion in commercial buildingactivity anything like what happened inPittsburgh. And, second, as we found inour regression analysis, even afterallowing for the significant effect ofoffice vacancy rates on new buildingactivity, the dummy variable for theregime change remains large andstatistically significant. This suggeststhat, while excess demand was obvi-ously quite important, it was not theonly factor behind the dramatic expan-sion in commercial building.
This is, incidentally, an issue of consider-able contention among city officials andothers close to the Pittsburgh experi-ence. Some suggest a major role forfiscal incentives. Rybeck (1991), forexample, quotes the Pittsburgh CityCouncil President as follows: “I’m notgoing to say the land tax is the onlyreason a second renaissance occurred,but it’s been a big help” (pp. 4–5). Incontrast, a major official and a closeobserver (independently) have assertedcategorically to us that all the majorprojects that were undertaken in theCBD would have been undertaken inthe absence of any increase in landtaxes; their view is that the shortage ofoffice space was the basic driving forcein these investment decisions.
But to conclude from this that the roleof land taxation was relatively unimpor-tant is, in our view, a serious misinter-pretation. Assuming that the timingeffects we discussed earlier were ofminor importance, we are left with theview that, in accordance with traditionaleconomic theory, a major increase inland-value taxation is likely to be(roughly) neutral. The critics of land-value taxation have suggested that thePittsburgh tax reform was unimportant
NATIONAL TAX JOURNAL VOL. L NO. 1
18
because it had little effect on develop-ment. In the interviews of thoseknowledgeable about development, thestudy of the Pennsylvania EconomyLeague obtained repeatedly theresponse that the shift to heavier landtaxation had no (or little) discernibleimpact on development decisions (Weirand Peters, 1986). From this, it wasconcluded, incorrectly we believe, thatincreased land-value taxation playedlittle role in Renaissance II.
The point here is that if land taxationwere neutral, we would expect it tohave no effect on any decisions. This isits very appeal: it does not distorteconomic choices. Thus, the responsesof those interviewed are fully consistentwith the traditional view of the neutral-ity of land taxation. Land taxationshould not, and apparently did not, initself hasten development.
The role of land-value taxation is to beunderstood in terms of the revenuealternatives. Pittsburgh was undersevere fiscal pressure in the late 1970s,and some type of tax increase wasnecessary to restore budgetary solvency.Had an increase in land-value taxationnot been introduced, city officials wouldhave turned to another form of taxa-tion: higher taxes on structures, or amajor increase in the city’s wage tax.The interesting, and the relevant, issuehere is the response of the Pittsburgheconomy to such an alternative tax.
Although we do not have a model ofthe Pittsburgh economy with which togenerate some actual estimates of theeconomic response to alternative taxreforms, there is a recent empiricalliterature that is, at least, quite sugges-tive. This literature (in contrast to someearlier and cruder work) finds thatbusiness location decisions and eco-nomic growth are quite sensitive to
levels of state and local taxes (see, forexample, Helms, 1985; Newman andSullivan, 1988; Bartik, 1991.) Moreover,as Bartik points out, “Tax effects onbusiness location decisions are generallymuch larger for intrametropolitanbusiness location decisions than forintermetropolitan or interstate businesslocation decisions” (1991, p. 39).Drawing on the existing empiricalliterature, Bartik suggests that the long-run elasticity of business locationdecisions with respect to local taxesprobably ranges from –1.0 to –3.0 in anintrametropolitan setting. From thisperspective, increases in other city taxesmight have been expected to havedamaging effects on the city’s economicrenewal efforts.18 The appeal of land-value taxation is its basic neutrality: itdoes not create the adverse fiscalincentives that accompany otherrevenue measures.
It is against the backdrop of suchalternatives that the tax on land-valuesneeds to be considered. As we notedearlier, the role of land-value taxation inPittsburgh should be understood in asetting of differential taxation. Therelevant issue here is how the effects ofthe land-value tax compare with thoseof the available alternative sources oftax revenues.
At the same time, it is important toremember that the Pittsburgh fiscalreform took place in a setting of strongdemand for office space. We certainlycannot conclude from the Pittsburghexperience that tax reform in itself iscapable of generating major urbanrenewal efforts. Our findings thus donot support some of the more extrava-gant claims that land-tax proponentshave made for the role of the tax instimulating economic activity. Thecontribution of land-value taxation is tobe understood not in terms of any direct
THE IMPACT OF URBAN LAND TAXATION
19
stimulus to development, for there islikely to be little or none if the tax isbasically neutral. Rather, land-valuetaxation provides city officials with a taxinstrument that generates revenues buthas no damaging side effects on theurban economy. In this way, it allows thecity to avoid reliance on other taxes thatcan undermine urban development.
ENDNOTES
For research assistance, we are grateful to JamesHeil, Jonathan Lewis, Dan Mussatti, Robert Vigil,and especially Janet McCubbin. For their help inobtaining needed data, we thank Dina Silva-Decker at the Dun and Bradstreet Corporation,Ellen Ku of BOMA International, and StanMontgomery at the U.S. Bureau of the Census. Wealso appreciate the help and patience of Dr.Charles Blocksidge, the County Assessor ofAllegheny County, Mark Gibbons, Chief Account-ing Officer of the City Controller in Pittsburgh, andMichael Weir, Senior Research Associate of thePennsylvania Economy League. In addition, we aregrateful to the editor of this journal and to threeconscientious and insightful referees whosecomments guided the revision of an earlier draft.Finally, we want to thank the Lincoln Institute ofLand Policy for the extended support of this study.
1 There are a few instances of land-value taxation inpractice; they typically involve a graded propertytax system under which land is taxed at a higherrate than the structures on the land. They include(in addition to Pittsburgh) some smaller cities inPennsylvania and, outside the United States,certain cities in Australia and South Africa.
2 For some sense of the magnitude of this effect, seethe computable general-equilibrium analyses in thepapers by DiMasi (1987) and Follain and Miyake(1986).
3 We have constructed a formal intertemporal modelthat embodies both the capital-intensity andtiming effects. We are happy to provide interestedreaders with an appendix that presents this model.
4 This admittedly abstracts from whatever effects thetax revenues have on government spending or,alternatively, on revenues from other tax sources.It also ignores possible changes in behavior bylandowners (or others) from the associated incomeand portfolio effects (Feldstein, 1977).
5 Wildasin (1982) points up another potential sourceof intertemporal non-neutrality: changes in the taxrate on land over time. For example, increasing taxrates over time would tend to penalize projectswhose returns are more concentrated in thedistant future.
6 As Tideman (1982) has emphasized to us, thetiming effect depends critically on the systematicassociation of land assessments with actual use.Simple random errors or inaccuracies inassessments will not, in themselves, compromisethe neutrality property of land-value taxation.
7 What some observers may have in mind implicitlyis that a reduction in the tax rate on structuresaccompanying the increase in the rate of taxationon land will encourage development. This is true,but it is the reduced penalty on structures thatencourages development not the higher rate oftaxation of land. More on this shortly.
8 This distinction between balanced budget anddifferential tax analysis is also an important issue inunderstanding the impact of land taxation on thecapital intensity of development. If thetax on land is raised and no other taxes arechanged (balanced budget analysis), capitalintensity should remain unchanged. If the tax onland is raised and the additional revenues are usedto reduce the tax on structures (differential taxanalysis), then capital intensity should rise. Ourdata do not allow us to investigate changes incapital intensity in Pittsburgh or in the other citiesin our sample. A careful analysis of this issuewould be an interesting and important extensionof our work.
9 For a useful description of the historical evolution ofPittsburgh with a focus on the renewal efforts underRenaissance I and II, see Stewman and Tarr (1972).
10 The commercial building boom in Pittsburgh underRenaissance II has encompassed a number ofmajor projects: PPG Place (six buildings, including a40-story office tower), One Oxford Center (a 46-story office tower and retail complex), The SteelPlaza/One Mellon Bank Center (a 53-story officetower and retail complex that includes the mainstation of the Light Rail Transit system), AlleghenyInternational’s headquarters, Liberty Center, theHillman Complex, and several others.
11 For a valuable published presentation of theLeague’s study, see Weir and Peters (1986).
12 See the Appendix for a more detailed descriptionof the sources and nature of our data.
13 We have also analyzed these data using aninterrupted time-series model. These models areused widely to examine the impact of a discreteevent. Recently, for example, Bonham et al. (1992)used such a model in their study of a hotel roomtax. The results from the interrupted time-seriesmodel are very similar to those in Table 4 and areavailable upon request.
14 We note that there is more than one “central city”in the Allentown and Youngstown MSAs. TheCensus data encompass all those cities, but theDun and Bradstreet figures include Allentown andYoungstown alone.
15 We recall also Bourassa’s study (1987) of theresidential sector, in which he found in his
NATIONAL TAX JOURNAL VOL. L NO. 1
20
regression equations that the land tax was aninsignificant determinant of the level of residentialbuilding permits, while the tax rate on improvementshad a substantial and statistically significant effect.
16 A reviewer raised the concern that the relevantoccupancy rate for equations 1 and 2 is not thecurrent occupancy rate but the expected rate. Wehave investigated this issue by reestimating theseequations using a variety of approaches to defininga variable for the expected occupancy rate; insome instances, we used a weighted average ofpast rates, and in others, we used the actual futurerate on the assumption that developers accuratelyforecast the future. None of these exerciseschanged the results in any essential way; in all thevarious cases, the dummy variable for the regimeshift remained highly significant and without muchchange in magnitude.
17 Rybeck (1991) has suggested to us that some ofthe land-intensive city development may havecome at the expense of suburban development,thereby offsetting certain tendencies in metropoli-tan areas toward urban sprawl. This is aninteresting issue that merits further study.
18 For example, two econometric studies ofPhiladelphia found that the city wage tax resultedin large job losses in the city. Grieson (1980)estimated that a one-percentage-point increase inthe wage tax in Philadelphia in 1976 led to a 10 to15 percent loss in employment in the city by 1980.A later study by Inman (1992) turned up similarfindings. He estimated that a potential increase inthe Philadelphia wage tax from about five to sixpercent would result in a loss of over 80,000 jobs(or of 12.7 percent from existing employmentlevels). However, as one reviewer pointed out tous, the Philadelphia findings are not readilytransferable to Pittsburgh because of a crucialdifference in the structure of the tax. InPhiladelphia, the tax is a commuter tax; thesuburbs around Philadelphia do not have wagetaxes of their own. In contrast, in Pittsburgh, thefirst claim on a person’s income resides in his placeof residence. So when the city of Pittsburgh raisesthe wage tax, suburbs tend to do likewise in orderto get what, from their perspective, is essentially“free money.” For this reason, the incentives forbusinesses to leave the city would be somewhatweaker in Pittsburgh than in Philadelphia.Nevertheless, higher wage taxes in the Pittsburghmetropolitan area could be expected to have adetrimental impact on economic growth in boththe city and suburbs.
REFERENCES
Bartik, Timothy J . Who Benefits from Stateand Local Economic Development Policies?Kalamazoo, MI: W. E. Upjohn Institute, 1991.
Bentick, Brian L . “The Impact of Taxation andValuation Practices on the Timing and Efficiencyof Land Use.” Journal of Political Economy 87No. 4 (August, 1979): 859–68.
Bentick, Brian L . “A Tax on Land Value MayNot be Neutral.” National Tax Journal 35 No. 1(March, 1982): 113.
Bentick, Brian L., and Thomas F. Pogue. “TheImpact on Development Timing of Property andProfit Taxation.” Land Economics 64 (November,1988): 317–24.
Bonham, Carl, Edwin Fujii, Eric Im, andJames Mak. “The Impact of the Hotel RoomTax: An Interrupted Time Series Approach.”National Tax Journal 45 No. 4 (December, 1992):433–41.
Bourassa, Steven C. “Land Value Taxation andHousing Development: Effects of Property TaxReform in Three Types of Cities.” AmericanJournal of Economics and Sociology 49 (January,1990): 101–11.
Bourassa, Steven C. “Land Value Taxation andNew Housing Development in Pittsburgh.”Growth and Change 18 No. 4 (Fall, 1987): 44–55.
Brueckner, Jan K. “A Modern Analysis of theEffects of Site Value Taxation.” National TaxJournal 39 No. 1 (March, 1986): 49–58.
DiMasi, Joseph A. “The Effects of Site ValueTaxation in an Urban Area: A General Equilib-rium Computational Approach.” National TaxJournal 40 No. 4 (December, 1987): 577–90.
Feldstein, Martin. “The Surprising Incidence ofa Tax on Pure Rent.” Journal of PoliticalEconomy 85 No. 2 (April, 1977): 349–60.
Follain, James R., and Tamar Emi Miyake.“Land Versus Capital Value Taxation: A GeneralEquilibrium Analysis.” National Tax Journal 39No. 4 (December, 1986): 451–70.
Grieson, Ronald E. “Theoretical Analysis andEmpirical Measurements of the Effects of thePhiladelphia Income Tax.” Journal of UrbanEconomics 8 No. 1 (July, 1980): 123–37.
Helms, L. Jay. “The Effect of State and LocalTaxes on Economic Growth: A Time Series–CrossSection Approach” Review of Economics andStatistics 67 No. 4 (November, 1985): 574–82.
Inman, Robert P. “Can Philadelphia Escape ItsFiscal Crisis with Another Tax Increase?” BusinessReview of the Federal Reserve Bank of Philadel-phia (September–October, 1992): 5–20.
Mills, David E. “The Non-Neutrality of LandValue Taxation.” National Tax Journal 34 No. 1(March, 1981): 125–9.
Musgrave, Richard A. The Theory of PublicFinance. New York: McGraw-Hill, 1959.
THE IMPACT OF URBAN LAND TAXATION
21
Netzer, Dick. Economics of the Property Tax.Washington, D.C.: The Brookings Institution,1966.
Newman, Robert J., and Dennis H. Sullivan .“Econometric Analysis of Business Tax Impactson Industrial Location: What Do We Know, andHow Do We Know It?” Journal of UrbanEconomics 23 No. 2 (March, 1988): 215–34.
Pennsylvania Economy League. Develop-ment, Equity, and the Graded Tax in the City ofPittsburgh. Pittsburgh: Pennsylvania EconomicLeague, March, 1985.
Pollakowski, Henry O . “Adjustment Effects ofa Tax on Land: The Pittsburgh Case.” LincolnInstitute Monograph #82-8. Cambridge: LincolnInstitute of Land Policy, 1982.
Rybeck, Walter. “Pennsylvania’s Experiments inProperty Tax Modernization.” NTA Forum(Spring, 1991): 1–5.
Stewman, Shelby, and Joel A. Tarr. “FourDecades of Public-Private Partnerships inPittsburgh.” In Public-Private Partnership inAmerican Cities: Seven Case Studies, edited byR. Scott Fosler and Renee Berger. Lexington,MA: Heath, 1982.
Tideman, T. Nicolaus. “A Tax on Land Value IsNeutral.” National Tax Journal 35 No. 1 (March,1982): 109–11.
Vickrey, William. “Defining Land Value for TaxPurposes.” In The Assessment of Land Value,edited by Daniel M. Holland. Madison:University of Wisconsin Press, 1970.
Weir, Michael, and Lillian E. Peters. “Devel-opment, Equity, and the Graded Tax in the Cityof Pittsburgh.” Property Tax Journal 5 No. 2(June, 1986): 71–84.
Wildasin, David E. “More on the Neutrality ofLand Taxation.” National Tax Journal 35 No. 1(March, 1982): 105–8.
APPENDIX: DESCRIPTION OF THE DATA
The variables that we seek to explain in this paper arevarious measures of the level of planned buildingactivity in our sample of cities. We have two basicsources for these variables. The first is the Dun andBradstreet Corporation. As part of their “CurrentEconomic Indicators,” Dun and Bradstreet publisheson a monthly basis the value of building permits forthe nation’s 202 largest cities. From the monthly data,we constructed an annual time series on buildingpermit values reaching back to 1960 for each of the
cities in the sample. We converted the series to realterms by deflating the Dun and Bradstreet figures bythe gross national product implicit price deflator forthe nonresidential structures component of fixedprivate investment. We note that these data refer tothe city alone, not to the wider metropolitan area,and that they are not disaggregated by type ofconstruction.
Our second source of data on the value of newbuilding permits is the U.S. Bureau of the CensusBuilding Permit Data. Assembling these data wasconsiderably more complicated. In terms of coverageover time, we have been able to pull together datafor 1974–8 and for 1980–9; we have been unable toget data for the single year 1979. Hence, our beforeand after figures in Table 4 in the text refer to theperiods 1974–8 and 1980–9. We encountered afurther problem in that the Census retired the SMSAconcept in 1984 and specified metropolitan areas asMSAs or PMSAs (Primary Metropolitan StatisticalAreas). This involved some substantive changes (i.e.,additions or deletions of counties) for five of themetropolitan areas in our sample (includingPittsburgh). We thus had to adjust the figures foryears subsequent to 1983 by obtaining the relevantcounty data and adjusting the data. The great appealof the Census data is their disaggregation. First, thedata are broken down between city and suburbs, and,second, they are disaggregated into some 23 differenttypes of construction activity. This has allowed us inour Table 4 to distinguish both between city andsuburbs and between permits for residential andnonresidential construction. We have deflated thesedata in the same manner as the Dun and Bradstreetfigures.
Our starting point for the data on tax rates wasPollakowski (1982, Table 1, p. 2). We obtained helpfrom the Chief Accounting Officer, Mark D. Gibbons,in the Office of the City Controller in updating thistable and in correcting several errors.
Finally, the source of data for city office vacancy ratesis the Building Owners and Managers AssociationInternational (BOMA). They publish annually theBOMA Experience Exchange Report, which contains awealth of information on city office buildings,including estimated occupancy rates. We were able toconstruct a time series for Pittsburgh reaching all theway back to 1960 to coincide with our Dun andBradstreet data on new building permits. We werenot able, however, to get such complete data for allthe cities in our sample. We thus have office vacancyrates only for selected years for most of the othercities in the region.

![Arnold and Commissioner of Taxation (Taxation) … and Commissioner of Taxation (Taxation) [2017] AATA 1318 PAGE 2 OF 26 CATCHWORDS TAXATION AND REVENUE – appeal …](https://img.pdfslide.us/doc/110x75/5af2c9387f8b9ac2469120bc/arnold-and-commissioner-of-taxation-taxation-and-commissioner-of-taxation.jpg)