Embed Size (px)
Citation preview
© Crown copyright 2007
The impact of the temporal spacing of observations on analysis accuracy
John Eyre and Peter Weston Met Office Seminar, U.Reading, 19 June 2013
© Crown copyright 2007
The impact of the temporal spacing of observations on analysis accuracy:
implications for optimal distribution of polar-orbiting satellites
• Background
• Previous studies in Europe
• A new theoretical study - impact of temporal spacing of observations on analysis accuracy
• highly idealised
• less idealised – using FSO stats to assess observation information
• Conclusions
© Crown copyright 2007
Acknowledgements
Enza Di Tomaso (ECMWF) Niels Bormann (ECMWF)
Adrian Simmons (ECMWF)Andrew Lorenc (Met Office)
CGMS members – Lars Peter Riishojgaard, Jim Purdom
Bill BellNeill Bowler
© Crown copyright 2007
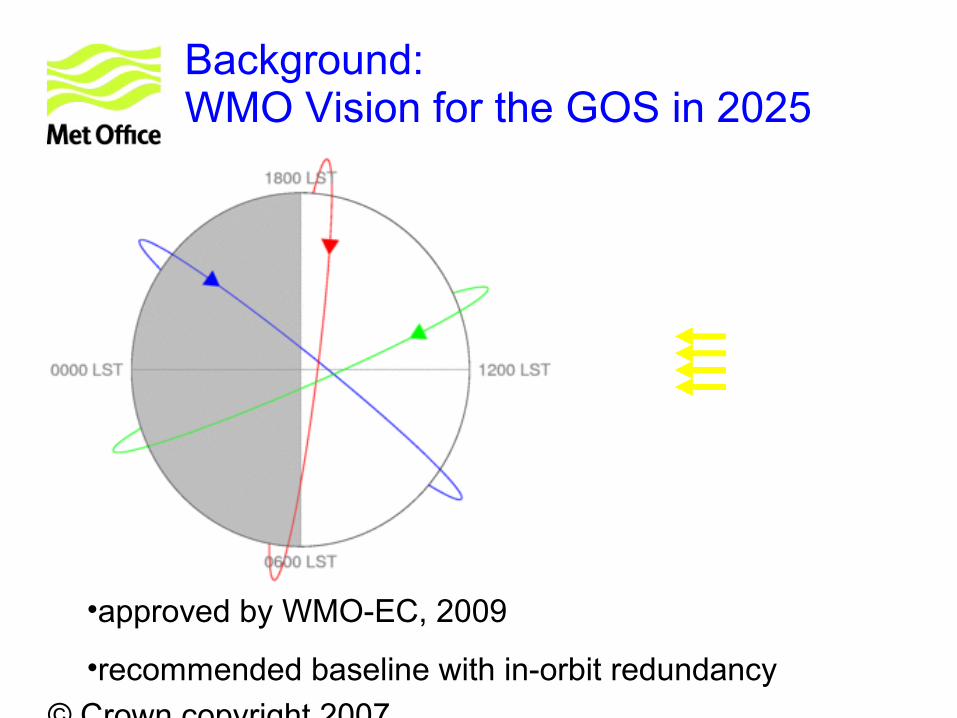
Background:WMO Vision for the GOS in 2025
•approved by WMO-EC, 2009
•recommended baseline with in-orbit redundancy
© Crown copyright 2007
Previous studies in Europe
Assimilation of ATOVS radiances at ECMWF.Enza Di Tomaso and Niels Bormann. EUMETSAT/ECMWF Fellowship Programme Res. Rep. 22
© Crown copyright 2007
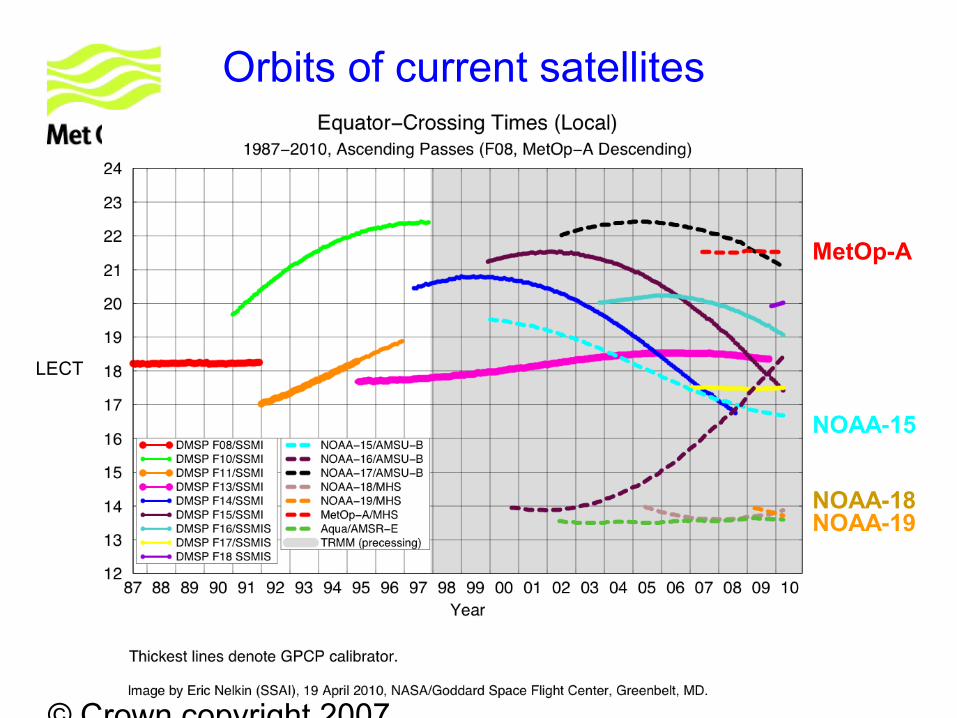
Orbits of current satellites
MetOp-A
NOAA-18 NOAA-19
NOAA-15
LECT
© Crown copyright 2007
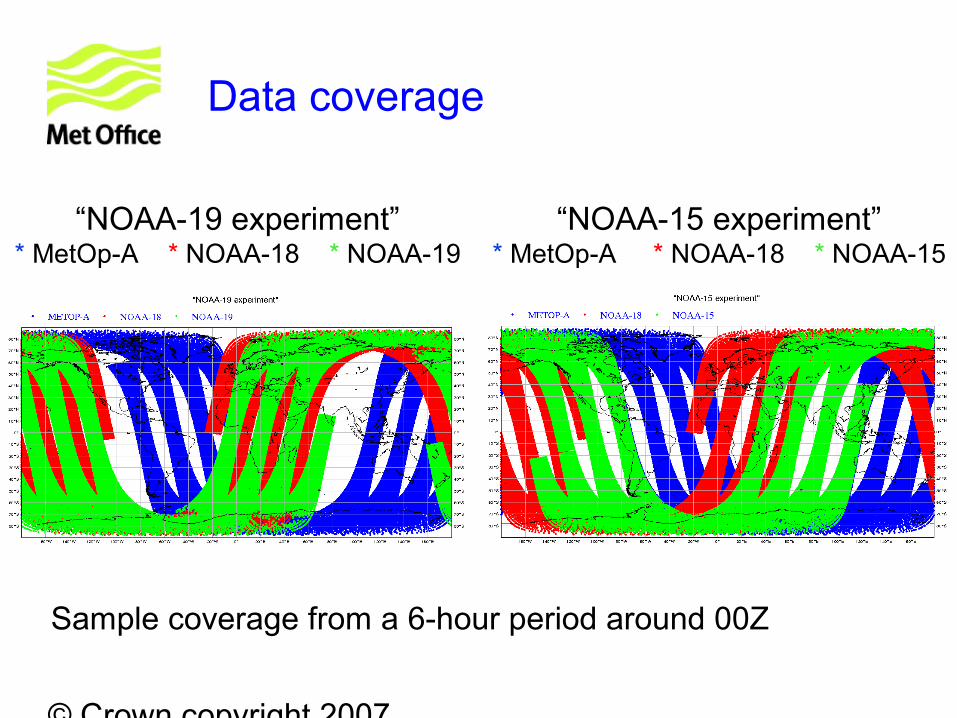
Data coverage
“NOAA-15 experiment”* MetOp-A * NOAA-18 * NOAA-15
“NOAA-19 experiment”* MetOp-A * NOAA-18 * NOAA-19
Sample coverage from a 6-hour period around 00Z
© Crown copyright 2007
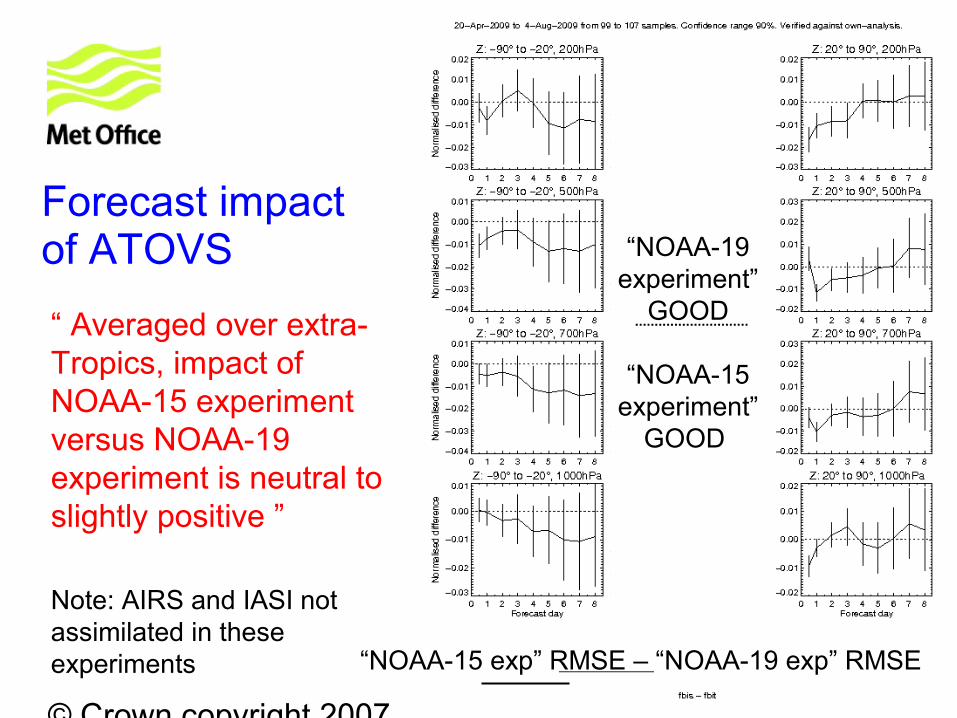
Forecast impact of ATOVS
“ Averaged over extra-Tropics, impact of NOAA-15 experiment versus NOAA-19 experiment is neutral to slightly positive ”
“NOAA-15 exp” RMSE – “NOAA-19 exp” RMSE
“NOAA-19 experiment”
GOOD
“NOAA-15 experiment”
GOOD
Note: AIRS and IASI not assimilated in these experiments
© Crown copyright 2007
New theoretical study: the impact of temporal spacing of observations on analysis accuracy
or
how to do an OSSE in an Excel spreadsheet
© Crown copyright 2007
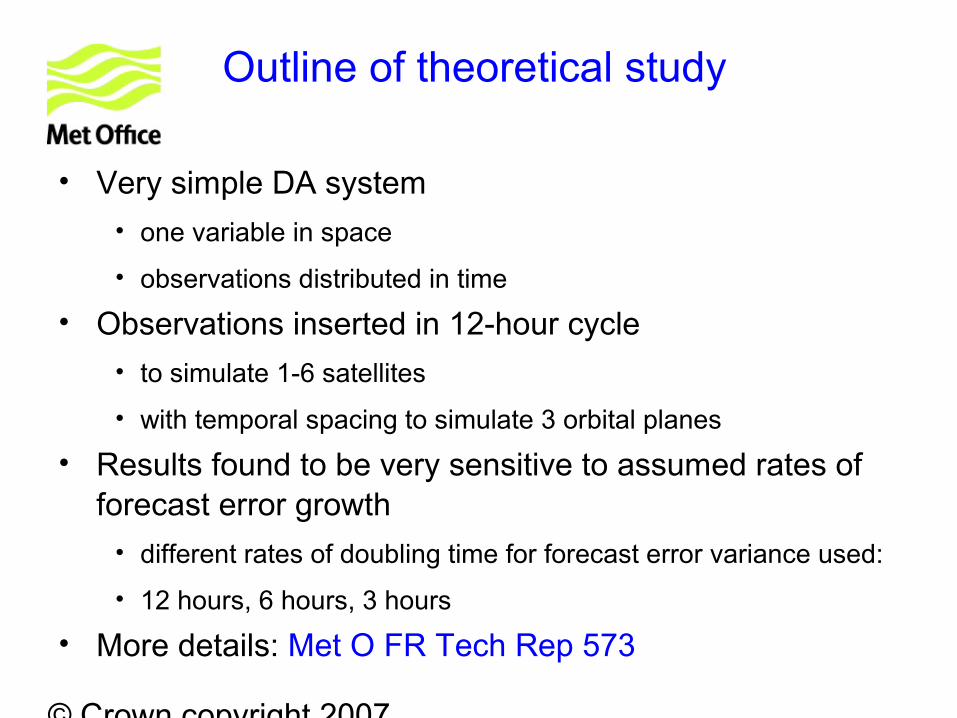
Outline of theoretical study
• Very simple DA system
• one variable in space
• observations distributed in time
• Observations inserted in 12-hour cycle
• to simulate 1-6 satellites
• with temporal spacing to simulate 3 orbital planes
• Results found to be very sensitive to assumed rates of forecast error growth
• different rates of doubling time for forecast error variance used:
• 12 hours, 6 hours, 3 hours
• More details: Met O FR Tech Rep 573
© Crown copyright 2007
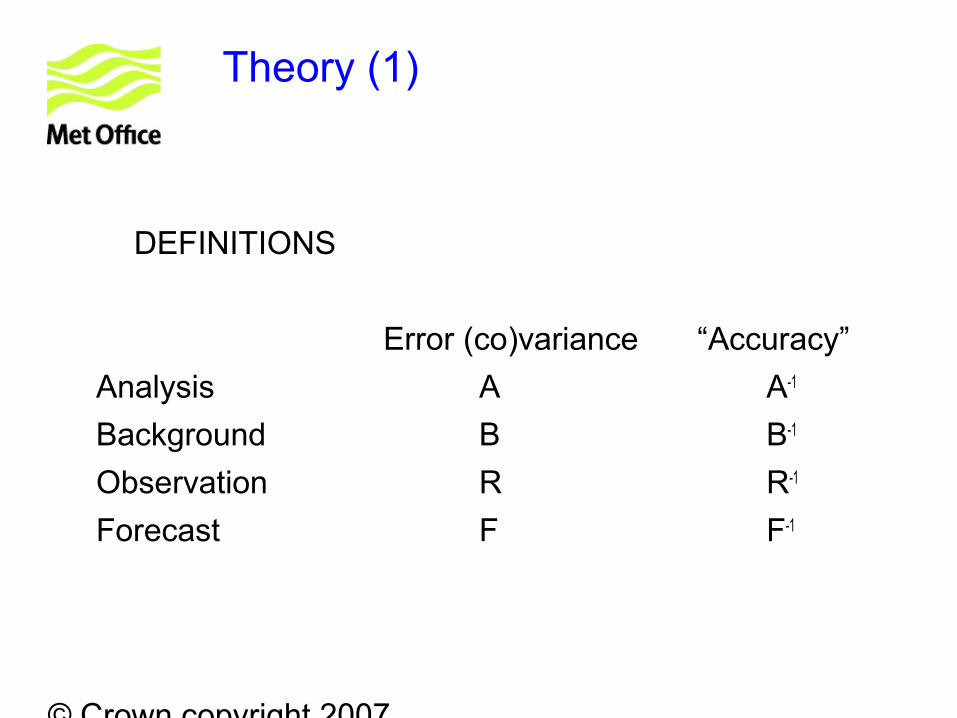
Theory (1)
DEFINITIONS
Error (co)variance “Accuracy”
Analysis A A-1
Background B B-1
Observation R R-1
Forecast F F-1
© Crown copyright 2007
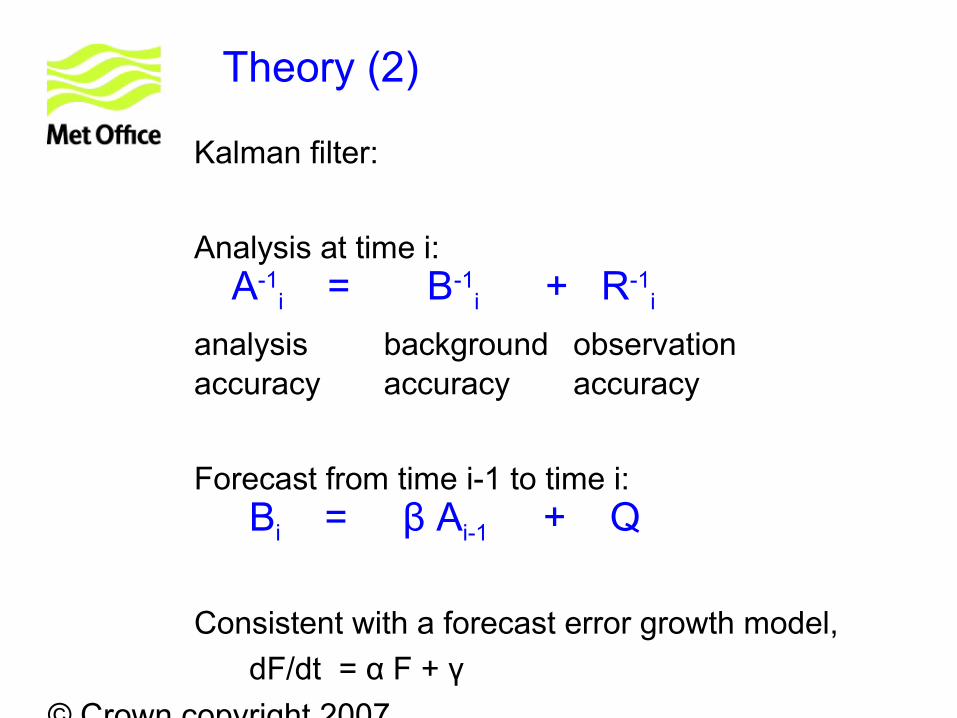
Theory (2)
Kalman filter:
Analysis at time i:A-1
i = B-1i + R-1
i
analysis background observation accuracy accuracy accuracy
Forecast from time i-1 to time i: Bi = β Ai-1 + Q
Consistent with a forecast error growth model,
dF/dt = α F + γ
© Crown copyright 2007
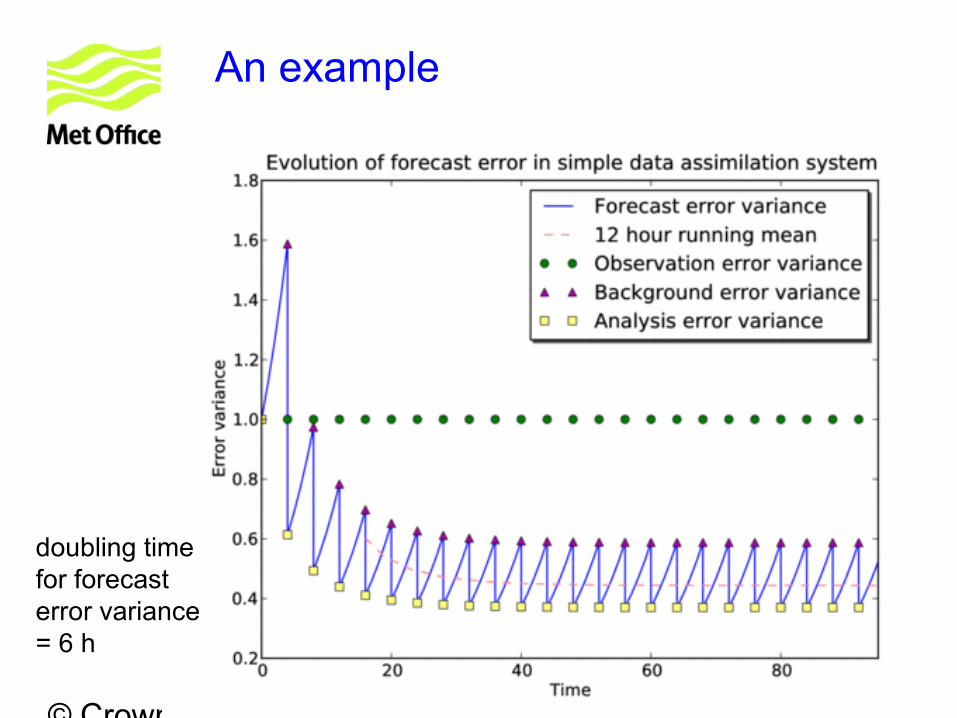
An example
doubling time for forecast error variance = 6 h
© Crown copyright 2007
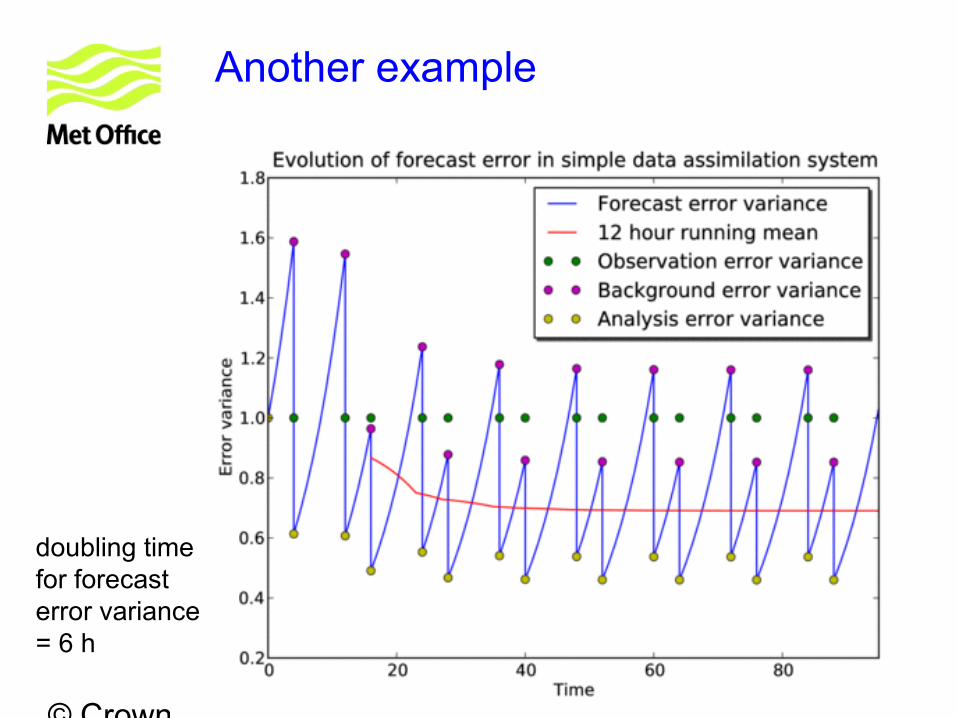
Another example
doubling time for forecast error variance = 6 h
© Crown copyright 2007
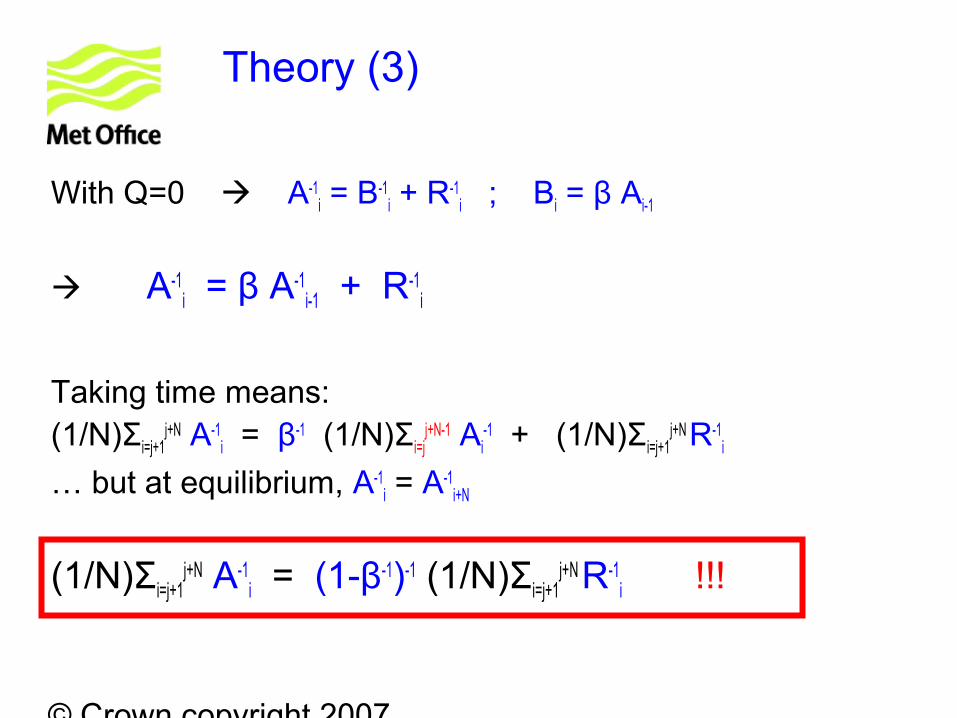
Theory (3)
With Q=0 A-1i = B-1
i + R-1i ; Bi = β Ai-1
A-1i = β A-1
i-1 + R-1i
Taking time means:(1/N)Σi=j+1
j+N A-1i = β-1 (1/N)Σi=j
j+N-1 Ai-1 + (1/N)Σi=j+1
j+N R-1i
… but at equilibrium, A-1i = A-1
i+N
(1/N)Σi=j+1j+N A-1
i = (1-β-1)-1 (1/N)Σi=j+1j+N R-1
i !!!
© Crown copyright 2007
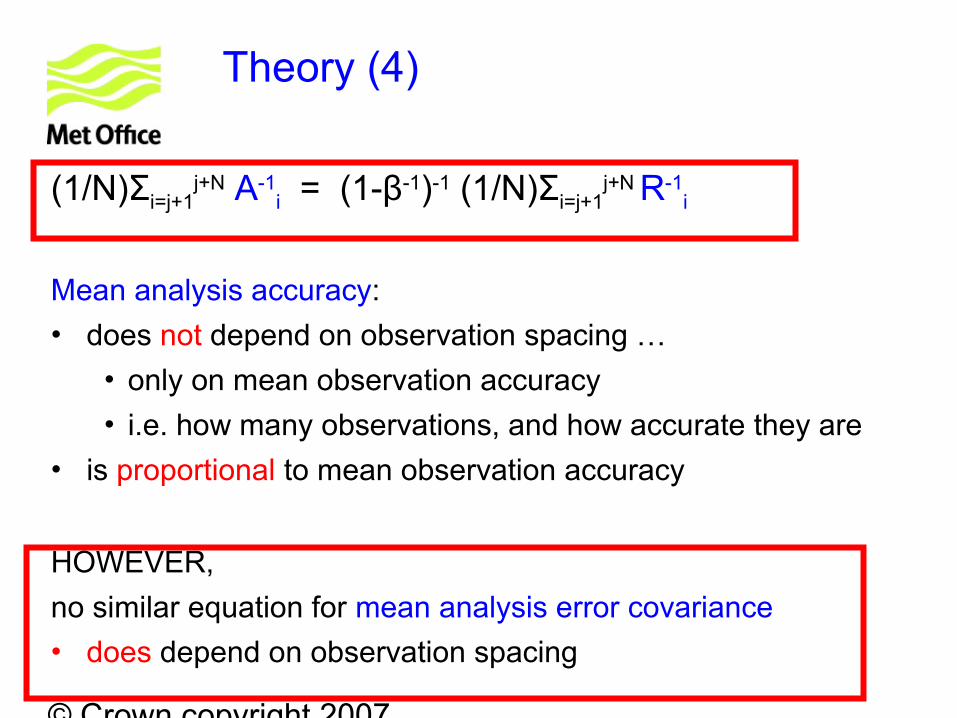
Theory (4)
(1/N)Σi=j+1j+N A-1
i = (1-β-1)-1 (1/N)Σi=j+1j+N R-1
i
Mean analysis accuracy:
• does not depend on observation spacing …
• only on mean observation accuracy
• i.e. how many observations, and how accurate they are
• is proportional to mean observation accuracy
HOWEVER,
no similar equation for mean analysis error covariance
• does depend on observation spacing
© Crown copyright 2007
Discussion of theory
Why is mean analysis error variance the most appropriate metric for global NWP?
Why mean?
• because we wish to optimise the observing system for forecasts for all parts of the world
Why error variance (and not accuracy)
• because we are most interested in improving bad analyses (bad forecasts), and not those that are already good.
© Crown copyright 2007
Experiments - Part I
© Crown copyright 2007
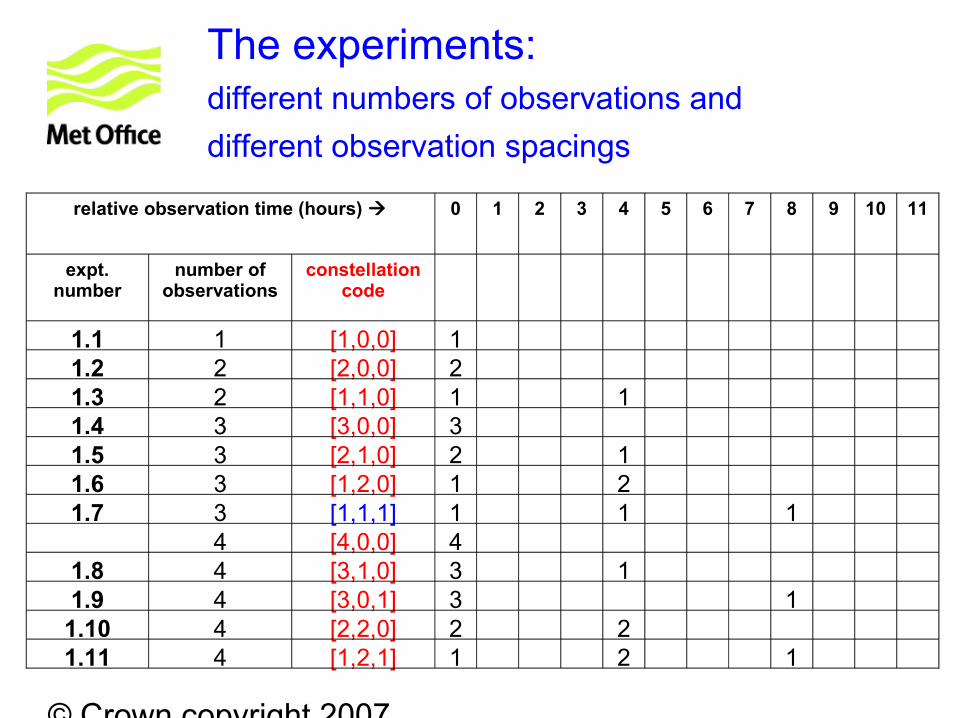
The experiments:different numbers of observations and
different observation spacings
relative observation time (hours) 0 1 2 3 4 5 6 7 8 9 10 11
expt. number
number of observations
constellation code
1.1 1 [1,0,0] 11.2 2 [2,0,0] 21.3 2 [1,1,0] 1 11.4 3 [3,0,0] 31.5 3 [2,1,0] 2 11.6 3 [1,2,0] 1 21.7 3 [1,1,1] 1 1 1
4 [4,0,0] 41.8 4 [3,1,0] 3 11.9 4 [3,0,1] 3 1
1.10 4 [2,2,0] 2 21.11 4 [1,2,1] 1 2 1
© Crown copyright 2007
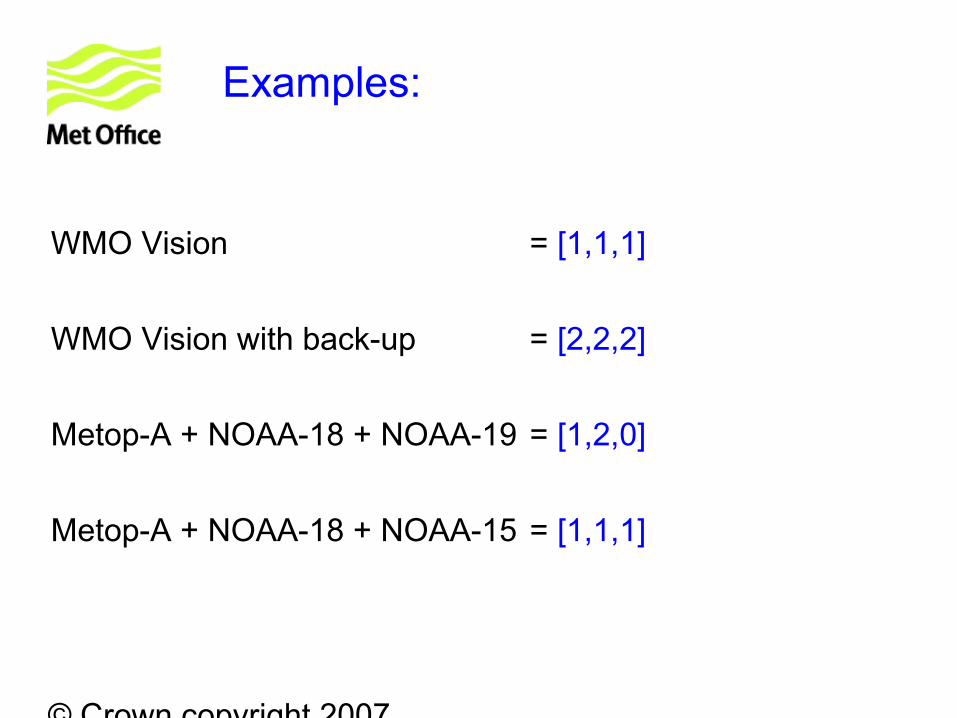
Examples:
WMO Vision = [1,1,1]
WMO Vision with back-up = [2,2,2]
Metop-A + NOAA-18 + NOAA-19 = [1,2,0]
Metop-A + NOAA-18 + NOAA-15 = [1,1,1]
© Crown copyright 2007
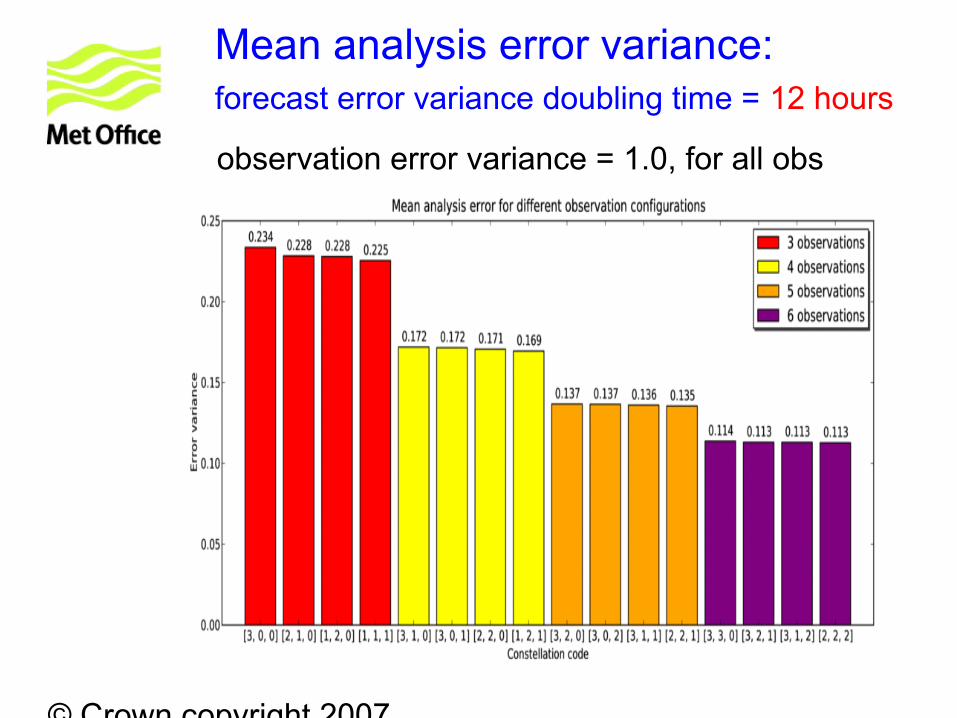
Mean analysis error variance:forecast error variance doubling time = 12 hours
observation error variance = 1.0, for all obs
© Crown copyright 2007
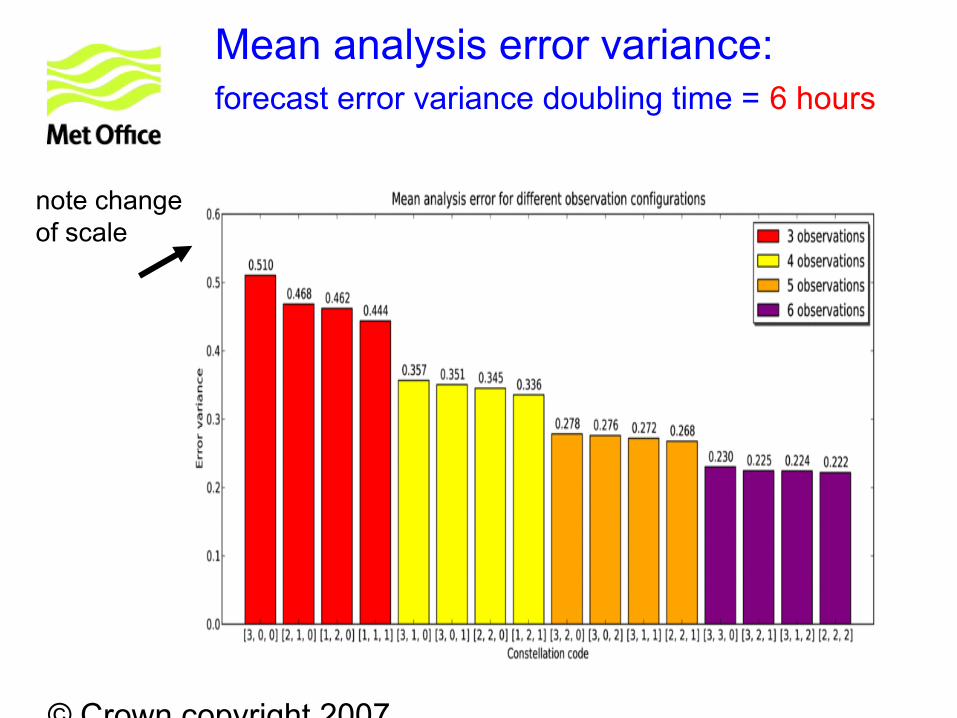
Mean analysis error variance:forecast error variance doubling time = 6 hours
note change of scale
© Crown copyright 2007
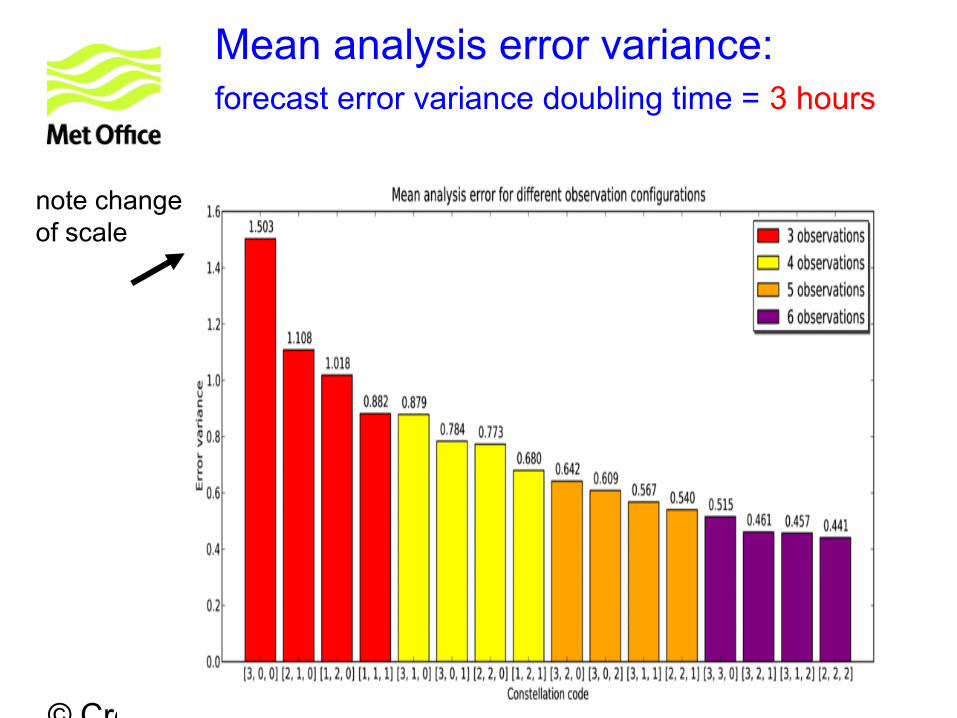
Mean analysis error variance:forecast error variance doubling time = 3 hours
note change of scale
© Crown copyright 2007
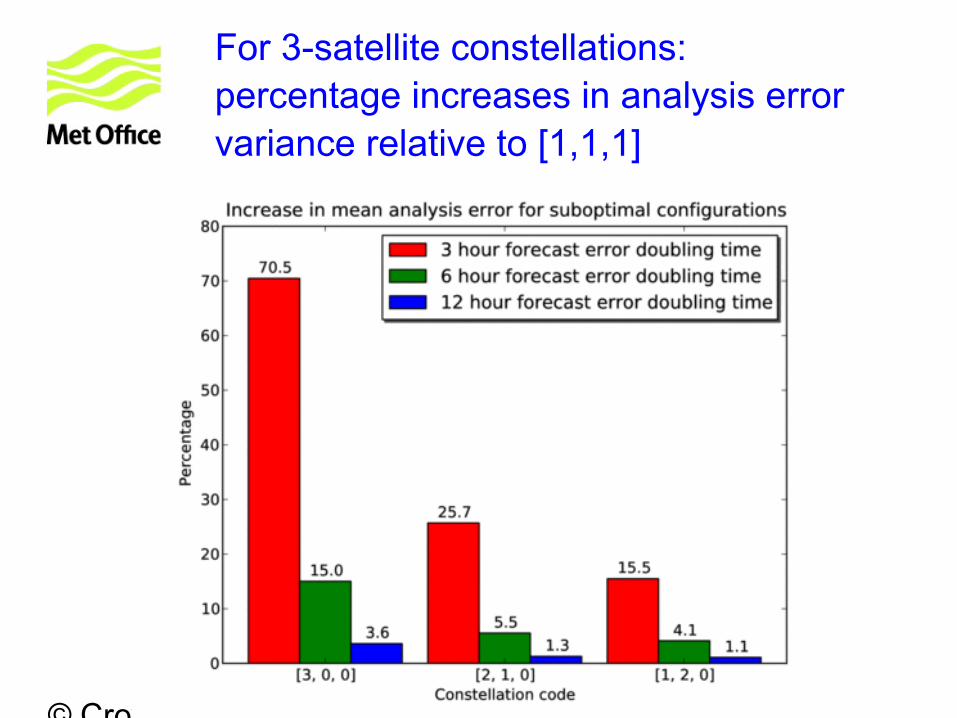
For 3-satellite constellations:percentage increases in analysis error variance relative to [1,1,1]
© Crown copyright 2007
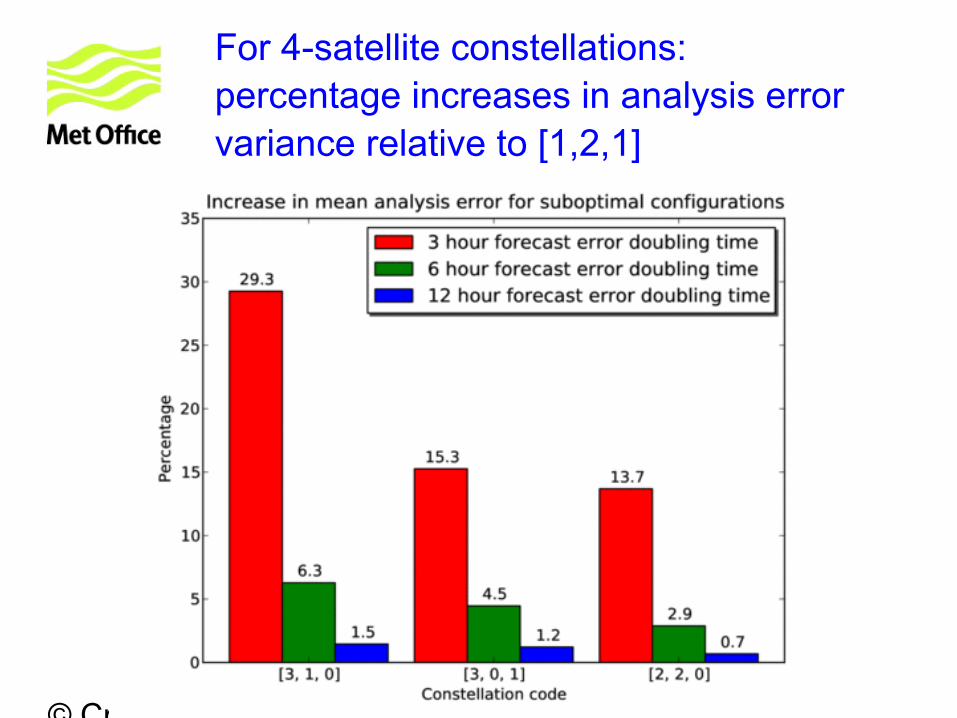
For 4-satellite constellations:percentage increases in analysis error variance relative to [1,2,1]
© Crown copyright 2007
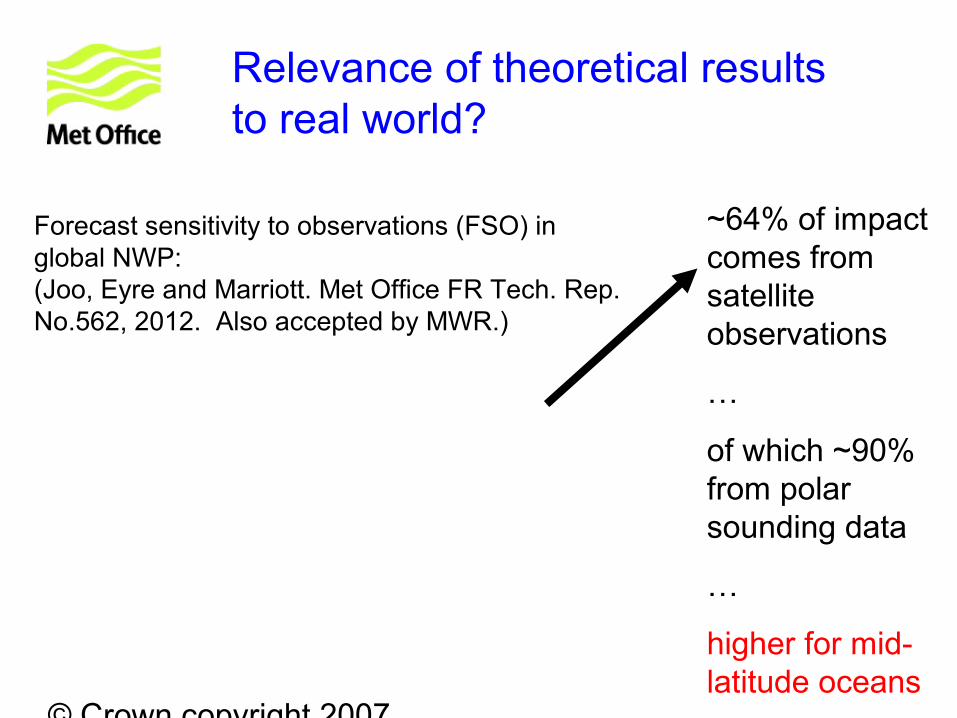
Forecast sensitivity to observations (FSO) in global NWP: (Joo, Eyre and Marriott. Met Office FR Tech. Rep. No.562, 2012. Also accepted by MWR.)
Relevance of theoretical results to real world?
~64% of impact comes from satellite observations
…
of which ~90% from polar sounding data
…
higher for mid-latitude oceans
© Crown copyright 2007
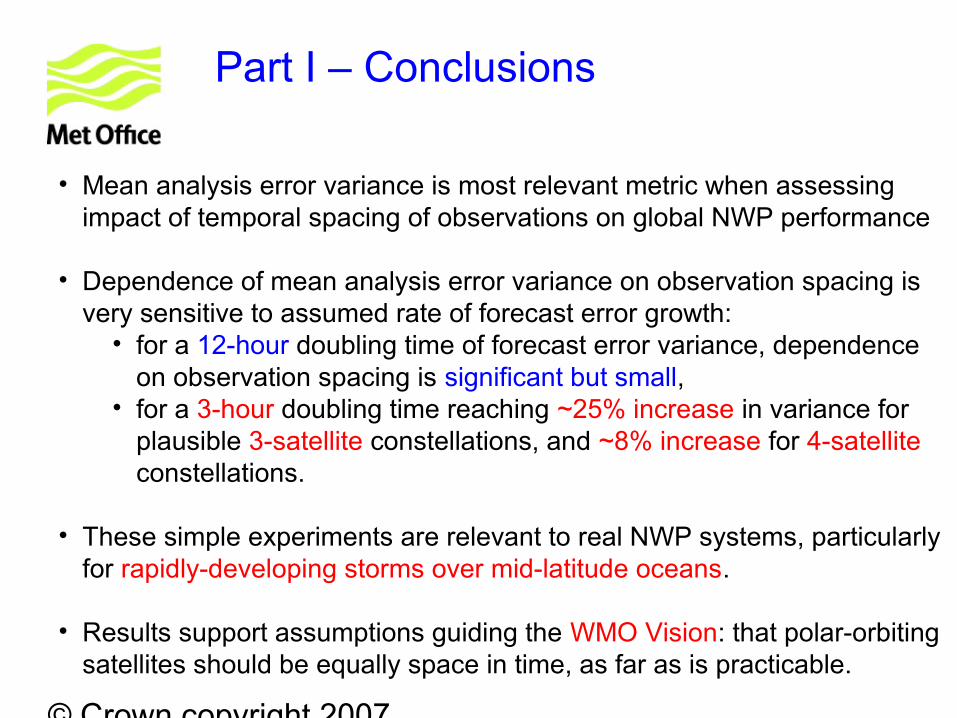
Part I – Conclusions
• Mean analysis error variance is most relevant metric when assessing impact of temporal spacing of observations on global NWP performance
• Dependence of mean analysis error variance on observation spacing is very sensitive to assumed rate of forecast error growth:
• for a 12-hour doubling time of forecast error variance, dependence on observation spacing is significant but small,
• for a 3-hour doubling time reaching ~25% increase in variance for plausible 3-satellite constellations, and ~8% increase for 4-satellite constellations.
• These simple experiments are relevant to real NWP systems, particularly for rapidly-developing storms over mid-latitude oceans.
• Results support assumptions guiding the WMO Vision: that polar-orbiting satellites should be equally space in time, as far as is practicable.
© Crown copyright 2007
Experiments - Part II
All observations are equal …
… but some are more equal than others !
© Crown copyright 2007
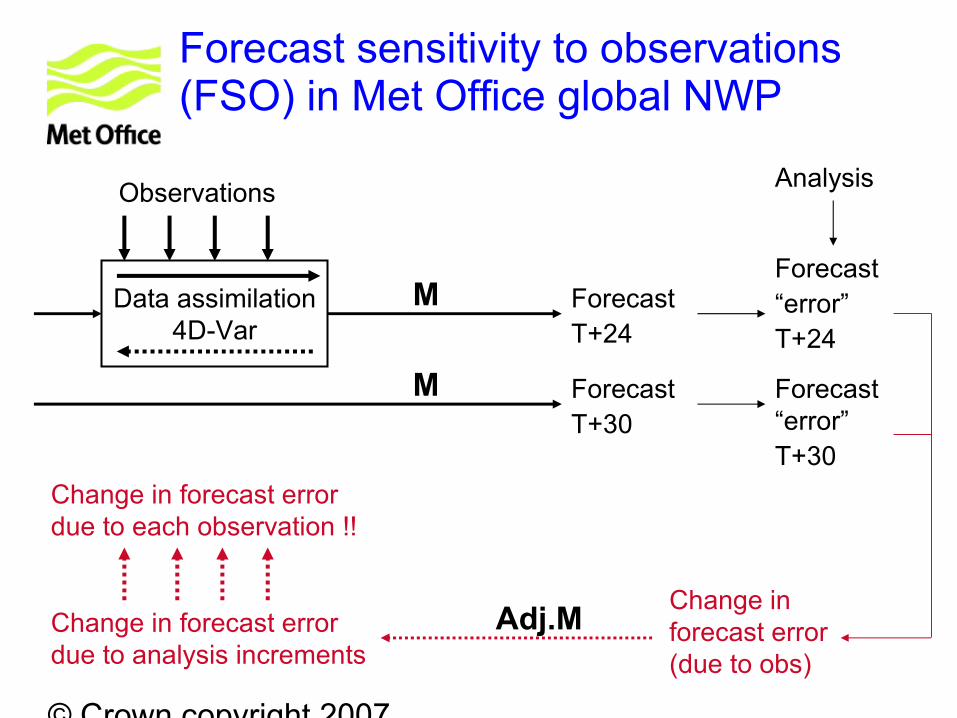
Forecast sensitivity to observations (FSO) in Met Office global NWP
Data assimilation 4D-Var
Observations
ForecastT+24
Analysis
Forecast“error”T+24
Forecast “error”T+30
M
M
Change in forecast error (due to obs)
Change in forecast error due to analysis increments
Change in forecast error due to each observation !!
Adj.M
ForecastT+30
© Crown copyright 2007
Forecast sensitivity to observations (FSO): importance of Metop data
© Crown copyright 2007
Forecast sensitivity to observations (FSO): sorted by satellite platform
© Crown copyright 2007
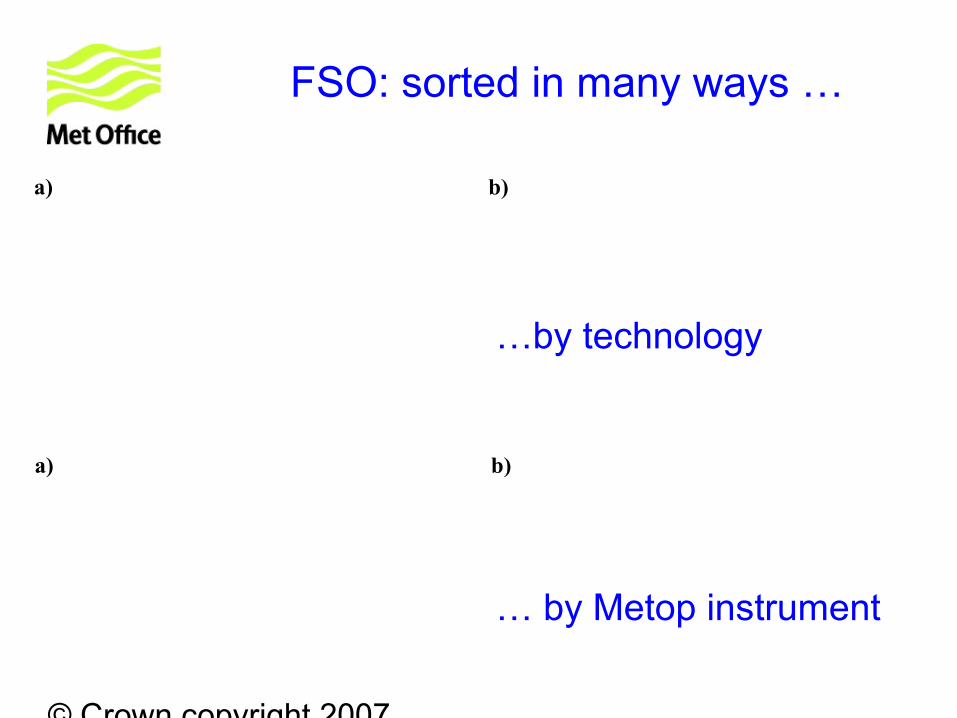
FSO: sorted in many ways …
a) b)
a) b)
…by technology
… by Metop instrument
© Crown copyright 2007
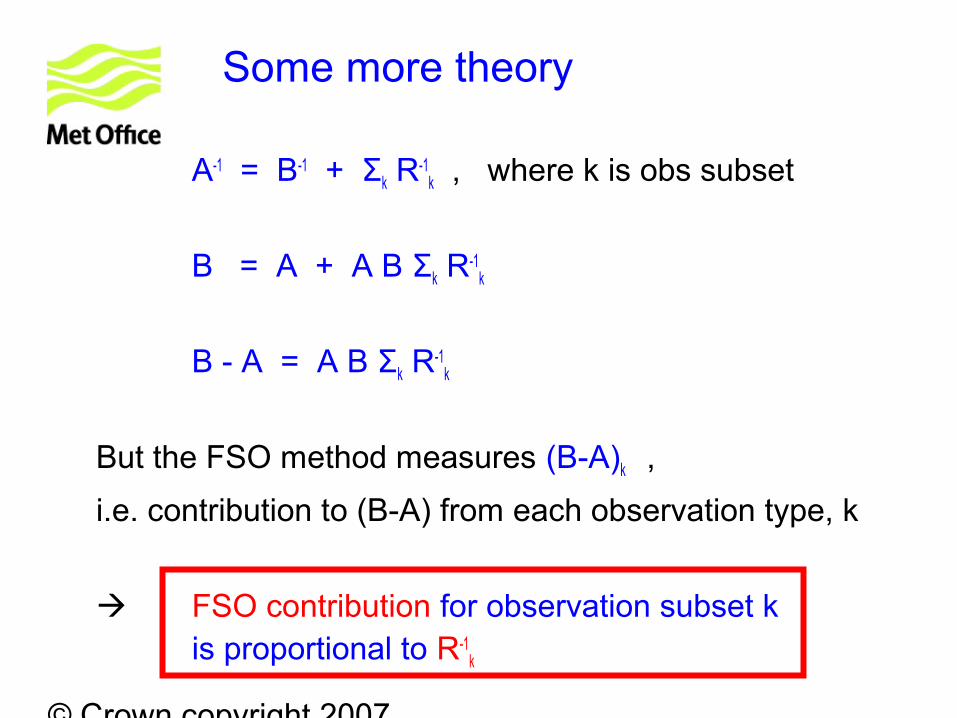
Some more theory
A-1 = B-1 + Σk R-1k , where k is obs subset
B = A + A B Σk R-1k
B - A = A B Σk R-1k
But the FSO method measures (B-A)k ,
i.e. contribution to (B-A) from each observation type, k
FSO contribution for observation subset k is proportional to R-1
k
© Crown copyright 2007
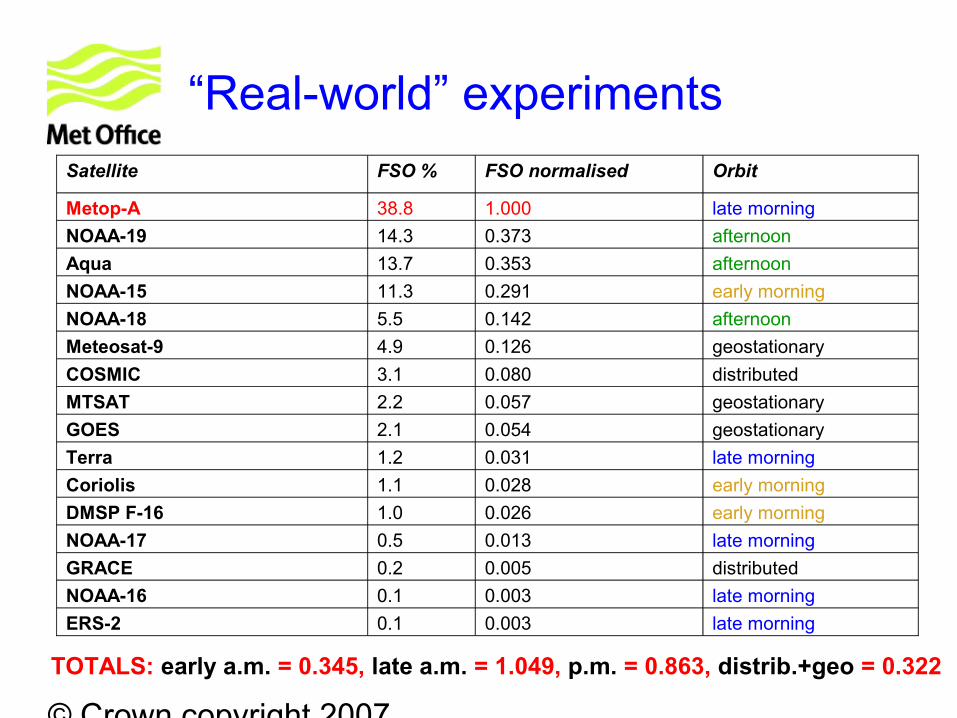
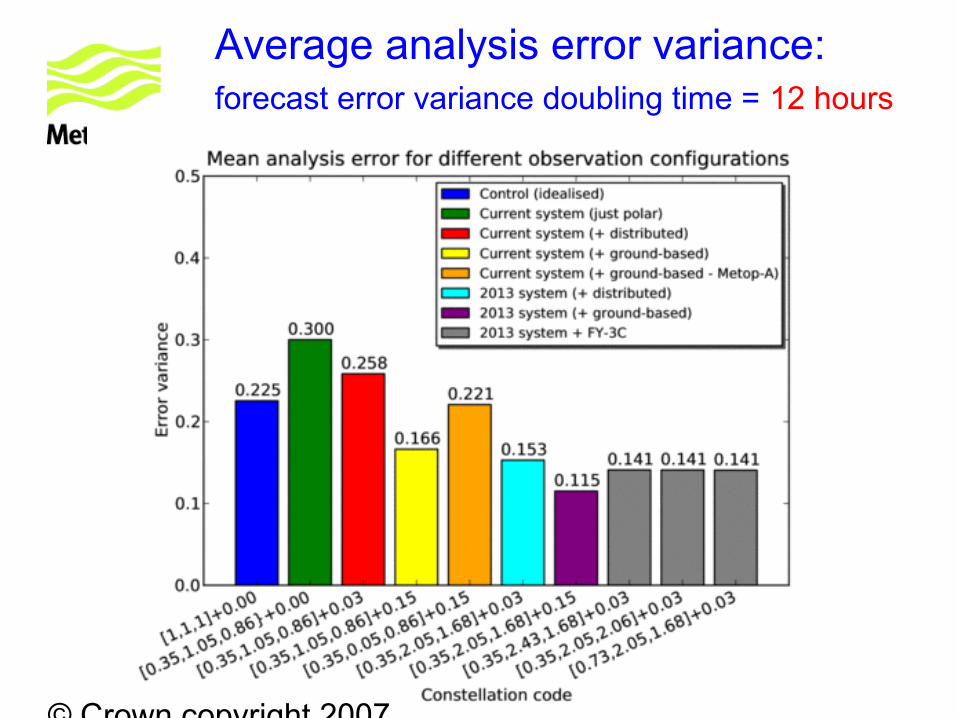
“Real-world” experiments
Satellite FSO % FSO normalised Orbit
Metop-A 38.8 1.000 late morning
NOAA-19 14.3 0.373 afternoon
Aqua 13.7 0.353 afternoon
NOAA-15 11.3 0.291 early morning
NOAA-18 5.5 0.142 afternoon
Meteosat-9 4.9 0.126 geostationary
COSMIC 3.1 0.080 distributed
MTSAT 2.2 0.057 geostationary
GOES 2.1 0.054 geostationary
Terra 1.2 0.031 late morning
Coriolis 1.1 0.028 early morning
DMSP F-16 1.0 0.026 early morning
NOAA-17 0.5 0.013 late morning
GRACE 0.2 0.005 distributed
NOAA-16 0.1 0.003 late morning
ERS-2 0.1 0.003 late morning
TOTALS: early a.m. = 0.345, late a.m. = 1.049, p.m. = 0.863, distrib.+geo = 0.322
© Crown copyright 2007
Average analysis error variance:forecast error variance doubling time = 12 hours
© Crown copyright 2007
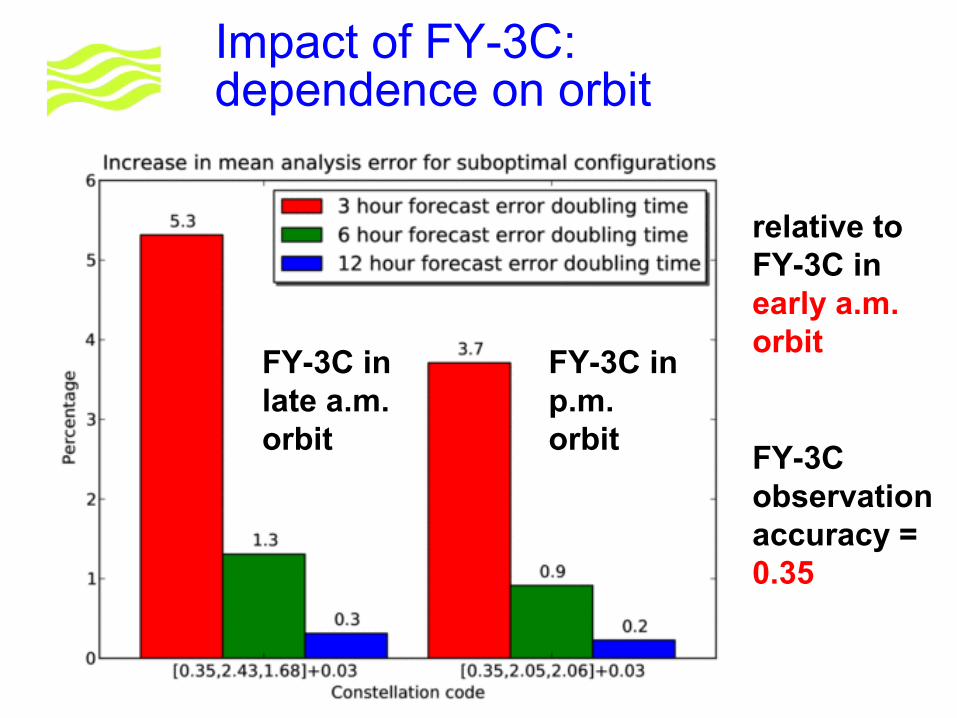
Impact of FY-3C:dependence on orbit
FY-3C in late a.m. orbit
FY-3C in p.m. orbit
relative to FY-3C in early a.m. orbit
FY-3C observation accuracy = 0.35
© Crown copyright 2007
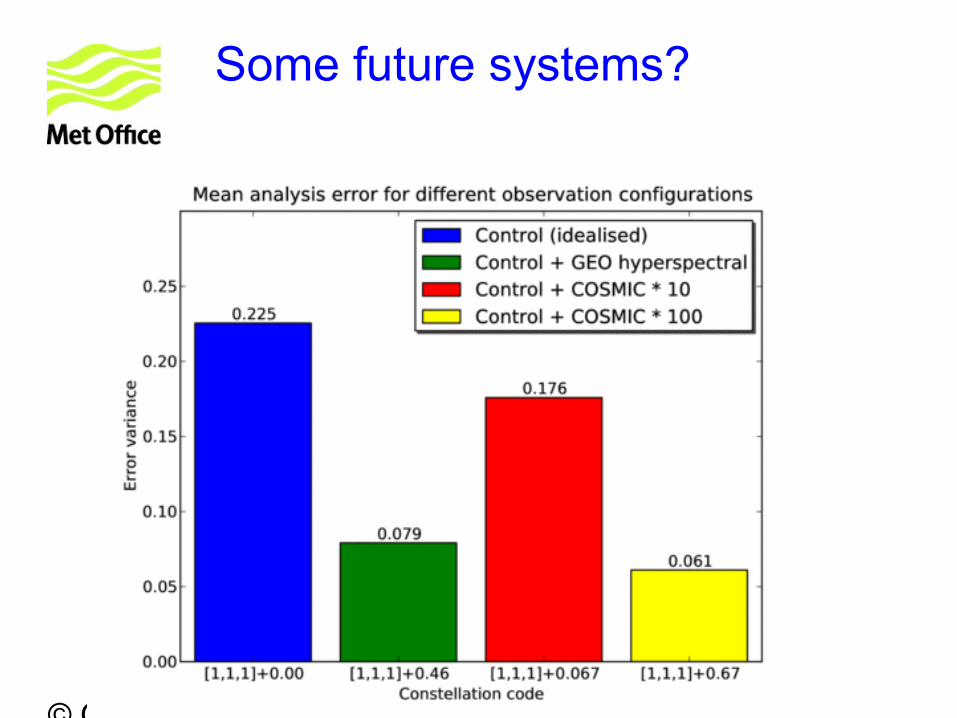
Some future systems?
© Crown copyright 2007
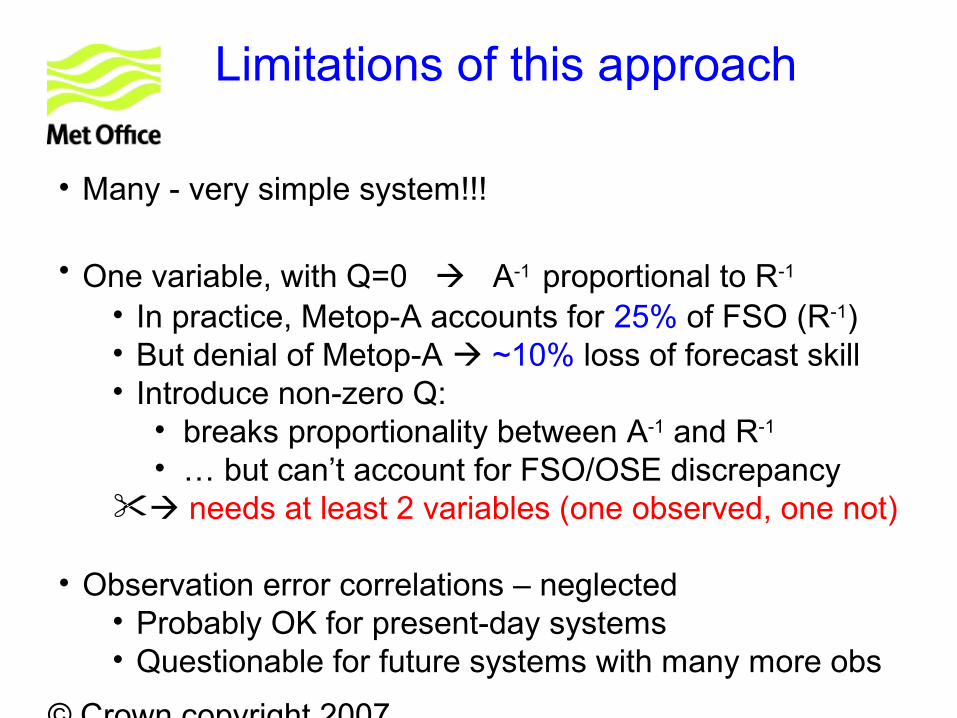
Limitations of this approach
• Many - very simple system!!!
• One variable, with Q=0 A-1 proportional to R-1
• In practice, Metop-A accounts for 25% of FSO (R-1)• But denial of Metop-A ~10% loss of forecast skill• Introduce non-zero Q:
• breaks proportionality between A-1 and R-1 • … but can’t account for FSO/OSE discrepancy
needs at least 2 variables (one observed, one not)
• Observation error correlations – neglected• Probably OK for present-day systems• Questionable for future systems with many more obs
© Crown copyright 2007
Overall conclusions
© Crown copyright 2007
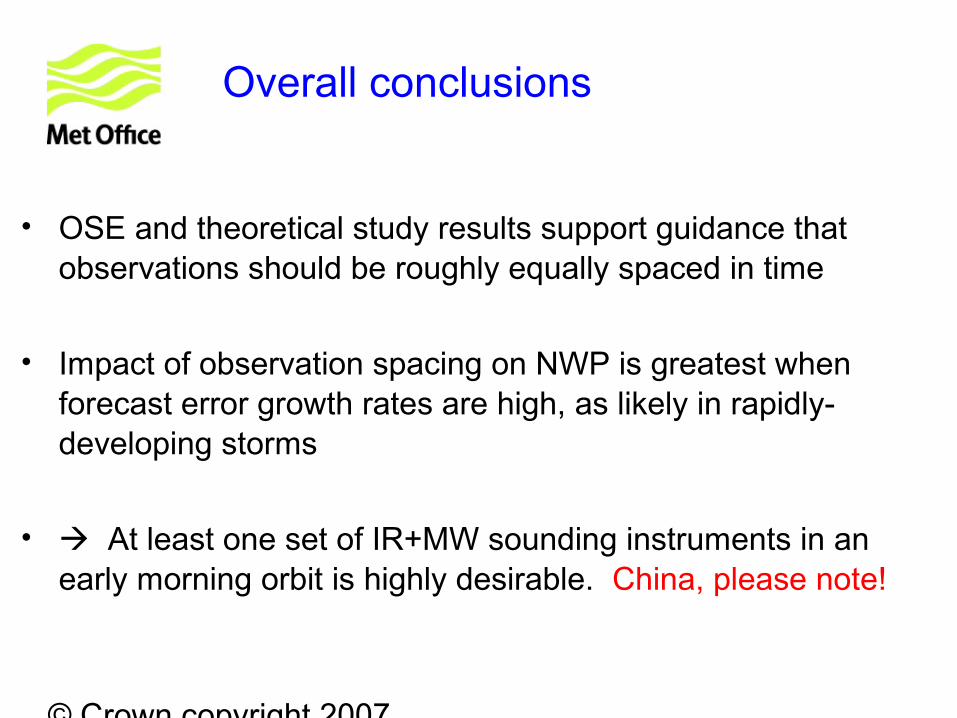
Overall conclusions
• OSE and theoretical study results support guidance that observations should be roughly equally spaced in time
• Impact of observation spacing on NWP is greatest when forecast error growth rates are high, as likely in rapidly-developing storms
• At least one set of IR+MW sounding instruments in an early morning orbit is highly desirable. China, please note!

© Crown copyright 2007
Thank you! Questions?