Embed Size (px)
Citation preview
Preliminary and incomplete (not for citation)
The Impact of the Bolsa Alimentação Program
on Food Consumption
Pedro Olinto1
Rafael Flores2
Saul Morris3
Alinne Veiga4
1 International Food Policy Research Institute ([email protected])2 Emory University3 The London School of Hygiene and Tropical Medicine 4 Instituto de Estudos do Trabalho e Sociedade

July, 2003
1. Introduction
Malnutrition in developing countries is a major constraint on both human and economic
development, being directly or indirectly responsible for a substantial proportion of the existing
high levels of preventable morbidity and mortality, especially among women and children. For
example, it has been estimated that over 20% of worldwide disability-adjusted life years
(DALYs) due to mortality and morbidity can be attributed to malnutrition, with some more
speculative estimates putting the proportion at around one half (Gillespie and Haddad, 2001).
Also, 55% of deaths of children under five are directly or indirectly attributable to malnutrition.
In young children, malnutrition can impair physical, mental and cognitive development due to
decreasing motivation, curiosity, and reduced play and exploratory activities.5 There is also clear
evidence that malnutrition rates are disproportionately concentrated among the poor (Wagstaff
and Watanabe, 2000).
In addition to the strong moral motivation for eradicating malnutrition and its
consequences, there is also a strong economic motivation. For example, it has been estimated
that in Asia, where the problem of malnutrition is most severe, the annual economic loss due to
various components of undernutrition can be as high as 3% of GDP (Horton, 1999) and may be
higher. In addition, microeconometric analysis of household data provides evidence of a strong
link between nutritional status, productivity and household incomes6, as well as between
nutritional status and education achievements.7 It is therefore unsurprising that malnutrition is
both a cause and a consequence of poverty and its intergenerational transmission.
Although these human and economic costs of undernutrition are now well understood,
there has still been very little progress in its mitigation (Gillespie and Haddad, 2001; UN, 2002).
This is due in part to failures to achieve poverty reductions in many developing countries over the
5 See, for example, Haas et al (1996), Grantham-McGregor (1998), Martorell (1995, 1999), Martorell, Khan andSchreoder (1994), and Martorell, Riveria and Kaplowitz (1989). Balasz et al. (1986) and Pollitt (1997, 2001) reviewstudies that link nutrition and brain development in children. Bhargava (1997) found that the removal of intestinalparasites such as hookworm and schistosomiasis is important for child development.6 See, for example, Boissiere, Knight and Sabot (1985), Strauss (1986), Jamison (1986), Moock and Leslie (1986),Deolalikar (1988), Behrman and Deolalikar (1989), Leslie and Jamison (1990), Pollitt (1990), Haddad and Bouis(1991), Behrman (1993), Strauss and Thomas (1995), Alderman et al (1996), Glewwe (1996), Lavy, Spratt andLeboucher (1997), Thomas and Strauss (1997), and Behrman and Rosenzweig, (2001). Although there is ampleevidence on the positive link between nutritional status, labor outcomes, productivity and wages, the mechanismsunderlying these relationships are not entirely clear.
1990s, but also reflects the absence of direct action. The Bolsa Alimentação program is part of a
recent reversal in the latter trend. Many Latin American governments, including those in Mexico,
Colombia, Honduras and Nicaragua, are now undertaking large programs to encourage
investments in the human capital of children in poor households through cash transfers linked to
nutrition, health, and education programs. Programs like Bolsa Alimentação demonstrate
recognition by the government of the costs of undernutrition and the willingness to undertake
targeted interventions towards its eradication.
2. The Bolsa Alimentação program
Bolsa Alimentação is a federal program designed to reduce nutritional deficiencies and
infant mortality among the poorer households in Brazil. The program is a demand-side incentive
with money transfers to very low-income families with pregnant and lactating women, and/or
infants and young children aged 6 months to 6 years. The cash transfer is conditional on women
committing to a ‘Charter of Responsibilities’ which requires regular attendance at ante-natal care
and growth monitoring, compliance with vaccination schedules, and health and nutrition
education. This ‘partnership of trust’ is intended to reinforce the bond between the local health
services and marginalized families of limited resources. The program benefits approximately
800,000 pregnant and lactating women, and 2,700,000 children, from approximately 2 million
households from all the 5,561 municipalities in the country. US$150 million are invested in this
program each year, from Brazilian Federal Funds for the Alleviation of Poverty.
In order to ensure the most effective use of government resources to reach the poor,
beneficiary households were selected in a two-stage process. In the first stage, the Ministry of
Health (MOH) allocated program funding to the municipalities in proportion to the fraction of
infants (aged 0-2 years) suffering from malnutition, as measured by weight for age. This fraction
was determined in a study by Benício and Monteiro that predicted municipality-level malnutrition
rates for all municipalities using observed malnutrition prevalence for the municipalities in the
National Survey of Demography and Health (PNDS). Provided that a municipality agreed to
fulfill the conditions required by the BA administration for participation in the program, the
MOH allocated the corresponding quota of grants to that municipality.
In the second stage of targeting, the municipalities identified beneficiary households that
would receive the grants. The size of the grant a household receives is a function of the number
7 See, for example, Glewwe and Jacoby (1995), Alderman, Behrman, Lavy and Menon (2000), and Glewwe, Jacoby
of household members who qualify as beneficiaries from the target population of children and
pregnant or lactating women under the program guidelines. Specifically, there were three types
of eligible individuals: (i) a pregnant woman, (ii) a mother breastfeeding a child up to six months
of age for whom maternal milk is the principal source of food, and (iii) children of age six months
up to seven years (i.e., less than seven). In practice, the breastfeeding requirement for infants
could be treated as a responsibility of the mother under the program, so that all children age 0-6
years in eligible households would be covered.
The Ministry of Health also considered several other criteria for eligibility designed to
identify poor households or those at greatest nutritional risk. Among these was some
combination of means testing (using reported income) and observed child health status (using
anthropometry). After some deliberation, it was decided that using existing health status as a
criterion for program eligibility created perverse incentives for parents to withhold food from a
child temporarily in order to gain access to the program. In addition, any household with young
children or a pregnant woman with income below the threshold could reasonably be considered to
be at risk of nutritional deficit even if none were observed presently. Therefore, an eligibility
requirement based solely on means testing was adopted. The administration of BA used the per
capita income threshold of one half of the national minimum wage (0.5 Salário Mínimo), or 90
reais per capita, which is the poverty line adopted for most government welfare programs.
Because the 90 reais threshold is used for eligibility in several other government
programs including Bolsa Escola, municipal authorities were asked to develop a register, the
cadastro unico, of all households living below 0.5 SM per capita. The method of identifying
households for the cadastro unico varied by municipality. Some municipalities conducted a
household survey to find poor households, often using the register for a previous nutrition
program, the Incentive to Combat Malnutrition (ICCN), as a starting point. In other
municipalities, families were invited to appear at central points (in most cases, the Unidades
Básicas de Saúde), and were warned that only those earning less than 0.5 SM per capita would be
considered eligible. At this point in time, households also provided the information contained in
the “pre-cadastro familiar/ individual/gestante/nutriz,” the family and individual pre-registration
forms. In many cases, no checking of the veracity of the socio-economic information provided
was possible initially, but families will be warned that they will be subject to home visits in the
future, and that false information will result in immediate suspension from the program.
and King (2000)
In practice, the process of registering eligible households, and therefore implementation
of the program, has been hampered by logistical and administrative difficulties. In some cases, it
has been difficult to identify poor households that were not already on a list of welfare recipients
from an earlier program. In those municipalities where registration relied on the initiative of the
household to report to a local health facility, identification of eligible households has often been
low. This may be due to lack of information about the program, or to the same transactions costs
in obtaining health services that the program is trying to overcome.
The size of the grants ranged from R$15 to a maximum of R$45 (US$6.25 to US$18.70)
per beneficiary per month, depending on the number of beneficiaries in the household.
Households received their transfers in the form of a magnetic card. The card could be redeemed
at CEF agency offices. A requirement of participation in the program is that the household must
commit to and sign a ‘Charter of Responsibilities’. The family’s duties under the charter include
obtaining regular prenatal care for pregnant women, vaccinations and growth monitoring for
children, and participation in educational programs on health and nutrition. Initial enrollment in
the program is for a period of six months, which could be extended if the family has completed
these commitments and remains income eligible.
3. Measuring the impact of Bolsa Alimentação: The empiricalstrategy
In order to evaluate the impact of the program, it was necessary to find an exogenous
factor affecting program participation for eligible households. In several municipalities, some
households were omitted from the program because of administrative errors in targeting. These
errors lead to quasi-random assignment of households into and out of the beneficiary group
within municipalities participating in the BA. This form of assignment can be used to provide
identification of program impacts for recipient households. There were two kinds of
administrative errors that led some households to be excluded: (i) two files containing household
identifying information were separated for some areas within municipalities, leading some
households in those areas to be excluded from the program, and (ii) if the individual listed as the
primary beneficiary for the household had a letter in his/her name not from the Roman alphabet
(e.g., é, ô, or ç) the household was excluded from the program. A retrospective household survey
was conducted in several municipalities in which these administrative errors were identified.
Random selection of households for interviews within these municipalities was stratified based on
whether the household was a beneficiary or was administratively omitted from the program.

Excluded households were found in 67 Brazilian municipalities. After checking with the
program’s implementation team, three additional criteria were established for the selection of the
municipalities to be included in the evaluation estudy:
1. Only municipalities from the Northeastern region were to be included in the
study, given that 60% of the beneficiaries reside in this region
2. For cost saving reasons, to be included a municipality had to have at least 40
excluded families
3. Municipalities had to be participating in the program for at least six months, so
that there would be enough time for the cash transfers to have an effect on
malnutrition
In April of 2002, when the survey team went to the field for the first round of data
gathering, there were four municipalities that fit the three criteria above: Teotônio Villela, in the
state of Alagoas, Mossoró, in the state of Rio Grande do Norte, Itabuna e Teixeira de Freitas in
the state of Bahia. In terms of the number of randomly excluded individuals, Teixeira de Freitas,
with 240 excluded, was the municipality with the largest sample, followed by Mossoró with 116
excluded applicants, Itabuna with 87, and Teotônio Vilela with 63. The first phase of data
collection for the impact evaluation of Bolsa Alimentação were carried in these four
municipalities.
The universe of randomly excluded households provides an ideal counterfactual for
similar beneficiaries that were selected into the program. To ensure the comparability of the two
groups, a sample of matching pregnant women and children was selected from the roster of
receiving beneficiaries. To increase the power of the statistical tests, 2 beneficiaries were matched
to each excluded woman and child. The matching criteria used were the following:
1. Residence in the same municipality
2. Same gender
3. Same age
4. Similar socio-economic characteristics

After a pool of beneficiary individuals were matched by criteria 1 to 3 above, data
collected during the registration process was used to determine which households best matched
those who were excluded in terms of socio-economic characteristics (criterion 4). The variables
used were: declared per-capita income, number of household members, rent paid, and the value of
water, electricity and gas expenses. The matching pairs with the lowest Euclidean distances in
terms of social economic variable to the excluded applicants were selected as comparison
observations.8
Thus, the special feature of the data collected for the evaluation of Bolsa Alimentação is
the existence of a control group formed by households who had actually applied for the program
and were eligible to benefit from it, but were unintentionally excluded from the program. The
exclusion of eligible households was due to bureaucratic mistakes that were beyond the control of
households or program management staff. In some aspects, this form of accidental experiment
provides better identification prospects because it is less likely to generate the usual
experimentation biases.9
4. Data and descriptive results
The database resulting from field survey in the four municipalities contains detailed
information on households’ consumption of a great variety of food goods. The data set also
contains information characteristics, as demographic, schooling levels and child anthropometrics.
In this paper we focus on the data of food expenditure to measure the impact of the program on
food consumption.
Table 1 below presents a series of summary statistics of pre-program characteristics for
the two groups surveyed, beneficiaries and non-beneficiaries. As it can be seen the two groups are
very similar in most characteristics (e.g. household size, schooling of the head of households an
mothers). Also, as expected, most of the households that were randomly excluded because of the
aforementioned bureaucratic mistakes were still not receiving the transfers from the program
when the survey was conducted. Nevertheless, 6.7% of the originally excluded households were
8 See IFPRI (2002) for details on the algorithm used to match excluded applicants to beneficiary individuals in terms ofsocio-economic variables.9 Experimental evaluations require the critical assumption that the experimental version of the program operates aswould a natural version. As pointed out by Hausman and Wise (1985) and Manski and Garfinkel (1992), for a varietyof reasons, this rarely happens and estimates of impact from experimental designs can rarely be extrapolated to the realworld.
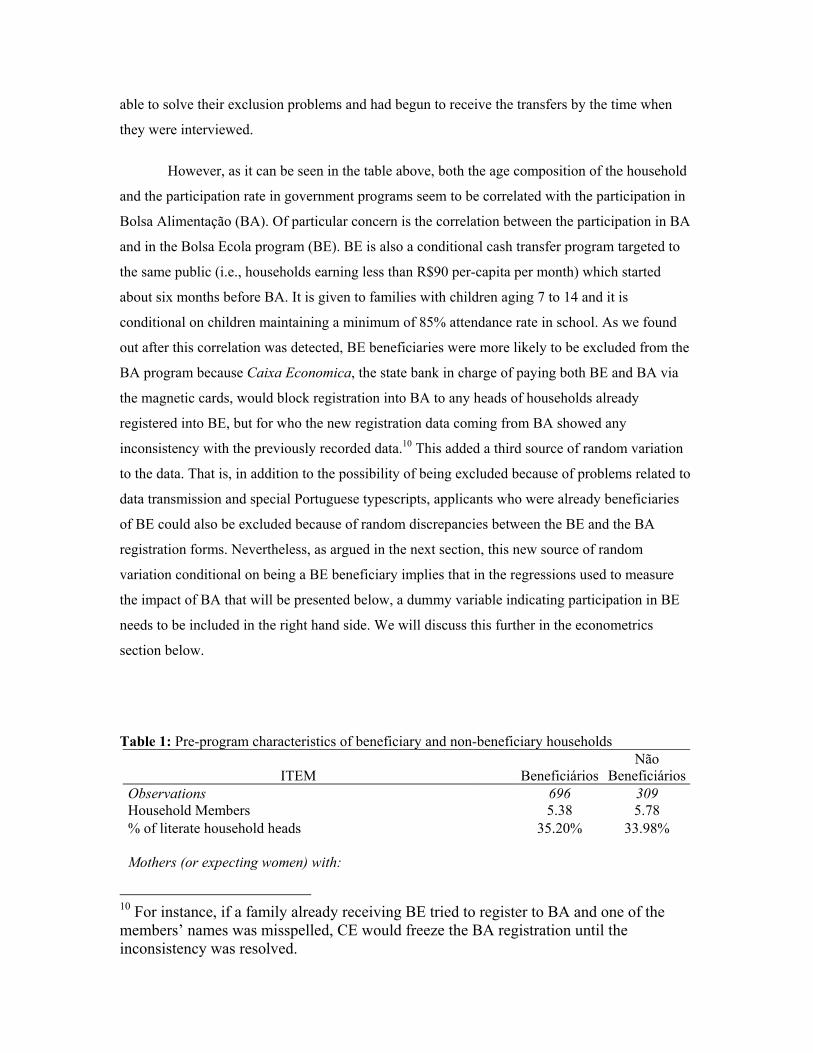
able to solve their exclusion problems and had begun to receive the transfers by the time when
they were interviewed.
However, as it can be seen in the table above, both the age composition of the household
and the participation rate in government programs seem to be correlated with the participation in
Bolsa Alimentação (BA). Of particular concern is the correlation between the participation in BA
and in the Bolsa Ecola program (BE). BE is also a conditional cash transfer program targeted to
the same public (i.e., households earning less than R$90 per-capita per month) which started
about six months before BA. It is given to families with children aging 7 to 14 and it is
conditional on children maintaining a minimum of 85% attendance rate in school. As we found
out after this correlation was detected, BE beneficiaries were more likely to be excluded from the
BA program because Caixa Economica, the state bank in charge of paying both BE and BA via
the magnetic cards, would block registration into BA to any heads of households already
registered into BE, but for who the new registration data coming from BA showed any
inconsistency with the previously recorded data.10 This added a third source of random variation
to the data. That is, in addition to the possibility of being excluded because of problems related to
data transmission and special Portuguese typescripts, applicants who were already beneficiaries
of BE could also be excluded because of random discrepancies between the BE and the BA
registration forms. Nevertheless, as argued in the next section, this new source of random
variation conditional on being a BE beneficiary implies that in the regressions used to measure
the impact of BA that will be presented below, a dummy variable indicating participation in BE
needs to be included in the right hand side. We will discuss this further in the econometrics
section below.
Table 1: Pre-program characteristics of beneficiary and non-beneficiary households
ITEM BeneficiáriosNão
BeneficiáriosObservations 696 309Household Members 5.38 5.78% of literate household heads 35.20% 33.98%
Mothers (or expecting women) with:
10 For instance, if a family already receiving BE tried to register to BA and one of themembers’ names was misspelled, CE would freeze the BA registration until theinconsistency was resolved.

No schooling at all 9.46% 9.16%Incomplete primary schooling 72.52% 71.54%Complete primary schooling 5.86% 6.91%Incomplete secondary schooling 4.05% 5.47%Complete secondary schooling 5.86% 3.38%
Demographic structure:Average number of kids aging 0 to < 4 1.07 0.90Average number of kids aging 4 to < 7 0.86 1.44Average number of kids aging 7 to < 15 0.84 2.94
Participation on government programs:% households beneficiary of Bolsa Alimentação 93.9% 6.7%% households beneficiary of Bolsa Escola 26.8% 55.7%% households beneficiary of Vale Gás 91.1% 54.6%% households beneficiary of ICCN 3.2% 13.5%
Notwithstanding the identification issues described above, in Table 2 below and in the
appendix we present tables that compare the expenditure patterns between the two groups in our
sample. As it can be seen in Table 2, total and per-capita expenditures are very similar in both
groups. Per-capita expenditure figures indicate that the average beneficiary in the sample is well
below the cut of point of R$90 per-capita (or half minimum wage). Food and non-food
expenditure results suggest that the program might be having an effect household expenditure
patterns in favor of greater consumption of food and lower consumption of non-food items.
Table 2. Expenditure patterns of beneficiary and non-beneficiary households.
ITEM BeneficiáriosNão
BeneficiáriosObservations 696 309Total household expenditure 380.58 376.47Per-capita household expenditure 77.73 72.60Housing expenditures 46.32 51.36Total expenditure on non-food items 88.79 94.79Total exp. on food-items (excluding alcoholic beverages) 243.78 228.53Total expenditure on fresh meats 61.10 56.09Total expenditure on fruits and vegetables 21.04 17.64Total expenditure on grains 87.64 84.23
The tables in appendix present statistical tests for the differences in the average
consumption (incidence and value) of several food items between beneficiaries and non-
beneficiary households. The results show that beneficiary households exhibit statistically
significant higher consumption in several food items, particularly fruits and vegetable, and fish
and bovine meat. For instance, it seems that at the time of the survey, 25% more beneficiary
households had consumed fish at least once in the past week, and 10% more beneficiary
households had consumed red meat. A higher consumption of meats is consistent with a high
income elasticity of meat consumption reported by many observers in Brazil. Higher incidence
and value of consumption of fruits and vegetables by beneficiaries is also evident.
In sum, it appears from these initial results the diets of beneficiary families was richer
than the diets of non-beneficiary families. However, while the results suggest that there are
statistically significant differences consumption patterns between the two groups, because of the
identifications issues discussed above, inferences on the impact of the impact of the program
needs to wait until further more controlled regression analysis to be carried below.
5. The impact of Bolsa Alimentação on dietary diversity
In the previous section we discussed results that suggest that beneficiaries of the Bolsa
Alimentação program appear to attain a richer diet than non-beneficiary. In this section we look
into this relationship further by estimating the impact of the program on dietary diversity.
As Hoddinott and Yohannes (2002) indicates, households with low levels of dietary
diversity are also likely to have low levels of consumption per person and low caloric availability.
Changes in dietary diversity – as defined as the number of unique foods consumed – are a good
indicator of changes in per capita consumption and per capita caloric acquisition, “access”
measures of household food security. Changes in dietary diversity are also associated with
changes in the consumption of staples and non-staples, with the magnitude of this association
being higher in the case of the latter. As such, they conclude, dietary diversity can play a role in
identifying the food insecure, in monitoring changes in circumstances as well as assessing the
impact of interventions like Bolsa Alimentação.
If our sample had been obtained from a “pure” social experiment in which applicants for
the program were selected in or out of BA randomly, as suggested by Hoddinott and Yohannes, to
estimate the impact of the program on dietary diversity we would just estimate the parameters in
the following model:
(1) εβα ++= ii BAN ,

where Ni is the number of food items consumed by the household in the last seven days, BAi is a
dummy variable indicating participation in the BA program, and ε is a random disturbance which
captures the effects of other factors influencing dietary diversity. The parameter α in (1) measures
the average number of food items consumed by non-beneficiary households, and β measures the
impact of the program on the number of food items consumed. Under an experimental design, ε is
sure to be uncorrelated to BAi and therefore, the OLS estimator of β is unbiased and consistent.
However, our sample includes households who were excluded quasi-randomly from the program.
Particularly, as shown above, households who were registered in the Bolsa Escola program were
more likely to be excluded from BA by Caixa Economica because of conflicting registration
information.
Nevertheless, conditional on being a BE beneficiary, whether or not an applicant was
excluded from BA is still random and probably not related to other household characteristics that
may influence dietary diversity.11
Therefore, β may still be unbiasedly and consistently estimated via OLS if a dummy
variable indicating BE participation is also included in the right hand side of (1). In that case we
would estimate the parameters in the following model:12
(2) εδβα +++= iii BEBAN ,
where BEi is an dummy variable indicating participation on BE, and δ is the effect of BE
participation on dietary diversity. Note however that the OLS estimator of δ in (2) may not be
consistent if BEi is endogenous.13 Still, as shown in Appendix B, the OLS estimator of β will be
consistent even if the estimator of δ is not.
Table 3 below shows estimates of the impact of Bolsa Alimentação on dietary diversity
obtained via OLS regression on equation (2). While, columns (1) and (2) present results from
11 Caixa Economica excluded beneficiaries of BE from BA when the new registration information was not exactlyidentical to what was entered previously by BE. This was largely due to misspelling of names and other data entryproblems, and therefore is very unlikely to be related to unobserved factors affecting dietary diversity. 12 See Appendix B for a proof that the OLS estimator of β in equation (2) is consist and unbiased.13 BEi will be endogenous if participation in Bolsa Escola is correlated to unobserved characteristics that also affect dietdiversity. That is, if BEi is correlated to ε.
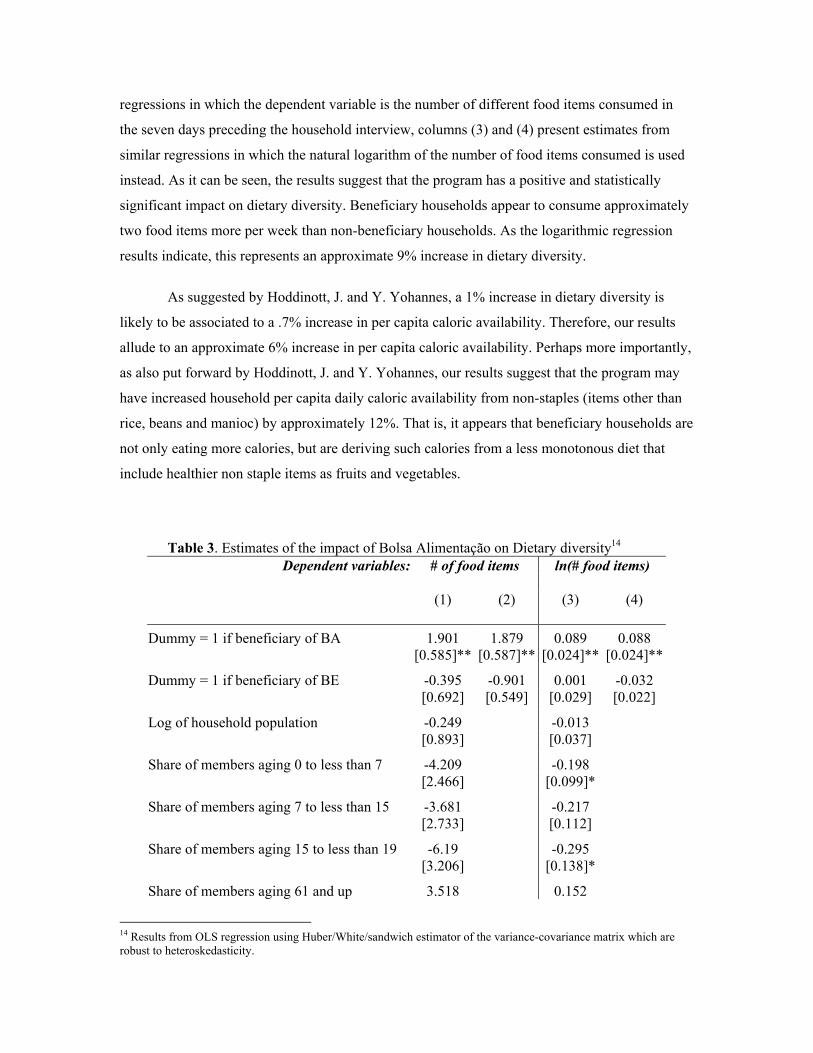
regressions in which the dependent variable is the number of different food items consumed in
the seven days preceding the household interview, columns (3) and (4) present estimates from
similar regressions in which the natural logarithm of the number of food items consumed is used
instead. As it can be seen, the results suggest that the program has a positive and statistically
significant impact on dietary diversity. Beneficiary households appear to consume approximately
two food items more per week than non-beneficiary households. As the logarithmic regression
results indicate, this represents an approximate 9% increase in dietary diversity.
As suggested by Hoddinott, J. and Y. Yohannes, a 1% increase in dietary diversity is
likely to be associated to a .7% increase in per capita caloric availability. Therefore, our results
allude to an approximate 6% increase in per capita caloric availability. Perhaps more importantly,
as also put forward by Hoddinott, J. and Y. Yohannes, our results suggest that the program may
have increased household per capita daily caloric availability from non-staples (items other than
rice, beans and manioc) by approximately 12%. That is, it appears that beneficiary households are
not only eating more calories, but are deriving such calories from a less monotonous diet that
include healthier non staple items as fruits and vegetables.
Table 3. Estimates of the impact of Bolsa Alimentação on Dietary diversity14
Dependent variables: # of food items ln(# food items)
(1) (2) (3) (4)
Dummy = 1 if beneficiary of BA 1.901 1.879 0.089 0.088[0.585]** [0.587]** [0.024]** [0.024]**
Dummy = 1 if beneficiary of BE -0.395 -0.901 0.001 -0.032[0.692] [0.549] [0.029] [0.022]
Log of household population -0.249 -0.013[0.893] [0.037]
Share of members aging 0 to less than 7 -4.209 -0.198[2.466] [0.099]*
Share of members aging 7 to less than 15 -3.681 -0.217[2.733] [0.112]
Share of members aging 15 to less than 19 -6.19 -0.295[3.206] [0.138]*
Share of members aging 61 and up 3.518 0.152
14 Results from OLS regression using Huber/White/sandwich estimator of the variance-covariance matrix which arerobust to heteroskedasticity.
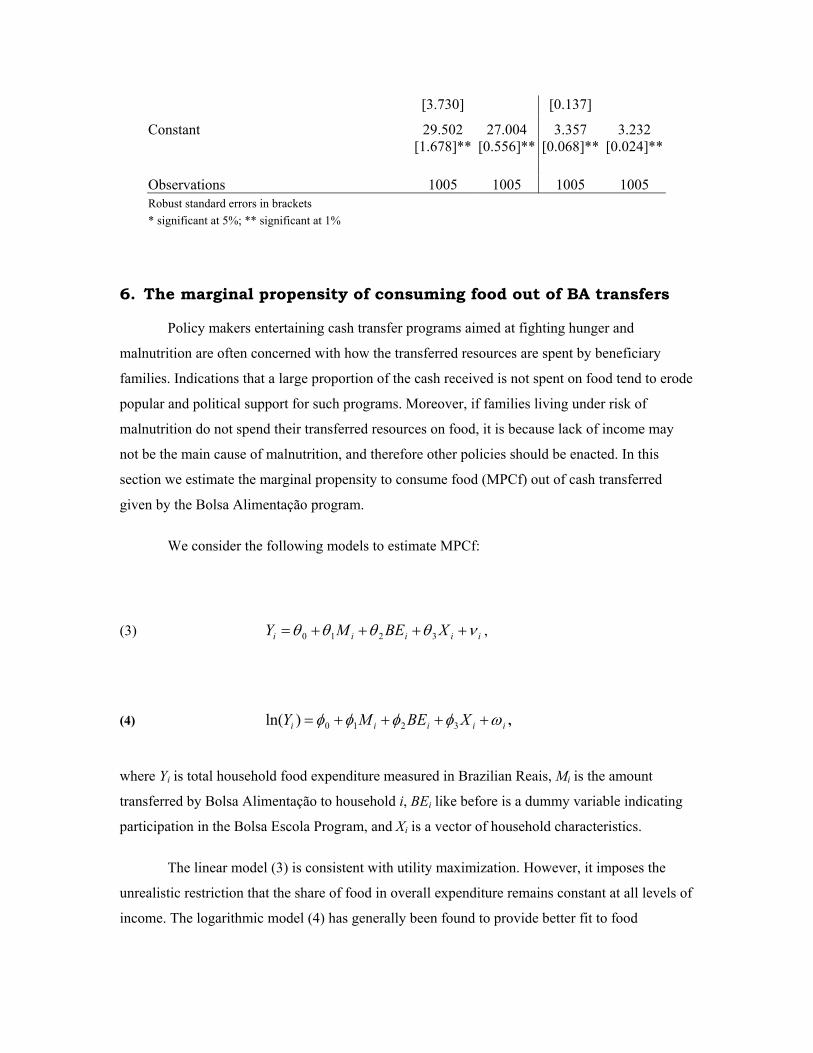
[3.730] [0.137]
Constant 29.502 27.004 3.357 3.232[1.678]** [0.556]** [0.068]** [0.024]**
Observations 1005 1005 1005 1005Robust standard errors in brackets* significant at 5%; ** significant at 1%
6. The marginal propensity of consuming food out of BA transfers
Policy makers entertaining cash transfer programs aimed at fighting hunger and
malnutrition are often concerned with how the transferred resources are spent by beneficiary
families. Indications that a large proportion of the cash received is not spent on food tend to erode
popular and political support for such programs. Moreover, if families living under risk of
malnutrition do not spend their transferred resources on food, it is because lack of income may
not be the main cause of malnutrition, and therefore other policies should be enacted. In this
section we estimate the marginal propensity to consume food (MPCf) out of cash transferred
given by the Bolsa Alimentação program.
We consider the following models to estimate MPCf:
(3) iiiii XBEMY νθθθθ ++++= 3210 ,
(4) iiiii XBEMY ωφφφφ ++++= 3210)ln( ,
where Yi is total household food expenditure measured in Brazilian Reais, Mi is the amount
transferred by Bolsa Alimentação to household i, BEi like before is a dummy variable indicating
participation in the Bolsa Escola Program, and Xi is a vector of household characteristics.
The linear model (3) is consistent with utility maximization. However, it imposes the
unrealistic restriction that the share of food in overall expenditure remains constant at all levels of
income. The logarithmic model (4) has generally been found to provide better fit to food

consumption data. While in model (3) the MPCf out of BA transfers is given by 1θ=∂∂ ii MY ,
in model (4) it will depend on the level of food consumption and therefore will be given by
iii YMY .1φ=∂∂ .
It is also important to note that while participation on BA is exogenous (conditional on
participation on BE), the amount received by each household (Mi) will depend on the number of
children aging 0 to 7 which may be correlated to unobserved household characteristics that affect
expenditure on food. That is, Mi may well be correlated to the disturbance terms νi and ωi, in
which case the OLS estimators of the parameters in (3) and (4) will be biased and inconsistent. To
address this problem we also estimate (3) and (4) via Instrumental Variable methods (IV) using
the dummy variable indicating participation (BAi) as an instrumental variable for the amount
received Mi.15
Table 4 below presents the results of the OLS and IV estimation of the parameters in
models (3) and (4). Columns (1)-(3) present the estimates for equation (4), while columns (4)-(6)
present the estimates for equation (3). The OLS estimates for both models are presented in
columns (1), (2), (4) and (5), while the IV estimates are in the remaining columns. From the
Hausman specification tests performed, we cannot conclude that the OLS and the IV estimators
are different for neither of the models. Therefore, it does not appear that the variable Mi is
endogenous in both regressions. In this case the OLS estimator is more efficient and preferable to
the IV estimator. Also, the F-test rejects the null hypothesis that the coefficients on all
demographic variables (shares of each age group) are equal to zero. Therefore we concentrate our
discussion below based on the estimates presented in columns (1) and (4).
As it can be seen in Table 4, the results suggest that the program does have a positive and
statistically significant impact on household food consumption. The logarithmic regressions
suggest that each real transferred by the program increases expenditure on food by approximately
0.3%. Therefore, since the average beneficiary household receives approximately R$30 per
month, the data suggest that the program augments food expenditures by approximately 9%.16
The results in column (1) also indicate that the marginal propensity to spend on food out
of one Real transferred is of approximately 0.70, which is statistically different from zero at the
1% significance level. That is, in average 70% of any additional Real transferred to beneficiary
15 Conditional on BE, BAi is orthogonal to the error terms in (3) and (4) and is obviously highly correlated to Mi.16 Note that this is a similar to the 9% increase in caloric intake estimated via the increase of dietary diversity.
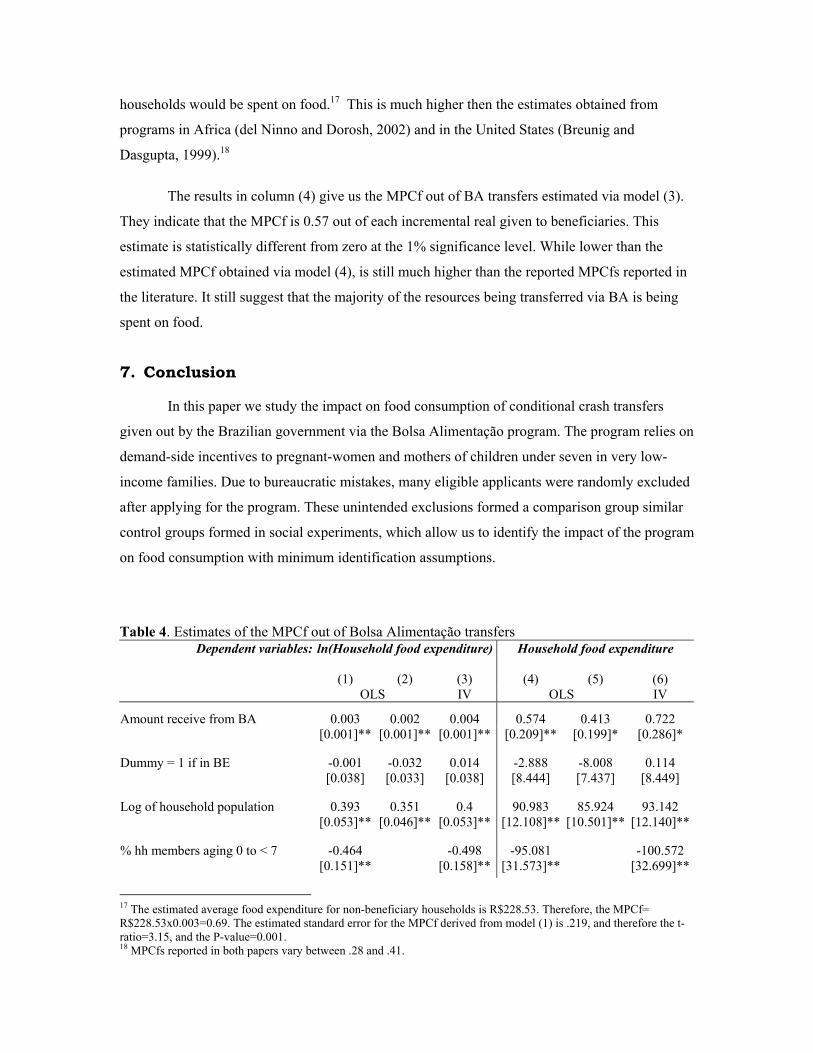
households would be spent on food.17 This is much higher then the estimates obtained from
programs in Africa (del Ninno and Dorosh, 2002) and in the United States (Breunig and
Dasgupta, 1999).18
The results in column (4) give us the MPCf out of BA transfers estimated via model (3).
They indicate that the MPCf is 0.57 out of each incremental real given to beneficiaries. This
estimate is statistically different from zero at the 1% significance level. While lower than the
estimated MPCf obtained via model (4), is still much higher than the reported MPCfs reported in
the literature. It still suggest that the majority of the resources being transferred via BA is being
spent on food.
7. Conclusion
In this paper we study the impact on food consumption of conditional crash transfers
given out by the Brazilian government via the Bolsa Alimentação program. The program relies on
demand-side incentives to pregnant-women and mothers of children under seven in very low-
income families. Due to bureaucratic mistakes, many eligible applicants were randomly excluded
after applying for the program. These unintended exclusions formed a comparison group similar
control groups formed in social experiments, which allow us to identify the impact of the program
on food consumption with minimum identification assumptions.
Table 4. Estimates of the MPCf out of Bolsa Alimentação transfersDependent variables: ln(Household food expenditure) Household food expenditure
(1) (2) (3) (4) (5) (6)OLS IV OLS IV
Amount receive from BA 0.003 0.002 0.004 0.574 0.413 0.722[0.001]** [0.001]** [0.001]** [0.209]** [0.199]* [0.286]*
Dummy = 1 if in BE -0.001 -0.032 0.014 -2.888 -8.008 0.114[0.038] [0.033] [0.038] [8.444] [7.437] [8.449]
Log of household population 0.393 0.351 0.4 90.983 85.924 93.142[0.053]** [0.046]** [0.053]** [12.108]** [10.501]** [12.140]**
% hh members aging 0 to < 7 -0.464 -0.498 -95.081 -100.572[0.151]** [0.158]** [31.573]** [32.699]**
17 The estimated average food expenditure for non-beneficiary households is R$228.53. Therefore, the MPCf=R$228.53x0.003=0.69. The estimated standard error for the MPCf derived from model (1) is .219, and therefore the t-ratio=3.15, and the P-value=0.001.18 MPCfs reported in both papers vary between .28 and .41.
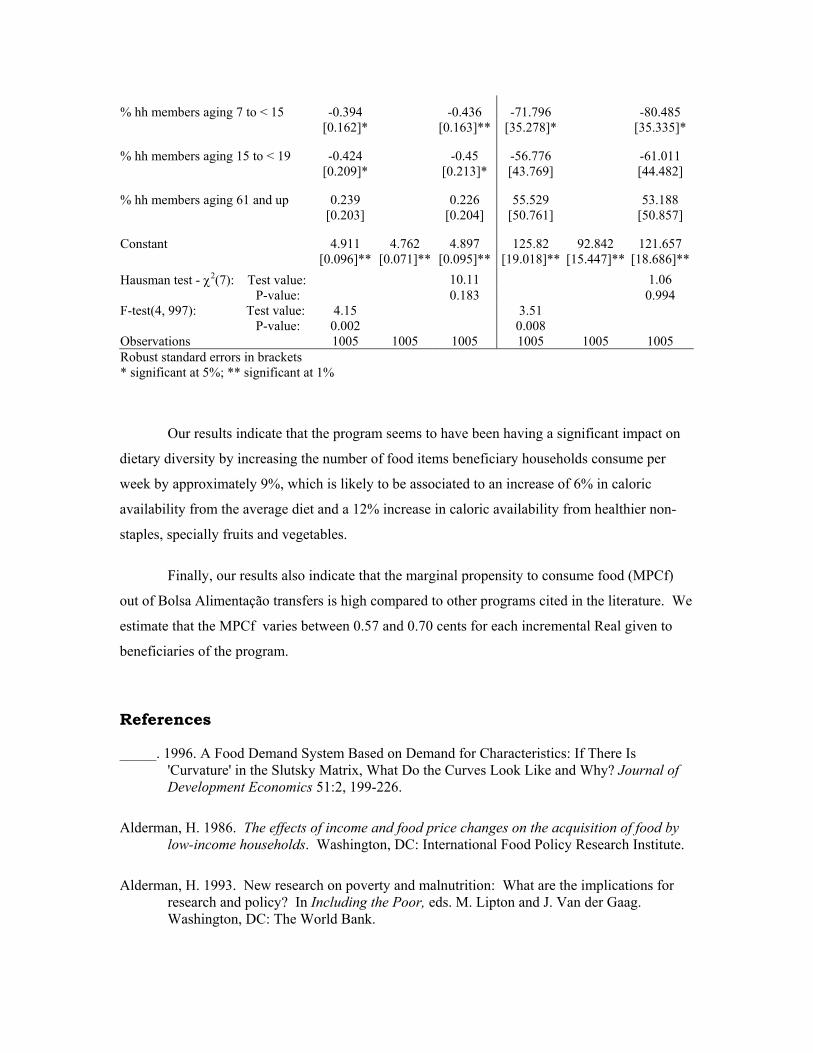
% hh members aging 7 to < 15 -0.394 -0.436 -71.796 -80.485[0.162]* [0.163]** [35.278]* [35.335]*
% hh members aging 15 to < 19 -0.424 -0.45 -56.776 -61.011[0.209]* [0.213]* [43.769] [44.482]
% hh members aging 61 and up 0.239 0.226 55.529 53.188[0.203] [0.204] [50.761] [50.857]
Constant 4.911 4.762 4.897 125.82 92.842 121.657[0.096]** [0.071]** [0.095]** [19.018]** [15.447]** [18.686]**
Hausman test - χ2(7): Test value: 10.11 1.06 P-value: 0.183 0.994
F-test(4, 997): Test value: 4.15 3.51 P-value: 0.002 0.008
Observations 1005 1005 1005 1005 1005 1005Robust standard errors in brackets* significant at 5%; ** significant at 1%
Our results indicate that the program seems to have been having a significant impact on
dietary diversity by increasing the number of food items beneficiary households consume per
week by approximately 9%, which is likely to be associated to an increase of 6% in caloric
availability from the average diet and a 12% increase in caloric availability from healthier non-
staples, specially fruits and vegetables.
Finally, our results also indicate that the marginal propensity to consume food (MPCf)
out of Bolsa Alimentação transfers is high compared to other programs cited in the literature. We
estimate that the MPCf varies between 0.57 and 0.70 cents for each incremental Real given to
beneficiaries of the program.
References
_____. 1996. A Food Demand System Based on Demand for Characteristics: If There Is'Curvature' in the Slutsky Matrix, What Do the Curves Look Like and Why? Journal ofDevelopment Economics 51:2, 199-226.
Alderman, H. 1986. The effects of income and food price changes on the acquisition of food bylow-income households. Washington, DC: International Food Policy Research Institute.
Alderman, H. 1993. New research on poverty and malnutrition: What are the implications forresearch and policy? In Including the Poor, eds. M. Lipton and J. Van der Gaag.Washington, DC: The World Bank.
Alderman, H., J. R. Behrman, D. Ross, and R. Sabot. 1996. The returns to endogenous humancapital in Pakistan's rural wage labour market. Oxford Bulletin of Economics andStatistics 58 (1): 29-56
Alderman, H., J. R. Behrman, V. Lavy, and R. Menon. 2000. Child health and school enrollment:A longitudinal analysis. Washington, DC: World Bank. Mimeo.
Alexander, G. R., and M. Kotelchuck. 1996. Quantifying the adequacy of prenatal care: Acomparison of indices. Public Health Rep 1996 Sep-Oct;111(5):408-18.
Ashworth, A. 1998. Effects of intrauterine growth retardation on mortality and morbidity ininfants and young children. European Journal of Clinical Nutrition 52(S1):34–42.
Becker, G.S. 1981. A treatise on the family. Cambridge, MA: Harvard University Press.
Behrman J. R., A. Foster, and M. Rosenzweig. 1997. The dynamics of agricultural production andthe calorie-income relationship: Evidence from Pakistan . Journal of Econometrics. 77:1March, 187-207.
Behrman, J. R. 1997. Intrahousehold distribution and the family. In Handbook of population andfamily economics, ed. M. R. Rosenzweig and O. Stark. Amsterdam: North-Holland.
Behrman, J. R., 1993. The economic rationale for investing in nutrition in Developing Countries.World Development 21 (11): 1749-1771.
Behrman, J. R., and A. B. Deolalikar. 1987. Will Developing Country nutrition improve withincome? A case study for rural South India. Journal of Political Economy 95:3 (June),108-138.
Behrman, J. R., and A. B. Deolalikar. 1988. Health and nutrition. In Handbook on EconomicDevelopment Vol. 1, eds. H. B. Chenery and T. N. Srinivasan. Amsterdam: NorthHolland Publishing Co., 631-711.
Behrman, J. R., and A. B. Deolalikar. 1989. Wages and labor supply in Rural India: The role ofhealth, nutrition and seasonality. In Causes and implications of seasonal variability inhousehold food security, ed. D. E., Sahn. Baltimore, MD: The Johns Hopkins UniversityPress. 107-18.
Behrman, J., and J.C. Knowles. 1999. “Household Income and Child Schooling in Vietnam” TheWorld Bank Economic Review vol 13, no.2: 211-56.
Behrman, J., and M. Rosenzweig (2001): “The returns to increasing body weight”, Department ofEconomics, University of Pennsylvania, Philadelphia, Pennsylvania, USA, unpublished.
Bergstrom, T. 1997. A survey of theories of the family. In Handbook of population and familyeconomics, ed. M. R. Rosenzweig and O. Stark. Amsterdam: North-Holland.
Bhargava, A. 1997. Nutritional Status and the Allocation of Time in Rwandese Households.Journal of Econometrics. 77:1, 277-95.
Boissiere, M., J. B. Knight, and R. H. Sabot. 1985. Earnings, schooling, ability and cognitiveskills. American Economic Review 75: 1016-30.
Bouis, H. E. 1994. The effect of income on demand for food in poor countries: Are our databasesgiving us reliable estimates? Journal of Development Economics 44:1 (June), 199-226.
Bouis, H. E., and L. J. Haddad. 1992. Are estimates of calorie-income elasticities too high? Arecalibration of the plausible range. Journal of Development Economics 39:2 (October),333-364.
Breunig, R., and I. Dasgupta, 1999. “Are people ashamed of Paying with Food Stamps?”.Working Papers in Economics and Econometrics, #382. The Australian NationalUniversity.
Chandra, R. K., S. K. Ali, K. M. Kutty, and S. Chandra. 1977. Thymus dependent lymphocytesand delayed hypersensitivity in low birth weight infants. Biology of the Neonate 197731:15–18.
Coady, D. 2002. Social Expenditures and the Poor: A Synthesis of Issues. Mimeo. InternationalFood Policy Research Institute, Washington, D.C.
Croppenstedt, A., and C. Muller (2000): “The impact of farmers’ health and nutritional status ontheir productivity and efficiency”, Economic Development and cultural Change, 48(3),pp829-36.
de Onis M., J. Villar, and M. Gülmezoglu. 1998. Nutritional interventions to prevent intrauterinegrowth retardation: Evidence from randomized controlled trials. European Journal ofClinical Nutrition 52(S1):83–93.
del Ninno, C., and P. Dorosh, 2002. “In-Kind transfers and household food consumption:Implications for targeted food programs in Bangladesh”. Food Consumption andNutrition Discussion Paper Series, # 134. The International Food Policy ResearchInstitute. 2033 K Street NW, Washington, D.C. 20006, USA
Deolalikar, A. B. 1988. Nutrition and labor productivity in agriculture: Estimates for rural SouthIndia, Review of Economics and Statistics 70 (3): 406-13.
Duflo, Esther. 2000. Child health and household resources in South Africa: Evidence from theOld Age Pension program American Economic Review, May 2000, 90(2): 393-398.]’
Fafchamps, M. and A. Quisumbing (1999): “Human capital, productivity and labor allocation inrural Pakistan”, Journal of Human Resources, 34(2), pp369-406.
Ferro-Luzzi, A., S. Sette, M. Franklin, and W.P.T. James. 1992. A simplified approach ofassessing adult chronic energy deficiency. European Journal of Clinical Nutrition46:173-186.
Fogel, R. (1994): “Economic growth, population theory and physiology: The bearing of long-term processes on the making of economic policy”, American Economic Review, 84(3),pp369-95.
Foster, A., and M. Rosenzweig (1994): “A test for moral hazard in the labor market: Contractualarrangements, effort, and health”, Review of economics and Statistics, 76(2), pp213-27.
Garcia, M., and E. Kennedy. 1994. Assessing the linkages between low body mass index andmorbidity in adults: evidence from four developing countries. European Journal ofClinical Nutrition 48 (Suppl 3):S90-6; discussion S97.
Gillespie, S., and L. Haddad (2001): “Attacking the Double Burden of Malnutrition in Asia andthe Pacific”, ADB Nutrition and Development Series, No. 4, Asian Development Bank,Manila, Philippines.
Glewwe, 1996. The relevance of standard estimates of rates of return to schooling for educationpolicy: A critical assessment. Journal of Development Economics 51(2): 267-90.
Glewwe, P., and H. Jacoby (1995): “An economic analysis of delayed primary school enrollmentin a low-income country: The role of childhood nutrition”, Review of Economics andStatistics, 77(1), pp156-169.
Glewwe, P., H. Jacoby, and E. King. 2000. Early childhood nutrition and academic achievement:A longitudinal analysis. Journal of Public Economics (forthcoming).
Glick, P., and D. Sahn (1998): “Health and productivity in a heterogenous urban labor market”,Applied Economics, 30(2), pp203-16.
Godfrey, K.M., D. J. P. Barker, C. Osmond. 1994. Disproportionate fetal growth and raised IgEconcentration in adult life. Clinical and Experimental Allergy 24:641–648.
Goldenberg R.L, H. J. Hoffman, S. P. Cliver. 1998. Neuro developmental outcome of small-for-gestational-age infants. European Journal of Clinical Nutrition 52(S1):54–58.
Grantham-McGregor, S. M. 1998. Small for gestational age, term babies, in the first six yearsof life. European Journal of Clinical Nutrition 52(S1):59–64.

Haas, J., S. Murdoch, J. Rivera, and R.L. Martorell. 1996. Early nutrition and later physical workcapacity. Nutrition Reviews 54: S41-S48.
Haddad, L. ,and H. Bouis. 1991. The impact of nutritional status on agricultural productivity:Wage evidence from the Philippines. Oxford Bulletin of Economics and Statistics 53 (1):45-68.
Haddad, L., J. Hoddinott, and H. Alderman, eds. 1997. Intrahousehold resource allocation indeveloping countries: Methods, models, and policy. Baltimore, MD: Johns HopkinsUniversity Press for the International Food Policy Research Institute.
Hausman, J., and D. Wise, eds. 1985. Social Experimentation. Chicago: University of ChicagoPress.
Hoddinott, J. and Y. Yohannes, 2002. “Dietary diversity as a food security indicator”, mimeo.The International Food Policy Research Institute , 2033 K Street NW, Washington, D.C.20006, USA
Horton, S. (1999): “Opportunities for Investments in Nutrition in Low-income Asia”, AsianDevelopment Review, 17(1/2), pp246-73.
Huffman, S.L., J. Baker, J. Shumann, E. R. Zehner. 1999. The case for promoting multiplevitamin and mineral supplements for women of reproductive age in developing countries.Food and Nutrition Bulletin 1999 20(4):379–394.
IFPRI (International Food Policy Research Institute). 2000. “Second Report: ImplementationProposal for the PRAF/IDB Project—Phase II.” Washington, DC.
IFPRI, 2002. Estudo de Avaliação de Impacto do Bolsa Alimentação: Relatório 1: Objetivos eDelineamento da Avaliação. The International Food Policy Research Institute , 2033 KStreet NW, Washington, D.C. 20006, USA.
Immink, M.D.C., and F.E.Viteri. 1981. Energy intake and productivity of Guatemalan sugarcanecutters: an empirical test of the efficiency wage hypothesis. Journal of DevelopmentEconomics 9:273-287.
Jamison, D.T. 1986. Child malnutrition and school performance in China. Journal ofDevelopment Economics 20 (2): 299-310
Kambarami, R.A., P. Matibe, and D. Pirie. 1999. Risk factors for neonatal mortality: HarareCentral Hospital Neonatal Unit-Zimbabwe. Cent Afr J Med 1999 Jul;45(7):169-73
Kennedy, E., and M. Garcia. 1994. Body mass index and economic productivity. EuropeanJournal of Clinical Nutrition 48 (Suppl 3):45-55.
Kramer, M.S. 1987. Determinants of low birth weight: Methodological assessment and meta-analysis. Bulletin of the World Health Organization 65(5): 663-737.
Kusin, J.A., S. Kardjati, and U.H. Renqvist. 1994. Maternal body mass index: The functionalsignificance during reproduction. European Journal of Clinical Nutrition 48 (Suppl3):56-67.
Lavy V., J. Spratt, and N. Leboucher. 1997. Patterns of incidence and change in Moroccanliteracy. Comparative Education Review 41:2.
Leslie, J., and D. Jamison. 1990. Health and nutrition considerations in education planning 1.Educational consequences of health problems among school-age children. Food andNutrition Bulletin 12: 191-203.
Leveno, K. J, F. G. Cunningham, M. L. Roark, S. D. Nelson, and M. L. Williams. 1985.Prenatal care and the low birth weight infant. Obstet Gynecol. Nov 66(5):599-605.
Manski, C., and I. Garfinkel, eds. 1992. Evaluating Welfare and Training Programs. Cambridge,Mass.: Harvard University Press.
Martorell R., J. Rivera, and H. Kaplowitz. 1989. Consequences of stunting in early childhood foradult body size in rural Guatemala. Stanford, CA: Stanford University, Food ResearchInstitute. Mimeo.
Martorell R., K. L., Khan, and D. G., Schroeder. 1994. Reversibilty of stunting: epidemiologicalfindings in children from Developing Countries. European Journal of Clinical Nutrition48 (Suppl): S45-S57.
Martorell, R. 1999. The nature of child malnutrition and its long-term implications. Food andNutrition Bulletin 20: 288-292
Martorell, R. 1995. Results and implications of the INCAP follow-up study. Journal of Nutrition125 (Suppl): 1127S-1138S.
McIntire, D. D., S. L. Bloom, B. M. Casey, K. J. Leveno. 1999. Birth weight in relation tomorbidity and mortality among newborn infants, N Engl J Med. Apr 22. 340(16):1234-8.
Miller HC, and T. A. Merritt. 1979. Fetal Growth in Humans. Chicago: Year Book MedicalPublishers.
Moock, P. R., and J. Leslie. 1986. Childhood malnutrition and schooling in the Terai region ofNepal. Journal of Development Economics k20 (1): 33-52
Phillips, D. I. W., C. Cooper, and C. Fall. 1993. Fetal growth and autoimmune thyroid disease.Quarterly Journal of Medicine 86:247–53.
Politt, E. 1997. Iron deficiency and educational deficiency. Nutrition Reviews 55 (4):133-41.
Pollitt, E. (2001): “The development and probabilistic nature of the functional consequences ofiron deficiency anemia in children”, Journal of Nutrition, 131, pp669S-675S.
Pollitt, E. 1990. Malnutrition and infection in the classroom. Paris: UNESCO.
Prada, J. A., and R. C. Tsang. 1998. Biological mechanism of environmentally induced cases ofIUGR. European Journal of Clinical Nutrition 52(S1):21-28.
Ramakrishnan U, and L. M. Neufeld. Forthcoming. Recent advances in nutrition andintrauterine growth. Nestle Workshop Series 2000 (in press).
Rosenzweig, M.R., and R.E. Evenson. 1977. Fertility, schooling, and the economic contributionof children in rural India: An econometric analysis. Econometrica 45: 1065-1079.
Rosenzweig, M.R., and T. P. Schultz. 1983. Estimating a household production function:Heterogeneity, the demand for health inputs, and their effects on birthweight. Journal ofPolitical Economy 92 (October): 723-746.
Sahn, D. , and H. Alderman. 1995. Incentive effects on labor supply of Sri Lanka’s rice subsidy.In Public spending and the poor: Theory and evidence, ed. D. van de Walle and K.Nead. Baltimore MD: The Johns Hopkins University Press published for the WorldBank.
Skoufias, E. 2001. PROGRESA and its Impacts on the Human Capital and Welfare ofHouseholds in Rural Mexico: A Synthesis of the Results of an Evaluation by IFPRI.Mimeo. International Food Policy Research Institute, Washington, D.C.
Strauss, J. 1986. Does better nutrition raise farm productivity? Journal of Political Economy 94:297-320.
Strauss, J., and D. Thomas. 1995. Human resources: Empirical modeling of household and familydecisions. In Handbood of Development Economics, volume 3A, eds. J. R. Behrman andT. N. Srinivasan. Amsterdam: North-Holland Publishing company, 1883-2024.
Strauss, J., and D. Thomas. 1998. Health, nutrition, and economic development. Journal ofEconomic Literature 36(2): 766-817.
Subramanian, S., and A. Deaton. 1996. The demand for food and calories. Journal of PoliticalEconomy 104:1 (February).
Thomas, D. and J. Strauss. 1997. Health and wages: Evidence on men and women in urban BrazilJournal of Econometrics 77(1): 159-185.

Victora C. G., P. G. Smith, J. P. Vaughan, L. C. Nobre, C. Lombardi, A. M. Teixeira, S. M.Fuchs, L. B. Moreira, L. P. Gigante, and F. C. Barros. 1988. Influence of birth weight onmortality from infectious diseases: A case-control study. Pediatrics 81(6):807–11.
Wagstaff, A., and N. Watanbe (2000): “Socioeconomic inequalities in child malnutrition in thedeveloping world”, Policy Research Working Paper 2434, World Bank: Washington DC.
World Bank. 2001. Nicaragua Poverty Assessment: Challenges and Opportunities for PovertyReduction, Report No. 20488-NI. Washington, DC.
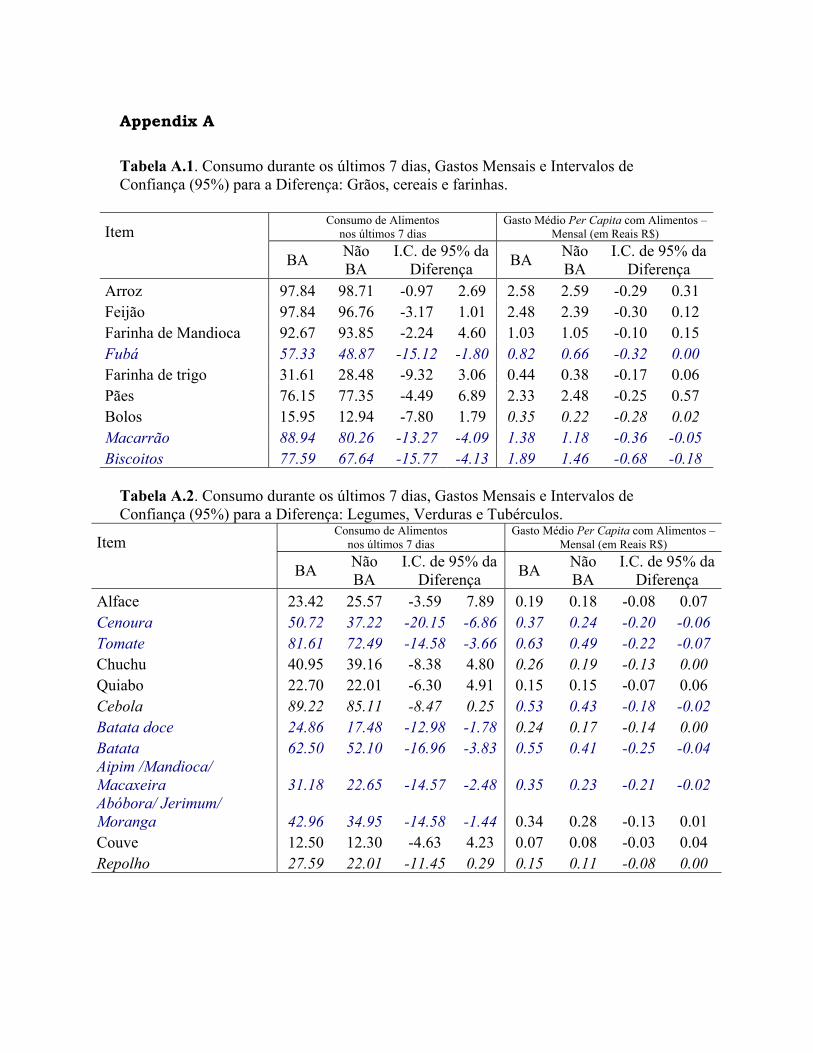
Appendix A
Tabela A.1. Consumo durante os últimos 7 dias, Gastos Mensais e Intervalos deConfiança (95%) para a Diferença: Grãos, cereais e farinhas.
ItemConsumo de Alimentos
nos últimos 7 diasGasto Médio Per Capita com Alimentos –
Mensal (em Reais R$)
BA NãoBA
I.C. de 95% daDiferença BA Não
BAI.C. de 95% da
DiferençaArroz 97.84 98.71 -0.97 2.69 2.58 2.59 -0.29 0.31Feijão 97.84 96.76 -3.17 1.01 2.48 2.39 -0.30 0.12Farinha de Mandioca 92.67 93.85 -2.24 4.60 1.03 1.05 -0.10 0.15Fubá 57.33 48.87 -15.12 -1.80 0.82 0.66 -0.32 0.00Farinha de trigo 31.61 28.48 -9.32 3.06 0.44 0.38 -0.17 0.06Pães 76.15 77.35 -4.49 6.89 2.33 2.48 -0.25 0.57Bolos 15.95 12.94 -7.80 1.79 0.35 0.22 -0.28 0.02Macarrão 88.94 80.26 -13.27 -4.09 1.38 1.18 -0.36 -0.05Biscoitos 77.59 67.64 -15.77 -4.13 1.89 1.46 -0.68 -0.18
Tabela A.2. Consumo durante os últimos 7 dias, Gastos Mensais e Intervalos deConfiança (95%) para a Diferença: Legumes, Verduras e Tubérculos.
ItemConsumo de Alimentos
nos últimos 7 diasGasto Médio Per Capita com Alimentos –
Mensal (em Reais R$)
BA NãoBA
I.C. de 95% daDiferença BA Não
BAI.C. de 95% da
DiferençaAlface 23.42 25.57 -3.59 7.89 0.19 0.18 -0.08 0.07Cenoura 50.72 37.22 -20.15 -6.86 0.37 0.24 -0.20 -0.06Tomate 81.61 72.49 -14.58 -3.66 0.63 0.49 -0.22 -0.07Chuchu 40.95 39.16 -8.38 4.80 0.26 0.19 -0.13 0.00Quiabo 22.70 22.01 -6.30 4.91 0.15 0.15 -0.07 0.06Cebola 89.22 85.11 -8.47 0.25 0.53 0.43 -0.18 -0.02Batata doce 24.86 17.48 -12.98 -1.78 0.24 0.17 -0.14 0.00Batata 62.50 52.10 -16.96 -3.83 0.55 0.41 -0.25 -0.04Aipim /Mandioca/Macaxeira 31.18 22.65 -14.57 -2.48 0.35 0.23 -0.21 -0.02Abóbora/ Jerimum/Moranga 42.96 34.95 -14.58 -1.44 0.34 0.28 -0.13 0.01Couve 12.50 12.30 -4.63 4.23 0.07 0.08 -0.03 0.04Repolho 27.59 22.01 -11.45 0.29 0.15 0.11 -0.08 0.00
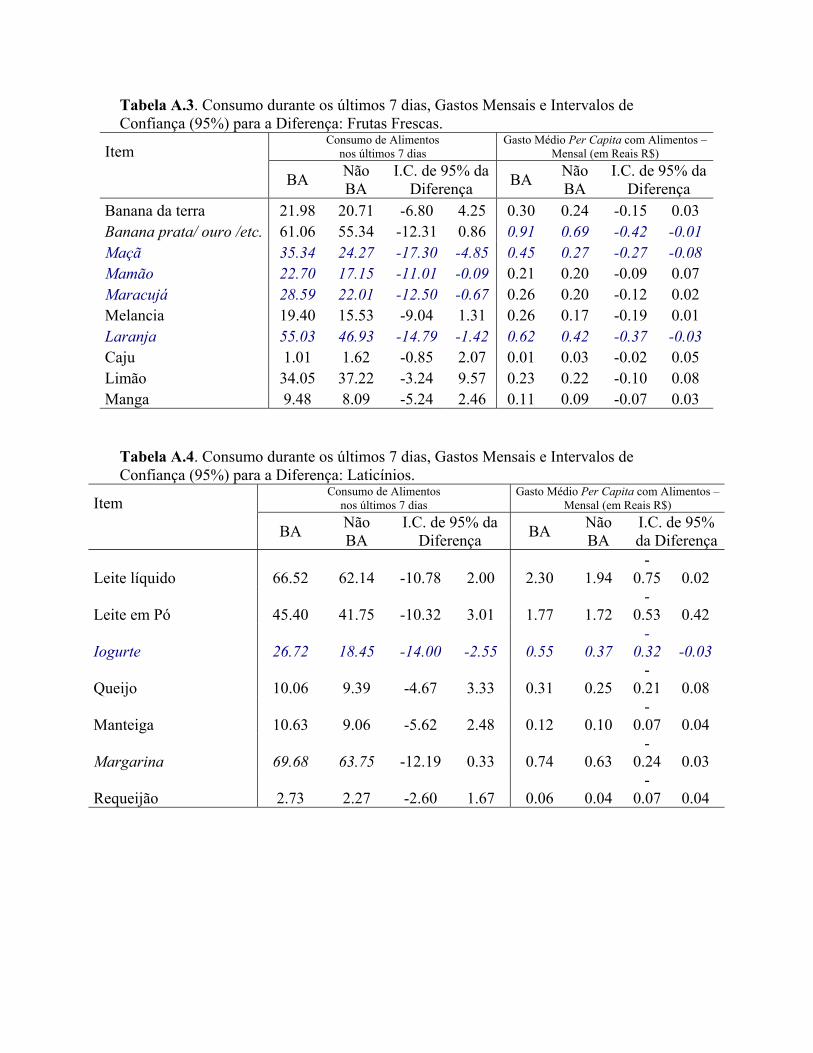
Tabela A.3. Consumo durante os últimos 7 dias, Gastos Mensais e Intervalos deConfiança (95%) para a Diferença: Frutas Frescas.
ItemConsumo de Alimentos
nos últimos 7 diasGasto Médio Per Capita com Alimentos –
Mensal (em Reais R$)
BA NãoBA
I.C. de 95% daDiferença BA Não
BAI.C. de 95% da
DiferençaBanana da terra 21.98 20.71 -6.80 4.25 0.30 0.24 -0.15 0.03Banana prata/ ouro /etc. 61.06 55.34 -12.31 0.86 0.91 0.69 -0.42 -0.01Maçã 35.34 24.27 -17.30 -4.85 0.45 0.27 -0.27 -0.08Mamão 22.70 17.15 -11.01 -0.09 0.21 0.20 -0.09 0.07Maracujá 28.59 22.01 -12.50 -0.67 0.26 0.20 -0.12 0.02Melancia 19.40 15.53 -9.04 1.31 0.26 0.17 -0.19 0.01Laranja 55.03 46.93 -14.79 -1.42 0.62 0.42 -0.37 -0.03Caju 1.01 1.62 -0.85 2.07 0.01 0.03 -0.02 0.05Limão 34.05 37.22 -3.24 9.57 0.23 0.22 -0.10 0.08Manga 9.48 8.09 -5.24 2.46 0.11 0.09 -0.07 0.03
Tabela A.4. Consumo durante os últimos 7 dias, Gastos Mensais e Intervalos deConfiança (95%) para a Diferença: Laticínios.
ItemConsumo de Alimentos
nos últimos 7 diasGasto Médio Per Capita com Alimentos –
Mensal (em Reais R$)
BA NãoBA
I.C. de 95% daDiferença BA Não
BAI.C. de 95%da Diferença
Leite líquido 66.52 62.14 -10.78 2.00 2.30 1.94-
0.75 0.02
Leite em Pó 45.40 41.75 -10.32 3.01 1.77 1.72-
0.53 0.42
Iogurte 26.72 18.45 -14.00 -2.55 0.55 0.37-
0.32 -0.03
Queijo 10.06 9.39 -4.67 3.33 0.31 0.25-
0.21 0.08
Manteiga 10.63 9.06 -5.62 2.48 0.12 0.10-
0.07 0.04
Margarina 69.68 63.75 -12.19 0.33 0.74 0.63-
0.24 0.03
Requeijão 2.73 2.27 -2.60 1.67 0.06 0.04-
0.07 0.04
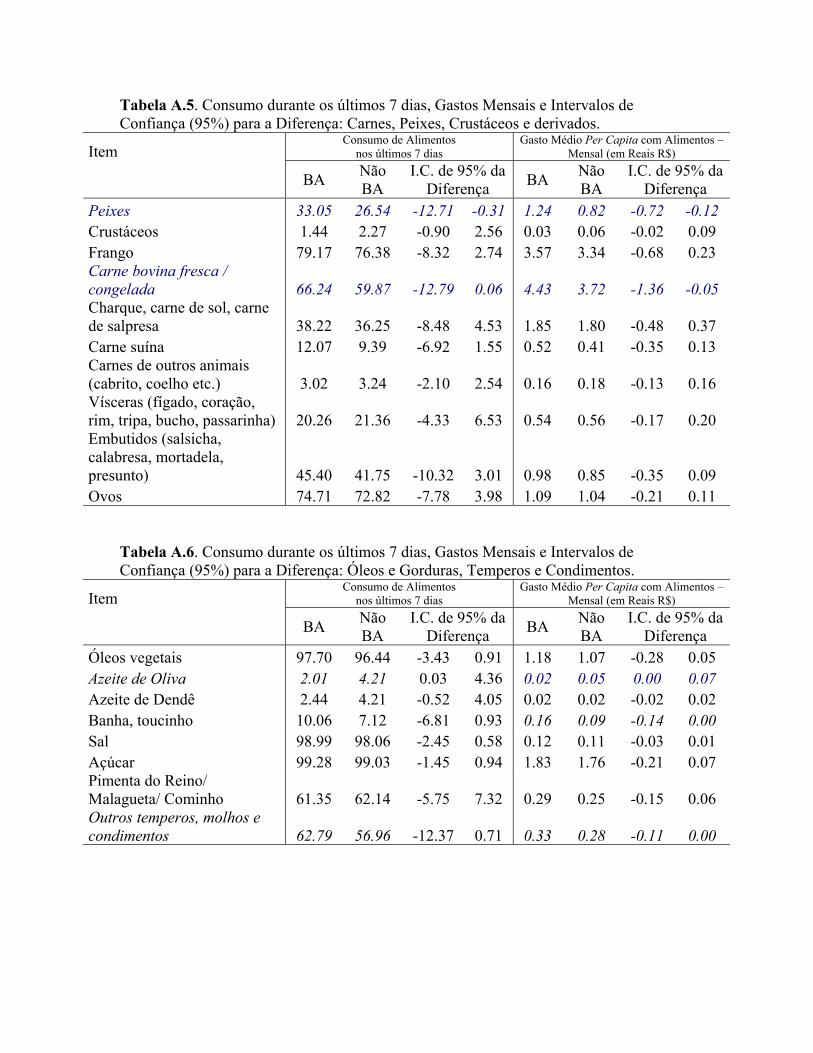
Tabela A.5. Consumo durante os últimos 7 dias, Gastos Mensais e Intervalos deConfiança (95%) para a Diferença: Carnes, Peixes, Crustáceos e derivados.
ItemConsumo de Alimentos
nos últimos 7 diasGasto Médio Per Capita com Alimentos –
Mensal (em Reais R$)
BA NãoBA
I.C. de 95% daDiferença BA Não
BAI.C. de 95% da
DiferençaPeixes 33.05 26.54 -12.71 -0.31 1.24 0.82 -0.72 -0.12Crustáceos 1.44 2.27 -0.90 2.56 0.03 0.06 -0.02 0.09Frango 79.17 76.38 -8.32 2.74 3.57 3.34 -0.68 0.23Carne bovina fresca /congelada 66.24 59.87 -12.79 0.06 4.43 3.72 -1.36 -0.05Charque, carne de sol, carnede salpresa 38.22 36.25 -8.48 4.53 1.85 1.80 -0.48 0.37Carne suína 12.07 9.39 -6.92 1.55 0.52 0.41 -0.35 0.13Carnes de outros animais(cabrito, coelho etc.) 3.02 3.24 -2.10 2.54 0.16 0.18 -0.13 0.16Vísceras (fígado, coração,rim, tripa, bucho, passarinha) 20.26 21.36 -4.33 6.53 0.54 0.56 -0.17 0.20Embutidos (salsicha,calabresa, mortadela,presunto) 45.40 41.75 -10.32 3.01 0.98 0.85 -0.35 0.09Ovos 74.71 72.82 -7.78 3.98 1.09 1.04 -0.21 0.11
Tabela A.6. Consumo durante os últimos 7 dias, Gastos Mensais e Intervalos deConfiança (95%) para a Diferença: Óleos e Gorduras, Temperos e Condimentos.
ItemConsumo de Alimentos
nos últimos 7 diasGasto Médio Per Capita com Alimentos –
Mensal (em Reais R$)
BA NãoBA
I.C. de 95% daDiferença BA Não
BAI.C. de 95% da
DiferençaÓleos vegetais 97.70 96.44 -3.43 0.91 1.18 1.07 -0.28 0.05Azeite de Oliva 2.01 4.21 0.03 4.36 0.02 0.05 0.00 0.07Azeite de Dendê 2.44 4.21 -0.52 4.05 0.02 0.02 -0.02 0.02Banha, toucinho 10.06 7.12 -6.81 0.93 0.16 0.09 -0.14 0.00Sal 98.99 98.06 -2.45 0.58 0.12 0.11 -0.03 0.01Açúcar 99.28 99.03 -1.45 0.94 1.83 1.76 -0.21 0.07Pimenta do Reino/Malagueta/ Cominho 61.35 62.14 -5.75 7.32 0.29 0.25 -0.15 0.06Outros temperos, molhos econdimentos 62.79 56.96 -12.37 0.71 0.33 0.28 -0.11 0.00
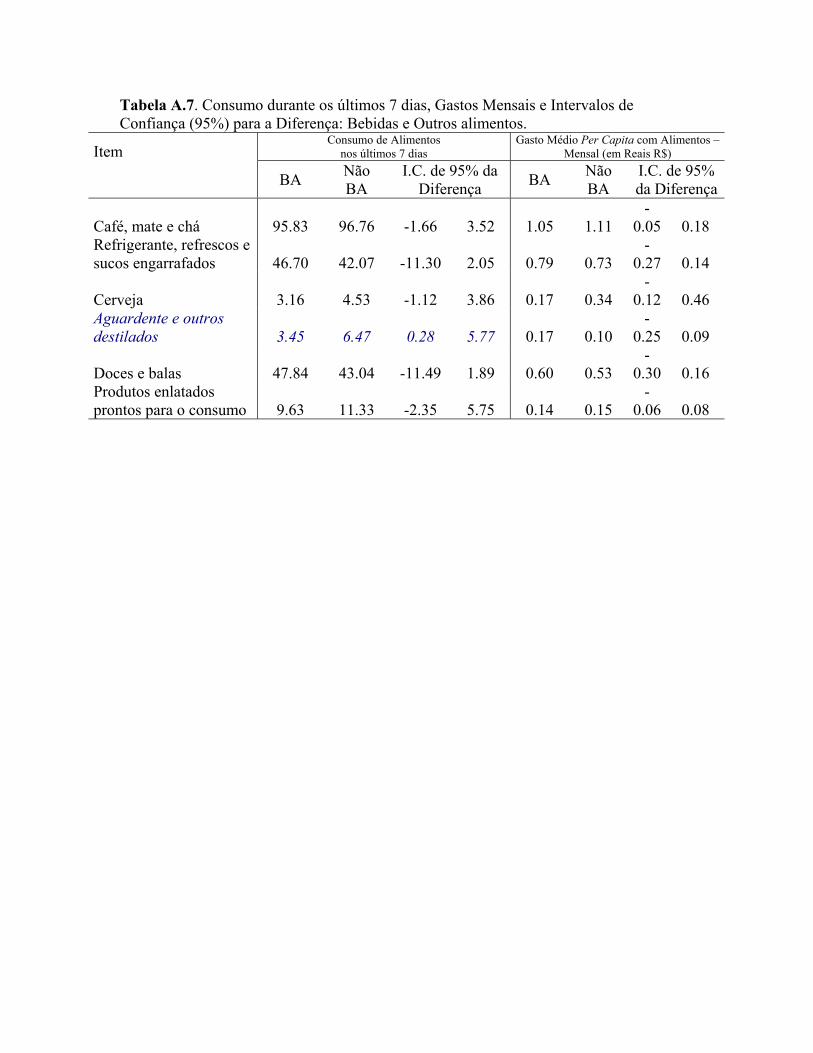
Tabela A.7. Consumo durante os últimos 7 dias, Gastos Mensais e Intervalos deConfiança (95%) para a Diferença: Bebidas e Outros alimentos.
ItemConsumo de Alimentos
nos últimos 7 diasGasto Médio Per Capita com Alimentos –
Mensal (em Reais R$)
BA NãoBA
I.C. de 95% daDiferença BA Não
BAI.C. de 95%da Diferença
Café, mate e chá 95.83 96.76 -1.66 3.52 1.05 1.11-
0.05 0.18Refrigerante, refrescos esucos engarrafados 46.70 42.07 -11.30 2.05 0.79 0.73
-0.27 0.14
Cerveja 3.16 4.53 -1.12 3.86 0.17 0.34-
0.12 0.46Aguardente e outrosdestilados 3.45 6.47 0.28 5.77 0.17 0.10
-0.25 0.09
Doces e balas 47.84 43.04 -11.49 1.89 0.60 0.53-
0.30 0.16Produtos enlatadosprontos para o consumo 9.63 11.33 -2.35 5.75 0.14 0.15
-0.06 0.08