Embed Size (px)
Citation preview
THE IMPACT OF TAXES AND SOCIAL SPENDING ON INEQUALITY AND POVERTY IN ARGENTINA, BOLIVIA, BRAZIL, MEXICO, PERU AND URUGUAY: AN OVERVIEW
Nora Lustig, Carola Pessino and John Scott
Working Paper No. 13
April 2013
1
The Impact of Taxes and Social Spending on Inequality and Poverty in Argentina, Bolivia, Brazil, Mexico, Peru and Uruguay: An Overview*
Nora Lustig, Carola Pessino and John Scott1 CEQ Working Paper No. 13
April 2013 [Draft for comments]
ABSTRACT
How much redistribution and poverty reduction is being accomplished in Latin America through social spending and taxes? Standard fiscal incidence analyses applied to Argentina, Bolivia, Brazil, Mexico, Peru, and Uruguay yield the following results. Direct taxes and cash transfers reduce inequality and poverty by nontrivial amounts in Argentina, Brazil, and Uruguay, less so in Mexico and relatively little in Bolivia and Peru. While direct taxes are progressive, the redistributive impact is small because direct taxes as a share of GDP are low. Cash transfers are quite progressive in absolute terms except in Bolivia where programs are not targeted to the poor. In Bolivia and Brazil, indirect taxes almost completely offset the poverty-reducing impact of cash transfers. In-kind transfers in education and health reduce inequality in all countries by considerably more than cash transfers. Keywords: fiscal incidence, inequality, poverty, taxes, social spending, Latin America JEL Codes: H22, I3, O1
* The papers summarized in this Overview are part of the Commitment to Equity (CEQ) Project; http://commitmenttoequity.org. The papers and the overview have been submitted to Public Finance Review. 1 Nora Lustig is Samuel Z. Stone Professor of Latin American Economics, Tulane University (Department of Economics; Stone Center for Latin American Studies and CIPR); nonresident fellow, Center for Global Development and Inter-American Dialogue. Carola Pessino is Senior Researcher, Department of Economics at the Universidad del CEMA, Argentina and private consultant in Washington, DC. John Scott is Professor in the Economics Department, Centro de Investigación y Docencia Económicas (CIDE) and member of the National Council of Evaluation, Mexico. The authors are very grateful to Emily Travis as well as to Samantha Greenspun, Arie Glazier, Juan Carlos Monterrey and Dustin Wonnell for their excellent research assistantship in the preparation of this overview and the background papers.
2
1. INTRODUCTION
Although inequality has been falling since 2000 (Lustig, López-Calva, and Ortiz-Juarez 2013), Latin America is still one of the regions with the highest degree of inequality in the world (Ferreira and Ravallion 2008). Poverty rates – although not the highest by far – are too high for Latin America’s GDP per capita (IDB 2011, 43). Given these facts, the extent to which governments use their power to tax and spend to attenuate inequality and poverty is of great importance.2 This overview summarizes the results of applying standard benefit-tax incidence analysis to estimate the effect of direct and indirect taxes, cash and in-kind transfers and indirect subsidies on inequality and poverty in six countries: Argentina (Lustig and Pessino, 2013), Bolivia (Paz Arauco et al. 2013), Brazil (Higgins and Pereira, 2013), Mexico (Scott, 2013), Peru (Jaramillo, 2013), and Uruguay (Bucheli et al., 2013). All country studies apply a common methodology to microdata obtained from household surveys. The studies for Bolivia (2009), Brazil (2009), Peru (2009), and Uruguay (2009) focus on average incidence for a particular (recent) year. Argentina (2003, 2006, 2009) and Mexico (2008, 2010) look at how incidence has changed over a particular period of time.3 In this overview we discuss the broad characteristics of the methodology and highlight the main results.
As is common in many benefit-tax incidence analyses, behavioral, lifecycle or general equilibrium effects have not been taken into account. Except in the case of Argentina, the analysis does not discuss the macroeconomic sustainability of taxation and social spending patterns either. Aside from these limitations, the analyses are probably among the most detailed, comprehensive and comparable for Latin American countries to date. In addition, compared to some of the existing publications, reliance on secondary sources is kept to a minimum.4
2. CONCEPTS, DEFINITIONS AND DATA
2.1 Market, Net Market, Disposable, Post-fiscal and Final Income: Definitions and Measurement
We use five income concepts in our incidence analyses: market, net market, disposable, post-fiscal and final income.5 Market income6 is total current income before direct taxes, 7 equal to the
2 See, for example, Birdsall, de la Torre, and Menezes (2008). 3 Although the household survey in Argentina covers urban areas only, for the reasons explained in Lustig and Pessino (2013), the analysis is taken to be representative for the whole country. 4 Breceda, Rigolini, and Saavedra (2008) and, especially, Goñi, López, and Servén (2011) rely substantially on secondary sources for their incidence analysis. 5 For more details on concepts and definitions, see Lustig and Higgins (2013). 6 Market income is sometimes called primary income. 7 Taxes include social security contributions in the benchmark analysis.
3
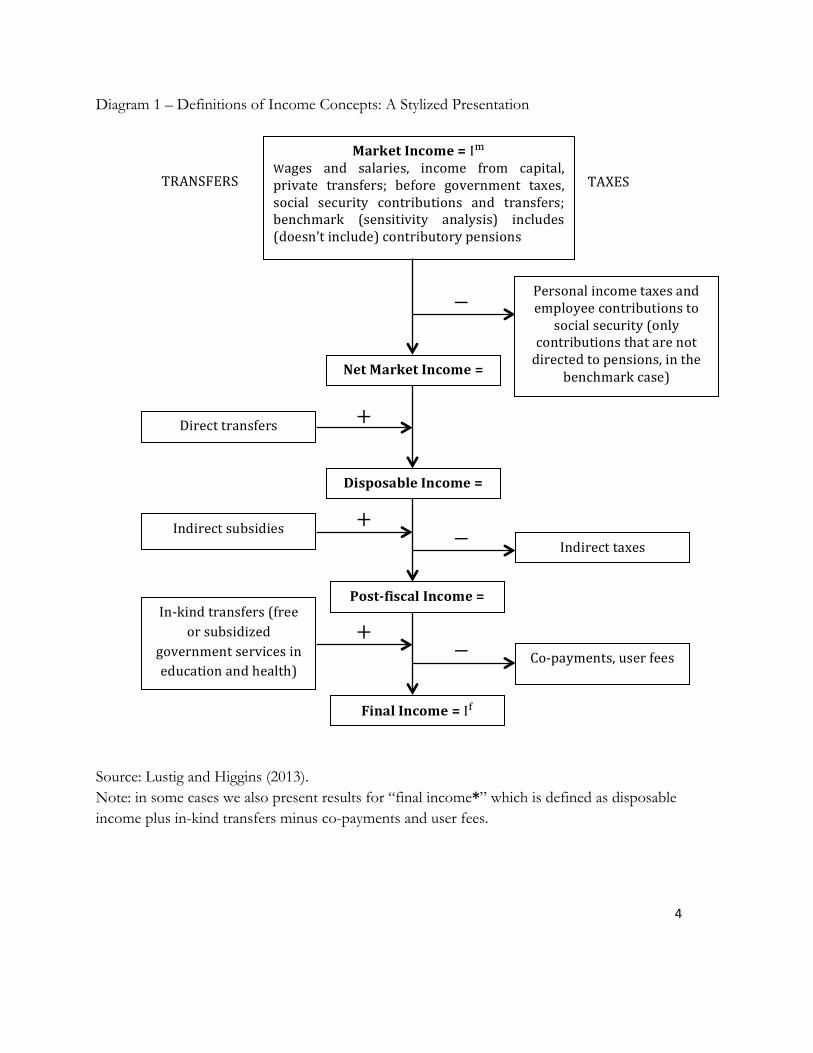
sum of gross (pre-tax) wages and salaries in the formal and informal sectors (also known as earned income); income from capital (dividends, interest, profits, rents, etc.) in the formal and informal sectors (excludes capital gains and gifts); auto-consumption (except in the case of Argentina and Bolivia); 8 imputed rent for owner occupied housing; private transfers (remittances and other private transfers such as alimony); and retirement pensions from the contributory social security system. Net market income equals market income minus direct personal income taxes on all income sources (included in market income) that are subject to taxation, and all contributions to social security except for the portion going towards pensions.9 Disposable income is equal to the sum of net market income plus direct government transfers (mainly cash transfers but can include food transfers). Post-fiscal income is defined as disposable income plus indirect subsidies plus indirect taxes (e.g., value added tax, sales tax, etc.). Final income is defined as post fiscal income plus government transfers in the form of free or subsidized services in education, health, and housing minus co-payments or user fees.10 Because Argentina’s study does not include the tax side, we also define final income* as disposable income plus government transfers in the form of free or subsidized services in education, health, and housing subsidies minus co-payments or user fees. The definitions are summarized in Diagram 1. For a detailed description of how each income concept was constructed in the six countries see the Statistical Appendix, available upon request. 11
8 Argentina does not include a question on autoconsumption and in the case of Bolivia the results with autoconsumption are specious (e.g., Bolivia ends up with the same distribution of income as Uruguay and a lower rural poverty than Mexico) so we opted to not use them. 9 Since here we are treating contributory pensions as part of market income, the portion of the contributions to social security going towards pensions are treated as ‘saving.’ 10 One may also include participation costs such as transportation costs or foregone incomes because of use of time in obtaining benefits. In our study, they were not included. 11 The studies exclude corporate and international trade taxes, and spending categories, such as infrastructure investments including urban services and rural roads that benefit the poor.
4
Diagram 1 – Definitions of Income Concepts: A Stylized Presentation
Source: Lustig and Higgins (2013). Note: in some cases we also present results for “final income*” which is defined as disposable income plus in-kind transfers minus co-payments and user fees.
Market Income = I! Wages and salaries, income from capital, private transfers; before government taxes, social security contributions and transfers; benchmark (sensitivity analysis) includes (doesn’t include) contributory pensions
TRANSFERS TAXES
Direct transfers
Net Market Income = I!
Disposable Income = I!
Personal income taxes and employee contributions to
social security (only contributions that are not directed to pensions, in the
benchmark case)
−
+
Indirect subsidies + − Indirect taxes
Post-‐fiscal Income = I!" In-‐kind transfers (free
or subsidized government services in education and health)
+ − Co-‐payments, user fees
Final Income = I!
5
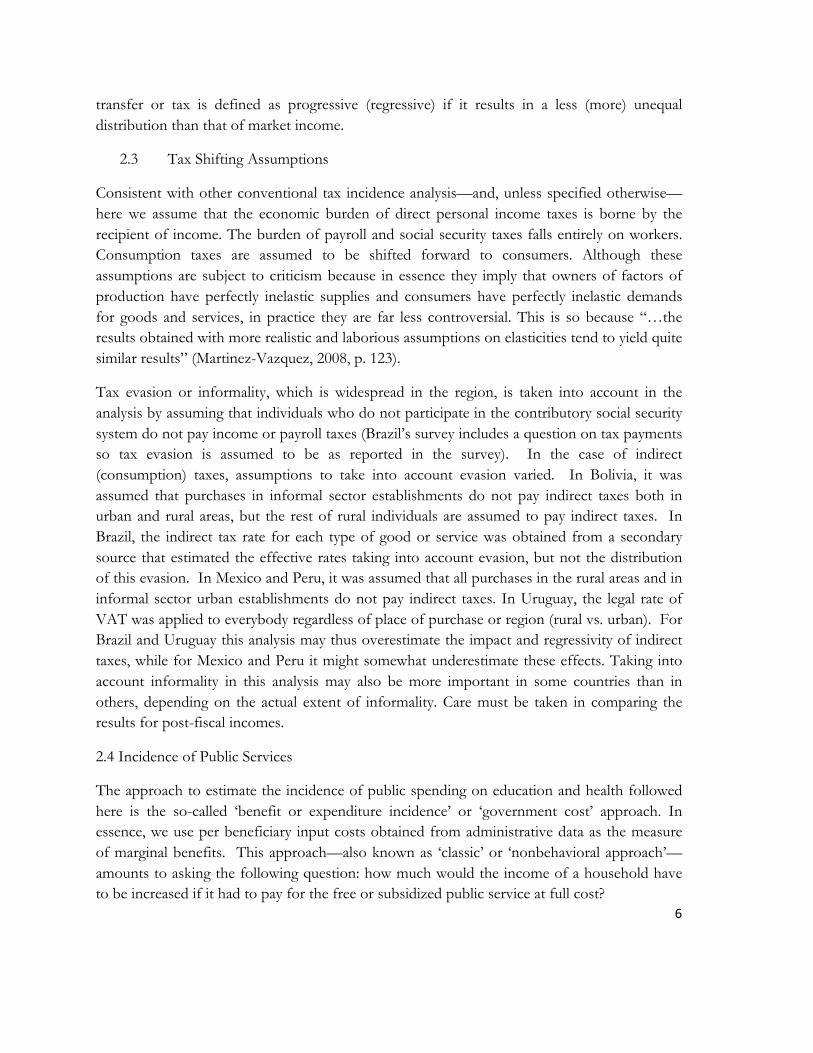
In the fiscal incidence literature, pensions from a pay-as-you-go contributory system have been sometimes treated as part of market income and other times as government transfers. Arguments exist for treating contributory pensions as part of market income because they are deferred income (Breceda, Rigolini, and Saavedra 2008; Immervoll et al. 2009) and treating them as a government transfer, especially in systems with a large subsidized component (Goñi, López, and Servén 2011; Immervoll et al. 2009; Lindert, Skoufias, and Shapiro 2006; Silveira et al. 2011). Since this is an unresolved issue, in our study we defined a benchmark case in which contributory pensions are part of market income. We also performed a sensitivity analysis where pensions are classified under government transfers.12 The principal results presented here are for the benchmark analysis. An analysis of the effects of treating pensions as transfers is included at the end of this overview. More detailed results of this sensitivity analysis can be found in the Statistical Appendix, available upon request.
2.2 Progressive and Regressive Revenues and Spending: Definitions
To determine if a tax or transfer is progressive, concentration curves, concentration coefficients, and the Kakwani (1977) index or other measures are commonly used. In the literature the terms “progressive” and “regressive” are used in two senses—which can be a cause of confusion. The progressivity/regressivity of a transfer can be measured in absolute terms, by comparing the amount of transfers across quantiles measured in the currency of choice, or in relative terms, by comparing transfers as a percentage of the (pre-transfer) income of each quantile. In the tax incidence literature, where the fiscal application of the terms “progressive” and “regressive” originated, they are used exclusively in the relative sense. In the benefit (and tax-benefit) incidence literature it is common practice to use the absolute as well as the relative concepts.13
Here, we have opted for defining as progressive any transfer that is equalizing; we then distinguish between progressive in absolute terms and progressive in relative terms. This is consistent with the tax incidence literature and with an intuitively appealing principle: a
12 Immervoll et al. (2009) do the analysis under these two scenarios as well. 13 Lindert, Skoufias, and Shapiro (2006), for example, define as progressive any transfer that is equalizing and distinguish between those that are progressive in absolute or relative terms. O’Donnell et al. (2008) also define as progressive any transfer that is equalizing but distinguish between weakly progressive (progressive in relative terms) and strongly progressive (progressive in absolute terms). Scott (2011) uses the term progressive only for transfers that are progressive in absolute terms; regressive transfers are those that are progressive only in relative terms (still equalizing) or outright regressive (unequalizing). Wagstaff (2012) uses the term ‘pro-poor’ for transfers that are progressive in absolute terms and ‘pro-rich’ for transfers that are progressive in relative terms (or outright regressive). Lambert (2002) uses opposite language. He defines as progressive (regressive) when relative transfers increase (decrease) with income because the proportion received increases (declines) with income. That is, Lambert chooses not to relate the concept of ‘progressive’ with equalizing transfers.
6
transfer or tax is defined as progressive (regressive) if it results in a less (more) unequal distribution than that of market income.
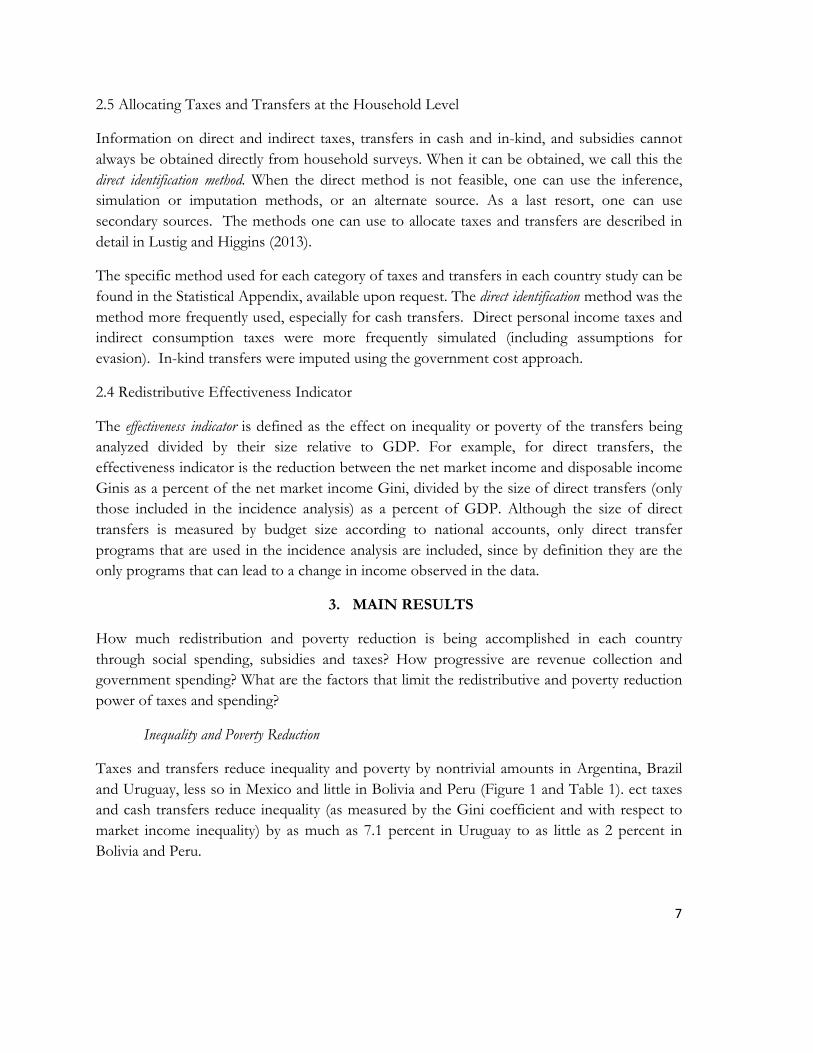
2.3 Tax Shifting Assumptions
Consistent with other conventional tax incidence analysis—and, unless specified otherwise—here we assume that the economic burden of direct personal income taxes is borne by the recipient of income. The burden of payroll and social security taxes falls entirely on workers. Consumption taxes are assumed to be shifted forward to consumers. Although these assumptions are subject to criticism because in essence they imply that owners of factors of production have perfectly inelastic supplies and consumers have perfectly inelastic demands for goods and services, in practice they are far less controversial. This is so because “…the results obtained with more realistic and laborious assumptions on elasticities tend to yield quite similar results” (Martinez-Vazquez, 2008, p. 123).
Tax evasion or informality, which is widespread in the region, is taken into account in the analysis by assuming that individuals who do not participate in the contributory social security system do not pay income or payroll taxes (Brazil’s survey includes a question on tax payments so tax evasion is assumed to be as reported in the survey). In the case of indirect (consumption) taxes, assumptions to take into account evasion varied. In Bolivia, it was assumed that purchases in informal sector establishments do not pay indirect taxes both in urban and rural areas, but the rest of rural individuals are assumed to pay indirect taxes. In Brazil, the indirect tax rate for each type of good or service was obtained from a secondary source that estimated the effective rates taking into account evasion, but not the distribution of this evasion. In Mexico and Peru, it was assumed that all purchases in the rural areas and in informal sector urban establishments do not pay indirect taxes. In Uruguay, the legal rate of VAT was applied to everybody regardless of place of purchase or region (rural vs. urban). For Brazil and Uruguay this analysis may thus overestimate the impact and regressivity of indirect taxes, while for Mexico and Peru it might somewhat underestimate these effects. Taking into account informality in this analysis may also be more important in some countries than in others, depending on the actual extent of informality. Care must be taken in comparing the results for post-fiscal incomes.
2.4 Incidence of Public Services
The approach to estimate the incidence of public spending on education and health followed here is the so-called ‘benefit or expenditure incidence’ or ‘government cost’ approach. In essence, we use per beneficiary input costs obtained from administrative data as the measure of marginal benefits. This approach—also known as ‘classic’ or ‘nonbehavioral approach’—amounts to asking the following question: how much would the income of a household have to be increased if it had to pay for the free or subsidized public service at full cost?
7
2.5 Allocating Taxes and Transfers at the Household Level
Information on direct and indirect taxes, transfers in cash and in-kind, and subsidies cannot always be obtained directly from household surveys. When it can be obtained, we call this the direct identification method. When the direct method is not feasible, one can use the inference, simulation or imputation methods, or an alternate source. As a last resort, one can use secondary sources. The methods one can use to allocate taxes and transfers are described in detail in Lustig and Higgins (2013).
The specific method used for each category of taxes and transfers in each country study can be found in the Statistical Appendix, available upon request. The direct identification method was the method more frequently used, especially for cash transfers. Direct personal income taxes and indirect consumption taxes were more frequently simulated (including assumptions for evasion). In-kind transfers were imputed using the government cost approach.
2.4 Redistributive Effectiveness Indicator
The effectiveness indicator is defined as the effect on inequality or poverty of the transfers being analyzed divided by their size relative to GDP. For example, for direct transfers, the effectiveness indicator is the reduction between the net market income and disposable income Ginis as a percent of the net market income Gini, divided by the size of direct transfers (only those included in the incidence analysis) as a percent of GDP. Although the size of direct transfers is measured by budget size according to national accounts, only direct transfer programs that are used in the incidence analysis are included, since by definition they are the only programs that can lead to a change in income observed in the data.
3. MAIN RESULTS
How much redistribution and poverty reduction is being accomplished in each country through social spending, subsidies and taxes? How progressive are revenue collection and government spending? What are the factors that limit the redistributive and poverty reduction power of taxes and spending?
Inequality and Poverty Reduction
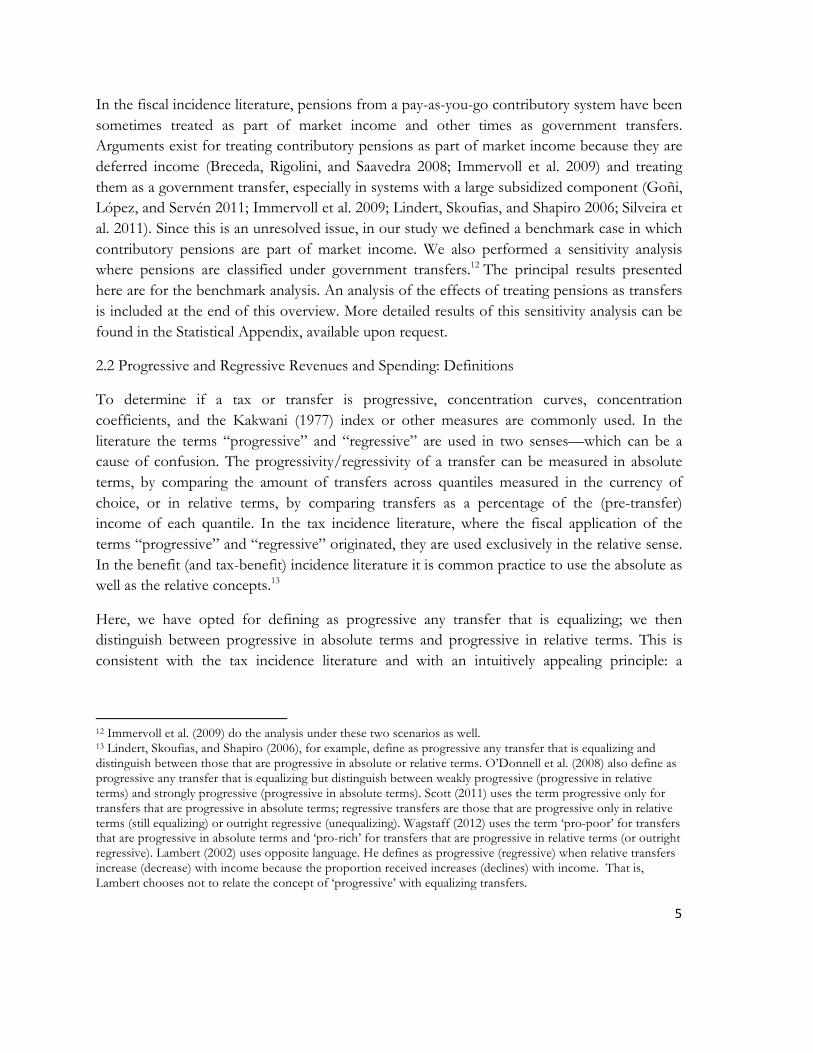
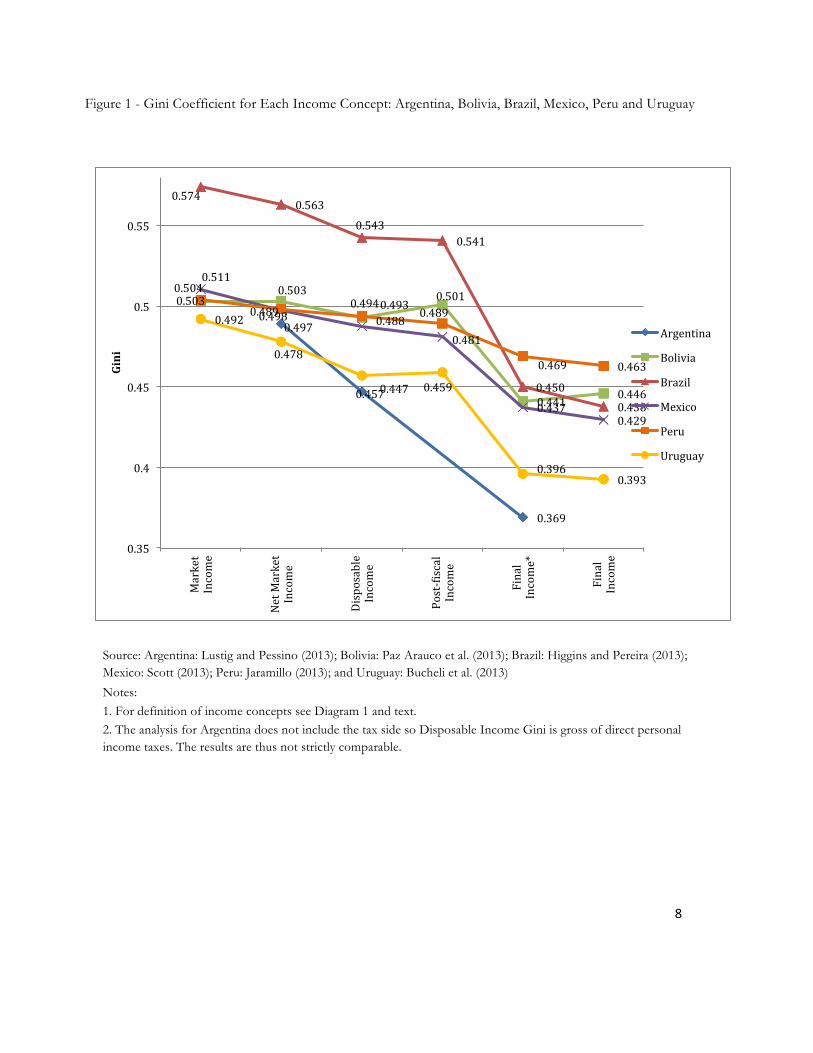
Taxes and transfers reduce inequality and poverty by nontrivial amounts in Argentina, Brazil and Uruguay, less so in Mexico and little in Bolivia and Peru (Figure 1 and Table 1). ect taxes and cash transfers reduce inequality (as measured by the Gini coefficient and with respect to market income inequality) by as much as 7.1 percent in Uruguay to as little as 2 percent in Bolivia and Peru.
8
Figure 1 - Gini Coefficient for Each Income Concept: Argentina, Bolivia, Brazil, Mexico, Peru and Uruguay
Source: Argentina: Lustig and Pessino (2013); Bolivia: Paz Arauco et al. (2013); Brazil: Higgins and Pereira (2013); Mexico: Scott (2013); Peru: Jaramillo (2013); and Uruguay: Bucheli et al. (2013)
Notes: 1. For definition of income concepts see Diagram 1 and text. 2. The analysis for Argentina does not include the tax side so Disposable Income Gini is gross of direct personal income taxes. The results are thus not strictly comparable.
0.489
0.447
0.369
0.503 0.503
0.493 0.501
0.441 0.446
0.574 0.563
0.543 0.541
0.450 0.438
0.511
0.497 0.488 0.481
0.437 0.429
0.504
0.498 0.494
0.489
0.469 0.463
0.492
0.478
0.457 0.459
0.396 0.393
0.35
0.4
0.45
0.5
0.55
Market
Income
Net Market
Income
Disposable
Income
Post-‐Xiscal
Income
Final
Income*
Final
Income
Gini
Argentina
Bolivia
Brazil
Mexico
Peru
Uruguay
9
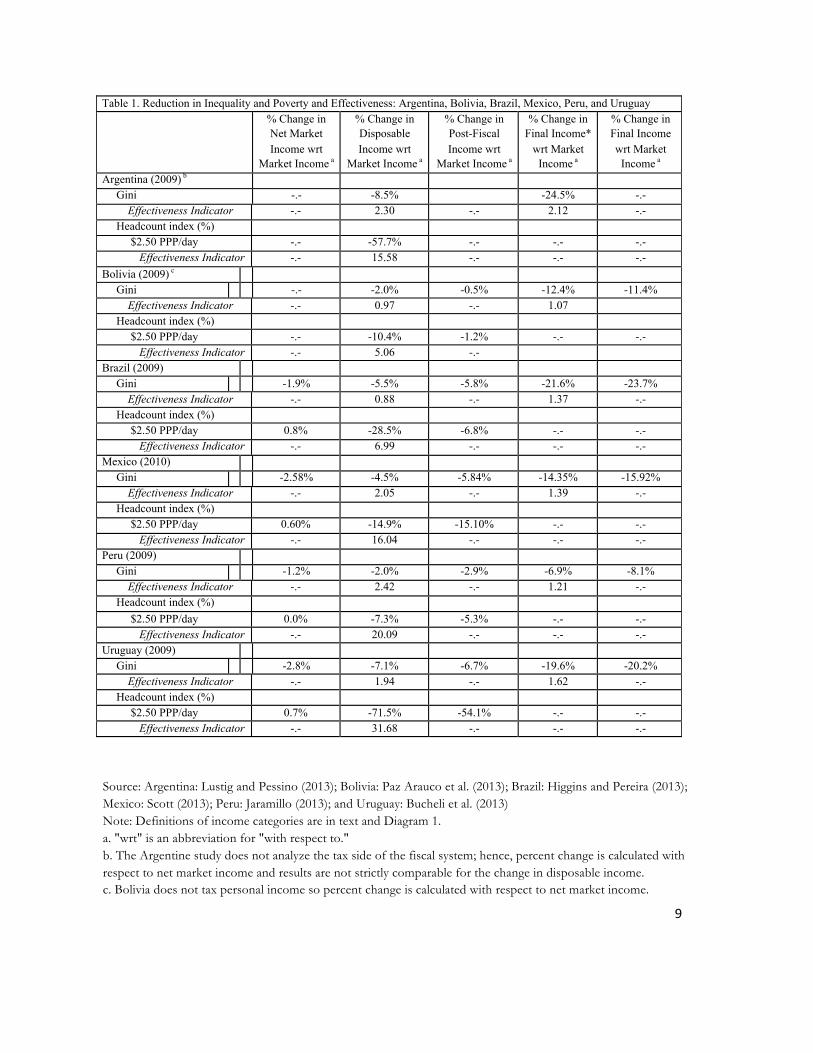
Source: Argentina: Lustig and Pessino (2013); Bolivia: Paz Arauco et al. (2013); Brazil: Higgins and Pereira (2013); Mexico: Scott (2013); Peru: Jaramillo (2013); and Uruguay: Bucheli et al. (2013) Note: Definitions of income categories are in text and Diagram 1. a. "wrt" is an abbreviation for "with respect to." b. The Argentine study does not analyze the tax side of the fiscal system; hence, percent change is calculated with respect to net market income and results are not strictly comparable for the change in disposable income. c. Bolivia does not tax personal income so percent change is calculated with respect to net market income.
Table 1. Reduction in Inequality and Poverty and Effectiveness: Argentina, Bolivia, Brazil, Mexico, Peru, and Uruguay % Change in
Net Market Income wrt
Market Income a
% Change in Disposable Income wrt
Market Income a
% Change in Post-Fiscal Income wrt
Market Income a
% Change in Final Income*
wrt Market Income a
% Change in Final Income wrt Market
Income a Argentina (2009) b Gini -.- -8.5% -24.5% -.- Effectiveness Indicator -.- 2.30 -.- 2.12 -.- Headcount index (%) $2.50 PPP/day -.- -57.7% -.- -.- -.- Effectiveness Indicator -.- 15.58 -.- -.- -.- Bolivia (2009) c Gini -.- -2.0% -0.5% -12.4% -11.4% Effectiveness Indicator -.- 0.97 -.- 1.07 Headcount index (%) $2.50 PPP/day -.- -10.4% -1.2% -.- -.- Effectiveness Indicator -.- 5.06 -.- Brazil (2009) Gini -1.9% -5.5% -5.8% -21.6% -23.7% Effectiveness Indicator -.- 0.88 -.- 1.37 -.- Headcount index (%) $2.50 PPP/day 0.8% -28.5% -6.8% -.- -.- Effectiveness Indicator -.- 6.99 -.- -.- -.- Mexico (2010) Gini -2.58% -4.5% -5.84% -14.35% -15.92% Effectiveness Indicator -.- 2.05 -.- 1.39 -.- Headcount index (%) $2.50 PPP/day 0.60% -14.9% -15.10% -.- -.- Effectiveness Indicator -.- 16.04 -.- -.- -.- Peru (2009) Gini -1.2% -2.0% -2.9% -6.9% -8.1% Effectiveness Indicator -.- 2.42 -.- 1.21 -.- Headcount index (%) $2.50 PPP/day 0.0% -7.3% -5.3% -.- -.- Effectiveness Indicator -.- 20.09 -.- -.- -.- Uruguay (2009) Gini -2.8% -7.1% -6.7% -19.6% -20.2% Effectiveness Indicator -.- 1.94 -.- 1.62 -.- Headcount index (%) $2.50 PPP/day 0.7% -71.5% -54.1% -.- -.- Effectiveness Indicator -.- 31.68 -.- -.- -.- !
10
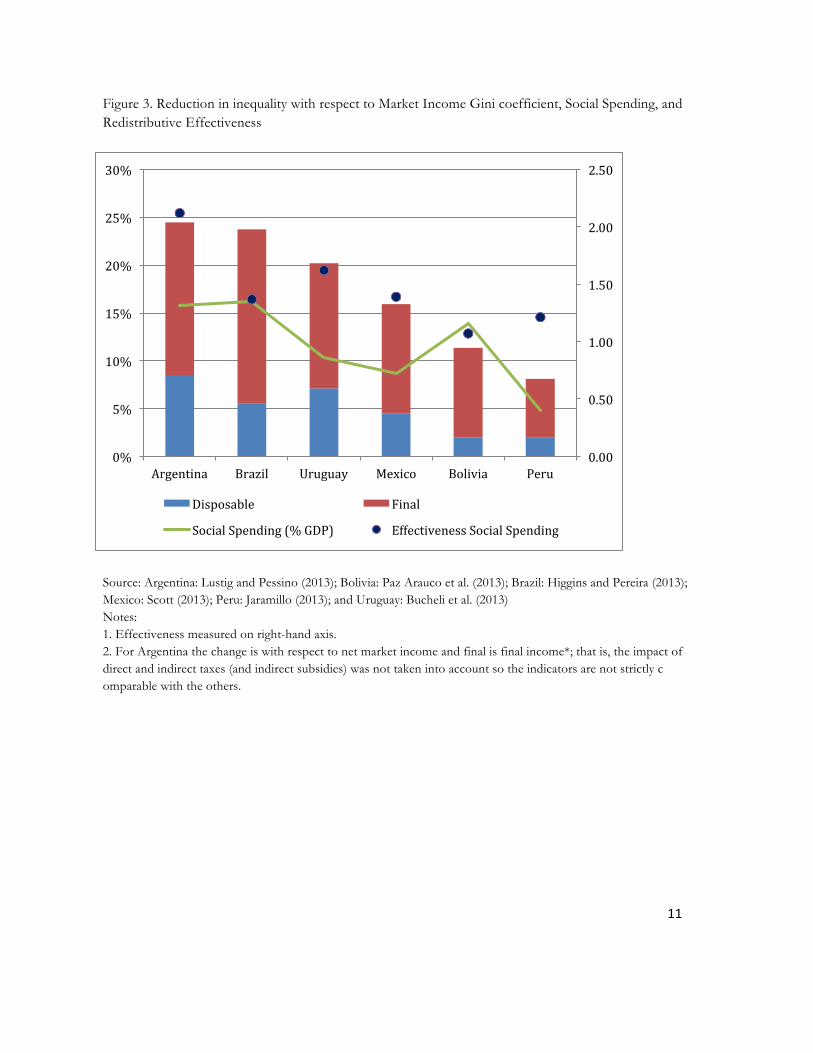
In Brazil and Uruguay, the reduction in disposable income inequality is mainly due to the impact of cash transfers. In Bolivia and Peru, the little redistribution that there is comes mainly from direct taxes in Peru and solely from cash transfers in Bolivia (which has practically no personal income taxes). Net indirect taxes temper the redistributive impact in Bolivia and Uruguay but not in Brazil, Mexico or Peru. When one adds the effect of transfers in-kind (access to free or quasi-free services in education and health), inequality declines substantially more in all countries, ranging from 24.5 percent, 23.7 percent, and 20.2 percent in Argentina, Brazil, and Uruguay, respectively, to 8.1 percent in Peru. Argentina achieves this effect by the size as well as the redistributive effectiveness of its social spending. Brazil has a lower level of effectiveness, similar to Mexico and Peru; the large differences in terms of impact among the three countries are explained mainly by the size of social spending. Finally, despite spending considerably less than Bolivia and not much more than Mexico, Uruguay is highly effective at reducing inequality and poverty.
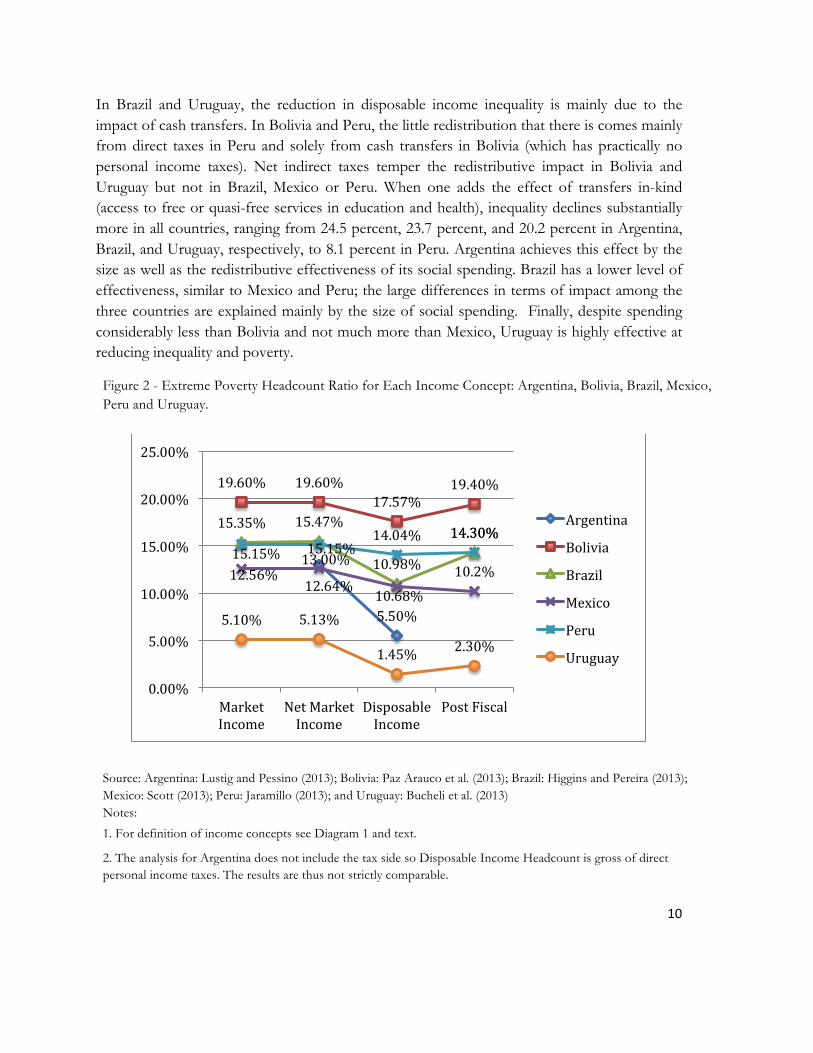
Figure 2 - Extreme Poverty Headcount Ratio for Each Income Concept: Argentina, Bolivia, Brazil, Mexico, Peru and Uruguay.
Source: Argentina: Lustig and Pessino (2013); Bolivia: Paz Arauco et al. (2013); Brazil: Higgins and Pereira (2013); Mexico: Scott (2013); Peru: Jaramillo (2013); and Uruguay: Bucheli et al. (2013) Notes:
1. For definition of income concepts see Diagram 1 and text.
2. The analysis for Argentina does not include the tax side so Disposable Income Headcount is gross of direct personal income taxes. The results are thus not strictly comparable.
13.00%
5.50%
19.60% 19.60% 17.57%
19.40%
15.35% 15.47%
10.98%
14.30%
12.56% 12.64%
10.68% 10.2%
15.15% 15.15% 14.04% 14.30%
5.10% 5.13%
1.45% 2.30%
0.00%
5.00%
10.00%
15.00%
20.00%
25.00%
Market Income
Net Market Income
Disposable Income
Post Fiscal
Argentina
Bolivia
Brazil
Mexico
Peru
Uruguay
11
Figure 3. Reduction in inequality with respect to Market Income Gini coefficient, Social Spending, and Redistributive Effectiveness
Source: Argentina: Lustig and Pessino (2013); Bolivia: Paz Arauco et al. (2013); Brazil: Higgins and Pereira (2013); Mexico: Scott (2013); Peru: Jaramillo (2013); and Uruguay: Bucheli et al. (2013) Notes: 1. Effectiveness measured on right-hand axis. 2. For Argentina the change is with respect to net market income and final is final income*; that is, the impact of direct and indirect taxes (and indirect subsidies) was not taken into account so the indicators are not strictly c omparable with the others.
0.00
0.50
1.00
1.50
2.00
2.50
0%
5%
10%
15%
20%
25%
30%
Argentina Brazil Uruguay Mexico Bolivia Peru
Disposable Final
Social Spending (% GDP) Effectiveness Social Spending
12
Poverty is measured for market, net market and disposable income only since the poverty lines are defined not considering the income in-kind stemming from access to free education and health services. Here we report the impact of taxes and benefits on extreme poverty measured by the proportion of the population with incomes below the international poverty line of $2.50 PPP per day. Cash transfers have quite a heterogeneous impact on poverty depending on the country, ranging from a decline (with respect to market income) of 71.5 percent in Uruguay to 7.3 percent in Peru. Indirect taxes almost completely offset the effect of cash transfers on poverty in Bolivia and Brazil.
A word of caution is in order. The indicators of inequality and poverty have some comparability issues for two main reasons. First, the assumptions to take into account indirect tax evasion differ across countries: Mexico and Peru assumed all consumers in the rural sector evade indirect taxes as well as those who purchase from informal outlets in urban areas. In Bolivia, Brazil and Uruguay—in contrast— rural consumers pay indirect taxes but in Bolivia they do not if the place of purchase is an informal outlet (country-specific are available upon request). Second, Peru and Uruguay did not include the impact of indirect subsidies in the incidence analysis. Also, as stated above, Argentina is not strictly comparable with the rest because the study focuses only on the spending side and, even then, it does not include public spending on the contributory health system so final income* for Argentina is not (conceptually) exactly the same as for the other five countries.
Size of Budget: Government Primary Spending as a Share of GDP
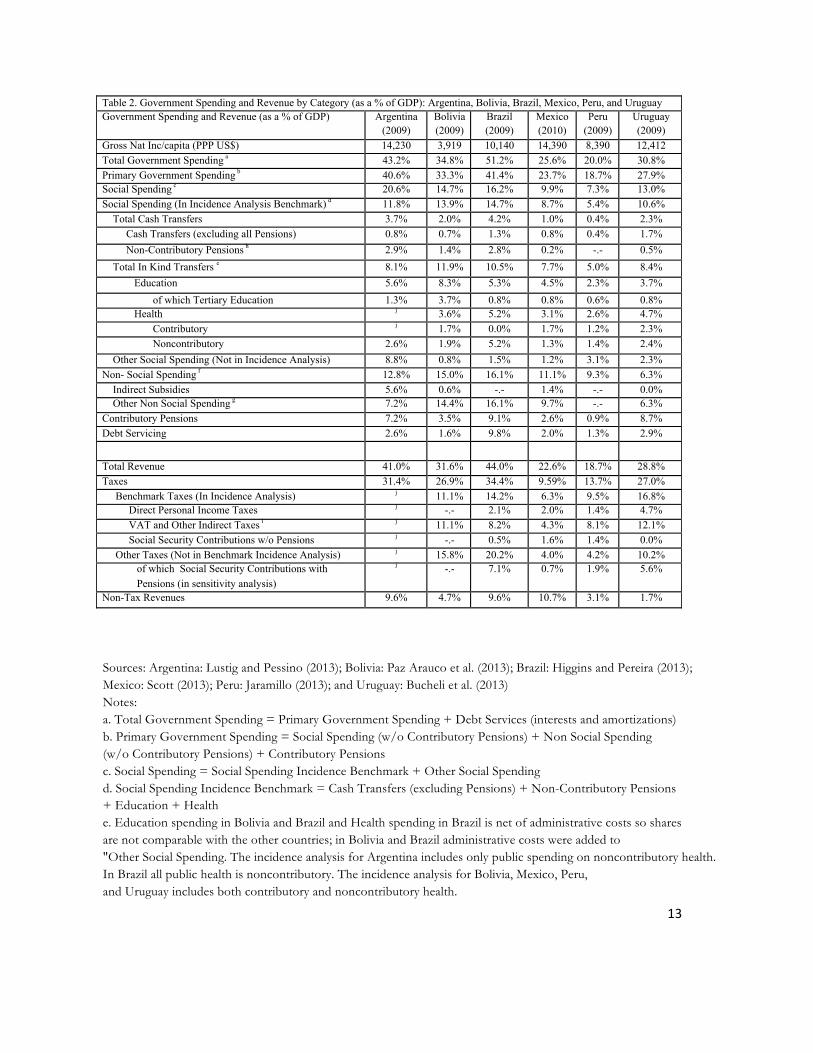
Table 2 presents taxes and spending as a share of GDP and identifies which taxes and transfer programs were included in the incidence analysis. As one can see, the six countries are quite heterogeneous in terms of government size as well as spending and revenue-collection patterns. As noted by Lustig et al. (2012) previously, one cannot really speak of a “Latin American” prototype. Government spending as a share of GDP in Argentina and Brazil, for example, is similar to that found in OECD countries while in Mexico and Peru, the ratios are half as large. Thus, in the cases of Argentina and Brazil—and to a lesser extent in Bolivia and Uruguay—the size of the government budget is not a constraint on redistributive and poverty-reducing interventions. Mexico and Peru, however, would probably have to raise more revenues to reduce poverty further.
13
Sources: Argentina: Lustig and Pessino (2013); Bolivia: Paz Arauco et al. (2013); Brazil: Higgins and Pereira (2013); Mexico: Scott (2013); Peru: Jaramillo (2013); and Uruguay: Bucheli et al. (2013) Notes: a. Total Government Spending = Primary Government Spending + Debt Services (interests and amortizations) b. Primary Government Spending = Social Spending (w/o Contributory Pensions) + Non Social Spending (w/o Contributory Pensions) + Contributory Pensions c. Social Spending = Social Spending Incidence Benchmark + Other Social Spending d. Social Spending Incidence Benchmark = Cash Transfers (excluding Pensions) + Non-Contributory Pensions + Education + Health e. Education spending in Bolivia and Brazil and Health spending in Brazil is net of administrative costs so shares are not comparable with the other countries; in Bolivia and Brazil administrative costs were added to "Other Social Spending. The incidence analysis for Argentina includes only public spending on noncontributory health. In Brazil all public health is noncontributory. The incidence analysis for Bolivia, Mexico, Peru, and Uruguay includes both contributory and noncontributory health.
Table 2. Government Spending and Revenue by Category (as a % of GDP): Argentina, Bolivia, Brazil, Mexico, Peru, and Uruguay Government Spending and Revenue (as a % of GDP) Argentina
(2009) Bolivia (2009)
Brazil (2009)
Mexico (2010)
Peru (2009)
Uruguay (2009)
Gross Nat Inc/capita (PPP US$) 14,230 3,919 10,140 14,390 8,390 12,412 Total Government Spending a 43.2% 34.8% 51.2% 25.6% 20.0% 30.8% Primary Government Spending b 40.6% 33.3% 41.4% 23.7% 18.7% 27.9% Social Spending c 20.6% 14.7% 16.2% 9.9% 7.3% 13.0% Social Spending (In Incidence Analysis Benchmark) d 11.8% 13.9% 14.7% 8.7% 5.4% 10.6% Total Cash Transfers 3.7% 2.0% 4.2% 1.0% 0.4% 2.3% Cash Transfers (excluding all Pensions) 0.8% 0.7% 1.3% 0.8% 0.4% 1.7% Non-Contributory Pensions h 2.9% 1.4% 2.8% 0.2% -.- 0.5% Total In Kind Transfers e 8.1% 11.9% 10.5% 7.7% 5.0% 8.4%
Education 5.6% 8.3% 5.3% 4.5% 2.3% 3.7% of which Tertiary Education 1.3% 3.7% 0.8% 0.8% 0.6% 0.8% Health j 3.6% 5.2% 3.1% 2.6% 4.7% Contributory j 1.7% 0.0% 1.7% 1.2% 2.3% Noncontributory 2.6% 1.9% 5.2% 1.3% 1.4% 2.4%
Other Social Spending (Not in Incidence Analysis) 8.8% 0.8% 1.5% 1.2% 3.1% 2.3% Non- Social Spending f 12.8% 15.0% 16.1% 11.1% 9.3% 6.3%
Indirect Subsidies 5.6% 0.6% -.- 1.4% -.- 0.0% Other Non Social Spending g 7.2% 14.4% 16.1% 9.7% -.- 6.3%
Contributory Pensions 7.2% 3.5% 9.1% 2.6% 0.9% 8.7% Debt Servicing 2.6% 1.6% 9.8% 2.0% 1.3% 2.9%
Total Revenue 41.0% 31.6% 44.0% 22.6% 18.7% 28.8% Taxes 31.4% 26.9% 34.4% 9.59% 13.7% 27.0% Benchmark Taxes (In Incidence Analysis) j 11.1% 14.2% 6.3% 9.5% 16.8% Direct Personal Income Taxes j -.- 2.1% 2.0% 1.4% 4.7% VAT and Other Indirect Taxes i j 11.1% 8.2% 4.3% 8.1% 12.1% Social Security Contributions w/o Pensions j -.- 0.5% 1.6% 1.4% 0.0% Other Taxes (Not in Benchmark Incidence Analysis) j 15.8% 20.2% 4.0% 4.2% 10.2% of which Social Security Contributions with Pensions (in sensitivity analysis)
j -.- 7.1% 0.7% 1.9% 5.6%
Non-Tax Revenues 9.6% 4.7% 9.6% 10.7% 3.1% 1.7%
!
14
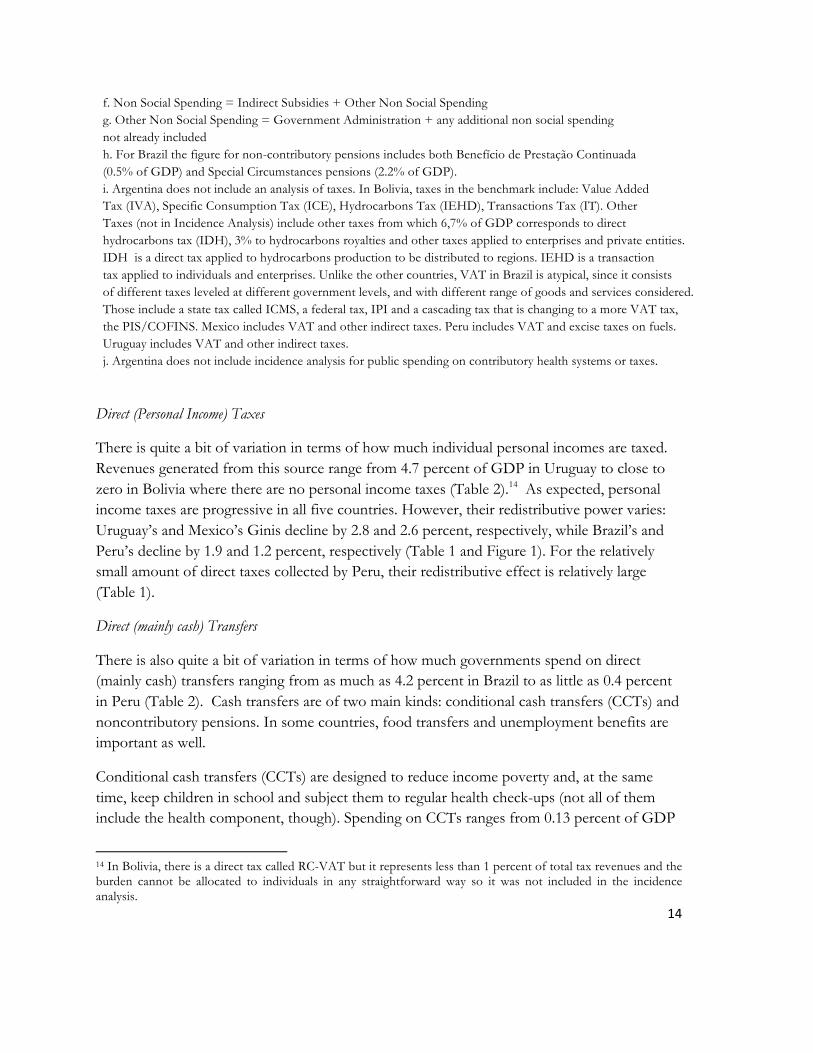
f. Non Social Spending = Indirect Subsidies + Other Non Social Spending g. Other Non Social Spending = Government Administration + any additional non social spending not already included h. For Brazil the figure for non-contributory pensions includes both Benefício de Prestação Continuada (0.5% of GDP) and Special Circumstances pensions (2.2% of GDP). i. Argentina does not include an analysis of taxes. In Bolivia, taxes in the benchmark include: Value Added Tax (IVA), Specific Consumption Tax (ICE), Hydrocarbons Tax (IEHD), Transactions Tax (IT). Other Taxes (not in Incidence Analysis) include other taxes from which 6,7% of GDP corresponds to direct hydrocarbons tax (IDH), 3% to hydrocarbons royalties and other taxes applied to enterprises and private entities. IDH is a direct tax applied to hydrocarbons production to be distributed to regions. IEHD is a transaction tax applied to individuals and enterprises. Unlike the other countries, VAT in Brazil is atypical, since it consists of different taxes leveled at different government levels, and with different range of goods and services considered. Those include a state tax called ICMS, a federal tax, IPI and a cascading tax that is changing to a more VAT tax, the PIS/COFINS. Mexico includes VAT and other indirect taxes. Peru includes VAT and excise taxes on fuels. Uruguay includes VAT and other indirect taxes. j. Argentina does not include incidence analysis for public spending on contributory health systems or taxes.
Direct (Personal Income) Taxes
There is quite a bit of variation in terms of how much individual personal incomes are taxed. Revenues generated from this source range from 4.7 percent of GDP in Uruguay to close to zero in Bolivia where there are no personal income taxes (Table 2).14 As expected, personal income taxes are progressive in all five countries. However, their redistributive power varies: Uruguay’s and Mexico’s Ginis decline by 2.8 and 2.6 percent, respectively, while Brazil’s and Peru’s decline by 1.9 and 1.2 percent, respectively (Table 1 and Figure 1). For the relatively small amount of direct taxes collected by Peru, their redistributive effect is relatively large (Table 1).
Direct (mainly cash) Transfers
There is also quite a bit of variation in terms of how much governments spend on direct (mainly cash) transfers ranging from as much as 4.2 percent in Brazil to as little as 0.4 percent in Peru (Table 2). Cash transfers are of two main kinds: conditional cash transfers (CCTs) and noncontributory pensions. In some countries, food transfers and unemployment benefits are important as well.
Conditional cash transfers (CCTs) are designed to reduce income poverty and, at the same time, keep children in school and subject them to regular health check-ups (not all of them include the health component, though). Spending on CCTs ranges from 0.13 percent of GDP
14 In Bolivia, there is a direct tax called RC-VAT but it represents less than 1 percent of total tax revenues and the burden cannot be allocated to individuals in any straightforward way so it was not included in the incidence analysis.
15
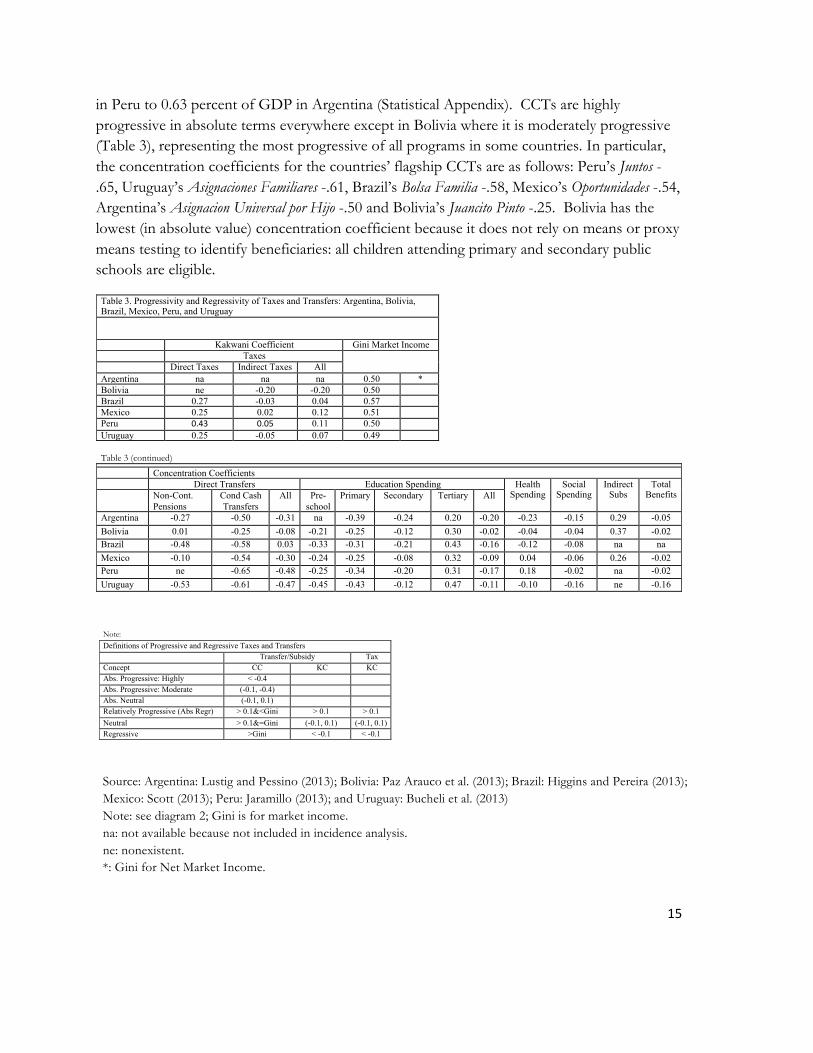
in Peru to 0.63 percent of GDP in Argentina (Statistical Appendix). CCTs are highly progressive in absolute terms everywhere except in Bolivia where it is moderately progressive (Table 3), representing the most progressive of all programs in some countries. In particular, the concentration coefficients for the countries’ flagship CCTs are as follows: Peru’s Juntos -.65, Uruguay’s Asignaciones Familiares -.61, Brazil’s Bolsa Familia -.58, Mexico’s Oportunidades -.54, Argentina’s Asignacion Universal por Hijo -.50 and Bolivia’s Juancito Pinto -.25. Bolivia has the lowest (in absolute value) concentration coefficient because it does not rely on means or proxy means testing to identify beneficiaries: all children attending primary and secondary public schools are eligible.
Source: Argentina: Lustig and Pessino (2013); Bolivia: Paz Arauco et al. (2013); Brazil: Higgins and Pereira (2013); Mexico: Scott (2013); Peru: Jaramillo (2013); and Uruguay: Bucheli et al. (2013) Note: see diagram 2; Gini is for market income. na: not available because not included in incidence analysis. ne: nonexistent. *: Gini for Net Market Income.
Table 3. Progressivity and Regressivity of Taxes and Transfers: Argentina, Bolivia, Brazil, Mexico, Peru, and Uruguay Kakwani Coefficient Gini Market Income Taxes Direct Taxes Indirect Taxes All Argentina na na na 0.50 * Bolivia ne -0.20 -0.20 0.50 Brazil 0.27 -0.03 0.04 0.57 Mexico 0.25 0.02 0.12 0.51 Peru 0.43% 0.05% 0.11 0.50 Uruguay 0.25 -0.05 0.07 0.49 %Table 3 (continued) Concentration Coefficients Direct Transfers Education Spending Health
Spending Social
Spending Indirect
Subs Total
Benefits Non-Cont. Pensions
Cond Cash Transfers
All Pre-school
Primary Secondary Tertiary All
Argentina -0.27 -0.50 -0.31 na -0.39 -0.24 0.20 -0.20 -0.23 -0.15 0.29 -0.05 Bolivia 0.01 -0.25 -0.08 -0.21 -0.25 -0.12 0.30 -0.02 -0.04 -0.04 0.37 -0.02 Brazil -0.48 -0.58 0.03 -0.33 -0.31 -0.21 0.43 -0.16 -0.12 -0.08 na na Mexico -0.10 -0.54 -0.30 -0.24 -0.25 -0.08 0.32 -0.09 0.04 -0.06 0.26 -0.02 Peru ne -0.65 -0.48 -0.25 -0.34 -0.20 0.31 -0.17 0.18 -0.02 na -0.02 Uruguay -0.53 -0.61 -0.47 -0.45 -0.43 -0.12 0.47 -0.11 -0.10 -0.16 ne -0.16 %
Note: Definitions of Progressive and Regressive Taxes and Transfers
Transfer/Subsidy Tax Concept CC KC KC Abs. Progressive: Highly < -0.4 Abs. Progressive: Moderate (-0.1, -0.4) Abs. Neutral (-0.1, 0.1) Relatively Progressive (Abs Regr) > 0.1&<Gini > 0.1 > 0.1 Neutral > 0.1&=Gini (-0.1, 0.1) (-0.1, 0.1) Regressive >Gini < -0.1 < -0.1 !
16
Noncontributory (old-age) pensions are the second most common cash transfer. Only Peru (at the time of the survey) did not have such a program but has launched a program since.15 Essentially, these programs transfer cash to individuals 65 years old or older who have never contributed to the formal social security system or have not contributed enough to be eligible for old-age pension benefits. In the case of Argentina and to a lesser extent in Bolivia, spending on noncontributory pensions is quite high: 2.9 and 1.4 percent of GDP (Table 2), respectively, almost five times more than what is spent on other cash transfers (mainly CCTs). In Uruguay and Mexico, on the other hand, spending on noncontributory pensions is only 0.5 and 0.2 percent of GDP, respectively. However, lax enforcement of eligibility in the past leads one to believe that spending on contributory pensions in Uruguay—among the highest of all—includes payments to individuals who did not contribute or did not contribute enough to become eligible.16
Noncontributory pensions are quite progressive in absolute terms in Uruguay and Brazil where the concentration coefficients equal -.53 and -.48, respectively (Table 3). In Argentina and Mexico they are progressive in absolute terms but to a lesser extent: concentration coefficients equal -.27 and -.10,17 respectively. However, the lower absolute progressivity in the latter is not because leakages to the middle-class and the rich are high. In Argentina, 46 percent of the benefits of noncontributory pensions accrue to individuals with market incomes of less than US$2.50 PPP per day (conventionally considered the extreme poverty line for Latin America) and 59 percent accrues to individuals with market incomes of less than US$4 PPP per day (conventionally considered the moderate poverty line for Latin America). Of the remaining 41 percent, about three fourths accrues to individuals with market incomes equal to or above US$4 PPP and below US$10 PPP per day. This group has been defined as ‘vulnerable’ to falling into poverty.18 With a concentration coefficient of .01, Bolivia is the only country where noncontributory pensions are not progressive but neutral in absolute terms: that is, the per capita transfer is approximately the same regardless of income. The results for both Bolivia 15 The program is called “Pension 65” and it was launched in 2011. It is means-tested and it has more than 200,000 beneficiaries. Individuals who are 65 or older and live in extreme poverty are eligible as long as they don’t receive pensions from other sources or other government benefits except for “Juntos” (a CCT) and “SIS” (the noncontributory health program). 16 In the case of Uruguay, because the government did not have a registry of employment history up until 1996, an unknown number of individuals who received contributory old-age pensions in the year of the survey were probably not eligible (that is, they had probably not fulfilled the required 30 years of contributions). Thus, the 8.7 percent that the government spends on social security benefits includes an unknown amount that in reality should have been classified as noncontributory pensions. If the individuals who received the pensions by dodging the system disproportionately belonged to the poor, the redistributive and poverty reducing impact of Uruguay's social spending would have been even higher than what was found. 17 This refers to the federal non-contributory pension (70 y más), which is universal in rural and semi-urban areas (in 2013 it has been made universal in all areas and extended to 65+ year olds). In addition many states have local noncontributory pension programs, which range widely in progressivity at the national level, reflecting in part the income disparities between states. The national average for all noncontributory programs is -0.10. 18 See López-Calva and Ortiz-Juarez (2011).
17
and Mexico reflect the universal, non-targeted design of their noncontributory pension programs.
It is important to note, however, that ranking programs in terms of degree of progressivity does not entail a ranking of their relative merits as redistributive instruments because there are other relevant characteristics to consider in a full comparative evaluation of redistributive efficiency such as coverage and behavioral effects.
As shown in Table 1 and Figures 1 and 2, Uruguay and Argentina are the countries that achieve the most inequality and poverty reduction through direct transfers, followed by Brazil. On the other extreme are Bolivia and Peru but for very different reasons. As one can observe in Table 1, Peru is very effective in terms of how much inequality and poverty reduction is achieved per percent of GDP spent on direct transfers. The scale of redistribution and poverty reduction is small because Peru spends so little on cash transfers. In contrast, Bolivia spends (as a share of GDP) five times more on cash transfers than Peru but because funds are weakly targeted (in the case of Juancito Pinto) or not targeted at all to the poor (in the case of noncontributory pensions), the scale of redistribution and poverty reduction is quite limited. In this spectrum, Mexico is more similar to Peru, but because Mexico spends more on direct transfers than Peru, the redistributive results are larger in Mexico.
In spite of spending a relative large amount on cash transfers, Brazil’s effectiveness in reducing inequality and poverty is relatively low (Figure 4). In Brazil this is due to unemployment benefits, scholarships, and, especially, the so-called Special Circumstances Pensions, a noncontributory—but part of the formal social security system—social insurance scheme for people who suffer accidents at work or become widows.19 For example, the government spent 2.3 percent of GDP on Special Circumsntances Pensions in 2009 and its concentration coefficient is .20: only 16 percent of the benefits accrue to individuals with incomes less than US$4 PPP a day (27 percent of the population); of the 84 percent of benefits that go to the nonpoor, 42 percent of the program’s total benefits accrue to individuals between US$10 to US$50 PPP (35 percent of the population) and 14 percent to individuals with daily incomes above US$50 PPP (5 percent of the population).20
19 Most of the benefits under "Special Circumstances Pensions" require being registered in the formal social security system. Eligibility only requires being currently registered and not a history of contributions. However, by definition these transfers are likely to have an anti-poor bias since most of the poor work in the informal sector and are not registered in the social security system. If this transfer were included with market income as contributory old-age pensions were, the impact of government taxes and transfers on inequality and poverty change but slightly.
20 These two income categories have been called “middle-class” and “rich” in a recent report by World Bank (Ferreira et al. 2013).
18
All six countries considered here have CCTs and five have noncontributory pensions. Nevertheless, with the exception of Argentina and Uruguay, after direct transfers (and taxes) extreme poverty rates (individuals under the US$2.50 PPP/day international poverty line) are still above 10 percent. This reflects in part higher market income poverty rates in these countries (with the exception of Mexico where pre-transfer poverty is actually slightly lower than in Argentina), but is also due to gaps in the coverage of the extreme poor, the size of benefits, or both. In Brazil, over 90 percent of the extreme poor receive at least one type of cash transfer and in Bolivia, 88 percent. Thus, in Brazil and Bolivia the coverage is near universal; the persistence of extreme poverty must be due to the size of the benefit in comparison with the poverty gap as well as to their distribution among the poor. In Bolivia, the average daily transfer (of all programs combined) to the extreme poor (those below the US$2.50 PPP/day poverty line) equals US$.35 PPP while the average poverty gap is US$1.25 PPP. In Brazil, these numbers are US$.88 PPP and US$1.05 PPP, respectively. Furthermore, these average benefits hide inequality in benefits among the poor. In Peru, coverage is a mere 56 percent. In Mexico, coverage is of 73 percent so there is room for improvement in coverage too. Hence, increasing coverage, the size of benefit, and their equity among the poor may be needed to eradicate extreme forms of poverty depending on the country.
Indirect (consumption) Taxes
Revenues from indirect taxes as a share of GDP range from as low as 4.3 percent in Mexico, to as high as 11.1 percent and 12.1 percent in Bolivia and Uruguay (Table 2). Indirect taxes are progressive in Peru, regressive in Bolivia, and close to neutral in the other countries (Table 3). In Peru, this is not by design (e.g., exemptions) but is due to the assumption that was made regarding consumption tax evasion. In Peru it was assumed that individuals in rural areas and those who purchase in so-called informal establishments in urban areas do not pay VAT or other indirect taxes. Since the poor are more concentrated in rural areas and poor people in rural and urban areas tend to buy more from informal (nontax-paying) outlets than the nonpoor, tax evasion is pro-poor in this instance. In effect, if the government were to crack down on informality, indirect taxes in Peru would become regressive. In the case of Mexico the lack of regressivity reflects informality as well as design: there are broad VAT exemptions on food and medicines, which also account for Mexico's low indirect tax revenue.
To what extent do indirect taxes offset what is accomplished through direct taxes and transfers in terms of inequality and poverty reduction? Because the post-fiscal income category includes the impact of indirect subsidies in the cases of Bolivia, Mexico and Peru, the comparison is not perfect. In these three countries, indirect subsidies are progressive in relative terms and in Mexico they were sufficiently large to make net indirect taxes progressive.
19
The Gini coefficients for market, disposable and post-fiscal income are as follows: Bolivia, .503, .493 and .501; Brazil, .574, .543 and .541; Mexico, .511, .488 and .481; Peru, .504, .494 and .489; and, Uruguay, .492, .457 and .459 (Figure 1).21 Thus, in the cases of Brazil, Mexico and Peru, the combined impact of indirect taxes and indirect subsidies is equalizing. In Bolivia and Uruguay, the post-fiscal inequality is slightly higher than the disposable income inequality but only in Bolivia is the effect large enough to practically offset the equalizing impact of direct transfers.
The impact of indirect taxes on poverty, however, is more pernicious. We shall use three indicators to illustrate this: the incidence of poverty with the international extreme poverty line of US$2.50 PPP per day; at what income decile and socio-economic group individuals become net payers to the fiscal system on average (before transfers in kind, that is); and, the degree of impoverishment or downward movement from near-poor (moderate poor) to moderate poor (extreme poor)—that is, the proportion of individuals who were in one of the categories using market income but fall into a lower category—induced by the effect of indirect taxes (Lustig and Higgins, 2012).
In Bolivia, the incidence of extreme poverty (less than US$2.50 PPP/day) with post-fiscal income is practically the same as the incidence of extreme poverty with market income: 19.4 and 19.6 percent, respectively. However, the ‘offsetting’ of cash transfer benefits is really dramatic only for Brazil in which a large reduction was achieved by direct transfers but is mostly offset by the burden of indirect taxes. Direct transfers reduce market income extreme poverty from 15.4 percent to a disposable income extreme poverty rate of 11 percent. Indirect taxes bring it back up to a post fiscal income extreme poverty of 14.3 percent. The reversal is also important but less markedly in Uruguay; in particular, post fiscal income extreme poverty equals 2.3 percent which is still half as much as market income extreme poverty at 5.1 percent but higher than disposable income extreme poverty which equals 1.5 percent. In Brazil and Uruguay, however, the poverty-increasing impact of indirect taxes may be overestimated due to the assumptions of no evasion of indirect (consumption) taxes (Uruguay), and no differences in evasion rates along the income distribution (Brazil). Mexico is the only country for which post-fiscal income poverty is (slightly) lower than disposable income poverty; as mentioned above, this is due to the effect of indirect subsidies. In Bolivia, Peru and Uruguay
21 In Brazil, post-fiscal income is lower than disposable income inequality but indirect taxes are slightly regressive with respect to post-fiscal income. This seemingly contradictory occurrence is due to reranking: indirect taxes are slightly progressive with respect to disposable income but slightly regressive with respect to market income, which is possible because the market and disposable income distributions are not the same. When we compare the Gini coefficient for market income to that of market income minus indirect taxes, the latter is higher.
20
the lowest decile in which people are net payers on average is the third decile while in Brazil and Mexico it is the fifth.
While in no country, on average, the net payer to the fiscal system is among the poor, in Bolivia, Brazil, Mexico and Peru, the net payer, on average, belongs to the ‘vulnerable’ group (with per capita market income equal or higher than US$4 and lower than US$10 PPP per day). Moreover, in Brazil more than 11percent of the vulnerable population is pushed down into moderate poverty while 11 percent of the moderate poor are pushed down into extreme poverty as a result of indirect taxes. For Bolivia, more than 8 percent of the moderate poor is pushed down into extreme poverty and a similar 8 percent of the extreme poor is pushed into ultra-poverty as a result of indirect taxes. (Ultra-poverty is defined by the US$1.25 PPP per day international poverty line.)
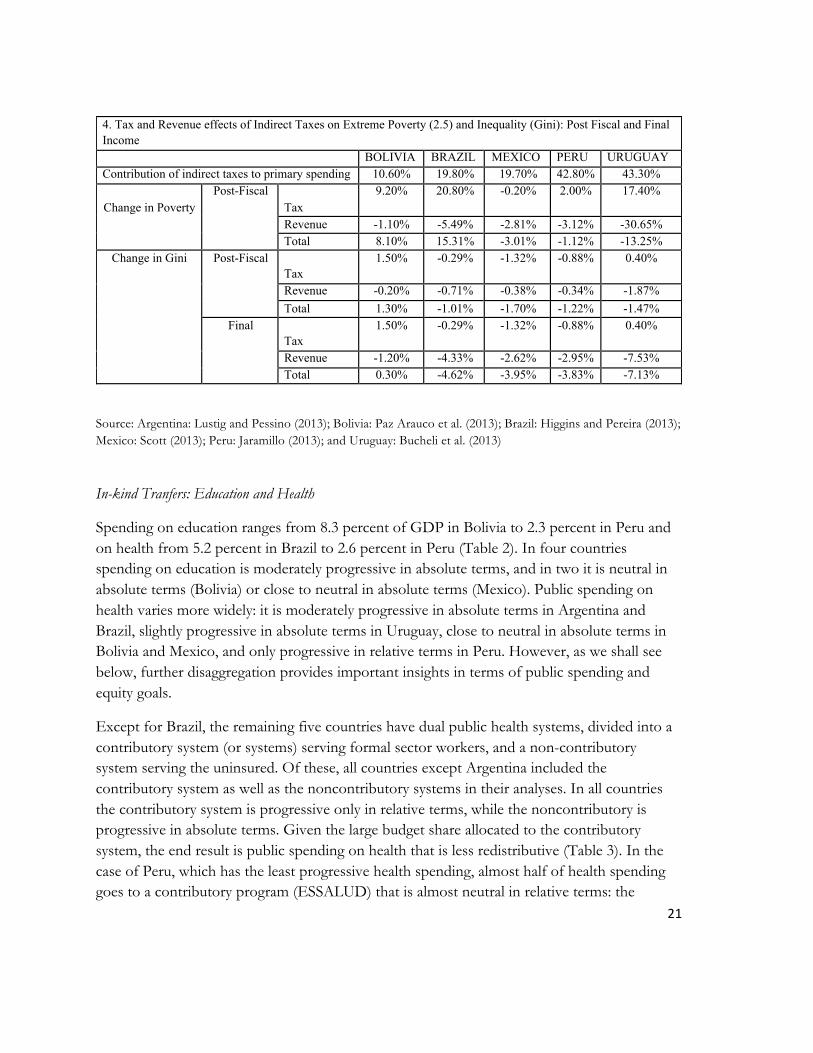
The above analysis only considered the direct effect of indirect taxes on inequality and poverty, as is common in tax incidence analysis. However, taxes affect the distribution of income also--and indeed mainly--through the public spending they finance. An important contribution of a comprehensive tax-benefit incidence analysis as a tool to inform tax reform is that it allows us to estimate the full incidence of alternative tax designs, considering both effects. Assuming indirect taxes to be non-earmarked, the proportion of social spending they finance is simply their share in total primary public spending. Assuming the average redistributive efficiency obtained from the benefit incidence analysis for these countries, table 4 shows the total redistributive effect of indirect taxes. Considering both their direct (tax) and revenue effect, indirect taxes reduce inequality in all countries except Bolivia, while they reduce extreme poverty in three of the five countries (Mexico, Peru, and Uruguay). What sets the Bolivian and Brazilian fiscal systems apart from the latter group is not their reliance on indirect taxation for revenue collecting purposes. Bolivia is set apart because of the universal nature of their cash transfers as well as the regressivity of its indirect taxes (Kakwani coefficient: -0.2). Brazil is set apart not because of the regressivity of indirect taxes, but rather because it spends a relatively large amount on transfers that are not targeted to the poor (Table 3). However, even though in Brazil indirect taxes are almost neutral (as measured by the Kakwani index), as was discussed above, their impact on poverty is significant. This is due to the relatively high rates that result from Brazil’s consumption tax system that features a complicated set of cascading consumption taxes at the federal (eliminated in March 2013) and state levels.
21
Source: Argentina: Lustig and Pessino (2013); Bolivia: Paz Arauco et al. (2013); Brazil: Higgins and Pereira (2013); Mexico: Scott (2013); Peru: Jaramillo (2013); and Uruguay: Bucheli et al. (2013)
In-kind Tranfers: Education and Health
Spending on education ranges from 8.3 percent of GDP in Bolivia to 2.3 percent in Peru and on health from 5.2 percent in Brazil to 2.6 percent in Peru (Table 2). In four countries spending on education is moderately progressive in absolute terms, and in two it is neutral in absolute terms (Bolivia) or close to neutral in absolute terms (Mexico). Public spending on health varies more widely: it is moderately progressive in absolute terms in Argentina and Brazil, slightly progressive in absolute terms in Uruguay, close to neutral in absolute terms in Bolivia and Mexico, and only progressive in relative terms in Peru. However, as we shall see below, further disaggregation provides important insights in terms of public spending and equity goals.
Except for Brazil, the remaining five countries have dual public health systems, divided into a contributory system (or systems) serving formal sector workers, and a non-contributory system serving the uninsured. Of these, all countries except Argentina included the contributory system as well as the noncontributory systems in their analyses. In all countries the contributory system is progressive only in relative terms, while the noncontributory is progressive in absolute terms. Given the large budget share allocated to the contributory system, the end result is public spending on health that is less redistributive (Table 3). In the case of Peru, which has the least progressive health spending, almost half of health spending goes to a contributory program (ESSALUD) that is almost neutral in relative terms: the
4. Tax and Revenue effects of Indirect Taxes on Extreme Poverty (2.5) and Inequality (Gini): Post Fiscal and Final Income BOLIVIA BRAZIL MEXICO PERU URUGUAY Contribution of indirect taxes to primary spending 10.60% 19.80% 19.70% 42.80% 43.30%
Change in Poverty
Post-Fiscal Tax
9.20% 20.80% -0.20% 2.00% 17.40%
Revenue -1.10% -5.49% -2.81% -3.12% -30.65% Total 8.10% 15.31% -3.01% -1.12% -13.25%
Change in Gini Post-Fiscal Tax
1.50% -0.29% -1.32% -0.88% 0.40%
Revenue -0.20% -0.71% -0.38% -0.34% -1.87% Total 1.30% -1.01% -1.70% -1.22% -1.47%
Final Tax
1.50% -0.29% -1.32% -0.88% 0.40%
Revenue -1.20% -4.33% -2.62% -2.95% -7.53% Total 0.30% -4.62% -3.95% -3.83% -7.13%
!
22
Kakwani coefficient of this program is -0.04. In Mexico public health spending has evolved in recent years from a distribution similar to Peru’s today to one that is neutral in absolute terms, due to a rapid expansion in public spending on health for the uninsured (most recently through the Seguro Popular non-contributory health insurance program).
In all six countries the bulk of redistribution is achieved through public education and public health. If one takes into account the monetized-equivalent of these transfers in-kind, the decline in market income Gini associated with social spending as a whole is 13.6 percentage points in Brazil, 12.0 percentage points in Argentina (though not strictly comparable for reasons explained above), 9.9 percentage points in Uruguay, 8.1 percentage points in Mexico, 5.7 percentage points in Bolivia, and only 4.0 percentage points in Peru (Figure 1). Why are Bolivia and Peru less redistributive? In the case of Peru, it is mainly because the amount spent is relatively small, but also because the total redistributive effectiveness of social spending is the second lowest after Bolivia. This reflects mainly that health spending is progressive in relative terms only. This contrasts with Peru’s effectiveness in the use of cash transfers where it ranks near the top. Education spending in Peru, on the other hand, is progressive in absolute terms. Even university education with a concentration coefficient of 0.3 is not “pro-rich:” the group with market income above US$50 per day captures a share equal to its population share (around 2 percent). As we shall see below, this is in stark contrast with Brazil and Uruguay.
Redistribution in Bolivia through in-kind transfers is limited for reasons that are quite different than for Peru. In Bolivia, the share of spending on education and health as a share of GDP is rather large, especially for education. The limited redistributive power stems from the fact that with concentration coefficients of -.02 for education and -.04 for health, per capita spending is practically the same for everyone. Since coverage of basic education among the extreme poor is not universal and poorer families have more school-age children, this ‘universalism’ in the education benefits is not a positive result from the equity standpoint. In a country like Bolivia with a high incidence of poverty, we would like to observe more “pro-poor” (higher progressivity in absolute terms) education spending. It is important to note that the lack of greater progressivity in education spending is not due to the distribution of benefits of tertiary education, but it is due to the exceptionally high share of spending on tertiary education in the total education budget. With a concentration coefficient of .30, spending on tertiary education is not particularly “pro rich.” The lion’s share of tertiary public education in Bolivia accrues to the “middle class” (between US$10 and US$50 PPP per day). Thus, the issue is more the fact that access to basic education among children in poor households is not universal. The low progressivity of education spending is explained by (1) the comparatively low progressivity of primary education (due to low coverage rates among the poor) and (2) an exceptionally high allocation of educational spending to tertiary education.
23
Contributory Pensions as Government Transfers
As noted at the beginning of this overview, contributory pensions have been treated in these studies as part of market income. However, contributory pension systems can have important redistributive effects for two reasons. First, very few contributory systems are purely contributory: most systems include public (tax-financed) subsidies, including universal government contributions, minimum pension guarantees for workers who have not achieved the required contribution density, or transitional financing of old pay-as-you-go pensions in the context of reforms towards fully financed systems. Secondly, even in the absence of such subsidies, all contributory pension systems inevitably entail redistributions among its pool of contributor-beneficiaries. For these reasons, the studies included a sensitivity analysis treating contributory pensions as direct transfers.
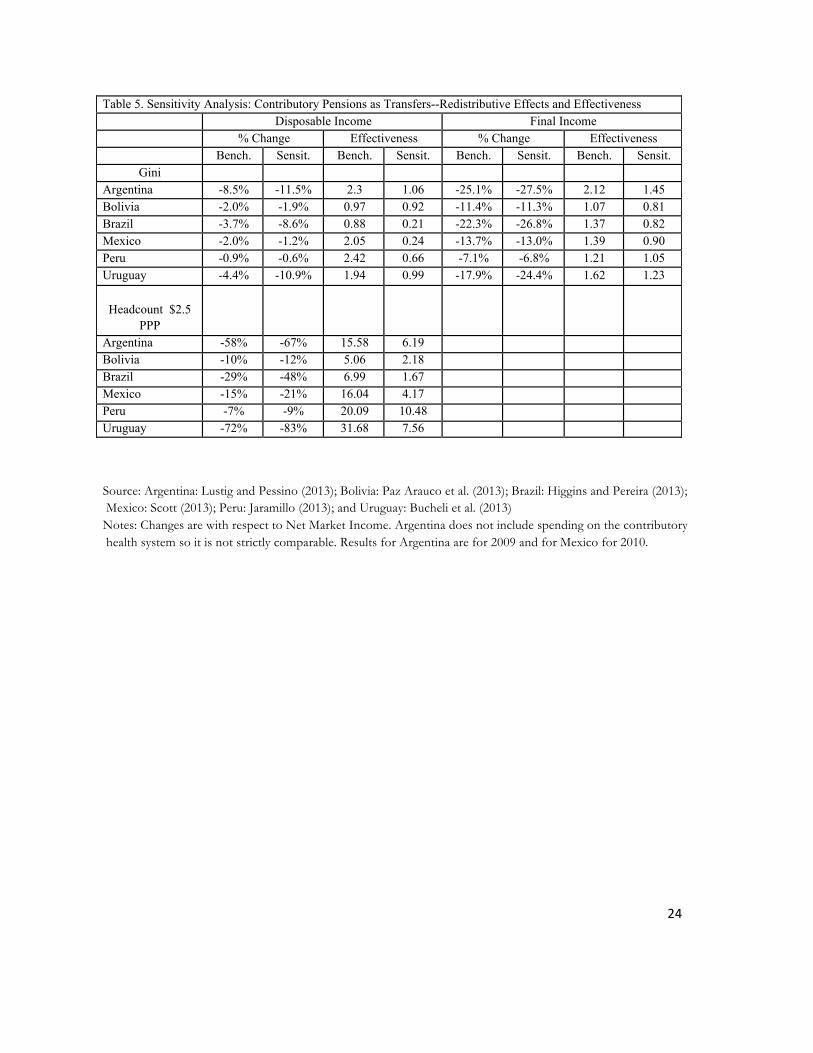
Considered as transfers, contributory pensions would represent massive expansions in social spending with respect to the benchmark scenario, from 81.4, 61.0 and 60.5 percent in Uruguay, Brazil and Argentina, respectively, to 29.6, 25.2 and 17.0 percent in Mexico, Bolivia and Peru, respectively (table 2). The distribution of these pensions (table 3) range widely from moderately progressive in absolute terms (Argentina, Uruguay), close to neutral in absolute terms (Brazil), only progressive in relative terms (Bolivia, Mexico), to regressive (Peru). Though treating pensions as transfers reduces the progressivity of total social spending in all countries except Argentina, social spending remains close to neutral in absolute terms in both scenarios. In the sensitivity analysis, disposable income and final income inequality (with respect to market income) is reduced by less in Bolivia, Mexico and Peru and is reduced by more in Argentina, Brazil and Uruguay. The poverty-reducing impact is increased in all countries, as expected. However, the effectiveness of both direct transfers and total social spending falls in all countries, dramatically so in the former case.
24
Source: Argentina: Lustig and Pessino (2013); Bolivia: Paz Arauco et al. (2013); Brazil: Higgins and Pereira (2013); Mexico: Scott (2013); Peru: Jaramillo (2013); and Uruguay: Bucheli et al. (2013) Notes: Changes are with respect to Net Market Income. Argentina does not include spending on the contributory health system so it is not strictly comparable. Results for Argentina are for 2009 and for Mexico for 2010.
Table 5. Sensitivity Analysis: Contributory Pensions as Transfers--Redistributive Effects and Effectiveness Disposable Income Final Income % Change Effectiveness % Change Effectiveness Bench. Sensit. Bench. Sensit. Bench. Sensit. Bench. Sensit.
Gini Argentina -8.5% -11.5% 2.3 1.06 -25.1% -27.5% 2.12 1.45 Bolivia -2.0% -1.9% 0.97 0.92 -11.4% -11.3% 1.07 0.81 Brazil -3.7% -8.6% 0.88 0.21 -22.3% -26.8% 1.37 0.82 Mexico -2.0% -1.2% 2.05 0.24 -13.7% -13.0% 1.39 0.90 Peru -0.9% -0.6% 2.42 0.66 -7.1% -6.8% 1.21 1.05 Uruguay -4.4% -10.9% 1.94 0.99 -17.9% -24.4% 1.62 1.23
Headcount $2.5
PPP
Argentina -58% -67% 15.58 6.19 Bolivia -10% -12% 5.06 2.18 Brazil -29% -48% 6.99 1.67 Mexico -15% -21% 16.04 4.17 Peru -7% -9% 20.09 10.48 Uruguay -72% -83% 31.68 7.56 !
25
Inequality and poverty are reduced the most in Argentina, Brazil and Uruguay. The comparatively benevolent redistributive picture of Argentina, Brazil and Uruguay (by Latin American standards), however, hides some unpleasant facts. In the case of Brazil and Uruguay, spending on tertiary education is clearly “pro-rich:” in Brazil 15.6 percent of the spending going to the 4.5 percent of the population with market incomes above US$50 PPP per day. The same is true for Uruguay: 14.5 percent of spending on tertiary education accrues to the 6.8 percent with market incomes above US$50 PPP per day. Thus, even though spending on tertiary education in Brazil and Uruguay is not unequalizing (it is slightly progressive in relative terms), a large chunk subsidizes the children of the rich. In the case of Argentina, total spending on education is unambiguously pro-poor; even spending on tertiary education is more progressive than in any of the other five countries. The problems with Argentina’s redistributive policies lie elsewhere: the allocation of nonsocial subsidies and fiscal sustainability. Government spending on indirect subsidies equaled 5.6 percent of GDP in 2009, over 50 percent more than what was spent on progressive cash transfers. These subsidies are primarily subsidies to agricultural producers, airlines, manufacturing, and transportation and energy. The first three are outright regressive (unequalizing) and their budget equaled 1.3 percent of GDP in 2009 (compared to 0.6 percent allocated to the Universal Family Allowance).
In addition, Argentina’s sharp rise in public spending during the 2000s has been increasingly financed by distortionary taxes and unorthodox revenue-raising mechanisms. Moreover, the export tax—a major source of revenue—is highly sensitive to commodity prices. All in all, this points to the fact that the Argentine government has embarked on a redistribution process that—to some extent—generates unfair losses (to the formal sector retirees) and may not be fiscally sustainable unless subsidies accruing to the nonsocial sectors are significantly curbed.
26
REFERENCES Birdsall, Nancy, Augusto de la Torre, and Rachel Menezes. 2008. Fair Growth. Washington,
D.C.: Center for Global Development and Inter-American Dialogue. Breceda, Karla, Jamele Rigolini, and Jaime Saavedra. 2008. Latin America and the Social
Contract: Patterns of Social Spending and Taxation. The World Bank Policy Research Working Paper, Washington, D.C.
Bucheli, Marisa, Nora Lustig, Máximo Rossi and Florencia Amábile. 2013. Social Spending, Taxes, and Income Redistribution in Uruguay. CEQ Working Paper No. 10, January.
Ferreira, Francisco H. G., and Martin Ravallion. 2008. Global Poverty and Inequality: a Review of the Evidence. The World Bank Policy Research Working Paper Washington, D.C.
Ferreira, Francisco H. G, Julian Messina, Jamele Rigolini, Luis F. Lopez-Calva, Maria Ana Lugo, and Renos Vakis. 2013. Economic Mobility and the Rise of Latin American Middle Class. The World Bank: Washington, D.C.
Goñi, Edwin, J. Humberto López, and Luis Servén. 2011. Fiscal Redistribution and Income Inequality in Latin America. World Development 39(9): 1558-1569.
Higgins, Sean and Claudiney Pereira. 2013. The Effects of Brazil’s High Taxation and Social Spending on the Distribution of Household Income. CEQ Working Paper No.7, January.
Immervoll, Herwig, Horacio Levy, José Ricardo Nogueira, Cathal O’Donoghue, and Rozane Bezerra de Siqueira. 2009. The Impact of Brazil’s Tax-Benefit System on Inequality and Poverty. In Poverty, Inequality, and Policy in Latin America, Stephan Klasen and Felicitas Nowak-Lehmann, eds., 271-301. Cambridge, MA: MIT Press.
Inter-American Development Bank. 2011. Social Strategy for Equity and Productivity. Latin America and the Caribbean. Washington, D.C.: IDB.
Jaramillo, Miguel. 2013. The Incidence of Social Spending and Taxes in Peru. CEQ Working Paper No. 9, January.
Kakwani, Nanak C. 1977. Measurement of Tax Progressivity: An International Comparison. The Economic Journal 87(345): 71-80.
Lambert, Peter. 2002. The Distribution and Redistribution of Income (3rd edition). Manchester, UK: University of Manchester Press.
Lindert, Kathy, Emmanuel Skoufias, and Joseph Shapiro. 2006. Redistributing Income to the Poor and Rich: Public Transfers in Latin America and the Caribbean. The World Bank Social Protection Discussion Paper, Washington, D.C.
27
Lopez-Calva, Luis F. and Eduardo Ortiz-Juarez. 2011. A Vulnerability Approach to the Definition of the Middle Class. Policy Research Working Paper 5902, The World Bank, December, Washington, D.C.
Lustig, Nora, George Gray Molina, Sean Higgins, Wilson Jimenez, Veronica Paz, Claudiney Pereira, Carola Pessino, John Scott, and Ernesto Yanez. 2012. The Impact of Taxes and Social Spending on Inequality and Poverty in Argentina, Bolivia, Brazil, Mexico and Peru: A Synthesis of Results. Tulane University Economics Department and CIPR Working Paper, New Orleans, LA.
Lustig, Nora and Sean Higgins. 2013. Commitment to Equity Assessment (CEQ): Estimating the Incidence of Social Spending, Subsidies and Taxes. Handbook, CEQ Working Paper No. 1, July 2011; revised January 2013. New Orleans, LA.
Lustig, Nora and Sean Higgins. 2012. Fiscal Mobility and the Poor: A New Approach. Tulane Economics Department Working Paper 1202, New Orleans, Louisiana, April.
Lustig, Nora, Luis F. Lopez-Calva and Eduardo Ortiz-Juarez. 2013. Declining Inequality in Latin America in the 2000s: The Cases of Argentina, Brazil, and Mexico, World Development, Vol. 44, pp. 129-141.
Lustig, Nora and Carola Pessino. 2013. Social Spending and Income Redistribution in Argentina in the 2000s: the Rising Role of Noncontributory Pensions. CEQ Working Paper No. 5, January.
Martinez-Vazquez, Jorge. 2008. The Impact of Budgets on the Poor: Tax and Expenditure Benefit Incidence Analysis, in Blanca Moreno-Dodson and Quentin Wodon, editors, Public Finance for Poverty Reduction Concepts and Case Studies from Africa and Latin America, Chapter 5. Washington, DC: World Bank.MDS (Ministério do Desenvolvimento Social e Combate à Fome). 2011. Relatorio de avaliação do plano plurianual, 2008-2011.
O’Donnell, Owen, Eddy van Doorslaer, Adam Wagstaff, and Magnus Lindelow. 2008. Analyzing Health Equity Using Household Survey Data: A Guide to Techniques and Their Implementation. Washington, D.C.: The World Bank.
Paz Arauco, Veronica, George Gray Molina, Wilson Jiménez Pozo, and Ernesto Yáñez Aguilar. 2013. Explaining Low Redistributive Impact in Bolivia. CEQ Working Paper No. 6, January. SAGI (Secretaria de Avaliação e Gestão da Informação), and MDS (Ministério do Desenvolvimento Social). 2012. Ferramento de visualização dos dados. http://aplicacoes.mds.gov.br/sagi/miv/miv.php.
Scott, John. 2011. Gasto Público y Desarrollo Humano en México: Análisis de Incidencia y Equidad. UNDP Working Paper for Informe sobre Desarrollo Humano México 2011, Mexico City, Mexico.
Scott, John. 2013. Redistributive Impact and Efficiency of Mexico’s Fiscal System. CEQ Working Paper No. 8.
Silveira, Fernando Gaiger, Jonathan Ferreira, Joana Mostafa, and José Aparecido Carlos
28
Ribeiro. 2011. Qual o Impacto da Tributação e dos Gastos Públicos Sociais na Distribuição de Renda do Brasil? Observando os Dois Lados da Moeda. In Progressividade da Tributação e Desoneração da Folha de Pagamentos Elementos para Reflexão, José Aparecido Carlos Ribeiro, Álvaro Luchiezi Jr., and Sérgio Eduardo Arbulu Mendonça, eds., 25-63, Brasilia: IPEA.
Wagstaff, Adam. 2012. Benefit-Incidence Analysis: Are Government Health Expenditures More Pro-Rich Than We Think? Health Economics 21: 351–366.
World Development Indicators, The World Bank. 2012. GNI per capita. http://data.worldbank.org/indicator/NY.GNP.PCAP.K
29
CEQ WORKING PAPER SERIES http://www.commitmentoequity.org “Commitment to Equity Assessment (CEQ): Estimating the Incidence of Social Spending, Subsidies
and Taxes. Handbook,” by Nora Lustig and Sean Higgins, CEQ Working Paper No. 1, July 2011; revised January 2013.
“Commitment to Equity: Diagnostic Questionnaire,” by Nora Lustig, CEQ Working Paper No. 2, 2010; revised August 2012.
“The Impact of Taxes and Social Spending on Inequality and Poverty in Argentina, Bolivia,Brazil, Mexico and Peru: A Synthesis of Results,” by Nora Lustig, George Gray Molina, Sean Higgins, Miguel Jaramillo, Wilson Jiménez, Veronica Paz, Claudiney Pereira, Carola Pessino, John Scott, and Ernesto Yañez, CEQ Working Paper No. 3, August 2012.
“Fiscal Incidence, Fiscal Mobility and the Poor: A New Approach,” by Nora Lustig and Sean Higgins, CEQ Working Paper No. 4, September 2012.
“Social Spending and Income Redistribution in Argentina in the 2000s: the Rising Role of Noncontributory Pensions,” by Nora Lustig and Carola Pessino, CEQ Working Paper No. 5, January 2013.
“Explaining Low Redistributive Impact in Bolivia,” by Verónica Paz Arauco, George Gray Molina, Wilson Jiménez Pozo, and Ernesto Yáñez Aguilar, CEQ Working Paper No. 6, January 2013.
“The Effects of Brazil’s High Taxation and Social Spending on the Distribution of Household Income,” by Sean Higgins and Claudiney Pereira, CEQ Working Paper No.7, January 2013.
“Redistributive Impact and Efficiency of Mexico’s Fiscal System,” by John Scott, CEQ Working Paper No. 8, January 2013.
“The Incidence of Social Spending and Taxes in Peru,” by Miguel Jaramillo Baanante, CEQ Working Paper No. 9, January 2013.
“Social Spending, Taxes, and Income Redistribution in Uruguay,” by Marisa Bucheli, Nora Lustig, Máximo Rossi and Florencia Amábile, CEQ Working Paper No. 10, January 2013.
“Social Spending, Taxes and Income Redistribution in Paraguay,” Sean Higgins, Nora Lustig, Julio Ramirez, Billy Swanson, CEQ Working Paper No. 11, February 2013.
“High Incomes and Personal Taxation in a Developing Economy: Colombia 1993-2010,” by Facundo Alvaredo and Juliana Londoño Vélez, CEQ Working Paper No. 12, March 2013.
“The Impact of Taxes and Social Spending on Inequality and Poverty in Argentina, Bolivia, Brazil, Mexico, Peru and Uruguay: An Overview,” Nora Lustig, Carola Pessino and John Scott, CEQ Working Paper No. 13, April 2013.
30
!
!
!
!
The CEQ logo is a stylized graphical representation of a Lorenz curve for a fairly unequal distribution of income (the bottom part of the C, below the diagonal) and a concentration curve for a very progressive transfer (the top part of the C).
What is CEQ?
Led by Nora Lustig (Tulane University) and Peter Hakim (Inter-American Dialogue), the Commitment to Equity (CEQ) project is designed to analyze the impact of taxes and social spending on inequality and poverty, and to provide a roadmap for governments, multilateral institutions, and nongovernmental organizations in their efforts to build more equitable societies. CEQ/Latin America is a joint project of the Inter-American Dialogue (IAD) and Tulane University’s Center for Inter-American Policy and Research (CIPR) and Department of Economics. The project has received financial support from the Canadian International Development Agency (CIDA), the Development Bank of Latin America (CAF), the General Electric Foundation, the Inter-American Development Bank (IADB), the International Fund for Agricultural Development (IFAD), the Norwegian Ministry of Foreign Affairs, the United Nations Development Programme’s Regional Bureau for Latin America and the Caribbean (UNDP/RBLAC), and the World Bank. http://commitmenttoequity.org
!