Embed Size (px)
Citation preview

The impact of stock recommendations given on Dutch television
Freek Haagh Bsc.
ANR 719238
September 30, 2011
Master Thesis in Finance
Department of Finance
Tilburg School of Economics and Management
Tilburg University
Supervisor: Dr. P.C. de Goeij

The impact of stock recommendations given on Dutch television
Master thesis Finance 2
Freek Haagh
Table of contents
Preface 3
Abstract 4
1. Introduction 5
2. Literature review and hypothesis devolopment 8
3. Methodology 12
3.1. Event study 12
3.2. Cross-sectional regression 14
3.3. Calendar-time portfolios 16
4. Data 21
5. Empirical results 23
5.1. Event study 23
5.2. Cross-sectional regression 28
5.3. Calendar-time portfolios 32
6. Conclusion 38
References 41

The impact of stock recommendations given on Dutch television
Master thesis Finance 3
Freek Haagh
Preface
This Master Thesis represents the final piece of my study Finance at Tilburg University. An
interesting Investment Analysis lecture of Dr. P.C. de Goeij triggered my attention for the topic
of this thesis. Working on this thesis was challenging, but it really improved my practical skills. I
finally understand what an effort it takes to create a proper empirical study. Having completed
this thesis I would especially like to thank Dr. P.C. de Goeij for his enthusiastic support and
useful feedback. Additionally, I would like to thank Dr. H.A. Degryse for taking the time to read
my thesis and his role as chairman in the exam committee. I also want to thank Jan Theeuwes
for checking my thesis on grammar and style. Moreover, I would like to thank my parents and
brother for encouraging and supporting me during my study at Tilburg University. And last, but
not least, I would like to thank my girlfriend Eline for her feedback and support during the
process.
September 2011,
Freek Haagh
The impact of stock recommendations given on Dutch television
Master thesis Finance 4
Freek Haagh
Abstract
The ability to generate profits from acting on stock recommendations made by financial
analysts has been discussed for decades. In this study it is shown that the recommendations
made on the Dutch TV-show “Business Class”, cause abnormal stock returns after the
announcement. These buy and sell recommendations show a consistent abnormal performance,
even after 96 trading days. Additionally the size of the abnormal returns on the announcement
date is explained in a cross-sectional regression. When all variables of influence are taken
together, the results show that only firm size and book-to-market value have a significant effect
on the abnormal announcement returns. Although the returns are abnormal in the long run,
investors are not able to earn money by using the “Business Class” recommendations. In the
last section, the “Business Class” recommendations are tested as a trading strategy using a
calendar-time regression model. When the excess returns are corrected for transaction costs,
this trading strategy is proven to be unfavorable.

The impact of stock recommendations given on Dutch television
Master thesis Finance 5
Freek Haagh
1. Introduction
In the last decade there has been an increase in available investment advice, mainly due to the
evolution and popularity of the new media. The enormous amount of available information
makes it challenging for investors to filter for the right investment advice. Therefore, many
investors tend to follow the advice from financial analysts, instead of doing their own research.
Note that according to the efficient market hypothesis (Fama, 1970) only news should have an
impact on security prices. Because analysts are interpreting only public information, one can
argue that this advice should not affect security prices. On the other hand, in the financial
markets huge amounts of money are spent by brokerage houses to gather information. This
costly information should be compensated by abnormal returns, to make the investment
profitable. This brain-twisting contradiction was the motivation for many authors to study the
influence of stock recommendations on asset prices.
In this research I try to find out if Dutch investors can earn money by using only public
information. I studied the recommendations of financial analysts made in a Dutch TV-show
called “Business Class”, to study if the Dutch stock market reacts efficiently to this particular
public information. According to Barber and Odean (2008) investors cannot profit: “Investors
who insist on hunting for the next brilliant stock would be well advised to remember what
California prospectors discovered ages ago: All that glitters is not gold!”. Engelberg et al. (2010)
use the attention hypothesis of Barber and Odean (2008) to investigate if Jim Cramer’s “Mad
Money” recommendations have an impact on asset prices. Because my study is comparable to
the research of Engelberg et al. (2010) the methodology of that paper is used as a guide to
write this thesis.
Although that paper is used as a guide, this thesis will be innovative in four ways. Firstly
“Business Class” is a weekly show that is broadcast on Sundays around 11:00 AM, while “Mad
Money” is a daily show that airs around 18:00 PM. For the calculation of the returns on the
announcement date Engelberg et al. (2010) use the overnight return to measure the reaction of
the stock prices. In my research the overnight returns are useless because “Business Class” is a
The impact of stock recommendations given on Dutch television
Master thesis Finance 6
Freek Haagh
weekly show broadcast on Sunday. To solve this discrepancy, one extra trading day is created
on a weekly basis. To measure the reaction to “Business Class” recommendations, the weekend
return is calculated. Because trading is not possible on weekends, the impact of the information
provided by the analysts can be measured better. Secondly my study is focused on the Dutch
stock market. Almost all recommendations made during “Business Class” are stocks with a
notation on the Dutch stock market, while “Mad Money” recommendations focus only on the
US stock markets. A focus on Dutch TV-show recommendations would be a great international
expansion on existing studies, since most prior studies focused mainly on the US market. Thirdly,
in “Mad Money” Jim Cramer is the only analyst responsible for all recommendations. In my
research five different financial analysts are responsible for the recommendations, which will
create a more diverse set of recommendations. The diversity in recommendations is also
increased by the diversity in the background of the analysts. Four out of the five financial
analysts on “Business Class” are professional asset managers. The other analyst is an individual
financial professional with a history in asset management, with a respected opinion concerning
the stock market. Finally “Business Class” is broadcast on national television at a moment that
almost everybody is at home and therefore able to watch television. An average “Mad Money”
show used in the Engelberg et al. (2010) paper is watched by approximately 0.18% of the
American people, while the average “Business Class” episode used in this research is watched
by 0.95% of the Dutch people. According Barber and Odean (2008) investors are attention-
driven. If stocks get more attention on average, a greater impact is expected according to the
attention hypothesis.
To find out if investors can earn money by using only the public information provided on
“Business Class”, this thesis is organized in three different parts. Every part investigates the
influence of the recommendations differently. Firstly an event study is conducted, to show
what pattern the cumulative average abnormal returns are following around the event date.
This study found evidence that the average recommendation on “Business Class” causes the
stock prices to react in an abnormal way. An abnormal stock price reaction after the
announcement is shown in the event study. After 96 days the average buy recommendation
The impact of stock recommendations given on Dutch television
Master thesis Finance 7
Freek Haagh
performs approximately 3% better than the market. While the average sell recommendation
performs 4.5% worse than the market. The biggest initial reaction is reported for the stocks
with the smallest market capitalization. The small cap stocks show the biggest outperformance
in the first few days. Secondly the size of the abnormal returns on the announcement date is
studied in a cross-sectional regression. The AEX, AMX and AScX dummies show that the stocks
with the smallest market capitalization have the biggest abnormal returns on the
announcement date. This effect is further clarified by the Size factor. Stocks with high book-to-
market equity ratios have higher abnormal returns on average. The Financial analyst dummy
has a positive coefficient, which indicates that if an independent financial analyst does the
recommendation instead of a professional asset manager, the abnormal weekend returns will
be higher. Attention is directly measured with the viewership data of “Business Class”. If there
is more attention towards the recommendations the abnormal returns are expected to be
higher. When the different analysts are compared in a regression, only Geert Schaaij has a
positive and significant influence on the abnormal returns. Finally this research investigates if
the recommendations contain any value-relevant information, by forming calendar-time
portfolios of these recommendations. To prove that a portfolio with a particular horizon is
profitable in the long run, the intercept of the time-varying regression should be significant and
positive for a given horizon. To construct a significant positive or negative intercept a portfolio
should act in an unexpected way compared to the market (Lubatkin and Rogers, 1989). By
studying the calendar-time portfolios I was able to show that a portfolio of recommended
stocks outperforms the market in the long run. This is shown by a positive and significant
Jensen’s alpha in the portfolios with a holding period of 144, 192 and 240 days. After correcting
for transaction costs, the significance of the alpha evaporates. This leads to the conclusion that
it is impossible for investors to use the “Business Class” recommendations as an arbitrage
opportunity. Due to the transaction costs the market outperformance of the recommendations
is wasted and an investment in the market portfolio would be preferred. So if the transaction
costs are taken into account, the market is considered to be efficient.
The impact of stock recommendations given on Dutch television
Master thesis Finance 8
Freek Haagh
2. Literature review and hypothesis development
Through various media, investors have access to an enormous amount of information. Why do
investors take some stocks into consideration and not others? Barber and Odean (2008) state:
“When there are many alternatives, options that attract attention are more likely to be
considered, hence more likely to be chosen, while options that do not attract attention are
often ignored.” There are different ways to attract the attention of investors. Different media
are discussed give to a clear review of the existing literature.
Womack (1996) reports that buy and sell recommendations of brokerage houses have an
impact on asset prices, immediately after the recommendation and in the following months.
The recommendations have a significant influence on assets prices, which compensate for the
information search costs of brokerage houses, both for sell and buy recommendations. Barber
et al. (2001) investigate if the publicly available recommendations of security analysts have
some influence on asset prices. Their dataset studied analyst consensus recommendations for
the period 1986 to 1996. Their findings show that buying the best rated stocks creates an
annual abnormal return of 4.30% compared to the value-weighted benchmark portfolio. The
least favorable consensus recommendations give an annual abnormal return of -8.72%
compared to the benchmark portfolio. Boni and Womack (2003) investigated a similar trading
strategy in the period between 1996 and 2001. They found that the abnormal returns are
significant and positive. But they almost disappear after correcting for transaction costs.
Contrary to Boni and Womack (2003), Bjerring et al. (1983) find significant and positive
abnormal returns in their 1979 to 1981 dataset, even after allowing for transaction costs. Their
study is based on the Canadian and US market.
Jaffe and Mahoney (1999) and Metrick (1999) made a report on the stock recommendations of
financial newsletters in the U.S. Both papers use the Hulbert Financial Digest database, which
records recommendations of financial newsletters since 1980. Both studies find consistent
evidence for short term abnormal returns. Although the short term returns are significant, both
studies conclude with the fact that the average recommendation does not provide valuable
information, because abnormal returns evaporate after a few months. Other studies

The impact of stock recommendations given on Dutch television
Master thesis Finance 9
Freek Haagh
investigated the abnormal returns around recommendations in newspapers or magazine
columns. Ferraro and Stanley (2000) conclude that analysts participating in the “Dartboard
Contest” of the Wall Street Journal did not beat the market. Mathur and Waheed (1995) find
significant abnormal returns around recommendations in the “inside Wall Street” column from
Business Week. Popular events are the recommendations in the “Heard on the Street” column
in the Wall Street Journal. Liu, Smith and Syed (1992) Jordan and Sarkar (2000) find significant
returns around the announcement date. Chan and Fong (1996) study the Hong Kong stock
market. They find abnormal returns around recommendations in the Honk Kong Economic
Journal. They show that the abnormal returns of the two days following the announcement
date are sufficient to cover transaction costs.
Besides the popularity of the internet, television still is a popular environment to search for
specific information. While the internet is growing in popularity, the influence of specific TV-
shows should definitely not be overlooked. Desai and Jain (1995) investigate the
recommendations at “Barron’s Annual Roundtable” and report a short term reaction. Ferreira
and Smith (2003) search for abnormal returns caused by “Wall $treet Week” recommendations.
They found significant evidence of significant outperformance in the long run. Neumann and
Kenny (2007), Keasler and McNeil (2008) and Engelberg et al. (2010) investigate the
recommendations made by Jim Cramer on his daily TV-show “Mad Money”. They all find a
short-term effect and a typical reversal pattern in the long run. This indicates that the
recommendations of Jim Cramer do not contain any new value relevant information.
Hypothesis 1A: the “Business Class” buy recommendations show positive cumulative average
abnormal returns around the announcement date.
Hypothesis 1B: the “Business Class” sell recommendations show negative cumulative average
abnormal returns around the announcement date.
Although almost all papers present short-term price reactions, most of them do not present any
long term outperformance results (Engelberg et al., 2010).

The impact of stock recommendations given on Dutch television
Master thesis Finance 10
Freek Haagh
Hypothesis 2: actively trading the “Business Class” recommendations is not a preferable trading
strategy.
Many different forms of media are used to study the impact of information on asset prices.
Although the sources of the recommendations differ a lot, the impact on asset prices is often
similar. The biggest initial reaction is reported for the stocks with the smallest market
capitalization (Neumann and Kenny, 2007; Keasler and McNeil, 2008; Engelberg et al., 2010).
This is supported by prior research of Stickel (1995), Womack (1996), Barber et al. (2001) and
Mikhail et al. (2004). All studies show that the abnormal returns after the recommendation of
smaller firms are larger than the abnormal returns associated with bigger firms. Barber et al.
(2001) give three reasons to investigate whether firms with different market capitalization
might give different abnormal weekend returns. Firstly, information concerning small
companies (for example buy or sell recommendations) is gathered and processed less
frequently compared to bigger stocks. This causes the influence of any information about these
stocks to increase. Secondly it is harder for individual investors to arbitrage away any excess
returns, due to the illiquidity of these smaller stocks (Pontiff, 1996 and Schleifer and Vishny,
1997). And finally, analysts’ recommendations have smaller influence on the excess returns of
the stocks of larger companies, due to the fact that they present a bigger portion of the
available investment opportunities.
Hypothesis 3: recommendations of stocks with a smaller market capitalization have a bigger
influence on stock prices.
The book-to-market ratio serves as another proxy for the amount of information available
about a particular stock. Value stocks (i.e. stocks with a high book-to-market ratio) are often
out of favor, in terms of the information environment (Barber et al., 2001), while glamour
stocks (i.e. stocks with a low book-to-market ratio) get the most attention from financial
analysts in general. This causes less information to be gathered and processed around value
stocks, so that a source of information concerning a value stock has a bigger impact compared

The impact of stock recommendations given on Dutch television
Master thesis Finance 11
Freek Haagh
to glamour stocks. For example in the paper of Kerl and Walter (2007), value stocks have a
positive cumulative abnormal return of 4.22% after 20 days while glamour stocks have a
negative cumulative abnormal return of -0.64% after 20 days, both due to a buy
recommendation. The markets for value stocks are more illiquid, because of a lack of stock
information. This also causes barriers for possible arbitrageurs (Schleifer and Vishny, 1997).
Arbitrageurs are not able to earn money from this systematic mispricing, because the costs of
arbitrage often exceed the benefits (Ali, Hwang, and Trombley, 2003).
Hypothesis 4: recommendations of stocks with a higher book-to-market value have a bigger
influence on stock prices.
Although Jim Cramer’s recommendations are not significant in the long run, the study of
Engelberg et al. (2010) uses an innovative measure of attention. Engelberg et al. (2010) use the
theory of Barber and Odean (2008) to explain the returns after the announcement date. Barber
and Odean (2008) show how individual investors solve the problem of searching the thousands
of stocks they can potentially buy. They show that the average investor is attention-driven to
solve the problem of overcapacity of information. Barber and Odean (2008) use three different
proxies for attention: stocks in the news, stocks with high abnormal trading volumes and stocks
with high one-day returns. Engelberg et al. (2010) come up with their own measure of attention
to explain the abnormal returns around the “Mad Money” recommendations. They use the
viewership of Jim Cramer’s “Mad Money” show as a direct measure of attention. Even though
they do not find any information in the recommendations, there is an initial reaction of asset
prices after the recommendations. This suggests that the initial reactions causes mispricing, and
a price reversal will follow in the weeks after the announcement date. In a cross-sectional
regression they conclude that attention is one of the variables that influence the initial price
shock positively.
Hypothesis 5: if stock recommendations catch more attention during the show, the initial stock
price reaction will be bigger.

The impact of stock recommendations given on Dutch television
Master thesis Finance 12
Freek Haagh
3. Methodology
Because this thesis contains three different tests, the methodology chapter will also be divided
into three parts. The first part will contain the methodology of the event study, to find out what
pattern the cumulative average abnormal returns follow. The second part will be a cross-
sectional regression to define the variables that influence the weekend return. The third part
will be a calendar-time portfolio regression, to measure if investors can profit from actively
trading the “Business Class” recommendations.
3.1. Event study
Traditional event studies look at an event that takes place when the stock market is opened.
“Business Class” is broadcast on Sunday morning, when the market is closed of course. The
show airs at 11:00 a.m. and has a replay Sunday evening around midnight. It is hard to set an
event day in a closed market because there are no real returns during the weekend. To
overcome this problem, I include a weekend trade, which implies six trading days a week. This
extra trading day gives the return over the weekend and is established as follows:
So in this research every week has 6 trading days instead of 5 and the event date takes place in
the weekends (on the sixth trading day). The return on Monday is then calculated as follows:
The returns during the rest of the trading days are calculated in the normal way:
To examine how the market reacts to stock recommendations in the “Business Class” TV-show,
this paper analyzes abnormal announcement day returns. Abnormal returns are calculated as
follows:

The impact of stock recommendations given on Dutch television
Master thesis Finance 13
Freek Haagh
In this thesis the abnormal returns are estimated using the market return of a particular stock
as a benchmark. This benchmark has the advantage that the market-wide stock price
movements are incorporated. The normal return is defined as the return of the market index in
which stock i is listed. On the Dutch stock market, stocks can have a notation on the AEX, AMX
or AScX index. The resulting abnormal returns are referred to as market adjusted returns. So
the abnormal returns in this thesis are calculated as follows:
The event period is from days -11 to 96. The event period starts at day -11 because this allows
any reaction in advance of the show to be studied. This would mean that there is some
information leaking and that investors are trying to profit from it.
To find out if there is an average effect on a specific day in the event period, the average
abnormal return (AAR) is calculated as follows:
The cumulative average abnormal return (CAAR) for the entire event study is calculated as
follows:
To test if the average abnormal returns are significant on a specific day in the event period, the
AARs are tested using the following t-test:
≈ (0, 1)

The impact of stock recommendations given on Dutch television
Master thesis Finance 14
Freek Haagh
Where:
If the assumption is made that the abnormal returns are independent and have the same mean
and variance, it can be shown that in case of a large N (N > 30) the abnormal returns follow a
standard normal distribution (De Jong and De Goeij (2010)).To test if the cumulative average
abnormal returns are significant on a specific interval in the event period, the CAARs are used
to test Hypothesis 1A and 1B. The CAARs are tested using the following formula:
≈ (0, 1)
Where:
3.2. Cross-sectional regression
In the first part of the methodology chapter the event study is described. This research studied
if “Business Class” recommendations could cause significant cumulative average abnormal
returns in different intervals. The weekend return (t = 0) is the most interesting interval,
because it captures the returns on the announcement date. By investigating the announcement
date returns in a cross-sectional regression, the regression results show what variables
influence the weekend returns. The cross-sectional regression gives a clear picture of which
independent variables influence the dependent variable (weekend return). This regression
model is used to test Hypothesis 3, 4 and 5. For the cross-sectional regression a standard
regression model is used.

The impact of stock recommendations given on Dutch television
Master thesis Finance 15
Freek Haagh
Where:
The following independent variables are used in different models to explain the abnormal
weekend returns.
AEX dummy = a dummy variable which is 1 if stock i has a notation on the AEX and 0
otherwise.
AMX dummy = a dummy variable which is 1 if stock i has a notation on the AMX and 0
otherwise.
AScX dummy = a dummy variable which is 1 if stock i has a notation on the AScX and 0
otherwise.
Size = the logarithmic market capitalization (price * number of shares) of stock i.
Book-to-market = the book-to-market value of stock i.
Financial analyst dummy = a dummy variable which is 1 if the recommendation of stock i
is done by an independent financial analyst and 0 if the recommendation is done by an
asset manager of a particular firm.
Viewership = the logarithmic amount of viewers on a particular show in which stock i is
recommended.
Viewership replay = the logarithmic amount of viewers on a particular replay if the show
in which stock i is recommended.
Schaaij dummy = a dummy variable which is 1 if the recommendation of stock i is done
by financial analyst Geert Schaaij and 0 if the recommendation is done by any other
financial analyst.

The impact of stock recommendations given on Dutch television
Master thesis Finance 16
Freek Haagh
Vermeulen dummy = a dummy variable which is 1 if the recommendation of stock i is
done by financial analyst Han Vermeulen and 0 if the recommendation is done by any
other financial analyst.
Langelaar dummy = a dummy variable which is 1 if the recommendation of stock i is
done by financial analyst Jerry Langelaar and 0 if the recommendation is done by any
other financial analyst.
Hafkamp dummy = a dummy variable which is 1 if the recommendation of stock i is
done by financial analyst Martine Hafkamp and 0 if the recommendation is done by any
other financial analyst.
Wierda dummy = a dummy variable which is 1 if the recommendation of stock i is done
by financial analyst Edwin Wierda and 0 if the recommendation is done by any other
financial analyst.
3.3. Calendar-time portfolios
In this part of the study 5 different calendar-time portfolios are created, each with a different
horizon of time. By using different horizons a clear picture is created how the returns behave,
while the horizon extends. I have created daily calendar-time portfolios going long on the buy
recommendations made in “Business Class”. The different portfolios hold the stocks for 48, 96,
144, 192 and 240 trading days respectively. These horizons may seem odd or random, but in
this research one week has 6 trading days as mentioned before. So the stocks are held for
exactly 8, 16, 24, 32 and 40 weeks.
To calculate the returns of each portfolio, the returns of the stocks are equally weighted. If the
“Business Class” recommendations contain informational value which is not captured by the
market before the event date, significant and positive excess returns are expected. Excess
returns are the returns of the portfolio minus the return on the risk-free investment. Firstly the
excess returns of the portfolio are regressed against the excess market returns. The market
returns are value weighted. The Dutch stock market has three different stock indices, called the

The impact of stock recommendations given on Dutch television
Master thesis Finance 17
Freek Haagh
AEX (big cap), AMX (mid cap) and AScX (small cap). I have summed up the market capitalization
of the three indices on a daily basis and gave each index a weight relative to the market
capitalization of the summed-up indices. These market weights are multiplied by the returns of
the different stock markets. This creates a value-weighted market return on a daily basis. The
daily risk free rate is subtracted from the value-weighted market return to calculate the daily
value-weighted excess market returns.
To prove that a portfolio with a particular horizon is profitable in the long run, the intercept of
the regression should be significant and positive. The intercept of the regression is called the
alpha (Jensen (1968)). Jensen’s alpha represents the ability of firms to perform better (or worse)
than the market portfolio with exactly the same market risk. It measures the extent to which a
portfolio is able to surprise the market in the long run. The alpha can be used to test hypothesis
2. In this research the excess returns of the portfolio are regressed on the excess market
returns, in the following formula the alpha is the intercept of the regression.
Where:
This model is often referred to as the Capital Asset Pricing Model (CAPM) model. The CAPM
model states that the expected excess market returns are explained by a portfolio’s sensitivity
to the excess returns on value-weighted market portfolio (Fama and French, 1993).

The impact of stock recommendations given on Dutch television
Master thesis Finance 18
Freek Haagh
Secondly the excess returns of the portfolio are regressed against a four factor model. Keasler
and McNeil (2008) and Engelberg et al. (2010) effectively use a four factor Jensen measure to
determine the alpha more accurately. The first factor remains the portfolio’s sensitivity against
the excess returns of the value-weighted market portfolio. The second and the third factor are
added to the CAPM model by Fama and French (1993). In their research they prove that a lot of
the variation in the portfolios’ excess returns is unrelated to the market beta. The following
factors will extend the standard CAPM model.
The second factor is the difference between the performance of a portfolio of small stocks and
a portfolio of large stocks (small minus big, SMB). On the 1st of July of each year all stocks that
are traded on the three main Dutch stock markets (AEX, AMX and AScX) are divided into two
groups, based on their market capitalization. The first group contains the firms with the 50
percent biggest market capitalization. The second group contains the firms with the 50 percent
smallest market capitalization. The difference between the average return of these two groups
forms the SMB-factor. The SMB-factor explains the size effect and was first documented by
Banz (1981). When stocks are sorted on their market capitalization, smaller stocks have higher
returns than the CAPM model predicts on average. The SMB-factor is added to the CAPM
model by Fama and French to capture this higher average return in the model.
The third factor is due to the book-to-market effect. Stocks with high book-to-market equity
ratios have higher returns on average. These higher returns are not captured by the market
beta and that is why I follow Fama and French (1993) in the construction of the portfolios. The
book-to-market factor is the difference between the return on a portfolio with high book-to-
market ratios and a portfolio of stocks with low book-to-market ratios (high minus low, HML).
The returns of a portfolio of stocks with the 30% lowest book-to-market ratios are subtracted
from the returns of a portfolio with the highest 30% book-to-market ratios. This subtraction
forms the book-to-market factor, HML. On the 1st of July of each year all stocks that are traded
on the three main Dutch stock markets (AEX, AMX and AScX) are relocated to a book-to-market
group.
The impact of stock recommendations given on Dutch television
Master thesis Finance 19
Freek Haagh
The fourth factor is the momentum effect. Several researchers found evidence of over- and
under-reaction to new information. Stocks with a positive earnings surprise as well as stocks
with high past returns, tend to outperform stocks with negative earnings surprise and poor past
returns (Barberis, Schleifer and Vishny (1998)). The momentum effect causes variation in the
portfolio’s returns which is not captured by any of the other factors. Engelberg et al. (2010) use
the momentum effect in their research to explain variation in portfolio excess returns. Although
their paper is focused on the American market, this study will also use the momentum effect as
an explanatory variable. Rouwenhorst (1997) found evidence of the momentum effect in 12
European countries. The European evidence is remarkably similar to the American evidence of
Jegadeesh and Titman (1997), therefore the momentum factor for the Dutch market is included
as well. To determine the momentum effect, the returns of a portfolio of low momentum
stocks is subtracted from the returns of a portfolio with high momentum stocks. In this
research momentum is interpreted as the performance of a particular stock over the past 6
months. If a stock has performed well over the past 6 months relative to others it has a high
momentum. The returns of a portfolio of stocks with the 30% lowest momentum are
subtracted from the returns of a portfolio with the highest 30% momentum to form the
momentum factor. These momentum portfolios are reallocated every first trading day of the
month, so they are formed on a monthly basis.
All four factors are calculated on a daily basis. When the four factors are combined, the excess
returns of the portfolio are regressed on the excess market returns, the SMB factor, the HML
factor and the Momentum factor. In the following formula the alpha is the intercept of the
regression.

The impact of stock recommendations given on Dutch television
Master thesis Finance 20
Freek Haagh
Where:
In the last calendar-time regression, the portfolios excess returns are regressed against the
standard CAPM model and the four factor model with a correction on the returns for
transaction costs. The transaction costs are estimated based on the transaction costs of Binck
Bank. Binck Bank is a well known Dutch online broker, which is used by many individual
investors. If the assumption is made that every stock is bought for 1000 euro, the transaction
costs will be 10 euro for every transaction1. The portfolios returns are corrected for these
transaction costs. So the transaction costs will be exactly 1% of the amount invested.
1 http://www.binck.nl/lage_tarieven/tarieven shows the transaction costs of Binck Bank
The impact of stock recommendations given on Dutch television
Master thesis Finance 21
Freek Haagh
4. Data
“Business Class” is a popular weekly Dutch business show, which airs every Sunday morning at
11:00 AM and the same show is broadcast again around 24:00 PM. Different business subjects
are discussed with presenter Harry Mens. In one weekly part of the show the current financial
market is discussed with different financial experts. During most of the episodes the financial
analysts provide stock recommendations. Many analysts are participating on a regular basis, for
example once every month. The conversation with the analysts often begins with a general look
on the economy and after the financial market is discussed, the analysts give some specific buy
and sell recommendations. The sample period of this study starts on the 5th of September 2004
till the 26th of December 2010. After a careful study I found 427 buy recommendations and 104
sell recommendations of common Dutch shares. The returns for this study are calculated using
the opening prices and closing prices from Thomson DataStream (PO and P). To calculate the
returns in the event study the opening en closing prices surrounding all recommendations are
used. The opening and closing prices of the different indices (AEX/ AMX/ AScX) are used to
calculate the normal returns. The normal returns are not value weighted, but the abnormal
return of every recommendation is calculated using the normal return of the index stock i is
listed on.
In the cross-sectional regression, the abnormal weekend returns are regressed against different
independent variables. The AEX2, AMX3 and AScX4 dummies are created using the website of
Euronext, which provides the compositions of all indices since they were founded. The size
(market capitalization) and book-to-market value of each stock at the moment of a particular
recommendation are downloaded from DataStream. The viewership information in this study is
obtained via “RTL Nederland”, the network agency that broadcasts “Business Class”.
In the calendar-time portfolios the excess returns of the portfolios are used as dependent
variable. Excess returns are the returns of the portfolio minus the return on the risk-free
2 http://www.euronext.com/fic/000/046/685/466857.pdf provides the composition of the AEX index.
3 http://www.euronext.com/fic/000/046/685/466858.pdf provides the composition of the AMX index.
4 http://www.euronext.com/fic/000/046/686/466860.pdf provides the composition of the AScX index.

The impact of stock recommendations given on Dutch television
Master thesis Finance 22
Freek Haagh
investment. To define the risk-free rate, the yearly return on a 1 month Dutch government
bond is taken from DataStream. This time-varying daily return is divided by 312, because in this
research there are 6 trading days a week (6 * 52 = 312). The excess portfolio returns are
regressed against the excess market returns. The excess market returns are the value-weighted
market returns (Downloaded from DataStream) minus the return on the risk-free investment. In
the second part of the calendar-time portfolio chapter, the excess portfolios returns are
regressed against the four factor model. The market capitalization, book-to-market values and
the momentum returns are all downloaded from Thomson DataStream to establish portfolios
for these different factors. After the factor portfolios are formed, the returns of these different
portfolios are calculated. The daily returns of these factor portfolios are used in a regression
against the daily excess portfolio returns.

The impact of stock recommendations given on Dutch television
Master thesis Finance 23
Freek Haagh
5. Empirical results
First the empirical results of the event study are presented followed by the results of the cross-
sectional regression. Finally the results of the calendar-time portfolios will be presented.
5.1. Event study
In this part the results of the event study will be presented. The event study will show what
pattern of abnormal returns the average recommendation follows. Neumann and Kenny (2007),
Keasler and McNeal (2008) and Engelberg et al. (2010) all found a typical spike pattern in the
first weeks of the interval of their event study. In the months following these first few weeks,
the CAARs reversed to almost zero. All papers conclude that there is no informational value
enclosed in the “Mad Money” recommendations.
Figure 1: CAAR of buy and sell recommendations
As presented in Figure 1, especially the CAAR of the buy recommendations does not follow a
particular spike and reversal pattern. In the first week after the event, the CAAR reaches a level
of 3% and stays there even after 96 trading days. The significant CAAR of 3% after 96 days
means that, these recommendations actually carry informational value. The returns presented
-6,00%
-5,00%
-4,00%
-3,00%
-2,00%
-1,00%
0,00%
1,00%
2,00%
3,00%
4,00%
5,00%
-11 -5 1 7 13 19 25 31 37 43 49 55 61 67 73 79 85 91CA
AR
Days
CAAR buy recommendations
CAAR sell recommendations

The impact of stock recommendations given on Dutch television
Master thesis Finance 24
Freek Haagh
in Figure 1 are abnormal returns relative to the market. Market news presented around the
announcement day might influence stock returns, but abnormal returns are compensated for
market news by subtracting the normal returns. In other words, the positive average abnormal
returns observed are not driven by positive market news released shortly after the show. The
pattern of the sell recommendations has an initial spike in the wrong direction. In the long run
there is really value attached to the sell recommendations, because the average sell
recommendation has a negative and significant return after 96 trading days, as can be seen in
Table 1.
Table 1: AAR’s and CAAR’s tested
Buy recommendations Sell recommendations
Day AAR T-test AAR CAAR [-11, ]
T-test CAAR
AAR T-test AAR CAAR [-11, ]
T-test CAAR
-11 -0.02% -0.287 -0.02% -0.287 0.00% 0.028 0.00% 0.028
-6 0.10% 1.746 0.10% 2.124 0.20% 1.439 0.50% 2.403
-5 0.01% 0.124 0.11% 2.704 0.28% 1.087 0.78% 2.729
-4 0.33% 2.599 0.44% 2.172 0.60% 1.224 1.38% 2.665
-3 0.22% 1.798 0.66% 2.265 -0.58% -2.109 0.80% 3.179
-2 0.41% 3.092 1.07% 2.323 -0.77% -1.971 0.03% 3.062
-1 0.33% 2.825 1.41% 2.513 -0.28% -1.046 -0.25% 2.616
0 0.68% 6.178 2.09% 2.606 -0.16% -1.905 -0.41% 2.123
1 0.13% 1.071 2.21% 2.879 -0.06% -0.339 -0.47% 1.703
2 0.24% 2.204 2.45% 3.165 0.17% 0.519 -0.30% 1.489
3 0.13% 1.468 2.59% 3.470 -0.49% -2.402 -0.79% 0.979
4 0.03% 0.303 2.62% 3.793 0.00% -0.001 -0.79% 0.577
5 0.21% 1.644 2.83% 4.102 0.13% 0.753 -0.65% 0.293
6 0.26% 4.542 3.09% 4.389 0.13% 1.186 -0.53% 0.082
12 0.26% 1.600 3.29% 6.323 0.13% 0.965 -0.76% -1.442
24 0.06% 1.572 3.48% 10.199 -0.65% 1.509 -0.65% -2.940
48 -0.01% -0.261 3.64% 17.719 0.14% 0.600 -2.84% -6.797
72 0.02% 0.297 3.11% 25.431 0.02% 0.209 -3.31% -10.779
96 0.03% 0.470 3.05% 33.085 0.28% 2.199 -4.39% -13.572
In Table 1 the significance of the average abnormal returns is tested in the following way:
where AAR is the average
abnormal return on time t and S is the estimator for the standard deviation of the abnormal returns on time t. The significance of cumulative
abnormal returns is tested with the following formula:
where CAAR is the cumulative average abnormal return and S is the
estimator for the standard deviation of the cumulative average abnormal returns on time t (based on the event study methodology of De Jong
and De Goeij (2010)).The assumption is made that the abnormal returns follow a standard normal distribution.

The impact of stock recommendations given on Dutch television
Master thesis Finance 25
Freek Haagh
As shown in Table 1, the CAARs of the buy recommendations show the results expected. Even
after 96 trading days there is a significant CAAR of 3.05%. The CAARs of the sell
recommendations show a more unexpected pattern. Two weeks after the announcement date,
the CAARs of the sell recommendations get significant in the expected direction. It is interesting
to see that the CAARs of the sell recommendations are really low after 96 days.
Engelberg et al. (2010) compare the quintile of highest overnight return with the total set of
recommendations. This gives the most dramatic evidence of mispricing, which is shown by a
high initial spike in the CAARs and the quick reversal of these CAARs. Because the event in this
study takes place in the weekend, the overnight return cannot be used. Instead of the overnight
return, I will use the weekend return to calculate the initial reaction to the “Business Class”
recommendations. The top quintile abnormal weekend returns are compared with the entire
sample of abnormal weekend returns. In this study the top quintile of abnormal weekend
returns shows a clear spike pattern, but the CAARs stay stable for the entire sample period. The
top quintile is more volatile, but this is mainly due to the fact that there are fewer observations.
For this part of the study only buy recommendations are used, due to the absence of enough
sell recommendations to test them properly.
Figure 2: CAAR top quintile vs. total dataset
-2,00%
-1,00%
0,00%
1,00%
2,00%
3,00%
4,00%
5,00%
6,00%
7,00%
8,00%
-11 -5 1 7 13 19 25 31 37 43 49 55 61 67 73 79 85 91
CA
AR
Days
CAAR total
CAAR top weekend return
The impact of stock recommendations given on Dutch television
Master thesis Finance 26
Freek Haagh
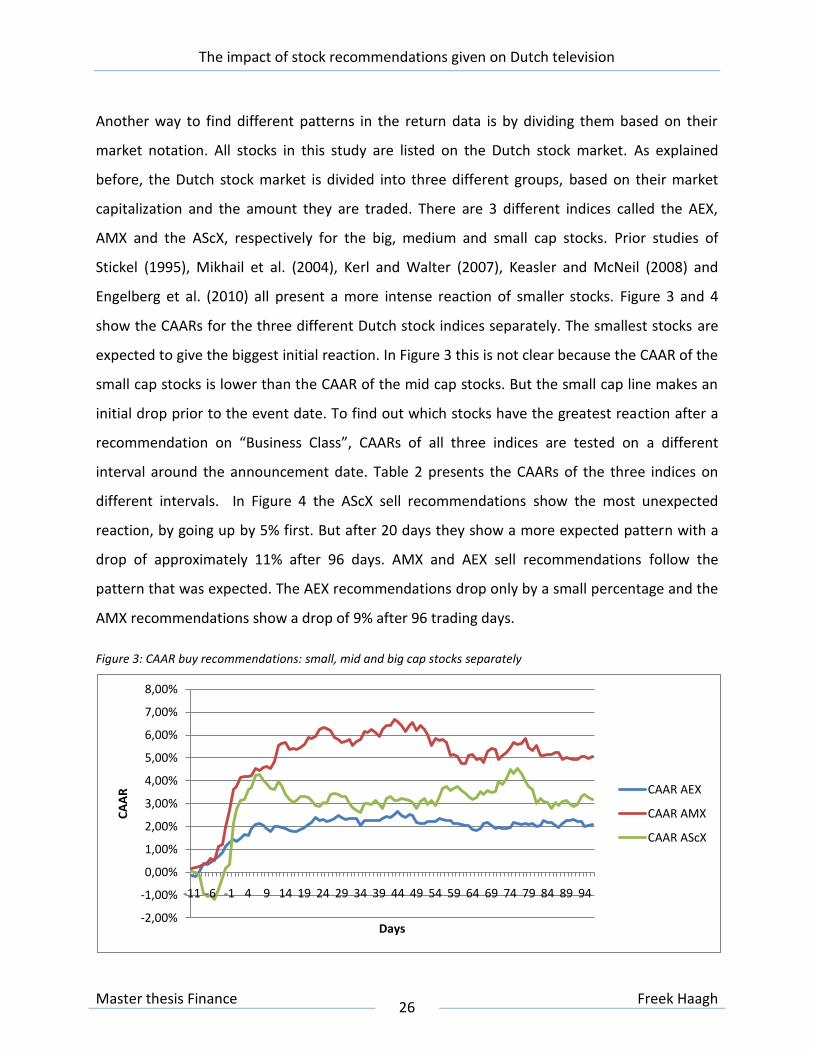
Another way to find different patterns in the return data is by dividing them based on their
market notation. All stocks in this study are listed on the Dutch stock market. As explained
before, the Dutch stock market is divided into three different groups, based on their market
capitalization and the amount they are traded. There are 3 different indices called the AEX,
AMX and the AScX, respectively for the big, medium and small cap stocks. Prior studies of
Stickel (1995), Mikhail et al. (2004), Kerl and Walter (2007), Keasler and McNeil (2008) and
Engelberg et al. (2010) all present a more intense reaction of smaller stocks. Figure 3 and 4
show the CAARs for the three different Dutch stock indices separately. The smallest stocks are
expected to give the biggest initial reaction. In Figure 3 this is not clear because the CAAR of the
small cap stocks is lower than the CAAR of the mid cap stocks. But the small cap line makes an
initial drop prior to the event date. To find out which stocks have the greatest reaction after a
recommendation on “Business Class”, CAARs of all three indices are tested on a different
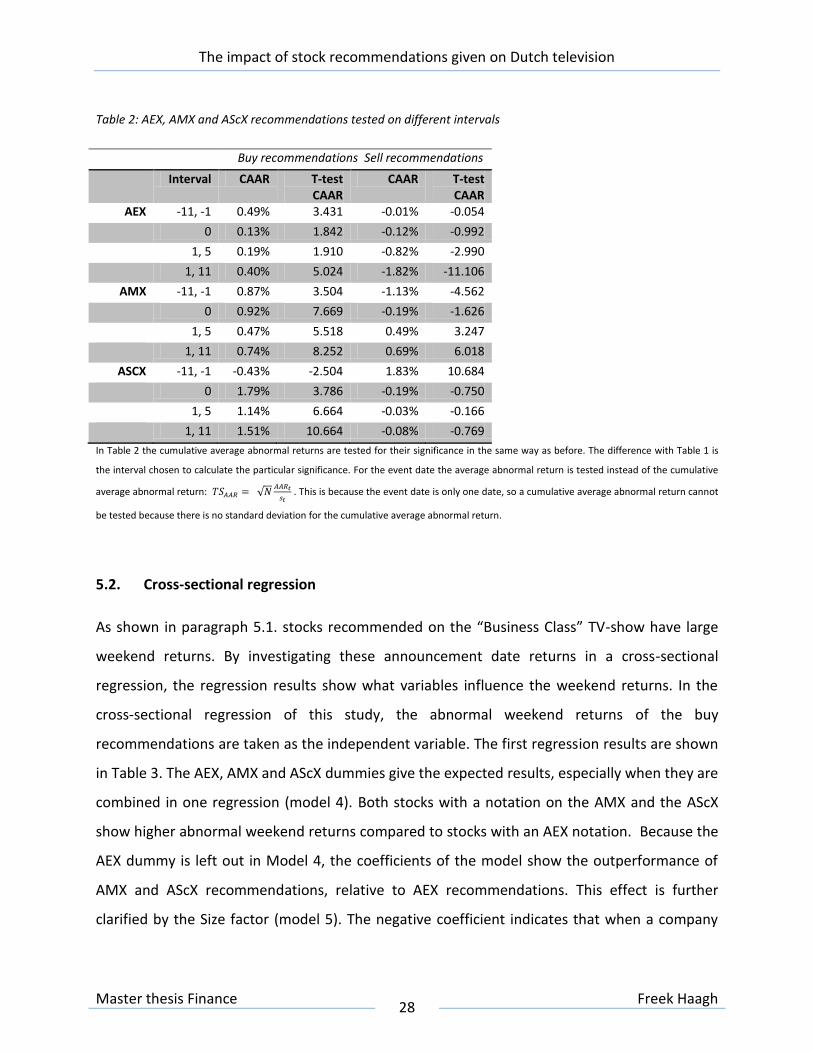
interval around the announcement date. Table 2 presents the CAARs of the three indices on
different intervals. In Figure 4 the AScX sell recommendations show the most unexpected
reaction, by going up by 5% first. But after 20 days they show a more expected pattern with a
drop of approximately 11% after 96 days. AMX and AEX sell recommendations follow the
pattern that was expected. The AEX recommendations drop only by a small percentage and the
AMX recommendations show a drop of 9% after 96 trading days.
Figure 3: CAAR buy recommendations: small, mid and big cap stocks separately
-2,00%
-1,00%
0,00%
1,00%
2,00%
3,00%
4,00%
5,00%
6,00%
7,00%
8,00%
-11 -6 -1 4 9 14 19 24 29 34 39 44 49 54 59 64 69 74 79 84 89 94
CA
AR
Days
CAAR AEX
CAAR AMX
CAAR AScX

The impact of stock recommendations given on Dutch television
Master thesis Finance 27
Freek Haagh
Figure 4: CAAR sell recommendations: small, mid and big cap stocks separately
Table 2 presents different intervals of cumulative average abnormal returns. The interval -11 to
-1 represents the time before the show is broadcast on television and made public to the
audience. The second interval represents the announcement day return. And the interval 1 to 5
and 1 to 11 represent the reaction right after the announcement. Especially the buy
recommendations show the expected reaction, with an exception for the first interval of the
AScX buy recommendations where an initial negative return is shown (also shown in Figure 3).
Table 5 shows perfectly that the buy recommendations of the smallest stock have the biggest
reaction on asset prices. The findings on the sell recommendations side of Table 1 and 2
support the findings in Figure 4.
-10,00%
-8,00%
-6,00%
-4,00%
-2,00%
0,00%
2,00%
4,00%
6,00%
-11 -6 -1 4 9 14 19 24 29 34 39 44 49 54 59 64 69 74 79 84 89 94
CA
AR
Days
CAAR AEX
CAAR AMX
CAAR AScX
The impact of stock recommendations given on Dutch television
Master thesis Finance 28
Freek Haagh
Table 2: AEX, AMX and AScX recommendations tested on different intervals
Buy recommendations Sell recommendations
Interval CAAR T-test CAAR
CAAR T-test CAAR
AEX -11, -1 0.49% 3.431 -0.01% -0.054
0 0.13% 1.842 -0.12% -0.992
1, 5 0.19% 1.910 -0.82% -2.990
1, 11 0.40% 5.024 -1.82% -11.106
AMX -11, -1 0.87% 3.504 -1.13% -4.562
0 0.92% 7.669 -0.19% -1.626
1, 5 0.47% 5.518 0.49% 3.247
1, 11 0.74% 8.252 0.69% 6.018
ASCX -11, -1 -0.43% -2.504 1.83% 10.684
0 1.79% 3.786 -0.19% -0.750
1, 5 1.14% 6.664 -0.03% -0.166
1, 11 1.51% 10.664 -0.08% -0.769
In Table 2 the cumulative average abnormal returns are tested for their significance in the same way as before. The difference with Table 1 is
the interval chosen to calculate the particular significance. For the event date the average abnormal return is tested instead of the cumulative
average abnormal return:
. This is because the event date is only one date, so a cumulative average abnormal return cannot
be tested because there is no standard deviation for the cumulative average abnormal return.
5.2. Cross-sectional regression
As shown in paragraph 5.1. stocks recommended on the “Business Class” TV-show have large
weekend returns. By investigating these announcement date returns in a cross-sectional
regression, the regression results show what variables influence the weekend returns. In the
cross-sectional regression of this study, the abnormal weekend returns of the buy
recommendations are taken as the independent variable. The first regression results are shown
in Table 3. The AEX, AMX and AScX dummies give the expected results, especially when they are
combined in one regression (model 4). Both stocks with a notation on the AMX and the AScX
show higher abnormal weekend returns compared to stocks with an AEX notation. Because the
AEX dummy is left out in Model 4, the coefficients of the model show the outperformance of
AMX and AScX recommendations, relative to AEX recommendations. This effect is further
clarified by the Size factor (model 5). The negative coefficient indicates that when a company
The impact of stock recommendations given on Dutch television
Master thesis Finance 29
Freek Haagh
has a bigger market capitalization, the expected weekend return is smaller. The book-to-market
regression coefficient shows the exact expected result. Stocks with high book-to-market equity
ratios have higher returns on average (Kerl and Walter (2007)). The Financial analyst dummy
has a positive coefficient, which indicates that if an independent financial analyst does the
recommendation instead of a professional asset manager, the abnormal weekend returns will
be higher. This can be caused by the fact that asset managers are not able to reveal all their
analysis, because their customers are paying a great amount of money for the professional
asset management. While on the other hand, independent analysts can reveal all their
information, because there are no other stakeholders involved. If the viewers of “Business Class”
are the noise traders as proposed by Barber and Odean (2008), a positive relationship is
expected between the actual amount of viewers during a particular recommendation and the
abnormal weekend returns. This is exactly found, the Viewership coefficient is significant and
positive, which indicates this positive relationship. The viewership of the replay as a direct
measure of attention has no significance at all.

The impact of stock recommendations given on Dutch television
Master thesis Finance 30
Freek Haagh
Table 3: Regression results
In Table 3 abnormal weekend returns are regressed against different factors using the following linear regression model:
. In model 4 the AEX dummy is dropped to compare the AEX recommendations with the recommendations of the other
indices.
In “Business Class” five different analysts are responsible for the recommendations during my
sample. Until now, I have shown that the recommendations of all analysts together do perform
better than the market on average. However, just as in the study of Desai and Jane (1995),
there might be a few analysts with superior skills. As shown in Table 4 some analysts show
significant positive results, while other show significant negative results. When all analyst-
dummies are taken together, especially Geert Schaaij has the most influence on asset prices. In
the results of Model 17 it is shown that Geert Schaaij performs significantly better than most of
his fellow analysts. Only Edwin Wierda has not performed significantly different from Geert
Schaaij.
Dependent variable: abnormal weekend return
Model 1 2 3 4 5 6 7 8 9 10
AEX dummy -1.120
[0.213]
AMX dummy 0.001 0.538**
[0.244] [0.243]
AScX dummy 1.769*** 1.958***
[0.117] [0.275]
Size -0.786***
[0.129]
Book-to-Market 0.576***
[0.149]
Financial analyst dummy
0.960***
[0.218]
Viewership 1.437** 1.423**
[0.721] [0.723]
Viewership replay -0.299 -0.240
[0.595] [0.594]
intercept 1.261 0.678*** 0.331*** 0.141 5.736*** 0.249 0.281** -6.631* 2.019 -5.480
[0.154] [0.130] [0.263] [0.144] [0.837] [0.155] [0.141] [3.668] [2.666] [4.664]
R² 0.061 0.000 0.096 0.107 0.080 0.034 0.044 0.009 0.001 0.010

The impact of stock recommendations given on Dutch television
Master thesis Finance 31
Freek Haagh
Table 7: regression results – per analyst
Dependent variable: abnormal weekend returns
Model 11 12 13 14 15 16 17
Schaaij dummy 0.949***
[0.215]
Vermeulen dummy -0.658*** -0.952***
[0.246] [0.258]
Langelaar dummy -0.749 -1.192**
[0.578] [0.577]
Hafkamp dummy -0.731** -1.106***
[0.324] [0.335]
Wierda dummy 0.123 -0.357
[0.430] [0.434]
intercept 0.219 0.856*** 0.707*** 0.774*** 0.670*** 0.684*** 1.150***
[0.150] [0.128] [0.112] [0.117] [0.114] [0.110] [0.154]
R² 0.044 0.017 0.004 0.012 0.000 0.001 0.048
In Table 4abnormal weekend returns are regressed against different factors using the following linear regression model:
. In model 17 the Schaaij dummy is dropped to compare the recommendations of Geert Schaaij with the other analysts’
recommendations.
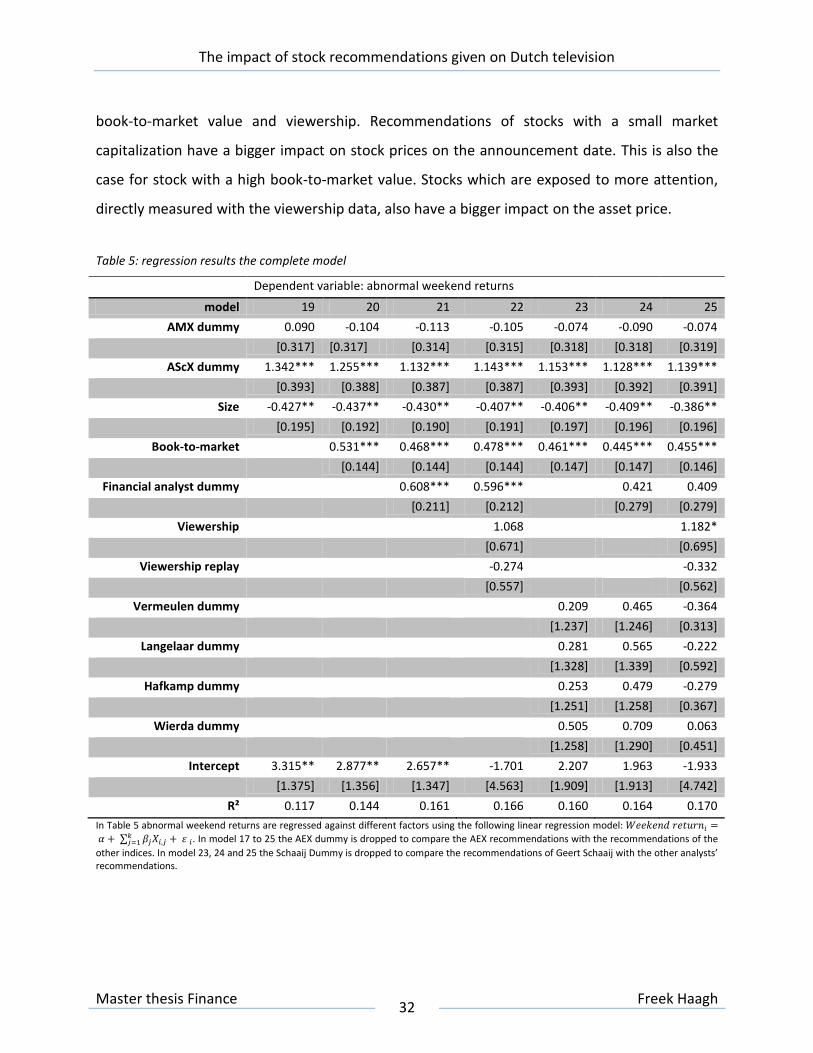
In Table 5 different factors are taken together to establish completer models. In model 19 to 25
the AEX dummy is dropped to compare the AEX recommendations with the other AMX and
AScX recommendations. When the model is corrected for size and book-to-market value, the
AEX and AMX dummy do not have a significantly different impact on stock prices. The AScX
dummy and the Size variable stay significant and both point out that the smaller stocks have a
bigger influence on stock prices. This was expected according to the results of the event study.
Model 19 shows that AEX, AMX, and AScX dummies keep their significance even after adding
the Size factor, while all four factors are in some way proxies for size. A positive relationship
between the book-to-market value and the abnormal weekend returns is projected in all
regressions. The influence of the financial analyst dummy evaporates after adding the dummies
of the individual analyst. This is caused by the fact that only Geert Schaaij is an individual
financial analyst in a particular part of the sample period, which causes a lot of correlation. The
influence of the viewership data as a direct measure of attention diminishes when other factors
are added. In the complete models (23, 24 and 25), the influence of the individual analyst is
insignificant. In model 25 the four significant factors are the AScX dummy, the size variable, the
The impact of stock recommendations given on Dutch television
Master thesis Finance 32
Freek Haagh
book-to-market value and viewership. Recommendations of stocks with a small market
capitalization have a bigger impact on stock prices on the announcement date. This is also the
case for stock with a high book-to-market value. Stocks which are exposed to more attention,
directly measured with the viewership data, also have a bigger impact on the asset price.
Table 5: regression results the complete model
Dependent variable: abnormal weekend returns
model 19 20 21 22 23 24 25
AMX dummy 0.090 -0.104 -0.113 -0.105 -0.074 -0.090 -0.074
[0.317] [0.317] [0.314] [0.315] [0.318] [0.318] [0.319]
AScX dummy 1.342*** 1.255*** 1.132*** 1.143*** 1.153*** 1.128*** 1.139***
[0.393] [0.388] [0.387] [0.387] [0.393] [0.392] [0.391]
Size -0.427** -0.437** -0.430** -0.407** -0.406** -0.409** -0.386**
[0.195] [0.192] [0.190] [0.191] [0.197] [0.196] [0.196]
Book-to-market 0.531*** 0.468*** 0.478*** 0.461*** 0.445*** 0.455***
[0.144] [0.144] [0.144] [0.147] [0.147] [0.146]
Financial analyst dummy 0.608*** 0.596*** 0.421 0.409
[0.211] [0.212] [0.279] [0.279]
Viewership 1.068 1.182*
[0.671] [0.695]
Viewership replay -0.274 -0.332
[0.557] [0.562]
Vermeulen dummy 0.209 0.465 -0.364
[1.237] [1.246] [0.313]
Langelaar dummy 0.281 0.565 -0.222
[1.328] [1.339] [0.592]
Hafkamp dummy 0.253 0.479 -0.279
[1.251] [1.258] [0.367]
Wierda dummy 0.505 0.709 0.063
[1.258] [1.290] [0.451]
Intercept 3.315** 2.877** 2.657** -1.701 2.207 1.963 -1.933
[1.375] [1.356] [1.347] [4.563] [1.909] [1.913] [4.742]
R² 0.117 0.144 0.161 0.166 0.160 0.164 0.170
In Table 5 abnormal weekend returns are regressed against different factors using the following linear regression model:
. In model 17 to 25 the AEX dummy is dropped to compare the AEX recommendations with the recommendations of the
other indices. In model 23, 24 and 25 the Schaaij Dummy is dropped to compare the recommendations of Geert Schaaij with the other analysts’ recommendations.
The impact of stock recommendations given on Dutch television
Master thesis Finance 33
Freek Haagh
5.3. Calendar-time portfolios
In Paragraph 5.1. it is shown that the “Business Class” recommendations significantly
outperform the market even after 96 trading days. In Paragraph 5.2. the abnormal weekend
returns are explained using different variables. In this paragraph the calendar-time portfolios
are used to study if a strategy of buying the buy recommendations from “Business Class” would
be profitable compared to the returns of the market.
The Jensen’s alpha is used to measure if a portfolio (based on the “Business Class”
recommendations) is able to perform consistently better than the market. The alpha is the
intercept of the regression. If the alpha is positive and significant, the proposed strategy is able
to outperform the market. Firstly the excess returns of the portfolios are regressed against
excess market returns. This is often referred to as the CAPM model. The results are shown in
Panel A of Table 6. All alphas in Table 6 are positive and four out of five are significant. Only the
alpha of the 96 days portfolio is not significant. So the other 4 portfolios will outperform the
market in the long run. The 144 days portfolio has an expected abnormal return of 2.5 basis
points on a daily basis. This is a yearly abnormal return of 7.8% (312 * 0.025%). The regression
results also show some under-reaction to the market. The portfolios in this research are less
volatile than the market, because the beta of the CAPM model is smaller than 1. The CAPM
model becomes a better predictor for the portfolio returns if the horizon gets longer, as shown
by the R². Secondly the excess returns of the portfolio are regressed against a four factor model.
The results of the regression are presented in Panel B of Table 6. When three extra factors are
added to the model, four out of five alphas are still significant. The alphas are really consistent
with the regression in Panel A. Just as in the CAPM model regression, the market beta is smaller
than 1, but still highly significant. The SMB-factor is significant and positive for all portfolios. So,
as expected small firms outperform larger firms on the Dutch stock market. This was already
shown in the results of the event study in paragraph 5.1. and the cross-sectional regression in
Paragraph 5.2. By adding the SMB-factor the outperformance is captured by the model. If high
book-to-market firms are outperforming low book-to-market firms on average, a significant and
positive HML-factor is expected. In this study all HML-factors are positive, and only the HML-
The impact of stock recommendations given on Dutch television
Master thesis Finance 34
Freek Haagh
factor of the 48 day portfolio is not significant. In the rest of the portfolios the HML-factor does
add extra explanatory value to the model in a way that was expected. The results are similar to
the results of the cross-sectional regression in paragraph 5.2. The fourth and final factor is the
momentum factor. According to Rouwenhorst (1997) and Jegadeesh and Titman (1997) high
momentum stocks will outperform low momentum stocks on average. So we expect a positive
and significant momentum factor. Four out of five momentum factors are positive, but none of
them is significant in this research.
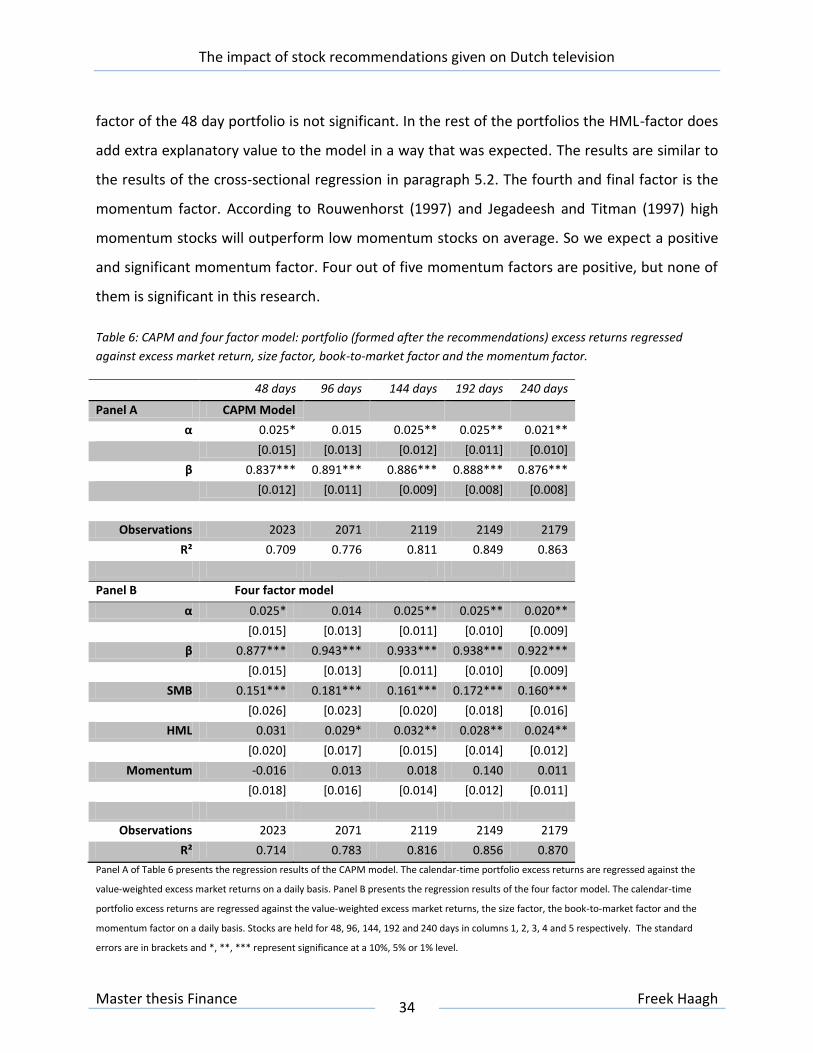
Table 6: CAPM and four factor model: portfolio (formed after the recommendations) excess returns regressed
against excess market return, size factor, book-to-market factor and the momentum factor.
48 days 96 days 144 days 192 days 240 days
Panel A CAPM Model
α 0.025* 0.015 0.025** 0.025** 0.021**
[0.015] [0.013] [0.012] [0.011] [0.010]
β 0.837*** 0.891*** 0.886*** 0.888*** 0.876***
[0.012] [0.011] [0.009] [0.008] [0.008]
Observations 2023 2071 2119 2149 2179
R² 0.709 0.776 0.811 0.849 0.863
Panel B Four factor model
α 0.025* 0.014 0.025** 0.025** 0.020**
[0.015] [0.013] [0.011] [0.010] [0.009]
β 0.877*** 0.943*** 0.933*** 0.938*** 0.922***
[0.015] [0.013] [0.011] [0.010] [0.009]
SMB 0.151*** 0.181*** 0.161*** 0.172*** 0.160***
[0.026] [0.023] [0.020] [0.018] [0.016]
HML 0.031 0.029* 0.032** 0.028** 0.024**
[0.020] [0.017] [0.015] [0.014] [0.012]
Momentum -0.016 0.013 0.018 0.140 0.011
[0.018] [0.016] [0.014] [0.012] [0.011]
Observations 2023 2071 2119 2149 2179
R² 0.714 0.783 0.816 0.856 0.870
Panel A of Table 6 presents the regression results of the CAPM model. The calendar-time portfolio excess returns are regressed against the
value-weighted excess market returns on a daily basis. Panel B presents the regression results of the four factor model. The calendar-time
portfolio excess returns are regressed against the value-weighted excess market returns, the size factor, the book-to-market factor and the
momentum factor on a daily basis. Stocks are held for 48, 96, 144, 192 and 240 days in columns 1, 2, 3, 4 and 5 respectively. The standard
errors are in brackets and *, **, *** represent significance at a 10%, 5% or 1% level.

The impact of stock recommendations given on Dutch television
Master thesis Finance 35
Freek Haagh
Until now it was assumed that the portfolios are formed on the day of the recommendation.
Because an initial price shock on the announcement date is expected, it is interesting to
investigate if the portfolios still outperform the market if they are formed after the
announcement date. In Table 7 the regression results are shown of portfolios that are formed
on the next trading day following the event. As shown in Panel A of Table 7, all alphas are
positive and three out of five alphas are even significant. So when the announcement returns
are excluded from the portfolios, some of the portfolios with the longer horizon still
significantly outperform the market. The alphas in Panel B of Table 7 are quite similar to the
alphas in Table 6. The regression results of the four factors in Table 7 do not change a lot either
compared to Table 6. So the conclusion can be drawn that the announcement day returns do
have influence, but the strategy still outperforms the market.

The impact of stock recommendations given on Dutch television
Master thesis Finance 36
Freek Haagh
Table 7: CAPM and four factor model: portfolio (formed after the recommendations) excess returns regressed
against excess market return, size factor, book-to-market factor and the momentum factor.
48 days 96 days 144 days 192 days 240 days
Panel A CAPM Model
α 0.015 0.008 0.021* 0.021** 0.018*
[0.015] [0.013] [0.012] [0.011] [0.010]
β 0.829*** 0.885*** 0.884*** 0.887*** 0.874***
[0.012] [0.010] [0.009] [0.008] [0.008]
Observations 2022 2070 2118 2148 2178
R² 0.710 0.778 0.811 0.851 0.865
Panel B Four factor model
α 0.016 0.008 0.021* 0.021** 0.018*
[0.015] [0.013] [0.011] [0.010] [0.009]
β 0.866*** 0.935*** 0.929*** 0.936*** 0.920***
[0.015] [0.013] [0.011] [0.010] [0.009]
SMB 0.142*** 0.172*** 0.156*** 0.169*** 0.157***
[0.026] [0.022] [0.020] [0.018] [0.016]
HML 0.038** 0.033* 0.034** 0.029** 0.024**
[0.019] [0.017] [0.015] [0.013] [0.012]
Momentum -0.008 0.019 0.021 0.015 0.012
[0.018] [0.015] [0.014] [0.012] [0.011]
Observations 2022 2070 2118 2148 2178
R² 0.715 0.783 0.817 0.858 0.871
Panel A of Table 7 presents the regression results of the CAPM model. The calendar-time portfolio excess returns are regressed against the
value-weighted excess market returns on a daily basis. Panel B of Table 7 presents the regression results of the four factor model. The calendar-
time portfolio excess returns are regressed against the value-weighted excess market returns, the size factor, the book-to-market factor and
the momentum factor on a daily basis. The difference with Table 6 is the fact that the portfolios in Table 7 are formed the day after the
recommendation. Stocks are held for 48, 96, 144, 192 and 240 days in columns 1, 2, 3, 4 and 5 respectively. The standard errors are in brackets
and *, **, *** represent significance at a 10%, 5% or 1% level.
All previous Tables show results that are in contradiction with the efficient market hypothesis.
According to the efficient market hypothesis, one would expect that the market would
efficiently reflect all publicly available information. According to the result in Tables 6 and 7 the
“Business Class” analysts have a significant influence on asset prices, by using only public
information. But all results shown in Tables 6 and 7 are not corrected for transaction costs.
Table 8 shows the regression results, when the portfolio returns are corrected for transaction

The impact of stock recommendations given on Dutch television
Master thesis Finance 37
Freek Haagh
costs. Panel A and B both show that the alpha is not significant when transaction costs are
added. So when the returns are correct for a transaction cost of 1% of the amount invested, the
significant alpha evaporates and the market is considered to be efficient.
Table 8: CAPM and four factor model: regression results corrected for transaction costs.
48 days 96 days 144 days 192 days 240 days
Panel A CAPM Model
α -0.008 -0.008 0.011 0.013 -0.01
[0.015] [0.013] [0.012] [0.011] [0.010]
β 0.836*** 0.889*** 0.885*** 0.888*** 0.987***
[0.012] [0.011] [0.009] [0.008] [0.009]
Observations 2023 2071 2119 2149 2179 R² 0.708 0.775 0.81 0.849 0.863
Panel B Four factor model
α -0.008 -0.009 0.011 0.013 0.011
[0.015] [0.013] [0.011] [0.010] [0.010]
β 0.875*** 0.941*** 0.931*** 0.938*** 0.921***
[0.015] [0.013] [0.011] [0.010] [0.009]
SMB 0.144*** 0.176*** 0.159*** 0.171*** 0.158***
[0.026] [0.023] [0.020] [0.018] [0.017]
HML 0.030 0.028* 0.032** 0.029** 0.023*
[0.020] [0.017] [0.015] [0.014] [0.012]
Momentum -0.012 0.014 0.019 0.015 0.015
[0.018] [0.016] [0.014] [0.012] [0.012]
Observations 2023 2071 2119 2149 2179 R² 0.713 0.781 0.816 0.856 0.869
Table8 panel A presents the regression results of the CAPM model corrected for transaction costs. Table 8 panel B presents the regression
results of the four factor model corrected for transaction costs. The calendar-time portfolio excess returns are regressed against the value-
weighted excess market returns in, the size factor, the book-to-market factor and the momentum factor on a daily basis. Stocks are held for 48,
96, 144, 192 and 240 days in columns 1, 2, 3, 4 and 5 respectively. The standard errors are in brackets and *, **, *** represent significance at a
10%, 5% or 1% level. The difference with Table 1 is that these portfolios are formed after the recommendations are made.

The impact of stock recommendations given on Dutch television
Master thesis Finance 38
Freek Haagh
6. Conclusion
The possibility of generating profits from acting on stock recommendations made by financial
analysts has been discussed for many years. According to the efficient market hypothesis (Fama,
1970), only news should have an impact on security prices. Because analysts are interpreting
only public information, one can argue that this advice should not affect security prices.
In the first part of this thesis evidence was found that the average recommendation on
“Business Class” causes the stock prices to react in an abnormal way. An abnormal stock price
reaction after the announcement is shown in the event study. After 96 days the average buy
recommendation performs approximately 3% better than the market, while the average sell
recommendation performs 4.5% worse than the market. The biggest initial reaction is reported
for the stocks with the smallest market capitalization. The small cap stocks show the biggest
outperformance in the first few days.
The size of the abnormal returns on the announcement date is studied in a cross-sectional
regression. At first all independent variables are studied separately. The AEX, AMX and AScX
dummies show that the stocks with the smallest market capitalization have the biggest
abnormal returns on the announcement date. This effect is further clarified by the Size factor.
Stocks with high book-to-market equity ratios have higher abnormal returns on average. The
Financial analyst dummy has a positive coefficient, which indicates that if an independent
financial analyst does the recommendation instead of a professional asset manager, the
abnormal weekend returns will be higher. Attention is directly measured with the viewership
data of “Business Class”. If there is more attention towards the recommendations the abnormal
returns are expected to be higher. When the different analysts are compared in a regression,
only Geert Schaaij has a positive and significant influence on the abnormal returns. Ultimately
all factors are taken together in one model, to measure which variables remain significant if
other variables are added. In the complete model, the four factors that remain significant are
the AScX-dummy, the size variable, the book-to-market value and viewership.
The impact of stock recommendations given on Dutch television
Master thesis Finance 39
Freek Haagh
Recommendations of stocks with a small market capitalization have a bigger impact on stock
prices on the announcement date. This is also the case for stock with a high book-to-market
value. Stocks which are exposed to more attention, directly measured with the viewership data,
also have a bigger impact on asset prices.
By studying the calendar-time portfolios I was able to show that a portfolio of recommended
stocks outperforms the market in the long run. This is shown by a positive and significant
Jensen’s alpha in the portfolios with a holding period of 144, 192 and 240 days. After correcting
for transaction costs, the significance of the alpha evaporates. This leads to the conclusion that
it is impossible for investors to use the “Business Class” recommendations as an arbitrage
opportunity. Due to the transaction costs the outperformance of the recommendations is
wasted and an investment in the market portfolio would be preferred. So if the transaction
costs are taken into account, the market is considered to be efficient.
Limitations
One limitation of this research is caused by using the weekend returns. To define the risk-free
rate, the yearly return on a 1 month Dutch government bond is taken from DataStream. This
time varying daily return is divided by 312 to calculate the daily return. This approach is correct
for the five normal trading days each week, but there is no weekend return available for the
risk-free investment. To solve this discrepancy, the daily returns on every Friday are also used
as the weekend returns. Due to the slight variations in the risk-free return this method should
approach the real risk-free returns. Another limitation is caused by a lack of available data. In
the paper of Engelberg et al. (2010) the intraday CAAR is measured. They have access to hourly
return data, even when the market is closed. With this hourly data Engelberg et al. (2010) show
that abnormal returns are caused by the “Mad Money” show, because the initial shock is takes
place during and right after the show is broadcast. This particular data is not available for the
Dutch market. Due to the fact that there is not traded a lot in weekends, the impact of the
information provided by the analysts can be measured almost noise free.
The impact of stock recommendations given on Dutch television
Master thesis Finance 40
Freek Haagh
Further research
In the cross-sectional regression (paragraph 5.2.) is shown that the recommendations of
financial analyst Geert Schaaij have a significant bigger impact on stock prices than the
recommendations of most of his fellow analysts do. It could be interesting to find out in further
research if trading Geert Schaaij’s recommendations is profitable in the long run. Due to the
bigger impact of his recommendations, it could be possible that going long Geert Schaaij’s
recommendations is profitable trading strategy in the long run.
The impact of stock recommendations given on Dutch television
Master thesis Finance 41
Freek Haagh
References
Ali, A., Hwang, L., and M. Trombley, 2003, Arbitrage Risk and the Book-to-Market
Anomaly, Journal of Financial Economics, 69, 355-373.
Banz, R.W., 1981, The relationship between return and market value of common stocks,
Journal of Financial Economics, 9, 1, 3-18.
Barber, B., Lehavy, R., McNichols, M. and B. Trueman, 2001, Can investors profit from
the profits? Security analyst recommendations and stock returns, The Journal of Finance,
56, 531–563.
Barber, B. and T. Odean, 2008, All that Glitters: The Effect of Attention and News on the
Buying Behavior of Individual and Institutional Investors, The Review of Financial Studies,
21, 785-818.
Barberis, N. , Shleifer, A. , and R. Vishny, 1998, A model of investor sentiment, Journal of
Financial Economics, 49, 3, 307-343.
Bjerring, J. H., Lakonishok, J. and T. Vermaelen, 1983, Stock Prices and Financial Analysts'
Recommendations, Journal of Finance, 38, 187-204.
Boni, L. and K. Womack, 2003, Wall Street Research: Will New Rules Change Its
Usefullness? Financial analysts journal, 59, 3, 25-29.
Chan, S., and W. Fong, 1996, Reactions of the Hong Kong stock market to the publication
of second-hand analysts’ recommendations information, Journal of Business Finance &
Accounting, 23, 8, 1121-1140.
Desai, H. and P.C., Jain, 1995, An Analysis of the Recommendations of
the ”Superstar“ Money Managers at Barron’s Annual Roundtable, Journal of Finance, 50,
1257-1273.
Engelberg, J., Sasseville, C. and J. Williams, 2010, Market Madness? The Case of Mad
Money, Management Science, October 2010.
Fama, E. F., 1970, Efficient Capital Markets: A Review on Theory and Empirical Work,
Journal of Finance, 25, 383-417.
The impact of stock recommendations given on Dutch television
Master thesis Finance 42
Freek Haagh
Fama, E. F., and K.R. French, 1993, Common Risk Factors in the Return on Stocks and
Bonds, Journal of Financial Economics, 33, 3-56.
Ferraro, S.R., and D.J. Stanley, 2000, The investment value of analysts’
recommendations: evidence from the dartboard contest, Managerial Finance, 26 ,
6, – 48.
Ferreira, E. J., and S.D. Smith, 2003, “Wall $treet Week”: Information or entertainment?,
Financial Analysts Journal, 59, 45-53.
Hahn, G.J., 1977, Fitting Regression Models With No Intercept Term, Journal of Quality
Technology, 9, 56-61.
Jaffe, J. F., and J.M. Mahoney, 1999, The Performance of Investment Newsletters,
Journal of Financial Economics, 53, 289-307.
Jegadeesh, N., and S. Titman, 1993. Returns to buying winners and selling losers:
implications for stock market efficiency, Journal of Finance, 48, 65-91.
Jensen, M.C., 1968, The performance of mutual funds in the period 1945-64, Journal of
Finance, 23, 389-416.
Jordan, D. J. and S. K. Sarkar, 2000, Stock Price Reactions to Regional Wall Street Journal
Securities Recommendations, Quarterly Journal of Business and Economics, 39, 50-61.
Jong de, F,and P.C. De Goeij, 2010, event study methodology.
Keasler, T., and C. McNeil 2008, Mad Money Stock Recommendations: Market Reaction
and Performance, Journal of Economics and Finance, 34, 1-22.
Kerl, A. G., and A. Walter, 2007, Market Responses to Buy Recommendations Issued by
Personal Finance Magazines: Effects of Information, Price Pressure, and Company
Characteristics, Review of Finance, 11 (1), 117-141.
Liu, P., Smith, S.D., and A. Syed, 1990, Stock Price Reactions to The Wall Street Journal's
Securities Recommendations, The Journal of Financial and Quantitative Analysis, 25,
399-410.

The impact of stock recommendations given on Dutch television
Master thesis Finance 43
Freek Haagh
Lubatkin, M., and M.C. Rogers, 1989, diversification, systematic risk and shareholder
return: a capital market extension of Rumelt’s 1974 study, The Academy of
Management Journal, 32, 2.
Mathur, I., and A. Waheed, 1995, Stock Price Reactions to Securities Recommended in
Business Week’s Inside Wall Street, Financial Review, 30, 3, 583-604.
Metrick, A., 1999, Performance Evaluation with Transactions Data: The Stock Selection
of Investment Newsletters, Journal of Finance, 54, 1743-1775.
Mikhail M., Walther, B., and R. Willis, 1997, Do security analysts improve their
performance with experience?, Journal of Accounting Research 35 (Supplement),
131-166.
Neumann, J., and P. Kenny, 2007, Does Mad Money make the market go mad? The
Quarterly Review of Economics and Finance, 47, 602-615.
Pontiff, J., 1996, Costly arbitrage: Evidence from closed-end funds, Quarterly Journal of
Economics, 111, 1135–1152.
Rouwenhorst, G., 1997, International momentum strategies, Journal of Finance, 53,
267-284.
Shleifer, A., and R.W. Vishny, 1997, The limits of arbitrage, Journal of Finance, 52, 35–55.
Stickel, S., 1995, The Anatomy of the Performance of Buy and Sell Recommendations,
Financial Analysts Journal, 51, 25-39.
Womack, K., 1996, Do brokerage analysts' recommendations have investment value?
Journal of Finance 51, 137-167.