Embed Size (px)
Citation preview

1
The impact of Regional Trade Agreements on North African countries’
foreign trade and economic welfare, evidence from Algeria and the
European Union Association Agreement.
MOHAMED Y. HADDOUD*; Dr. KEITH SALMON**; Dr. PAUL JONES* & Dr.
ROBERT NEWBERY*
*The University of Plymouth. Drake Circus. UK . ** The University of Hertfordshire.
Hatfield. UK
Abstract
North African countries trade performance for the last two decades has been disappointing.
Efforts to boost trade through regional trade agreements are wide spread. The aim of this
paper is to provide additional empirical evidence from the Algeria and the European Union
Regional Trade Agreement (Algeria-EU RTA) on the impact of regional memberships on
North African countries’ foreign trade and economic welfare. This study involves both an
ex-ante and ex-post analysis. The former is mainly based on observations of trade movements
and trade indicator calculations, whereas the latter is based on both quantitative methods,
using the Lloyd and McLaren model and qualitative evaluation using a Vinerian Approach.
This research covers a 10-year period (2000-2010).The ex-ante analysis shows that the
Algeria-EU Association Agreement was undertaken with two natural trading partners, and
thus was expected to create trade and improve economic welfare. This is confirmed by the ex-
post analysis as the qualitative study shows that the agreement has positively influenced
Algerian trade and led to trade creation in most of the sectors (non-hydrocarbon). Moreover,
it is indicated that Algerian economic welfare increased after the implementation of the
Association Agreement and confirmed the statement and findings of several of past studies.
Nonetheless, it is important to mention that the trade creation occurred mainly in imports
2
rather than exports. Thus, the quantitative study reveals that although economic welfare
increased after the Association Agreement implementation it remained negative. This leads to
the conclusion that although the regional membership may create trade, for North African
countries, it may not be sufficient to overcome export issues and regulate trade.
Key Words: Algeria; EU; RTA; Foreign Trade; Trade Creation and Trade Diversion.

3
1. Introduction
In the last fifteen years the phenomenon of Regional Trade Agreements (RTAs), also known
as Free Trade Agreements (FTAs), has experienced a significant and constant increase. Most
of the industrial, developed and developing countries are either members or in a process of
negotiating membership of a regional trade partnership (Wang, 2010). It is acknowledged that
the European Union (EU) has the most extensive network of RTAs including both developed
and developing countries (Panagravia, 2002). Among these partnerships, the Euro-
Mediterranean agreements (Euro-Med) are raising many debates concerning the actual impact
of these agreements on trade performance (Peridy, 2005). In particular, it is argued that
despite such trade partnerships, Mediterranean countries have been experiencing a
disappointing trade performance for the last two decades. It is reported that the share of the
North African countries (combined with the Middle-Eastern nations) in the global trade has
dropped from 8% in 1981 to 2.5% in 2004 (Dennis, 2006). In this respect, it is warned that
RTAs can negatively impact trade performance of both members and non-members by
diverting more trade from non-members than it would create mong members (Freund and
Ornelas, 2010). The purpose of this paper is to provide additional empirical evidence from the
Algeria and the European Union Regional Trade Agreement (Algeria-EU RTA) on the impact
of RTAs on North African countries’ foreign trade and economic welfare. The present study
is structured as follow; (1) a brief review of literature is conducted covering the debate over
the creation and diversion effects of RTAs, (2) the research methodology is presented and (3)
the results are discussed.
4
2. Literature Review: Trade creation and trade diversion
In theory, RTAs are expected to increase the volume of trade, and enhance economic welfare
among member countries. The deeper integration brought by the new wave of RTAs has
constituted an essential inspiration for the expansion of the FTAs in the last decade. However,
since Viner’s (1950) study of the customs union issue a debate has taken place on whether
expansion of intra-bloc trade under RTAs is not at the expanse of extra-bloc trade. Viner’s
approach involves two important concepts, namely; trade creation and trade diversion.
According to this approach, trade creation refers to “the expansion of overall trade by a PTA
country to the benefit of its economy”. Whereas, trade diversion is considered as “the
expansion of trade between PTA partners, that supplants erstwhile imports from non-PTA
countries at a higher resource cost than would be otherwise” (De Rosa, 2007:2).
Several studies have claimed that RTAs significantly contribute to increasing trade among the
country members and thus would positively impact the economic welfare of these countries
(Allen et al., 1996; Sapir, 2000; Clausing, 2001; Magee, 2008). In this regard, Allen et al
(1996) conducted research on the EU-RTA, using an econometric approach, based on data
such as demand between home producers, other EU producers, and non-EU producers. The
authors concluded that the European FTA created trade for both EU and non-EU producers.
Similarly, Sapir (2000) found that Andean community, Closer Economic Relations (CER),
ASEAN Free Trade Area (AFTA) and European Free Trade Area (EFTA) have created more
trade internally than they have diverted trade from the rest of the world. However, the effects
of Latin American Integration Association (LAIA) and MERCOSUR were inconclusive. Only
NAFTA has been found to be net trade diverting. Moreover, Clausing (2001) investigated the
effect of the Canada-United States trade agreement (CUSFTA) of 1988 and concluded that
trade creation occurred in most sectors. Equally, Magee (2008) used a panel of 133 countries

5
between 1980 and 1998. The author found that although the RTAs’ positive impact was
limited the latter has created more trade than it has diverted.
Conversely, other studies have demonstrated that RTAs may improve intra-regional trade at
the expense of trade with outsiders (diversion), thus reducing economic welfare (Adams et al.,
2003; Krugman and Obstfield, 2003; Romalis, 2007). In this respect, Adams et al (2003:100)
have severely criticised past studies conducted on RTAs’ effects on trade, and where they
have been found to create trade. They stated “these studies have been assessed, at best, only
by reference to the point estimates from various cross sections” and argued that new research
has been conducted using more rigorous statistical tests. They found that among 18 RTAs
examined in detail, 12 have resulted in more trade diversion from non-members than trade
creation with members (concerning merchandise trade provisions). Moreover, they suggested
that RTAs with high levels of liberalisation, such as the EU, NAFTA and MERCOSUR, have
been unsuccessful at creating significant trade inside the region and therefore have reduced
economic welfare effect. To summarise, the empirical results found by Adams et al (2003)
totally contradict the results mentioned previously. Furthermore, Krugman and Obstfeld (2003)
illustrated these negative effects through the South American example. When in 1991
Argentina, Brazil, Paraguay and Uruguay created a free trade area called MERCSOUR, the
volume of trade among these countries tripled within four years following the agreement.
Nonetheless, the authors stated that a study in 1996, conducted by the World Bank’s chief
trade economist, showed that the increase in the volume of trade within the region was at the
expense of the trade that would have taken place with the rest of the world. In addition, the
report argued that member countries were purchasing higher cost products from neighbour
instead of lower cost products still heavily taxed from non-members countries. In other words,
the pact diverted trade instead of creating it, and therefore reduced world welfare. Equally,

6
Romalis (2007) studied the creation/diversion effect in the NAFTA agreement. The author
found that the agreement has diverted more trade from EU countries.
Eventually, several scholars acknowledged that the creation and diversion effects depend on a
number of factors that may influence the RTA’s impact. In fact, Wonnacot and Lutz (1989),
Krugman (1991), Bhagwati (2008); and Freund and Omelas (2010) argued that RTAs are
more likely to create trade and enhance economic welfare when formed with nearby countries
that already trade extensively with each other (natural trading partner). Frankel et al. (1995)
confirmed that factors such as physical proximity, similarity in sizes and GNP, common
borders and common languages improve the probability for trade creation. Additionally,
Grimwade (2000) has argued that the effects of RTAs on trade and economic welfare depend
on the nature of the agreement. The author suggested that a number of factors may lead the
agreement to create or divert trade, these are:
The larger the area covered by the agreement, the greater the trade created.
A high degree of complementarity between countries leads to greater probabilities of
trade diversion.
A high level of competition between members may increase possibilities of trade
creation.
High external tariffs (for non-members) induce trade diversion.
Similarly, Plummer et al (32:2010) have added other factors that may also affect the
RTA’s impact. They stated that:
A RTA may be trade diverting if it encourages trade between “unnatural” trade
partners
The larger the difference between countries’ comparative advantage, the more likely is
to create trade
The less the country’s comparative advantage depends on commodities the greater the
probability of trade diversion.

7
3. Methodology: Assessing a RTA’s impact
The evaluation of the potential and actual impacts of a RTA is conducted essentially using
economic data and statistics, as well as using a number of assessment methods. The study’s
results are often dependant on assumptions employed in the models and the availability of
data. It is argued that in the case of non-availability of these latter, formal and structured
interviews and questionnaires may then be useful. It is important to conduct the economic
assessment of the RTA’s influence both before (ex-ante) and after (ex-post) to enforcement.
The analysis of the potential effects prior to the RTA implementation will help to clarify the
position of the country before joining the partnership, as well as its potential impact. Similarly,
assessing the actual impact of the RTA after its implementation will indicate whether the
outcomes of the partnership match the expectations. Overall, the purpose of such assessment
is to determine whether creating or joining a RTA is advantageous for the countries involved
(Plummer et al, 2010).
3.1. Ex-ante evaluation
This research is based on methods using economic trade indicators covering imports and
exports data and to determine the level of the country’s interdependence. In other words, the
extent to which the potential country member of RTA already trades with the region’s
member (prior to joining the partnership). This analysis is mainly based on observations of
trade movements and trade indicator calculations. These are: regional interdependence,
revealed comparative advantages and regional orientation indicator.

8
3.2. Ex-post evaluation
For the ex-post assessment, both quantitative and qualitative evaluations are conducted. This
is undertaken by observing and calculating changes in Algerian imports and exports after the
RTA’s entry into force. With respect to the qualitative assessment, a Vinerian approach is
applied. The latter is based on a comparison between imports and production movements
prior to and after implementing the RTA. Nonetheless, the main disadvantage of this method
is that it is a purely descriptive technique and does not quantify the creation or diversion of
trade (Plummer et al., 2010). The interpretation of these comparisons is based on the
following principles:
A rise in imports from RTA partners which would be accompanied by a decline in
domestic production leads to trade creation
An augmentation in imports from RTA partners which would be accompanied by
a fall in non-RTA partners’ imports leads to trade diversion
An increase in total imports where imports from non-RTA partners are constant or
rising indicates that there is no trade diversion (positive welfare effect)
An increase in total imports where both imports from non-RTA partners and
domestic production decline, and
The drop in imports from non-RTA partners is greater than the drop in
domestic production, implying that trade diversion exceeds trade creation, thus
indicating a negative welfare effect; or
The fall in imports from non-RTA partners is smaller than the fall in domestic
production, implying that trade creation exceeds trade diversion, thus
indicating a positive welfare effect.
9
A decline in total imports indicates that there is no trade creation (negative
welfare effect).
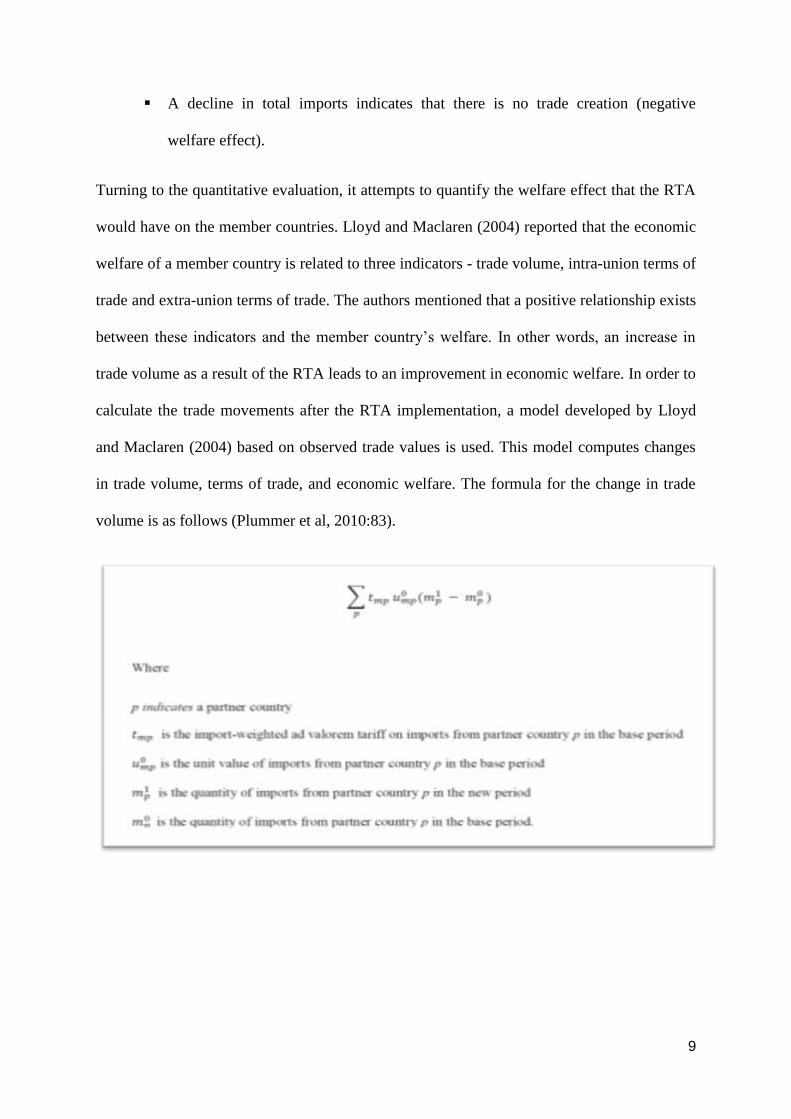
Turning to the quantitative evaluation, it attempts to quantify the welfare effect that the RTA
would have on the member countries. Lloyd and Maclaren (2004) reported that the economic
welfare of a member country is related to three indicators - trade volume, intra-union terms of
trade and extra-union terms of trade. The authors mentioned that a positive relationship exists
between these indicators and the member country’s welfare. In other words, an increase in
trade volume as a result of the RTA leads to an improvement in economic welfare. In order to
calculate the trade movements after the RTA implementation, a model developed by Lloyd
and Maclaren (2004) based on observed trade values is used. This model computes changes
in trade volume, terms of trade, and economic welfare. The formula for the change in trade
volume is as follows (Plummer et al, 2010:83).

10
Whereas the formula for the change in terms of trade is:
The addition of changes in trade volumes and terms of trade permits quantification of the
welfare effect of the RTA on the involved economy. Nevertheless, this method does not
separate the effects on trade due to the RTA’s entry into force or due to other factors such as
changes in incomes, prices and transports. Therefore, in order to solve this issue, it is
necessary to calculate trade movements before the establishment of the partnership and
compare them with actual values.
11
3.3. Data Collection
The data employed are mainly statistics regarding foreign trade figures, such as imports,
exports and trade balances. Reliable sources are used, such as the United Nation Conference
on Trade and Development database (UNCTAD), the World Bank, the International
Monetary Fund, the World Integrated Trade Solution, the United Nations Commodity Trade
Statistics Database, the European Union, the Algerian Ministry of Trade, Algeria Export
(Algex), the Algerian Office of National Statistics and the Algerian Customs Board. Access
to these sources was via their official websites. Finally, it is important to emphasise that as
regards the Algerian websites, some technical issues were faced when collecting data. Thus,
certain statistics have been collected by direct communication with these organisations’
employees.
4. Results and Discussion
It is argued that the trade impact of a RTA is of primary interest as it is mostly a commercial
agreement and is consequently intended to influence trade (Plummer et al, 2010). The
Literature Review revealed that this influence can be either positive or negative. On the other
hand, it was also reported that the outcome of joining a RTA depends on a set of initial
factors. These factors are mainly related to intraregional trade levels, comparative advantages
and trade orientation between the partners (Grimwade, 2000; Plummer et al, 2010).
4.1. Ex-ante analysis
To begin with, the ex-ante analysis covers a five-year period prior to A.A implementation
(2000-2005). It determines the economic regions that Algeria trades with most. Then, it
examines a number of trade indicators regarding the EU-Algeria economic region.

12
These are:
Intraregional Trade Indicator
Intraregional Trade Intensity
Revealed Comparative Advantages
Regional Orientation Index.
4.1.1. Dynamics of Algerian foreign trade
The following graph (Figure 4.1) shows the Algerian trade share averages by destination
during the period 2000-2005 for both imports and exports.
Figure 4.1: Average of Algerian Trade share by economic regions (2000-2005).
Source: Calculated by the author on the bases of Algerian Customs department data
From Figure 4.1, it can be seen that between 2000 and 2005, the EU share of imports and
exports were on average around 57% and 60% respectively. Next were the Convention on the
60% 29%
0% 6%
3% 0%
1% 1%
0%
Exports
EU
OCDE (Non-EU)
Rest of Europe
South America
Asia (Non-Arab countries)
57% 19%
6%
4% 9%
1%
2% 1%
1% Imports EU
OCDE (Non-EU)
Rest of Europe
South America
Asia (Non-Arab countries)
OCEANIE
Arab Countries (Non-Maghreb
countries)
13
Organisation for Economic Co-operation and Development (OECD) countries with a 19%
share for imports and 29% for exports. As regards the remaining economic regions, it can be
noticed that their overall share did not account for more than 20% in both imports and exports.
It is concluded that prior to the implementation of the Association Agreement, the EU was
the largest trading partner of Algeria.
4.1.2. Trade Indicators
A trade indicator is defined as “an index or a ratio used to describe and assess the state of
trade flows and trade patterns of a particular economy” (Mikic and Gilbert, 2007:30).
Regional Trade Interdependence
Regional Trade Interdependence indicators are a set of ratios that calculate the extent to
which countries already trade with each other (before joining a RTA). Two main indicators
are generally used for this purpose, namely, Intraregional Trade Share and Intraregional
Trade Intensity. These can be used for a single country or a group of countries to measure the
regional direction of trade. High values for both indicators mean that countries in the
proposed RTA have low trade costs compared with outsiders. Hence, the RTA may be
beneficial as it boosts trade between “natural” trading partners (Plummer et al, 2010).
Intraregional Trade Share
The ITS is defined as “the ratio of trade between countries in the proposed region over the
total trade of all those countries”. This indicator illustrates the level of trade within the region
compared to the overall trade of all regional members (Plummer et al, 2004:33).

14
Its formula is:
0≤ITS≤1
Where
Tii = exports of region i to region i plus imports of region i from region i
Ti = total exports of region i to the world plus total imports of region i from the world
NB: It is also possible to calculate the Extra-regional Trade Shares (ETS) by using the
following formula ETS= 1-ITS (Lapadre et al, 2009)
Figure 4.2: ITS and ETS shares for Algeria-EU FTA (2000-2005).
Source: Calculated by the author based on Eurostat and United Nations Conference on Trade
and Development, statistics division (UNCTAD STAT) databases, (2011a)
As demonstrated by Figure 4.2, it is clear that throughout the period shares for Algeria-EU
FTA were constantly high. A gradual increase can be observed between 2000 and 2005 from
0.85 to 0.97. However, concerning the ETS, it is apparent that shares were relatively low over
the whole period. This reflects the high level of intra-regional trade in the EU-Algeria area
already existing before the A.A.
0
0.2
0.4
0.6
0.8
1
2000 2001 2002 2003 2004 2005
Sh
are
s
Years
ITS
ETS

15
Interregional Trade Intensity
Intraregional trade intensity is defined as “the intraregional trade share divided by the share
of the region’s total trade in world trade”. This indicator shows whether countries tend to
trade more with member countries inside the agreement area (when the indicator is more than
1) or more with outsiders (when the indicator is less than 1) (Plummer et al, 34:2004).
Its formula is as follow:
Where
Tii = exports of region i to region i plus imports of region i from region i
Ti = total exports of region i to the world plus total imports of region i from the world
TW = total world exports plus total world imports.
Figure 4.3: ITT shares of the Algeria-EU FTA (2000-2005).
Source: Calculated by the author from UNCTAD STAT (2011) databases
As it may be seen from the figure 4.3, apart from 2000 where the share was the highest,
shares were gradually increasing in much of the period. From 2001 to 2005, it increased from
2.2 to 2.4. This shows that the EU-Algeria FTA tends to have bias toward trading between its
members rather than trading with outsiders.
0
1
2
3
4
5
2000 2001 2002 2003 2004 2005
Sh
are
s
Years
16
Revealed Comparative Advantage
It is stated that in international trade theory gains from trade results from specialisation in
country’s efficient areas, in other words sectors in which a country has comparative
advantage. Balassa (1965) proposed the revealed comparative advantage (RCA) index as a
tool to identify commodities in which a country has a comparative advantage. It is defined as
“the ratio of a country’s share of the commodity in the country’s total exports to the share of
world exports of the commodity in total world exports” (Plummer et al, 38:2010).
A country is considered to have a comparative advantage on a selected sector if the index is
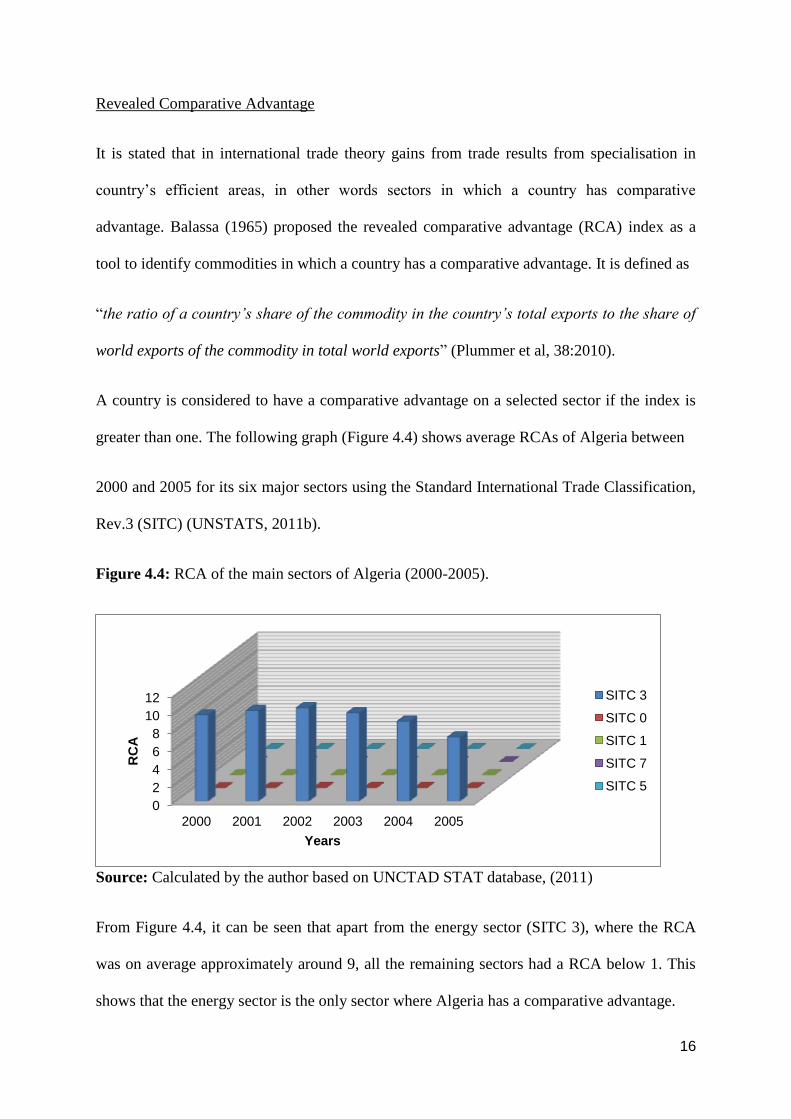
greater than one. The following graph (Figure 4.4) shows average RCAs of Algeria between
2000 and 2005 for its six major sectors using the Standard International Trade Classification,
Rev.3 (SITC) (UNSTATS, 2011b).
Figure 4.4: RCA of the main sectors of Algeria (2000-2005).
Source: Calculated by the author based on UNCTAD STAT database, (2011)
From Figure 4.4, it can be seen that apart from the energy sector (SITC 3), where the RCA
was on average approximately around 9, all the remaining sectors had a RCA below 1. This
shows that the energy sector is the only sector where Algeria has a comparative advantage.
0
2
4
6
8
10
12
2000 2001 2002 2003 2004 2005
RC
A
Years
SITC 3
SITC 0
SITC 1
SITC 7
SITC 5
17
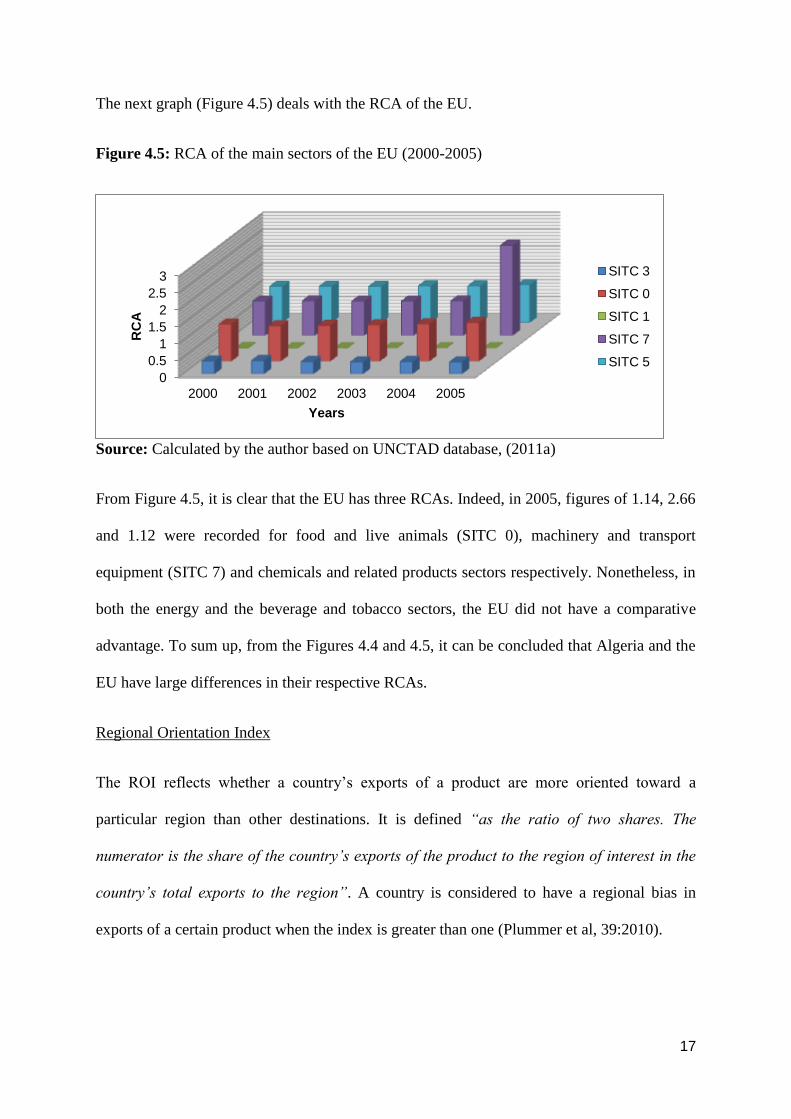
The next graph (Figure 4.5) deals with the RCA of the EU.
Figure 4.5: RCA of the main sectors of the EU (2000-2005)
Source: Calculated by the author based on UNCTAD database, (2011a)
From Figure 4.5, it is clear that the EU has three RCAs. Indeed, in 2005, figures of 1.14, 2.66
and 1.12 were recorded for food and live animals (SITC 0), machinery and transport
equipment (SITC 7) and chemicals and related products sectors respectively. Nonetheless, in
both the energy and the beverage and tobacco sectors, the EU did not have a comparative
advantage. To sum up, from the Figures 4.4 and 4.5, it can be concluded that Algeria and the
EU have large differences in their respective RCAs.
Regional Orientation Index
The ROI reflects whether a country’s exports of a product are more oriented toward a
particular region than other destinations. It is defined “as the ratio of two shares. The
numerator is the share of the country’s exports of the product to the region of interest in the
country’s total exports to the region”. A country is considered to have a regional bias in
exports of a certain product when the index is greater than one (Plummer et al, 39:2010).
0
0.5
1
1.5
2
2.5
3
2000 2001 2002 2003 2004 2005
RC
A
Years
SITC 3
SITC 0
SITC 1
SITC 7
SITC 5
18
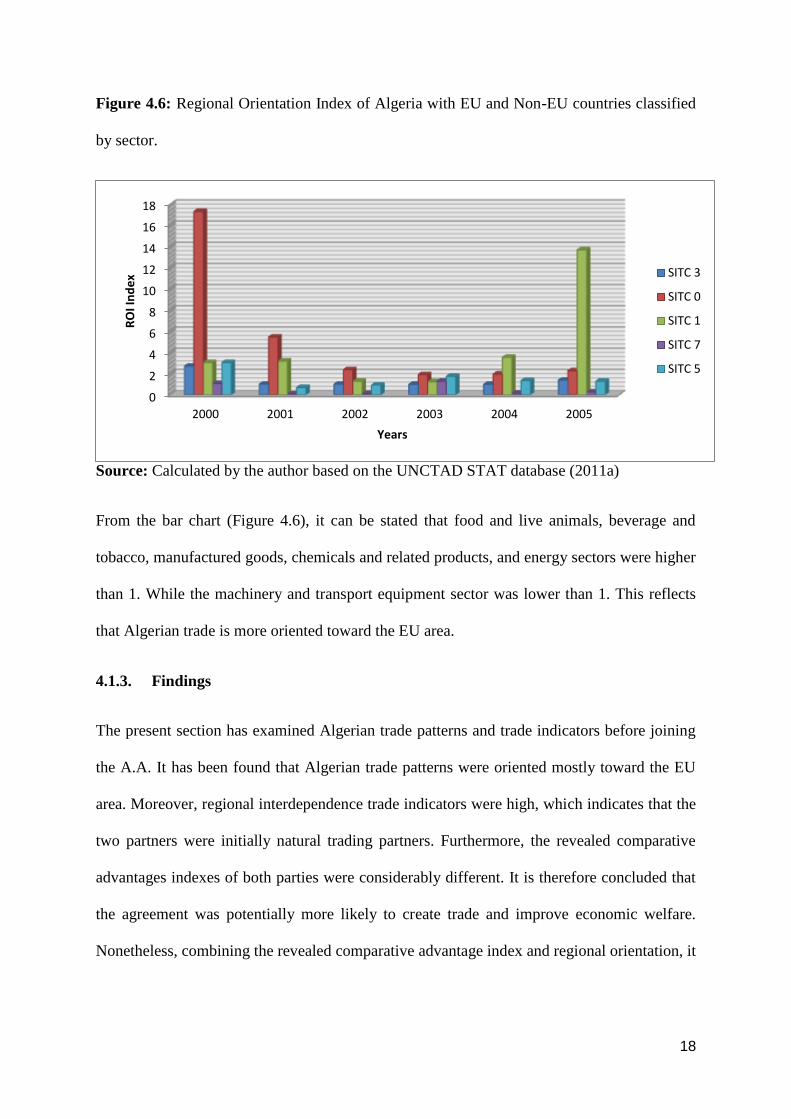
Figure 4.6: Regional Orientation Index of Algeria with EU and Non-EU countries classified
by sector.
Source: Calculated by the author based on the UNCTAD STAT database (2011a)
From the bar chart (Figure 4.6), it can be stated that food and live animals, beverage and
tobacco, manufactured goods, chemicals and related products, and energy sectors were higher
than 1. While the machinery and transport equipment sector was lower than 1. This reflects
that Algerian trade is more oriented toward the EU area.
4.1.3. Findings
The present section has examined Algerian trade patterns and trade indicators before joining
the A.A. It has been found that Algerian trade patterns were oriented mostly toward the EU
area. Moreover, regional interdependence trade indicators were high, which indicates that the
two partners were initially natural trading partners. Furthermore, the revealed comparative
advantages indexes of both parties were considerably different. It is therefore concluded that
the agreement was potentially more likely to create trade and improve economic welfare.
Nonetheless, combining the revealed comparative advantage index and regional orientation, it
0
2
4
6
8
10
12
14
16
18
2000 2001 2002 2003 2004 2005
RO
I In
de
x
Years
SITC 3
SITC 0
SITC 1
SITC 7
SITC 5

19
is stated that when the former is below 1 and the second is above 1, it may lead to a trade
diversion (Plummer et al, 2010). The next analysis examines actual trade effects of the A.A.
4.2. Ex-post analysis
The ex-post analysis covers a four year period after the A.A implementation (2005-2009). As
mentioned in the previous chapter, this section contains both qualitative and quantitative
studies.
4.2.1. Qualitative analysis
The first part of this section employs a qualitative approach based on trade movement’s
observation.
Dynamics of Algerian trade
An examination of the movements of the Algerian trade between 2000 and 2010 is conducted
through the following figure (figure 4.7).
Figure 4.7: Evolution of Algerian Non-hydrocarbon Trade in $ millions (2000-2010).
Source: Algerian Customs department (2011)
0
10000
20000
30000
40000
50000
2000 2001 2002 2003 2004 2005 2006 2007 2008 2009 2010
Val
ue
s $
Mill
ion
s
years
Exports
Imports
A.A entry in force

20
From Figure 4.7, it is clear that non-hydrocarbon imports were considerably greater than the
non-hydrocarbon exports; which illustrates the high dependence of the Algerian economy on
hydrocarbon exports. Moreover, it can be seen that Algerian imports were significantly
increasing all through the period. However, after the implementation of the A.A faster growth
was recorded, as between 2000 and 2005 the rise was around $11 billion, whereas between
2005 and 2010 the increase was approximately $20 billion.
With the exports, the same pattern was observed and once more the progression appeared to
be faster. The rise between 2000 and 2005 was around $295 million, while the increase
between 2005 and 2010 was about $700 million. Nonetheless, these movements do not
illustrate necessarily the direct influence of the A.A on the trade patterns. Thus, it would be
useful to compare Algerian trade patterns changes between the EU and the non-EU countries
(Figure 4.8).
Figure 4.8: Evolution of trade’s values of the EU and the non-EU partners of Algeria in
$ millions (2005-2010).
Exports
0
200
400
600
800
1000
1200
1400
2000 2001 2002 2003 2004 2005 2006 2007 2008 2009 2010
Val
ue
s $
Mill
ion
s
Years
EU
Non-EU
A.A entry in force

21
Imports
Source: Algerian Customs department (2011).
From the Figure 4.8, it can be concluded that both imports and exports from and to the EU
were increasing more rapidly after the entry into force of the A.A. Between 2000 and 2005
the rise was by $300 million for exports and $5 billion for imports, whereas, between 2005
and 2010 the increase was by $500 million for exports and $10 billion for imports. However,
it is also noticed that Algerian trade with non-EU countries was increasing over much of the
period for both imports and exports. Moreover, between 2005 and 2010, imports from non-
EU countries were higher and increasing considerably faster than imports from the EU
countries. The drop in Algerian exports in the year 2008 was probably due to the worldwide
financial crisis in 2008. Furthermore, it is important to note that although non-hydrocarbon
exports increased after the A.A implementation, its value remains marginal compared with
the imports’ share. Finally, it can be concluded that the EU-Algeria FTA has positively
influenced Algerian trade. The next section contains an analysis of the trade’s movements by
sector, showing the actual effect of the RTA on every sector.
0
5,000
10,000
15,000
20,000
25,000
30,000
35,000
40,000
45,000
2000 2001 2002 2003 2004 2005 2006 2007 2008 2009 2010
Val
ue
s $
Mill
ion
s
Years
EU
Non-EU
A.A entry in force

22
Dynamics of Algerian imports in the main sectors
The following figures analyse the Algerian imports with EU and non-EU countries in
comparison with the domestic production, by sector, between 2005 and 2008 (data for 2009
was unavailable). The selected sectors are the most traded sectors in the Algerian economy.
These sectors are classified using Standard International Trade Classification, Rev.3 (SITC),
they are;
SITC 0: food and live animals
SITC 5: chemicals and related products
SITC 6: manufactured goods
SITC 7: machinery and transport equipment
Figure 4.9: Evolution of Algerian imports and domestic production in the food and live
animals (SITC 0) sector, in $ thousands.
Source: UNCTAD STAT database (2011).
From Figure 4.9 it can be observed that for the food and live animals sector both Algerian
imports and domestic production have increased since 2005.
0
2000000
4000000
6000000
8000000
10000000
12000000
14000000
2005 2006 2007 2008
Val
ue
s $
Th
ou
san
ds
Years
Algerian Imports from EU
Algerian Imports from Non-EU
Total Algerian Imports
Domestic production
23
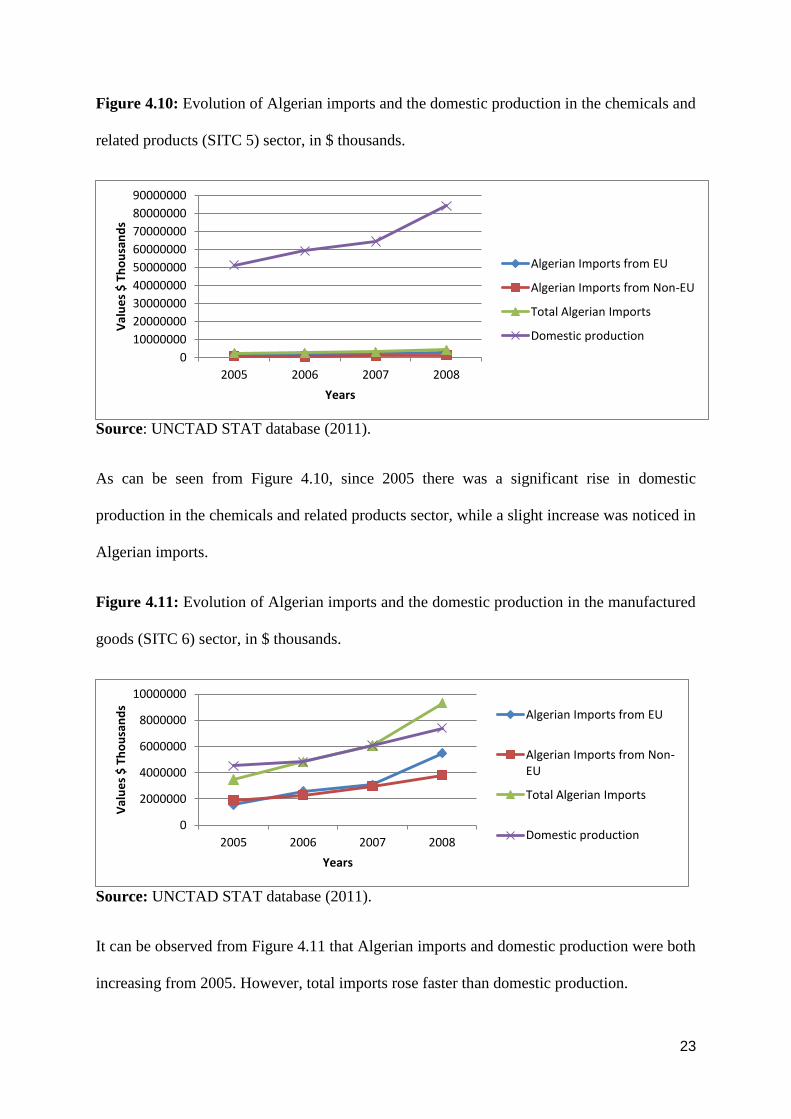
Figure 4.10: Evolution of Algerian imports and the domestic production in the chemicals and
related products (SITC 5) sector, in $ thousands.
Source: UNCTAD STAT database (2011).
As can be seen from Figure 4.10, since 2005 there was a significant rise in domestic
production in the chemicals and related products sector, while a slight increase was noticed in
Algerian imports.
Figure 4.11: Evolution of Algerian imports and the domestic production in the manufactured
goods (SITC 6) sector, in $ thousands.
Source: UNCTAD STAT database (2011).
It can be observed from Figure 4.11 that Algerian imports and domestic production were both
increasing from 2005. However, total imports rose faster than domestic production.
0
10000000
20000000
30000000
40000000
50000000
60000000
70000000
80000000
90000000
2005 2006 2007 2008
Val
ue
s $
Th
ou
san
ds
Years
Algerian Imports from EU
Algerian Imports from Non-EU
Total Algerian Imports
Domestic production
0
2000000
4000000
6000000
8000000
10000000
2005 2006 2007 2008
Val
ue
s $
Th
ou
san
ds
Years
Algerian Imports from EU
Algerian Imports from Non-EU
Total Algerian Imports
Domestic production

24
Figure 4.12: Evolution of Algerian imports and the domestic production in the machinery
and transport equipment (SITC 7) sector, in $ thousands.
Source: UNCTAD STAT database (2011).
From Figure 4.12, it can be stated that both Algerian imports and domestic production were
increasing throughout the period.
Findings
The qualitative study confirms the potential impact identified in the ex-ante analysis. It shows
that both Algerian imports and exports from and to EU and non-EU countries have increased
significantly since the implementation of the A.A. This growth was faster between 2005 and
2010 than in the period 2000-2005. This suggests that:
(1) No trade diversion has occurred as both imports and exports towards non-EU countries
have increased, and
(2) Trade creation has taken place as the total Algerian trade has increased.
In other words, it reflects that the Association Agreement had increased trade between
Algeria and the EU, and this was not at the expense of trade with non-EU partners.
0
20000000
40000000
60000000
80000000
100000000
120000000
2005 2006 2007 2008
Val
ue
s $
Th
ou
san
ds
Years
Algerian Imports from EU
Algerian Imports from Non-EU
Total Algerian Imports
Domestic production

25
Furthermore, the qualitative evaluation conducted on the most traded sectors in the Algerian
economy shows that, in sectors such as chemicals and related products and machinery and
transport equipment, both total imports and imports from non-EU countries have increased.
This confirms that no trade diversion has occurred, and therefore a positive economic welfare
has resulted. Nonetheless, the increase noted in non-hydrocarbon exports was marginal
compared with the growth in imports’ shares. This means that Algerian trade still has an
imbalance and the agreement did not contribute to regulate. The next analysis attempts to
approximately quantify the rise in economic welfare observed in the Algerian economy after
the Association Agreement implementation.
4.2.2. Quantitative Analysis
This analysis uses observed trade values to compute changes in volumes and terms of trade.
The computation is realised according to a model developed by Lloyd and Mclaren (2004).
This evaluation attempts to quantify the gain or loss engendered by Algeria from the EU
partnership.
It is important to note that the evaluation is limited to only the most traded products. These
are classified by sector, and do not include hydrocarbons which was not involved in the
agreement. The selected sectors are classified using the SITC classification:
SITC 0: food and live animals
SITC 5: chemicals and related products
SITC 6: manufactured goods
SITC 7: machinery and transport equipment
The ex-ante analysis has shown that changes in exports were relatively marginal compared
with changes in imports. Therefore, changes in trade volume calculations involve only
imports. According to Lloyd and Maclaren’s model, the total of bilateral changes in volumes
26
should be weighted by tariffs in a base period. In the present evaluation, 2004 is used as the
base period, whereas 2009 is considered as the new period. Data on applied import tariffs are
extracted from the International Customs Tariffs Bureau (ICTB). The changes in trade
volume are computed using the following formula stated in the methodology (see 3.2).
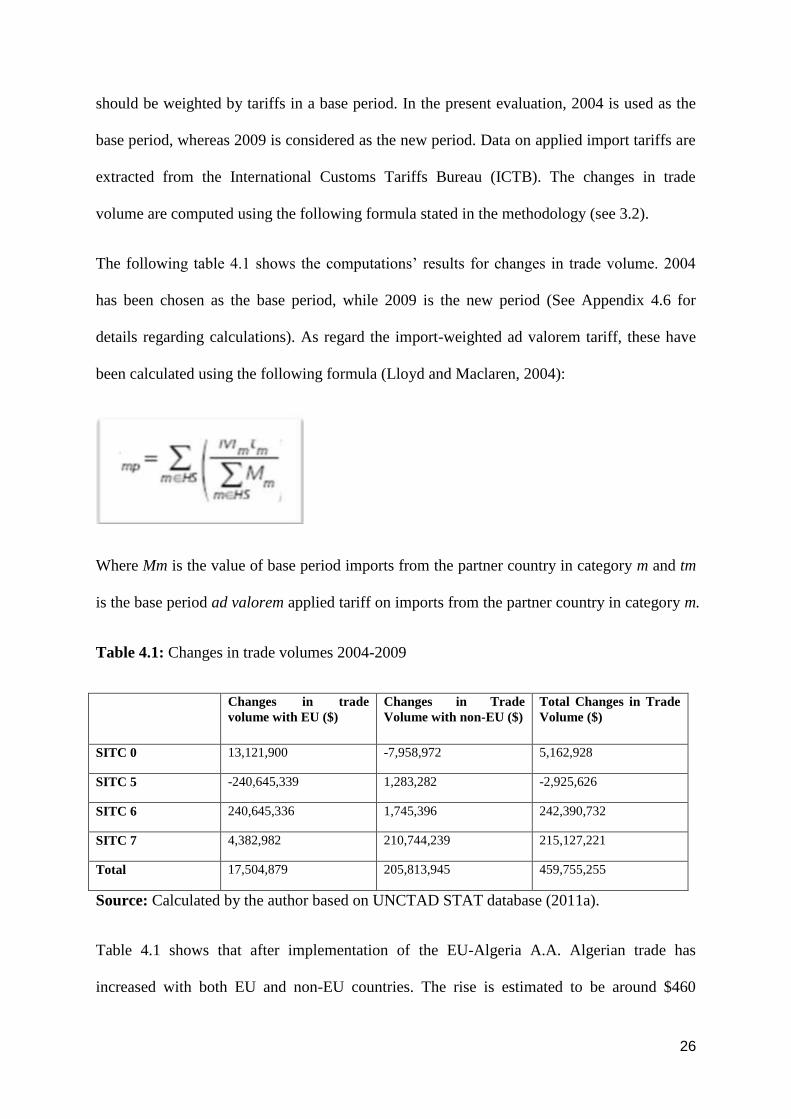
The following table 4.1 shows the computations’ results for changes in trade volume. 2004
has been chosen as the base period, while 2009 is the new period (See Appendix 4.6 for
details regarding calculations). As regard the import-weighted ad valorem tariff, these have
been calculated using the following formula (Lloyd and Maclaren, 2004):
Where Mm is the value of base period imports from the partner country in category m and tm
is the base period ad valorem applied tariff on imports from the partner country in category m.
Table 4.1: Changes in trade volumes 2004-2009
Changes in trade
volume with EU ($)
Changes in Trade
Volume with non-EU ($)
Total Changes in Trade
Volume ($)
SITC 0 13,121,900 -7,958,972 5,162,928
SITC 5 -240,645,339 1,283,282 -2,925,626
SITC 6 240,645,336 1,745,396 242,390,732
SITC 7 4,382,982 210,744,239 215,127,221
Total 17,504,879 205,813,945 459,755,255
Source: Calculated by the author based on UNCTAD STAT database (2011a).
Table 4.1 shows that after implementation of the EU-Algeria A.A. Algerian trade has
increased with both EU and non-EU countries. The rise is estimated to be around $460

27
million during the four first years of the agreement. This is positive, indicating that the EU-
Algeria FTA has created trade internally and externally. However, this value is based only on
the most imported products and not on all Algerian imports. Thus, this estimation should be
considered as a representative value, and not the real value.
Changes in terms of trade
In order to complete the evaluation, changes in Algeria’s terms of trade with respect to EU
and non-EU partners are also calculated. According to Lloyd and Maclaren’s model (2004)
change in the terms of trade should be weighted by base period trade quantities. The formula
presented in the methodology is used (see 3.2).
Table 4.2 shows the computations’ results for changes in terms of trade between
2004 and 2009.
Table 4.2: Changes in terms of trade 2004-2009.
Changes in terms of Changes in terms of Total Changes terms
trade with EU ($) trade with non-EU ($) of trade Volume ($)
SITC 0 -339,686,289 -158,745,533 -498,431,822
SITC 5 -366, 987,433 5, 592,448.85 -361,394,984
SITC 6 22, 817,899.4 -1, 896,290,743 -1,873,472,844
SITC 7 58,622,231 -7,113,304 51,508,927
Total -625,233,592 -2,056,557,131 -2,681,790,723
Source: calculated by the author based on UNCTAD STAT (2011).
It is clear from Table 4.2 that changes in the terms of trade with respect to EU countries and
non-EU countries were approximately –$2.7 billion. This is negative, which reflects that 4
years after the entry into force of the A.A. economic welfare was reduced. Nevertheless, it is
important to note that this trade index is based only on the non-hydrocarbon sector.
28
Findings
The quantitative study indicates that the EU-Algeria A.A has led to positive trade creation
through an increase in intraregional and extra-regional trade. However, the agreement was
unable to regulate the “huge” imbalance in Algerian imports and non-hydrocarbon exports.
This has led to a decline in the non-hydrocarbon sector, in terms of trade, estimated at around
$2.7 billion between 2004 and 2009.
5. Conclusion
The ex-ante analysis has shown that the EU-Algeria RTA was expected to increase trade
within the region. This increase would not be at the expense of extra-regional trade as
indicators showed that the two partners were initially natural trading partners and therefore
the agreement was more likely to be trade creating rather than trade diverting. The Literature
Review revealed that if a RTA is undertaken with natural trading partners, trade creation will
be greater than trade diversion and economic welfare will increase (Baghwati, 2008).
This was confirmed by the ex-post analysis. The qualitative study showed that the A.A has
positively influenced Algerian trade and led to trade creation in most of the sectors. This
indicates that Algerian economic welfare increased after the A.A implementation and
confirms the statement and findings of a number of past studies, who argued that RTAs create
trade and improve economic welfare (Allen et al, 1996; Sapir, 2000; Baghwati, 2008).
On the other hand, the quantitative study indicated that although economic welfare increased
after the A.A implementation, it remains negative. The evaluation, based on the general
equilibrium model of Lloyd and Maclaren (2004), revealed that the loss in terms of trade was
estimated at around $2.7 billion from the entry into force of the partnership. It can be
concluded that, with respect to the EU-Algeria FTA’s trade effects, the impact was positive
29
yet still insufficient to cover the existing imbalance between Algeria’s imports and its non-
hydrocarbon exports. This leads to the conclusion that the agreement did not fulfil the
objective set by the Algerian government, which was reducing the non-hydrocarbon trade
imbalance.
It is argued that a RTA alone is not sufficient to regulate this imbalance. An appropriate
environment for exports has to be provided and companies should be also ready. This is not
the case in Algeria. It is stated that although the government provides assistance to exporting
companies, this remain insufficient and ineffective. It is also argued that most of the domestic
companies do not consider exports as a priority and are more locally oriented; managers tend
to focus on the growing and advantageous local market rather than risky foreign markets
(Nancy et al, 2009). Finally, according to the World Bank (2010), Algeria was ranked 124
out of 183 countries in the “trading across borders” classification, which confirms that
exports in non-hydrocarbon sectors do not play an important role in the economy of the
country.
Limitations
This research has been limited by the difficulties of accessing data on Algerian trade and
investment. Certain data had to be collected via direct private communication and through
contacts working for the organisations concerned. Furthermore, some data displayed in these
organisations’ websites appeared to be inaccurate and imprecise. In addition, the research has
suffered from inconsistencies of data. Indeed, it was observed that for particular trade data,
organisations were providing different values. Consequently, it is important to highlight that,
especially for the quantitative analysis, numerical findings should be considered only as
indicative estimates and not as definitive values.

30
Recommendations
Overall, this dissertation has shown that the impact of the EU-Algeria A.A has had a positive,
though marginal, influence on trade, economic welfare and inward investment into Algeria. It
is argued that the small influence was due to internal inefficiencies in the Algerian economy.
Therefore, in order to take full advantage of the Free Trade Area established between Algeria
and the EU certain measures should be taken by the government with respect to non-
hydrocarbon exports and inward FDI. The following are a number of recommendations that
may be useful to achieve this aim:
Define an export strategy with both qualitative and quantitative objectives, in order to
assess and evaluate the improvements
Develop an adequate and reliable infrastructure for exports
Assist and help effectively domestic companies in their upgrading procedures and
international certification processes
Develop “export committees” which will belong to the Algerian chambers of
commerce, and whose mission will be:
To identify companies with export potential
To offer training courses to managers who wish to export
To undertake export awareness campaigns targeted at Algerian domestic
companies, in order to promote exports.
To assist and help domestic companies to develop their export activities by
linking them with export channels. This can be facilitated by collaboration
with Algerian embassies and consulates abroad.
To assist companies to participate in international fairs and exhibitions
To Identify barriers to inward investments
Ensure there is effective co-ordination of data between all relevant government bodies
in order to make available accurate and consistent information that will be beneficial
to investors or researchers.

31
Finally, future research should investigate the role of government in increasing the non-
hydrocarbon exports. It is acknowledged that exports play a significant role in improving
economic growth (Balassa, 1978; Krueger, 1997; Onafowora and Owoye, 1998).

32
References
ADAMS, R. DEE, P. GALI, J. & McGUIRE, G. (2003) The trade and investment
effects of preferential trading arrangements: Old and new evidence. Staff Working
Paper. Australia Productivity Commission. Canberra.
ALLEN, B. GASIOREK, A. and SMITH, M. (1996) “Trade creation and trade
diversion”. The Single Market Review Series [Online] Available at
http://ec.europa.eu/internal_market/economicreports/docs/studies/stud12_en.pdf
[Accessed 17th February 2011].
ALGERIAN CUSTOMS DEPARTMENT (2011) International Trade Statistics.
Available at http://www.douane.gov.dz/cnis/stat/ent_statis.asp [Accessed: 28th
February 2011].
BALASSA, B. (1965) Trade Liberalisation and “Revealed” Comparative Advantage.
The Manchester School, 33, 99-123.
BALASSA, B. (1978) Exports and economic growth: Further evidence. Journal of
Development Economics, 5, 181-189.
BHAGWATI, J. N. (2008) Termites in the trading system: how preferential
agreements undermine free trade, Oxford; New York, Oxford University Press.
DE ROSA, D. A. (2007) Trade effects of preferential arrangements new evidence
from the Australia productivity commission. Washington, DC: Peterson Institute for
International Economics.
DENNIS, A. & WORLD, B. (2006) The impact of regional trade agreements and
trade facilitation in the Middle East and North Africa region. Washington, D.C.:
World Bank.
CLAUSING, K. A. (2001). Trade creation and trade diversion in the Canada–United
States free trade agreement. Canadian Journal of Economics, 34(3), 677-696.
FRANKEL, J. STEIN E. & WEI S.J. (1995) Trading blocs and the Americas: the
natural, the unnatural, and the super-natural. Journal of Development Economics.
47:61-95.

33
FREUND, C. & ORNELAS, E. (2010) Regional Trade Agreements. Washington,
D.C.: The World Bank.
GRIMWADE, N. (1989) International trade: new patterns of trade, production, and
investment, London; New York, Routledge.
KRUEGER, A. O. 1997. Trade Policy and Economic Development: How We Learn.
National Bureau of Economic Research Working Paper Series, No. 5896.
KRUGMAN, P.R. & OBSTFIELD, M. (2003) International Economics Theory and
policy. 6th
edition. USA: Pearson education International.
LAPADRE, L & PROIETTI, A. (2009) Statistical analysis of international trade and
production: towards a scoreboard of indicators. OECD TRADE INDICATORS
PROJECT.
LLOYD, P. J. & MACLAREN, D. (2004) Gains and Losses from Regional Trading
Agreements: A Survey. Economic Record, 80, 445-467.
MAGEE C. (2008) New measures of trade creation and trade diversion. Journal of
International Economics. 75:340-62.
MIKIC, M. & J. GILBERT. (2007) Trade Statistics in Policymaking—A Handbook of
Commonly Used Trade Indices and Indicators. Studies in Trade and Investment,
Trade Policy Section, Trade and Investment Division. UNESCAP.
NANCY, G. KREITEM, B & PICOT, B. (2009) Evaluation de l’etat d’execution de
l’Accord d’Association Algerie-UE. Algeria : Ministere du commerce. Translated
from French by M. Haddoud.
ONAFOWORA, O. A. & OWOYE, O. (1998) Can Trade Liberalization Stimulate
Economic Growth in Africa? World Development, 26, 497-506.
PANAGARIYA, A. (2002) EU preferential trade arrangements and developing
countries. The World Economy, 25(10), 1415-1432.
PERIDY, N. (2005) The trade effects of the Euro–Mediterranean partnership: what
are the lessons for ASEAN countries? Journal of Asian Economics, 16, 125-139.

34
PLUMMER, M.G. CHEONG, D. & HAMANAKA, S. (2010) Methodology for
impact assessment of free trade agreements. Asian Development Bank.
ROMALIS J. (2007) NAFTA’s and CUSFTA’s impact on international trade. Review
of Economics and Statistics. Vol.89, 416-35.
SAPIR, A. (2001) Domino effects in Western European regional trade, 1960–
1992. European Journal of Political Economy, 17(2), 377-388.
UNITED NATION CONFERENCE ON TRADE AND DEVELOPMENT STAT
(2011) International trade: Algeria. Available at
http://unctadstat.unctad.org/ReportFolders/reportFolders.aspx?sCS_referer=&sCS_Ch
osenLang=en [Accessed: 05th
March 2011].
VINER, J. (1950) The Customs Union Issue. Washington, D.C.: Carnegie Endowment
for International Peace. In World Bank. (2000). Trade blocs. Research Policy Report.
Oxford: University Press.
WANG, N. (2010) The Relationship between Regional Trading Blocs and
Globalisation. International journal of economics and finance.
WONNACOTT, P, LUTZ, M. (1989) Is there a case for free trade areas? In Free
trade areas and U.S. trade policy, ed. JJ Schott, pp. 59-84. Washington, D.C.: Institute
for International Economics.
WORLD BANK (2011) Doing Business in Algeria. Available at
http://www.doingbusiness.org/data/exploreeconomies/algeria [Accessed: 26th
March
2011].