Embed Size (px)
Citation preview
Inclusive and Sustainable Industrial Development Working Paper Series WP 20 | 2019
THE IMPACT OF NEW DIGITAL TECHNOLOGIES ON GENDER EQUALITY IN DEVELOPING COUNTRIES
DEPARTMENT OF POLICY, RESEARCH AND STATISTICS
WORKING PAPER 20/2019
The impact of new digital technologies on gender equality in developing countries
Alina Sorgner John Cabot University Rome, Kiel Institute for the World Economy and Institute of
Labor Economics
UNITED NATIONS INDUSTRIAL DEVELOPMENT ORGANIZATION Vienna, 2019
Acknowledgments
The author thanks Isha Mandal and Virginia Tartabini for their excellent research assistance.
This is a Background Paper for the UNIDO Industrial Development Report 2020: Industrializing
in the Digital Age.
The designations employed, descriptions and classifications of countries, and the presentation of the material in this report do not imply the expression of any opinion whatsoever on the part of the Secretariat of the United Nations Industrial Development Organization (UNIDO) concerning the legal status of any country, territory, city or area or of its authorities, or concerning the delimitation of its frontiers or boundaries, or its economic system or degree of development. The views expressed in this paper do not necessarily reflect the views of the Secretariat of the UNIDO. The responsibility for opinions expressed rests solely with the authors, and publication does not constitute an endorsement by UNIDO. Although great care has been taken to maintain the accuracy of information herein, neither UNIDO nor its member States assume any responsibility for consequences which may arise from the use of the material. Terms such as “developed”, “industrialized” and “developing” are intended for statistical convenience and do not necessarily express a judgment. Any indication of, or reference to, a country, institution or other legal entity does not constitute an endorsement. Information contained herein may be freely quoted or reprinted but acknowledgement is requested. This report has been produced without formal United Nations editing.
iii
Table of Contents
1. Introduction ........................................................................................................................... 1
2. Literature review ................................................................................................................... 3
2.1. Evidence on the effects of new digital technologies on labour markets ....................... 3
2.2. Evidence on gender differences in the effects of new digital technologies................... 5
3. Data sources and measurement issues ................................................................................... 7
3.1. STEP Skills Measurement Survey ................................................................................ 7
3.2. Measurement of skills in STEP Skills Measurement Survey ........................................ 8
3.3. Digitalization measures ............................................................................................... 10
4. Results ................................................................................................................................. 16
4.1. Descriptive statistics .................................................................................................... 16
4.2. Gender-specific differences in skill endowments across sectors in developing
countries .................................................................................................................................. 21
4.3. Impacts of new digital technologies on women’s and men’s jobs in developing
countries .................................................................................................................................. 26
5. Conclusions ......................................................................................................................... 34
References ................................................................................................................................... 37
Appendix ..................................................................................................................................... 40
List of Figures
Figure 1: Computerization probabilities before and after correction .......................................... 12
Figure 2: Distribution of countries in the full sample ................................................................. 17
Figure 3: Gender-specific composition of the manufacturing sector, full sample ...................... 19
Figure 4: Gender-specific composition of the service sector, full sample .................................. 19
Figure 5: Gender differences in analytical skills ......................................................................... 22
Figure 6: Gender differences in routine and non-routine manual skills ...................................... 23
Figure 7: Gender differences in non-routine interpersonal and ICT skills .................................. 24
Figure 8: Gender differences in socio-emotional skills ............................................................... 24
Figure 9: Mean values of computerization risk in the manufacturing sector, by gender and formal level of education ........................................................................................................ 30
Figure 10: Mean values of advances in AI in the manufacturing sector, by gender and formal level of education ................................................................................................................. 31
iv
List of Tables
Table 1: Measurement of skills in STEP ....................................................................................... 9
Table 2: Descriptive statistics for digitalization measures .......................................................... 14
Table 3: Correlation between digitalization measures and skills ................................................ 15
Table 4: Distribution of individuals in the sample by country, gender and sector ...................... 18
Table 5: Gender differences in educational attainment by industrial sector, in % ...................... 20
Table 6: Gender differences in educational attainment in the manufacturing sector’s subsectors, in % ............................................................................................................................... 21
Table 7: Mean values of digitalization measures, by gender and industrial sector ..................... 27
Table 8: Measures of digitalization by gender, level of formal education and sector ................. 29
Table 9: Individual-level determinants of digitalization measures ............................................. 32
v
Abstract
This paper investigates the impact of new digital technologies, including advances in artificial
intelligence, on men’s and women’s jobs across sectors in developing and transition economies.
On the one hand, new digital technologies may have destructive effects on jobs when they replace
human workers. On the other hand, they may have transformative effects by changing occupations
without necessarily substituting human workers. This paper uses two measures, the
computerization probabilities estimated by Frey and Osborne (2017) and past advances achieved
in artificial intelligence provided by Felten et al. (2018) to better account for different aspects of
digitalization. The empirical analysis is based on the large representative STEP Skill
Measurement Surveys of individuals residing in urban areas of selected developing and transition
countries. The results suggest that there are strong gender differences concerning skill
endowments, which represent the bottlenecks to computerization. Women in developing and
transition economies are significantly less likely than men to have skills that protect them from
the destructive digitalization, namely analytical, non-routine manual, interpersonal, advanced ICT
and socio-emotional skills. This result is robust across sectors, but gender differences are more
pronounced in manufacturing than in services. Moreover, the results reveal that women on
average face a higher computerization risk (destructive digitalization) of their jobs than men.
However, women are less likely to benefit from advances in AI (transformative digitalization).
For both measures of digitalization, the results are more pronounced for the manufacturing sector
than for services. In addition, a higher level of formal education decreases the impact of
destructive digitalization; however, highly educated individuals are more strongly affected by
transformative digitalization. Implications of the results for policymakers are discussed.
Keywords: digitalization, artificial intelligence, gender equality, skills, developing economies,
transition economies, manufacturing, services
JEL classification: J16, J24, O14, O33
1
1. Introduction
Recently, digitalization has attracted the attention of researchers and policymakers as a promising
means to achieve more gender equality in labour markets. New digital technologies provide
opportunities by promoting women’s labour market participation and facilitating their financial-
and digital inclusion, thus, leading to more economic welfare (European Commission, 2018;
EIGE, 2018; OECD, 2017, 2018; Sorgner et al., 2017). Current developments in the field of new
digital technologies, including artificial intelligence, machine learning algorithms, cloud
computing and dexterous robotics, among others, have a strong potential to substantially change
labour markets as we know them today (Brynjolfsson and McAfee, 2014; Frey and Osborne,
2017). These impacts may be destructive when a digital technology replaces human labour. The
effects of digitalization may also be transformative, however, for instance, when a digital
technology complements human labour without necessarily replacing it. Transformative digital
technologies are likely to generate positive spillovers and create new employment opportunities
in both paid employment and self-employment (Fossen and Sorgner, 2019a). At the same time,
they pose major challenges to workers in occupations affected by transformative digitalization,
as these workers must adapt to these changes in order to take advantage of the opportunities the
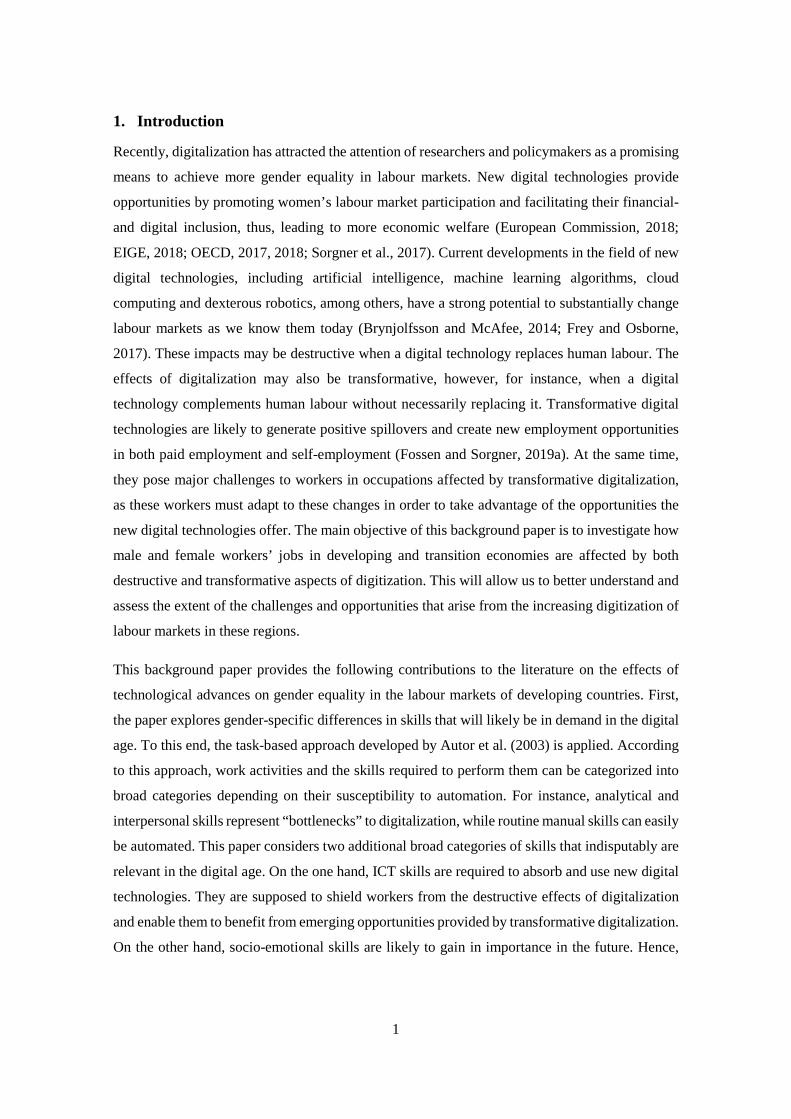
new digital technologies offer. The main objective of this background paper is to investigate how
male and female workers’ jobs in developing and transition economies are affected by both
destructive and transformative aspects of digitization. This will allow us to better understand and
assess the extent of the challenges and opportunities that arise from the increasing digitization of
labour markets in these regions.
This background paper provides the following contributions to the literature on the effects of
technological advances on gender equality in the labour markets of developing countries. First,
the paper explores gender-specific differences in skills that will likely be in demand in the digital
age. To this end, the task-based approach developed by Autor et al. (2003) is applied. According
to this approach, work activities and the skills required to perform them can be categorized into
broad categories depending on their susceptibility to automation. For instance, analytical and
interpersonal skills represent “bottlenecks” to digitalization, while routine manual skills can easily
be automated. This paper considers two additional broad categories of skills that indisputably are
relevant in the digital age. On the one hand, ICT skills are required to absorb and use new digital
technologies. They are supposed to shield workers from the destructive effects of digitalization
and enable them to benefit from emerging opportunities provided by transformative digitalization.
On the other hand, socio-emotional skills are likely to gain in importance in the future. Hence,
2
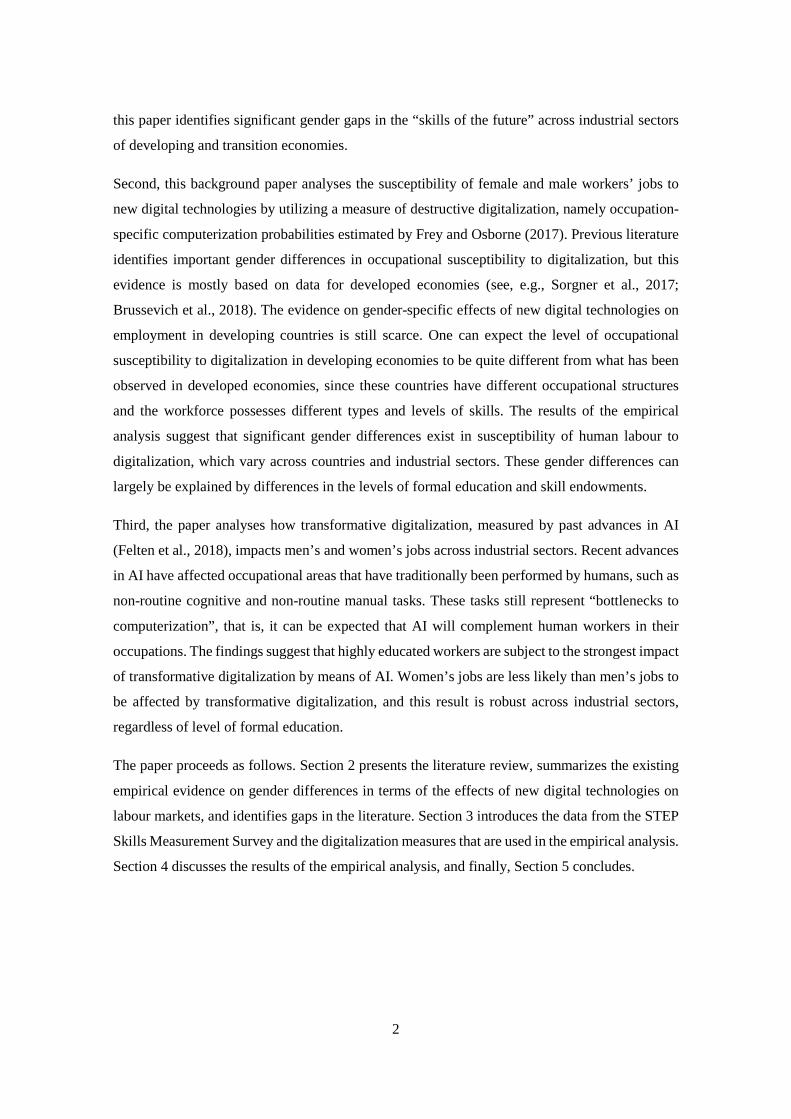
this paper identifies significant gender gaps in the “skills of the future” across industrial sectors
of developing and transition economies.
Second, this background paper analyses the susceptibility of female and male workers’ jobs to
new digital technologies by utilizing a measure of destructive digitalization, namely occupation-
specific computerization probabilities estimated by Frey and Osborne (2017). Previous literature
identifies important gender differences in occupational susceptibility to digitalization, but this
evidence is mostly based on data for developed economies (see, e.g., Sorgner et al., 2017;
Brussevich et al., 2018). The evidence on gender-specific effects of new digital technologies on
employment in developing countries is still scarce. One can expect the level of occupational
susceptibility to digitalization in developing economies to be quite different from what has been
observed in developed economies, since these countries have different occupational structures
and the workforce possesses different types and levels of skills. The results of the empirical
analysis suggest that significant gender differences exist in susceptibility of human labour to
digitalization, which vary across countries and industrial sectors. These gender differences can
largely be explained by differences in the levels of formal education and skill endowments.
Third, the paper analyses how transformative digitalization, measured by past advances in AI
(Felten et al., 2018), impacts men’s and women’s jobs across industrial sectors. Recent advances
in AI have affected occupational areas that have traditionally been performed by humans, such as
non-routine cognitive and non-routine manual tasks. These tasks still represent “bottlenecks to
computerization”, that is, it can be expected that AI will complement human workers in their
occupations. The findings suggest that highly educated workers are subject to the strongest impact
of transformative digitalization by means of AI. Women’s jobs are less likely than men’s jobs to
be affected by transformative digitalization, and this result is robust across industrial sectors,
regardless of level of formal education.
The paper proceeds as follows. Section 2 presents the literature review, summarizes the existing
empirical evidence on gender differences in terms of the effects of new digital technologies on
labour markets, and identifies gaps in the literature. Section 3 introduces the data from the STEP
Skills Measurement Survey and the digitalization measures that are used in the empirical analysis.
Section 4 discusses the results of the empirical analysis, and finally, Section 5 concludes.
3
2. Literature review
2.1. Evidence on the effects of new digital technologies on labour markets
Previous literature on the impacts of technological advances on labour markets primarily uses the
task-based approach proposed by Autor et al. (2003). According to the task approach, jobs consist
of two broad sets of tasks. On the one hand, abstract tasks require problem-solving capabilities,
creativity and persuasion. On the other hand, manual tasks require situational adaptability, visual
and language recognition, among others. These two broad sets can be further divided into routine
and non-routine tasks. In the past decades, computers and robots could replace humans in job
tasks that could be easily codified, such as routine manual tasks (e.g. repetitive movements in
structured environments) and routine cognitive tasks (e.g. arithmetic calculations). By contrast,
non-routine cognitive tasks (e.g. abstract and interpersonal tasks) and non-routine manual tasks
(e.g. manual dexterity) that are usually performed in unstructured environments were more
difficult to automate. Thus, machines could not replace human workers in these areas, but rather
supplemented them (Autor et al., 2003; Acemoglu and Autor, 2011; Autor, 2015). Consequently,
demand for workers in jobs that strongly rely on tasks that constitute bottlenecks to automation
increased, while demand for workers in jobs associated with tasks that could easily be performed
by machines declined. Empirical evidence supports this argumentation by suggesting that labour
markets increasingly reward social skills (Deming, 2017) and ICT skills (De La Rica and
Gortazar, 2017). In addition, the task-based approach explains the growing polarization of labour
markets in many developed countries, which is evident by the increasing shares of low-skilled
and high-skilled employment in jobs involving less automatable tasks (Goos et al., 2014; Autor,
2015).
The evidence on the effects of automation on labour markets in developing economies is less
clear. There are several reasons why trends in developing countries may differ from those in
developed countries. For example, the occupational structure of labour markets in developing
countries differs from that in developed countries in that a higher share of employment in
developing countries has rather low levels of formal education, in addition to being involved in
craft production and agriculture. Moreover, offshored jobs from developed to less developed
countries tend to be carried out by low-skilled workers (Becker et al., 2013). Many of these low-
skilled jobs involve non-routine tasks that cannot be easily computerized.1 Maloney and Molina
(2016) observe that the share of employment in occupations such as machine and plant operators
1 An example could be an occupation of content moderators who, for instance, weed out inappropriate content published on social media networks. This occupation only requires fairly low levels of formal education, but also strongly relies on non-routine skills, such as image-, video- and speech recognition, where advances in AI have been particularly fast. This occupation is mostly performed in developing countries.
4
and assemblers has not changed significantly over time in developing countries. This latter finding
leads them to conclude that there is no strong evidence of labour market polarization in these
countries. They do, however, also find an indication of potential polarization in some countries
(in particular, in Indonesia, Brazil and Mexico). In addition, the World Bank (2016) reports that
the share of middle-skilled employment has decreased in many developing countries, with the
exception of China and several countries in Central Asia and Latin America, which can be
considered an indication of labour market polarization in these countries.
The most recent advances in digital technologies, including machine learning algorithms and
cloud computing, have improved the performance of machines in fields that traditionally
employed human workers. Machines have increasingly become able to substitute human workers
in jobs that rely on many non-routine cognitive tasks, such as image, video and speech
recognition, natural language processing, generating computer programmes and emotions
identification, among others. Additionally, advances in robotics have increased the level of
dexterity of robots, thus, allowing machines to perform more non-routine manual tasks that are
widespread in manufacturing sectors (Brynjolfsson and McAfee, 2014; Graetz and Michaels,
2018; Frey and Osborne, 2017).
A method to assess the impact of new digital technologies on the labour markets has been
proposed by Frey and Osborne (2017). They developed a measure of computerization risk of
occupations, which captures the predicted risk of replacement of human workers according to
expert judgments. The authors conclude that 47 per cent of the U.S. labour force is currently in
jobs that face a high risk (more than 70 per cent likelihood) of being computerized in the near
future. This study has been replicated for many developed countries, including a selected sample
of European countries (Berger and Frey, 2016), OECD countries (Arntz et al., 2016), and selected
G20 countries (Sorgner et al., 2017), among others. These studies find that the average risk of
computerization varies considerably within and between occupations and across countries. As a
matter of fact, the variation within occupations is attributable to strong variations of job-specific
tasks (Arntz et al., 2017), while the variation across countries is at least partly attributable to
country-specific differences in the occupational structure of local labour markets.
This analysis has also been performed in several developing countries. For instance, a study by
Chang and Huynh (2016) uses the methodology developed by Frey and Osborne (2017) for five
ASEAN countries (Cambodia, Indonesia, the Philippines, Thailand and Viet Nam). The authors
report that about 56 per cent of employment in these countries is at high risk of displacement.
5
They further conclude that countries in which the manufacturing sector is dominated by garment
and textile production face a particularly high computerization risk.2
2.2. Evidence on gender differences in the effects of new digital technologies
There are several reasons why one should expect to discover gender-specific differences in the
effects of new digital technologies on labour markets. First, women are more likely to make
different occupational choices than men. In general, women across countries are significantly less
likely than men to choose one of the STEM (Science, Technology, Engineering and Mathematics)
occupations (Stoet and Geary, 2018; Ramirez and Kwak, 2015). These occupations require
advanced analytical and ICT skills, increasingly considered to be more important in the digital
era. Indeed, jobs will require workers to possess skills that are likely to be complemented, not
replaced, by digital technologies. Several studies report a significant digital gender divide, that is,
lower access to and usage of digital technologies by women than men, which is particularly
pronounced in less developed countries (Mariscal et al., 2019; Sorgner et al. 2017). This digital
gender divide is likely to be the result of poor education and unfavourable employment
opportunities rather than negative attitudes towards new technologies (Rashid, 2016; Hilbert,
2011). Second, there are pronounced gender gaps in skill endowments, which cannot be entirely
explained by differences in occupational choices. For instance, women appear to lack managerial
competencies, which is partly due to the low share of women in managerial positions. Women
also often lack entrepreneurship-relevant skills, which are needed to identify and pursue a
profitable entrepreneurial opportunity or to become an intrapreneur within existing organizations
(Strohmeyer et al., 2017; Schein, 2001). New digital technologies are an important source of
entrepreneurial opportunities, which may not be fully accessible to women because they lack
some of the necessary entrepreneurial competencies and experience in STEM sectors, including
ICT. Hence, one can expect that women might not benefit from the opportunities offered by digital
technologies, given the existing gender differences in occupational choices and the gender gaps
in skill endowments. Moreover, the lack of the above-mentioned skills may make women more
vulnerable to the destructive digitalization compared to men.
On the other hand, it appears likely that the demand for jobs in traditionally female-dominated
sectors, such as health, education and social services will grow in the future. These jobs rely on
competencies such as social and emotional intelligence. Bode et al. (2018) examined the case of
Germany and show that non-cognitive skills, such as the Big Five dimensions of personality, play
2 It is worth noting, however, that the rise of the garment industry in several developing countries had positive effects on women’s educational attainment, since formal education is rewarded in garment factories (see Heath and Mobarak, 2015, for the case of Bangladesh).
6
an important role in explaining individual differences in the computerization risk. Individuals
with high openness to experience and high emotional stability were particularly likely to have a
low risk of computerization. Deming (2017) shows that demand for social skills has increased
considerably in the U.S. in the last decades, a change that was accompanied by increasing returns
to social skills. Empirical evidence on gender differences in “soft” skills is rather mixed. For
instance, gender differences in empathy, that is, the ability to understand and identify with the
internal state of others, have been reported in various studies, suggesting that women demonstrate
higher levels of empathy and pro-social behaviour than males. This appears to be attributable to
both genetic predispositions and social influences, such as gender-specific role models that
prevail in a society (Christov-Moore et al., 2014). Gender differences in non-cognitive skills, such
as the Big Five dimensions of personality, have been reported across cultures. For instance,
women appear to score significantly lower than men on openness to experience and emotional
stability, but score significantly higher on agreeableness, conscientiousness and extraversion
(Schmitt et al., 2008, 2017; Weisberg et al., 2011). In general, one can expect that the development
of certain types of “soft” skills, such as social and leadership skills could be hampered among
women, partly due to poor access to social networks and managerial positions among them.
Several studies have analysed the susceptibility of the female workforce to destructive
digitalization. Brussevich et al. (2018), for instance, analyse the susceptibility of female workers
to digitalization using PIAAC data, which mostly include developed OECD countries. Despite
the strong variation of results between countries, they generally find that women are more likely
than men to perform routine tasks that can be substituted by machines, but they are also less likely
to perform analytical and abstract tasks that can be complemented by machines. Employing the
measure of computerization risk developed by Frey and Osborne (2017), they further show that
less educated and older female workers, as well as female workers in clerical, service and sales
positions, are even more susceptible to automation. Moreover, Sorgner et al. (2017) study the
effects of digitalization on gender equality in labour market participation in selected G20
countries. These authors report that the computerization risk is not distributed evenly among
women’s and men’s jobs. In fact, they find that the computerization risk decreases with an
increasing level of formal education for both genders, but low-skilled women face lower risk of
computerization, on average, compared to low-skilled men. This result is likely attributable to the
fact that many jobs typically held by low-skilled women require high non-routine manual skills
that still represent bottlenecks to automation, while low-skilled men are more likely to hold
routine task-intensive jobs that can be easily automated.
7
To summarize, previous literature has employed the task approach developed by Autor et al.
(2003) to explain the effects of technological advances on labour markets. Empirical evidence
suggests that digitalization has contributed to increasing labour market polarization in developed
countries, while the evidence for developing countries is less clear. Over the last decades, digital
technologies have been replacing human workers in areas that require routine manual and routine
cognitive skills, but recent advances in AI and robotics seem to have significantly improved the
performance of machines in the fields that require non-routine manual and non-routine cognitive
skills. This notwithstanding, the question arises how these advances in new digital technologies
affect male and female workers. Existing evidence on gender differences in terms of the effects
of digitalization mostly focusses on the differences in educational attainment, employment
opportunities and gender gaps, for instance, in ICT and leadership skills, and emphasizes the
importance of those skills to successfully deal with the challenges of digitalization. Moreover,
several studies report gender differences in the destructive effects of new digital technologies on
employment in developed countries, but evidence for developing countries is largely missing.
Furthermore, there is a lack of evidence on how transformative digitalization, which alters the
content of jobs without necessarily replacing human workers, affects male and female workers in
developing countries. Finally, it is also unclear whether new digital technologies affect male and
female workers differently across industrial sectors.
3. Data sources and measurement issues
3.1. STEP Skills Measurement Survey
For the purpose of the present study, the data collected within the Skills Towards Employability
and Productivity (STEP) programme are used as a main data source. The objective of the STEP
programme designed by the World Bank was to generate internationally comparable data on skills
of the adult population in developing countries. These data are comparable to the Survey of Adult
Skills (PIAAC) developed by the OECD. While the focus of PIAAC is primarily on high-income
developed countries, the STEP programme focusses on developing and transition economies. The
STEP programme implements standardized surveys to gather information on the supply and
distribution of skills and the demand for skills in the labour market of low-income countries. So
far, STEP has been administered in two waves, in 2012 and 2013, in 13 countries: Armenia,
Bolivia, Colombia, Georgia, Ghana, Kenya, Laos, North Macedonia, Philippines, Sri Lanka, the
Ukraine, Viet Nam and Yunnan Province (People’s Republic of China).3
3 The Philippines is excluded from this study because data on the main variables were not comparable with other countries. Moreover, Yunnan Province (People’s Republic of China) was excluded from the analysis, because this region is not representative of the entire country.
8
The STEP programme consists of two survey instruments. On the one hand, the STEP household
surveys conducted in 2012 and 20134 provide detailed information on an individual’s socio-
demographic characteristics and job characteristics. In addition, the household surveys include
modules that measure cognitive skills, job-related skills and socio-emotional skills of a
representative sample of adults aged between 15 and 64, residing in urban municipalities (see
Pierre et al., 2014 for the detailed description of the STEP surveys methodology). On the other
hand, the STEP employer survey aims to assess the structure of the labour force, the skills that
employers look for when hiring new workers, and the constraints employers face when hiring
new employees, among others.
STEP surveys provide detailed gender disaggregated data, which makes them suitable for the
purpose of the present study. The household roster of the survey provides detailed information on
socio-demographic characteristics (for instance, age and marital status, highest level of formal
education achieved) and current labour market situation of respondents (for instance, employment
status, main occupation, industrial sector). For the purpose of the present study, only currently
employed (wage employed and self-employed) individuals are considered. Unemployed
individuals, retirees, helping family members and respondents who are currently in education are
not considered in the empirical analysis.
3.2. Measurement of skills in STEP Skills Measurement Survey
The STEP Skills Survey measures skills from three broad domains: cognitive skills (for instance,
reading and writing proficiency), job-relevant skills (for instance, physical demand of jobs and
interpersonal skills), and socio-emotional skills (for example, the Big Five dimensions of
personality). Respondents were asked about their use of skills from the first two domains
(cognitive and job-relevant skills), both in the workplace and outside of the job. No such
distinction is made for socio-emotional skills. For the purpose of this study, only cognitive and
job-related skills relevant for performing a respondent’s main occupation are considered.
Moreover, job-related skills are task-related in the sense that they are assessed based on the
information about an individual performing certain tasks at the workplace.
Following previous literature, each STEP skill was assigned to one of the broad skill categories,
such as analytical skills, routine and non-routine manual skills, and non-routine interpersonal
skills, to assess their susceptibility to digitalization (Autor, Levy, and Murnane, 2003; Autor and
4 Countries for which the STEP household surveys were conducted in 2013 include Armenia, Georgia, Ghana, Kenya, and North Macedonia. Countries, for which the STEP household surveys were conducted in 2012, include Bolivia, Colombia, Laos, Sri Lanka, Ukraine and Viet Nam.
9
Handel, 2013; Spitz-Oener, 2006). In addition, two further categories have been distinguished,
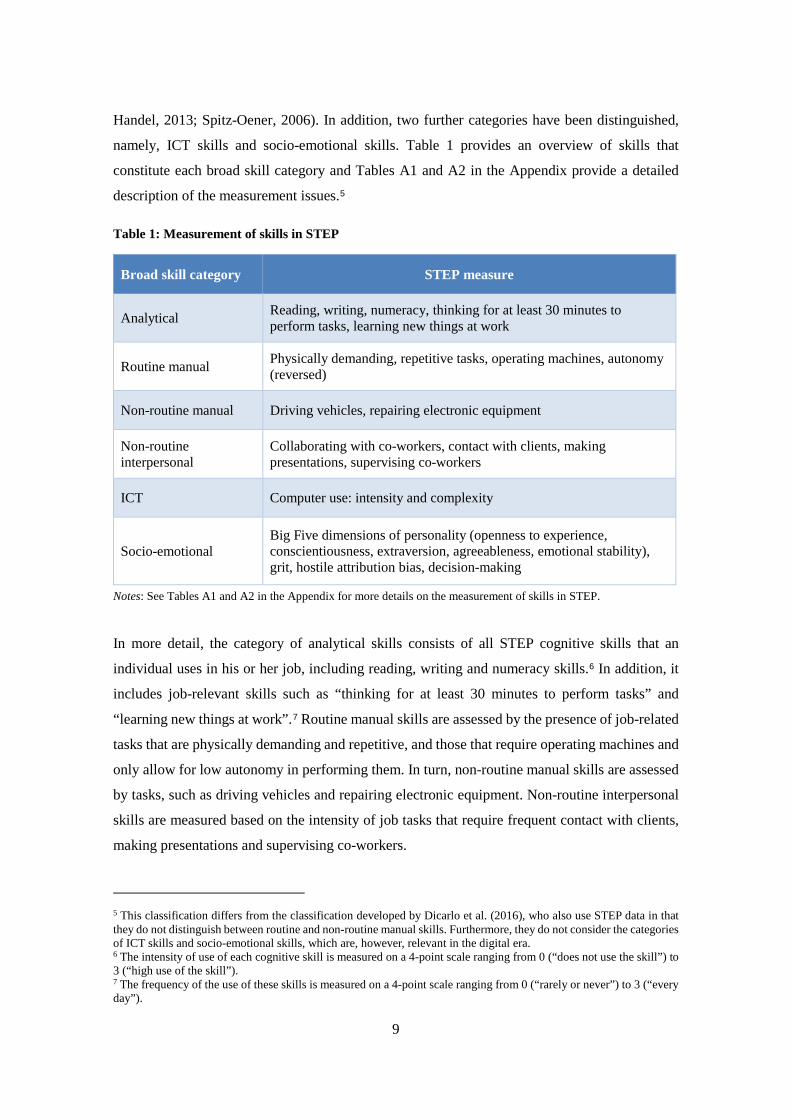
namely, ICT skills and socio-emotional skills. Table 1 provides an overview of skills that
constitute each broad skill category and Tables A1 and A2 in the Appendix provide a detailed
description of the measurement issues.5
Table 1: Measurement of skills in STEP
Broad skill category STEP measure
Analytical Reading, writing, numeracy, thinking for at least 30 minutes to perform tasks, learning new things at work
Routine manual Physically demanding, repetitive tasks, operating machines, autonomy (reversed)
Non-routine manual Driving vehicles, repairing electronic equipment
Non-routine interpersonal
Collaborating with co-workers, contact with clients, making presentations, supervising co-workers
ICT Computer use: intensity and complexity
Socio-emotional Big Five dimensions of personality (openness to experience, conscientiousness, extraversion, agreeableness, emotional stability), grit, hostile attribution bias, decision-making
Notes: See Tables A1 and A2 in the Appendix for more details on the measurement of skills in STEP.
In more detail, the category of analytical skills consists of all STEP cognitive skills that an
individual uses in his or her job, including reading, writing and numeracy skills.6 In addition, it
includes job-relevant skills such as “thinking for at least 30 minutes to perform tasks” and
“learning new things at work”.7 Routine manual skills are assessed by the presence of job-related
tasks that are physically demanding and repetitive, and those that require operating machines and
only allow for low autonomy in performing them. In turn, non-routine manual skills are assessed
by tasks, such as driving vehicles and repairing electronic equipment. Non-routine interpersonal
skills are measured based on the intensity of job tasks that require frequent contact with clients,
making presentations and supervising co-workers.
5 This classification differs from the classification developed by Dicarlo et al. (2016), who also use STEP data in that they do not distinguish between routine and non-routine manual skills. Furthermore, they do not consider the categories of ICT skills and socio-emotional skills, which are, however, relevant in the digital era. 6 The intensity of use of each cognitive skill is measured on a 4-point scale ranging from 0 (“does not use the skill”) to 3 (“high use of the skill”). 7 The frequency of the use of these skills is measured on a 4-point scale ranging from 0 (“rarely or never”) to 3 (“every day”).
10
Moreover, the STEP household survey includes a block of questions aimed at measuring the
intensity and complexity of the use of ICT technologies for everyday work activities. ICT skills
are considered increasingly important in the digital era. The lack of ICT skills is one of the factors
explaining both the digital divide and the digital gender divide (Mariscal et al., 2019). The
intensity of computer use is measured as the frequency with which an individual uses a computer
at work, and the complexity of computer use reflects the complexity of computer-related tasks
required in his or her job.
Socio-emotional skills can be regarded as ‘soft skills’ that will be more in demand in the future.
The current digital transformation of labour markets seems to favour certain personality traits,
such as openness to experience or emotional stability (Bode et al. 2017). As part of a socio-
emotional skill domain, STEP household surveys measure the Big Five dimensions of personality
traits developed by Costa and McCrae (1992). The Big Five dimensions of personality are non-
cognitive skills that include openness to experience, conscientiousness, extraversion,
agreeableness and neuroticism or emotional instability. They tend to be relatively stable across
time and situations (Cobb-Clark and Schurer, 2012), steadily present across cultures, and they
have been identified as important predictors of economic outcomes (Borghans et al., 2008). A
short inventory of the Big Five taxonomy of personality traits has been employed in STEP, which
is similar to the Big Five taxonomy employed in other household surveys.8 Moreover, STEP
surveys include questions to measure further socio-emotional skills, such as grit (an individual’s
passion for a particular long-term goal)9, hostile attribution bias (the tendency to interpret others’
behaviours as having hostile intent)10, and decision-making (including an individual’s ability to
think about and plan for the future)11. All socio-emotional skills are measured as responses on a
4-point Likert scale to questions concerning whether or not a particular socio-emotional skill is
present.
3.3. Digitalization measures
Two measures of digitalization at the level of occupations are used to investigate the effects of
new digital technologies on male and female workers in developing countries: the
computerization probabilities provided by Frey and Osborne (2017) and past advances in artificial
intelligence (AI) developed by Felten et al. (2018).
8 A similar inventory is used, for instance, in the German Socio-Economic Panel Data. 9 Sample item to measure grit: “Do you finish whatever you begin?” 10 Sample item to measure hostile attribution bias: “Do people take advantage of you?” 11 Sample item to measure decision-making skills: “Do you think about how the things you do will affect you in the future?”
11
3.3.1 Computerization probabilities
Occupational computerization probability is a measure of the impacts of digital technologies on
occupations developed by Frey and Osborne (2017). It captures the destructive effects of new
digital technologies on human workers by measuring the risk of an occupation being completely
computerized in the near future. To construct this measure, the authors, in a first step, conducted
a survey of an expert group of machine learning researchers who were asked to hand-label
occupations they are certain will be fully automatable, or not automatable at all, in the foreseeable
future (around 20 years). The experts classified 37 occupations with extremely high susceptibility
and 34 with extremely low susceptibility to automation.12 In a next step, the authors identified
nine selected occupational skills provided by O*Net13 that represent automation bottlenecks.14
Based on a training dataset that includes hand-labelled occupations, the authors constructed a
model that explained the risk of computerization of an occupation based on the significance of
bottleneck skills in each occupation. They then used machine learning techniques to predict
computerization probabilities for 702 occupations defined at the 6-digit level of the Standard
Occupational Classification (SOC) using the O*Net bottleneck skills available for each
occupation.
It has, however, been argued that the computerization probabilities developed by Frey and
Osborne (2017) tend to overestimate the risk of digitalization of occupations, since this measure
does not account for the variability of tasks across jobs within an occupation (see Arntz et al.,
2017). Hence, to account for the variability of jobs within an occupation, the following fractional
response model was estimated as 𝑐𝑐𝑐𝑐𝑐𝑐𝑐𝑐_𝑟𝑟𝑟𝑟𝑟𝑟𝑟𝑟𝑜𝑜 = ∑ 𝛽𝛽𝑘𝑘𝑥𝑥𝑘𝑘𝑘𝑘 + 𝑒𝑒𝑘𝑘𝐾𝐾𝑘𝑘=1 , where 𝑐𝑐𝑐𝑐𝑐𝑐𝑐𝑐_𝑟𝑟𝑟𝑟𝑟𝑟𝑟𝑟𝑜𝑜 is the risk
of computerization of an individual’s i occupation o, as estimated by Frey and Osborne (2017),15
and where 𝑥𝑥𝑘𝑘𝑘𝑘 represents the K characteristics of an individual and his or her job. The effect of
each characteristic on the computerization risk is reflected in the coefficients 𝛽𝛽𝑘𝑘, which are used
to predict the computerization risk for each individual job i. Since jobs within an occupation have
different characteristics, this approach allows for within-occupational heterogeneity in the
12 Occupations that were classified by machine learning experts as having a very high risk of computerization are, for instance, bus drivers, sewing machine operators, data entry keyers. Sample occupations that were classified as having a very low risk of computerization are housekeeping cleaners, plumbers and physicists. 13 O*Net is a database of quantitative indicators about a variety of attributes for 903 occupations in the United States. Based on expert opinions or worker surveys, these indicators cover various job-oriented attributes (occupational requirements, workforce characteristics, occupation-specific information) and worker-oriented attributes (worker characteristics, worker requirements and experience requirements). 14 Bottleneck skills are skills that were identified by Frey and Osborne (2017) as those that will be particularly difficult to computerize in the near future. They include, for instance, finger dexterity, working in a cramped workspace, originality, social perceptiveness, negotiation and persuasion, and assisting and caring for others. 15 The computerization risk has been aggregated at the 3-digit level of ISCO-08, which is available in STEP data.
12
predicted computerization risk (see Arntz et al., 2017 for more details about the correction
method). Table A3 in the Appendix reports the results of the model estimation.
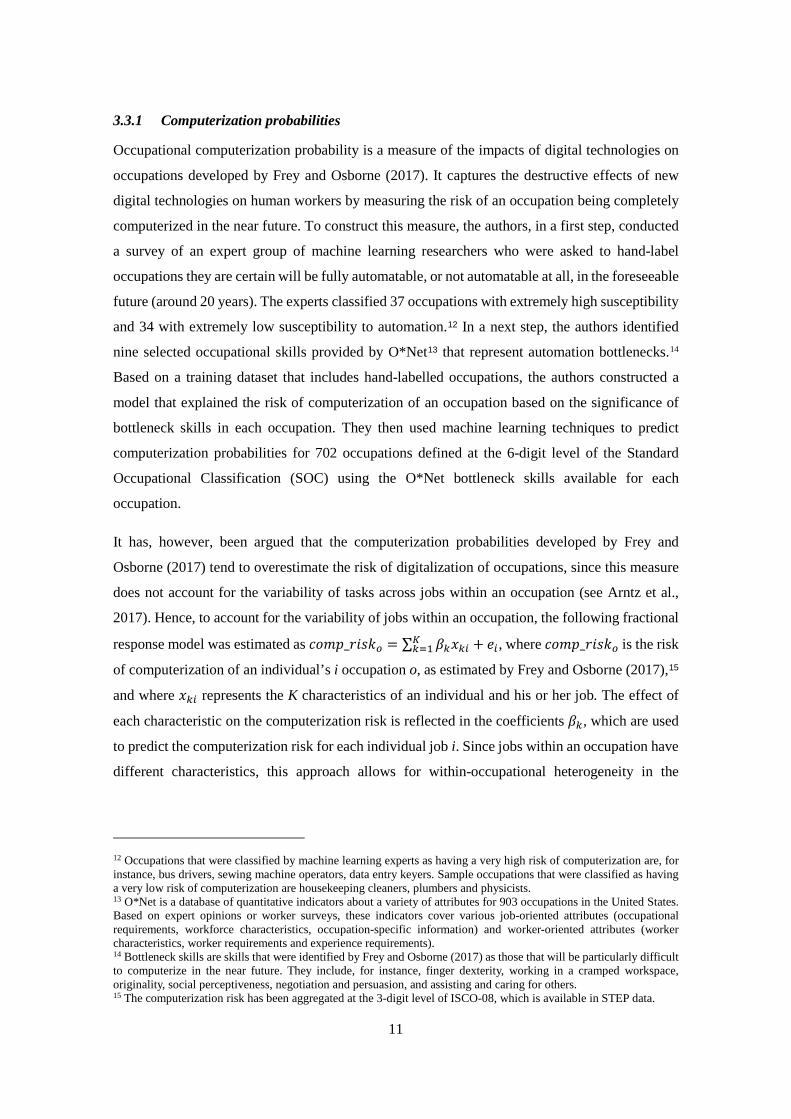
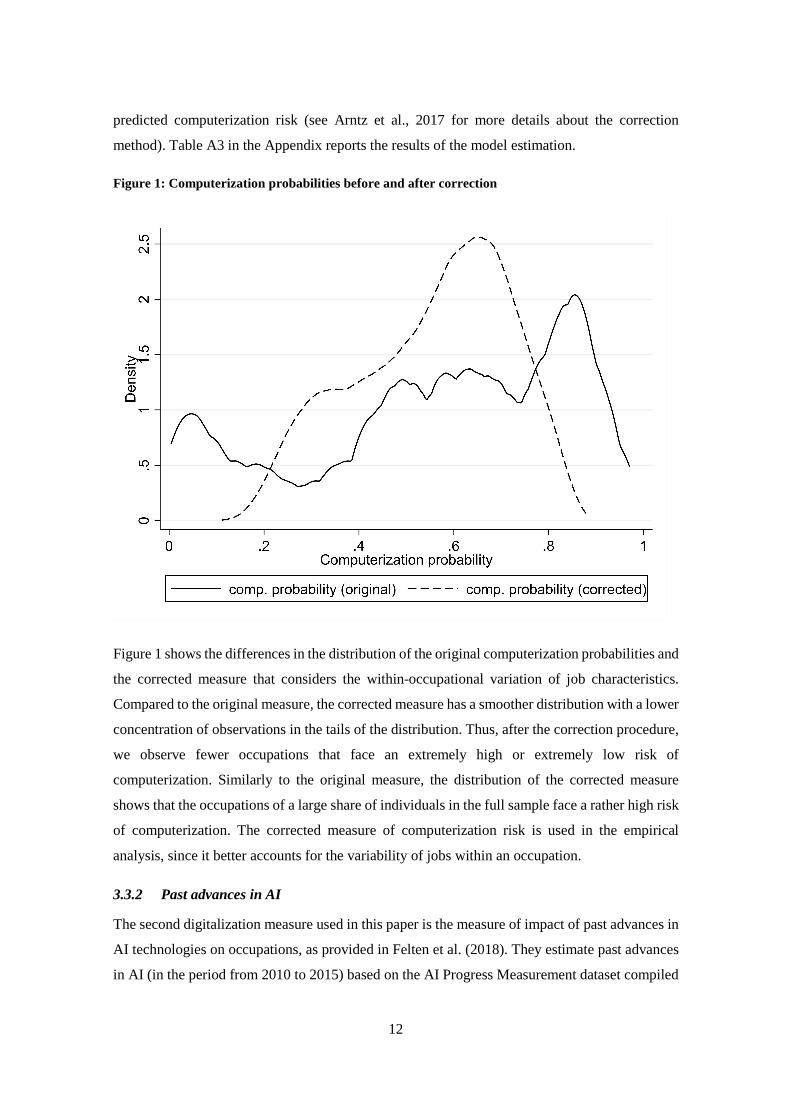
Figure 1: Computerization probabilities before and after correction
Figure 1 shows the differences in the distribution of the original computerization probabilities and
the corrected measure that considers the within-occupational variation of job characteristics.
Compared to the original measure, the corrected measure has a smoother distribution with a lower
concentration of observations in the tails of the distribution. Thus, after the correction procedure,
we observe fewer occupations that face an extremely high or extremely low risk of
computerization. Similarly to the original measure, the distribution of the corrected measure
shows that the occupations of a large share of individuals in the full sample face a rather high risk
of computerization. The corrected measure of computerization risk is used in the empirical
analysis, since it better accounts for the variability of jobs within an occupation.
3.3.2 Past advances in AI
The second digitalization measure used in this paper is the measure of impact of past advances in
AI technologies on occupations, as provided in Felten et al. (2018). They estimate past advances
in AI (in the period from 2010 to 2015) based on the AI Progress Measurement dataset compiled
0.5
11.
5
0 .2 .4 .6 .8 1Computerization probability
comp. probability (original) comp. probability (corrected)
13
by the Electronic Frontier Foundation (EFF) in combination with O*Net occupational data. In
contrast to Frey and Osborne’s (2017) computerization probabilities, this approach does not rely
on experts’ predictions of the future. Instead, it estimates progress slopes for 16 categories of AI16
based on past advances of the technologies reported by EFF. Felten et al. link the advances in the
AI categories to 52 distinct abilities that O*Net uses to describe job requirements. O*Net provides
the significance and prevalence of each ability for each occupation. This allows them to estimate
progress slopes in AI performance at the level of occupations. Furthermore, this measure differs
from that of computerization probabilities in that it merely focusses on one particular field of the
new digital technologies, namely artificial intelligence, while computerization probabilities
capture the effects of digital technologies in general.
The differences between both measures of digitalization have been discussed in detail by Fossen
and Sorgner (2019a,b), who point out that both measures reflect different aspects of digitalization.
While computerization probabilities reflect the risk of an occupation of being fully automated,
which is the destructive potential of new digital technologies, the impact of past advances in AI
seem to reflect the transformative nature of digitalization, that is, the extent to which new digital
technologies will transform an occupation without necessarily replacing it.17
Both digitalization measures are available at the 6-digit level of the System of Occupational
Classification (SOC), while STEP surveys provide occupational codes at the 3-digit level of
ISCO-08. Hence, a crosswalk was used to merge the occupational digitalization measures with
the individual-level STEP data. The aggregation of data to the more general level of occupations
was performed by calculating average values of digitalization measures available at a less
aggregated level.18 Descriptive statistics for both digitalization measures used in the analysis are
presented in Table 2.
16 Categories of AI, for example, include image recognition, speech recognition, translation, among others. 17 Importantly, Felten et al. (2018) do not consider their measure as the one that captures solely substitutive or complementary effects of AI on occupations. 18 Ukraine was excluded from the analysis of impacts of digitalization on occupations, because occupational codes for the country were only available at a broad 2-digit level of ISCO-08.
14
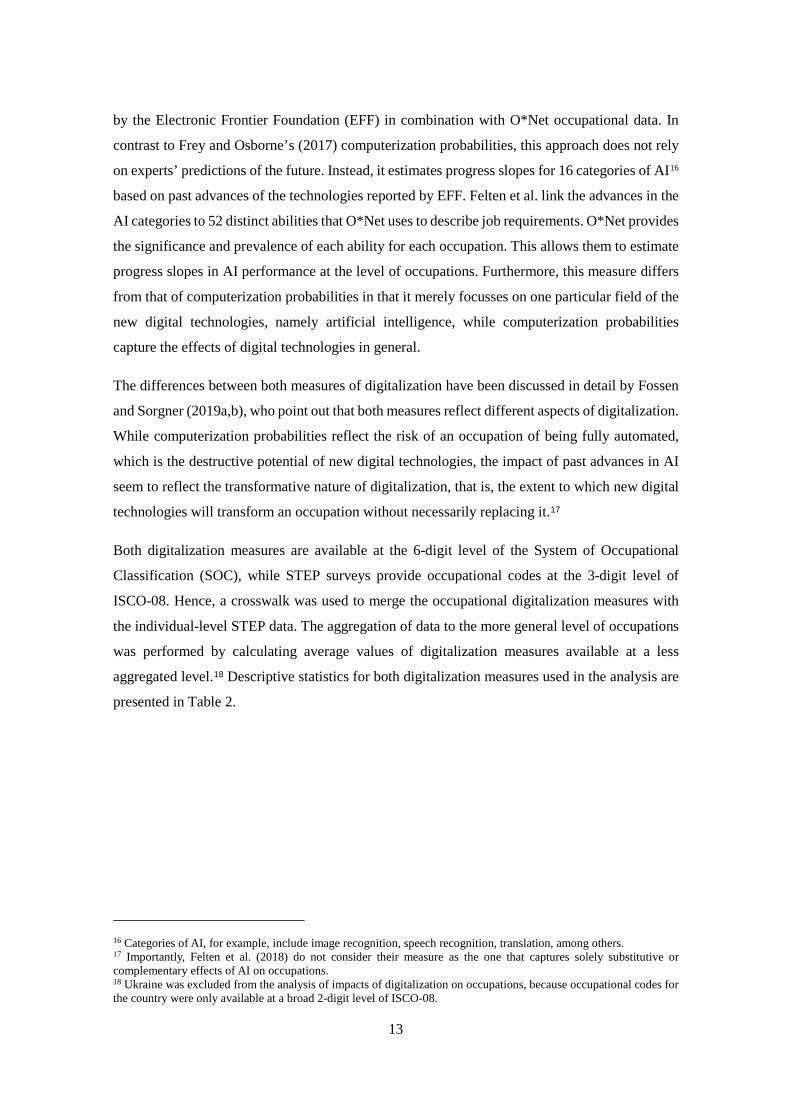
Table 2: Descriptive statistics for digitalization measures
Measures of digitalization of occupations
Computerization probability (corrected)
Advances in AI
Mean 0.551 3.113
Standard deviation 0.162 0.615
Median 0.578 3.247
Minimum 0.110 1.882
Maximum 0.868 4.652
Source: Author’s calculations based on STEP surveys.
3.3.3 Relationship between digitalization measures and skills
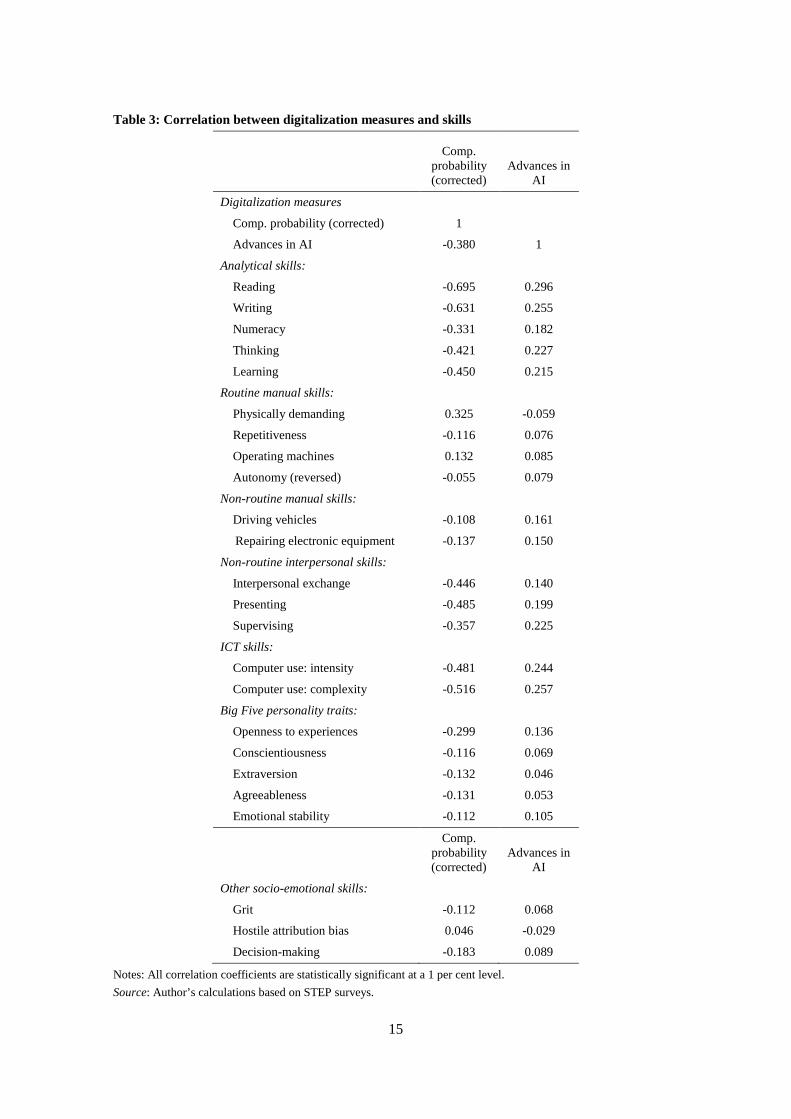
Table 3 reports the correlations between skill measures and both digitalization measures. The
correlation coefficient between computerization probabilities and advances in AI is strongly
negative (r = -0.38), suggesting that occupations that recently experienced relatively rapid
advances in AI are less likely of becoming fully computerized. This further suggests that the
measure of past advances in AI is more likely to capture the transformative aspects of
digitalization. Moreover, the occupations of individuals in jobs that require higher levels of
analytical, non-routine manual and interpersonal skills tend to have a lower computerization risk,
but they also face stronger advances in AI. These skills are currently bottlenecks to
computerization (Frey and Osborne, 2017), meaning they cannot be completely replaced, but
advances in AI will lead to a significant transformation of these occupations. The complexity and
intensity of ICT use is also strongly negatively correlated with the computerization probabilities,
but positively with the measure of advances in AI. This suggests that advances in AI have been
strongest in areas where humans are complemented, not replaced, by digital technologies. The
relationship between routine manual skills and digitalization probabilities is rather ambiguous.
For instance, there is a positive correlation between computerization probabilities and routine
manual skills, such as physically demanding and operating machines. At the same time, jobs with
high levels of repetitiveness and low levels of autonomy are less likely to be at high risk of
computerization. The results are the opposite for the measure of advances in AI, with an exception
of task operating machines, for which a positive correlation is observed. Last but not least, socio-
emotional skills are negatively correlated with computerization probabilities, but positively with
advances in AI (with an exception of hostile attribution bias).
15
Table 3: Correlation between digitalization measures and skills
Comp. probability (corrected)
Advances in AI
Digitalization measures
Comp. probability (corrected) 1
Advances in AI -0.380 1
Analytical skills:
Reading -0.695 0.296
Writing -0.631 0.255
Numeracy -0.331 0.182
Thinking -0.421 0.227
Learning -0.450 0.215
Routine manual skills:
Physically demanding 0.325 -0.059
Repetitiveness -0.116 0.076
Operating machines 0.132 0.085
Autonomy (reversed) -0.055 0.079
Non-routine manual skills:
Driving vehicles -0.108 0.161
Repairing electronic equipment -0.137 0.150
Non-routine interpersonal skills:
Interpersonal exchange -0.446 0.140
Presenting -0.485 0.199
Supervising -0.357 0.225
ICT skills:
Computer use: intensity -0.481 0.244
Computer use: complexity -0.516 0.257
Big Five personality traits:
Openness to experiences -0.299 0.136
Conscientiousness -0.116 0.069
Extraversion -0.132 0.046
Agreeableness -0.131 0.053
Emotional stability -0.112 0.105
Comp. probability (corrected)
Advances in AI
Other socio-emotional skills:
Grit -0.112 0.068
Hostile attribution bias 0.046 -0.029
Decision-making -0.183 0.089
Notes: All correlation coefficients are statistically significant at a 1 per cent level. Source: Author’s calculations based on STEP surveys.
16
4. Results
This section presents the results of the empirical analysis. It first describes the distribution of
individuals in the sample by country, gender, sector of employment, and the highest achieved
level of formal education (Section 4.1). Furthermore, the gender-specific differences in skill
endowments across sectors are analysed to shed light on whether women’s skill endowments
make them potentially more or less vulnerable to new digital technologies (Section 4.2). Lastly,
Section 4.3 provides the results of an analysis of the effects of digitalization measures on men’s
and women’s jobs in different industrial sectors.
4.1. Descriptive statistics
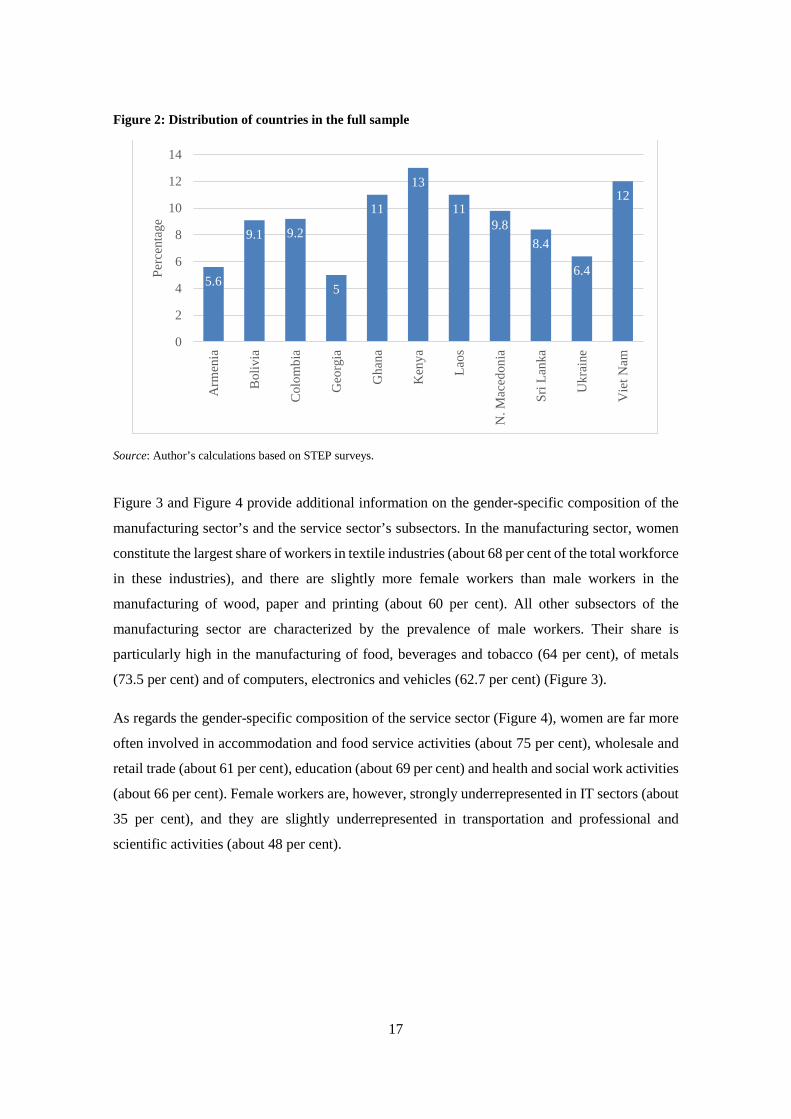
The shares of countries in the full sample vary between 5 per cent and 13 per cent (see Figure 2).
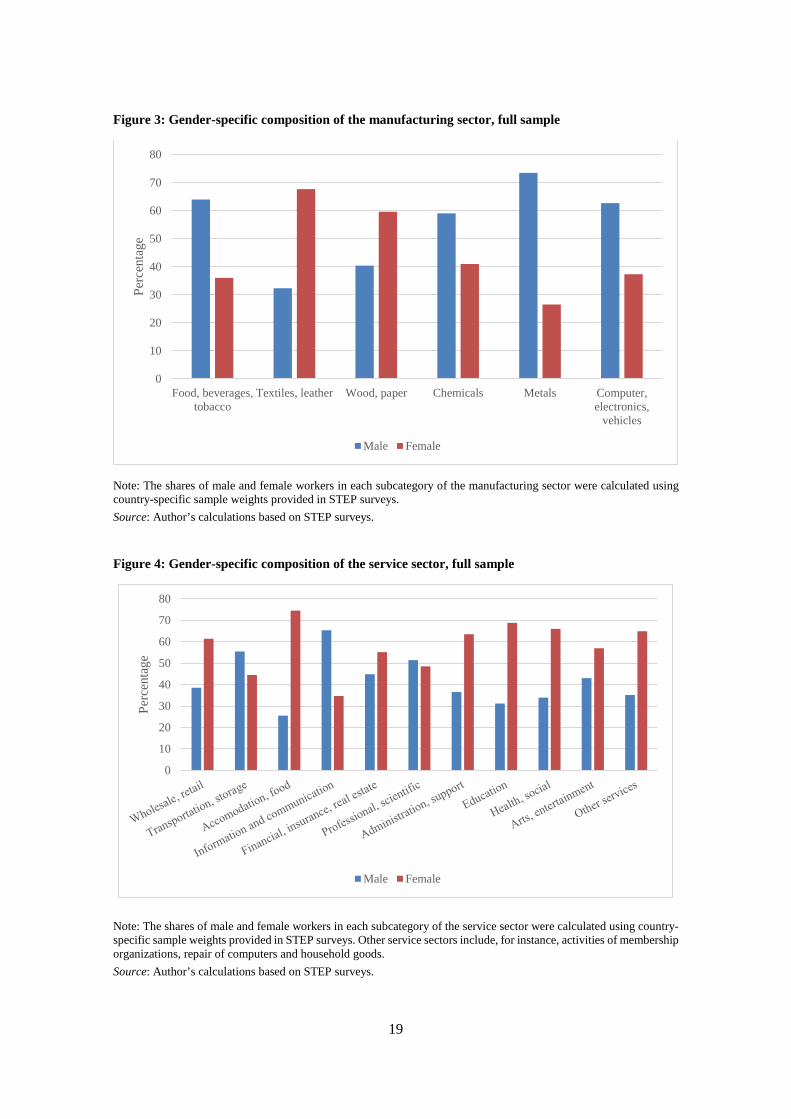
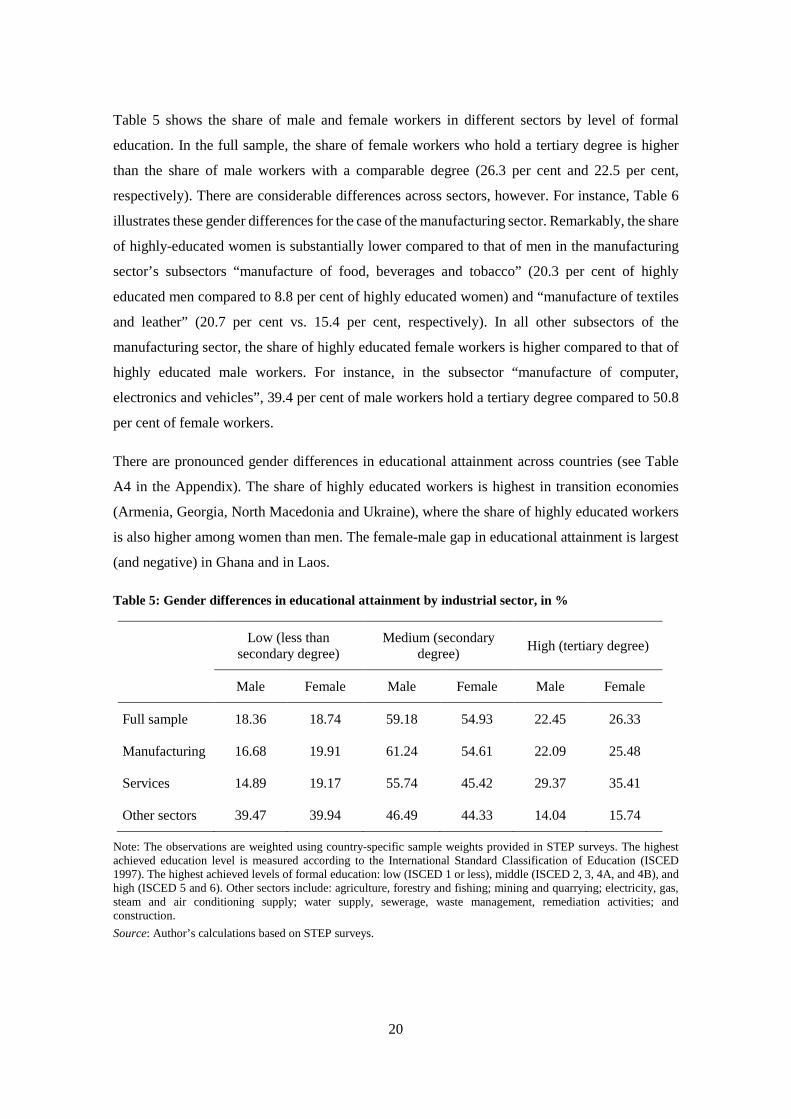
Figure 3 and Figure 4 provide additional information on the gender-specific composition of the
manufacturing sector’s and the service sector’s subsectors. In the manufacturing sector, women
constitute the largest share of workers in textile industries (about 68 per cent of the total workforce
in these industries), and there are slightly more female workers than male workers in the
manufacturing of wood, paper and printing (about 60 per cent). All other subsectors of the
manufacturing sector are characterized by the prevalence of male workers. Their share is
particularly high in the manufacturing of food, beverages and tobacco (64 per cent), of metals
(73.5 per cent) and of computers, electronics and vehicles (62.7 per cent) (Figure 3).
As regards the gender-specific composition of the service sector (Figure 4), women are far more
often involved in accommodation and food service activities (about 75 per cent), wholesale and
retail trade (about 61 per cent), education (about 69 per cent) and health and social work activities
(about 66 per cent). Female workers are, however, strongly underrepresented in IT sectors (about
35 per cent), and they are slightly underrepresented in transportation and professional and
scientific activities (about 48 per cent).
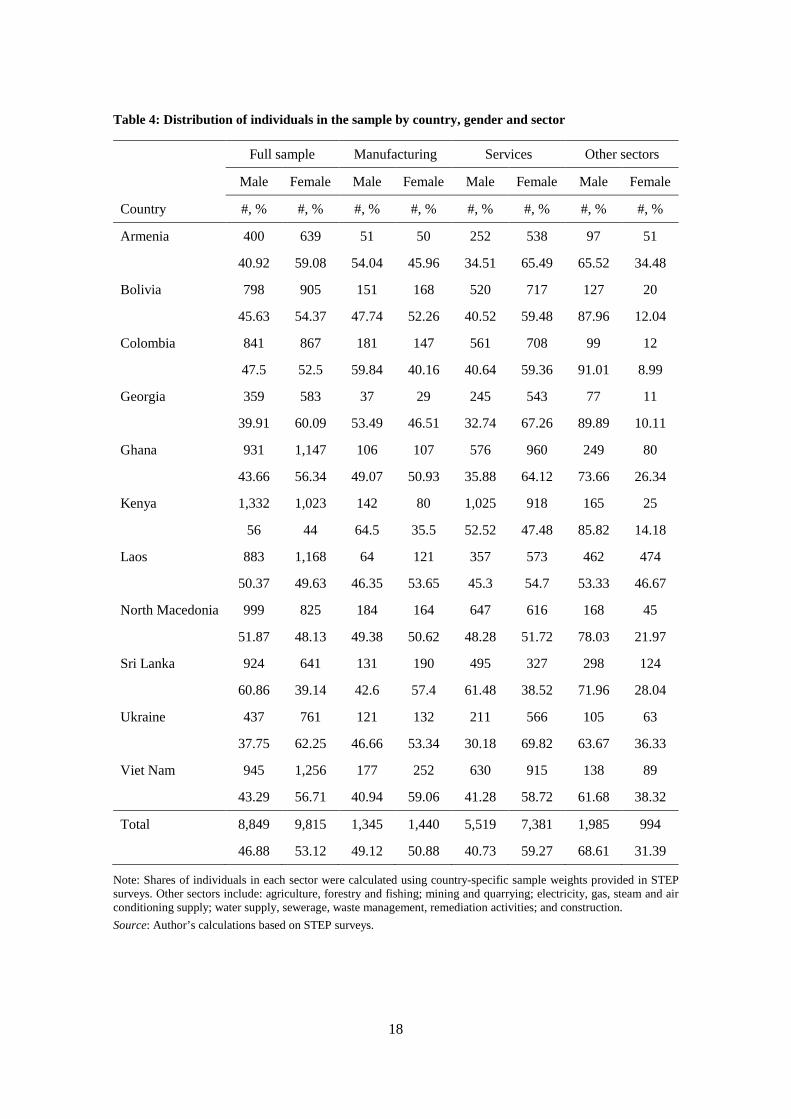
Table 4 presents the distribution of individuals in the sample by gender, sector and country. There
are slightly more women in the full sample than men (53.1 per cent as compared to 46.8 per cent).
The share of female workers is highest in services (59.3 per cent of female workers) and lowest
in other sectors (31.4 per cent). There are approximately as many women as men in the
manufacturing sector, although the share of female workers in this sector varies considerably
across countries. The lowest share of women in the manufacturing sector is found in Kenya (35.5
per cent) and the highest shares are found in Viet Nam and in Sri Lanka (59.1 per cent and 57.4
per cent, correspondingly).
17
Figure 2: Distribution of countries in the full sample
Source: Author’s calculations based on STEP surveys.
Figure 3 and Figure 4 provide additional information on the gender-specific composition of the
manufacturing sector’s and the service sector’s subsectors. In the manufacturing sector, women
constitute the largest share of workers in textile industries (about 68 per cent of the total workforce
in these industries), and there are slightly more female workers than male workers in the
manufacturing of wood, paper and printing (about 60 per cent). All other subsectors of the
manufacturing sector are characterized by the prevalence of male workers. Their share is
particularly high in the manufacturing of food, beverages and tobacco (64 per cent), of metals
(73.5 per cent) and of computers, electronics and vehicles (62.7 per cent) (Figure 3).
As regards the gender-specific composition of the service sector (Figure 4), women are far more
often involved in accommodation and food service activities (about 75 per cent), wholesale and
retail trade (about 61 per cent), education (about 69 per cent) and health and social work activities
(about 66 per cent). Female workers are, however, strongly underrepresented in IT sectors (about
35 per cent), and they are slightly underrepresented in transportation and professional and
scientific activities (about 48 per cent).
5.6
9.1 9.2
5
11
13
119.8
8.4
6.4
12
0
2
4
6
8
10
12
14
Arm
enia
Bol
ivia
Col
ombi
a
Geo
rgia
Gha
na
Ken
ya
Laos
N.M
aced
onia
Sri L
anka
Ukr
aine
Vie
t Nam
Perc
enta
ge
18
Table 4: Distribution of individuals in the sample by country, gender and sector
Full sample Manufacturing Services Other sectors
Male Female Male Female Male Female Male Female
Country #, % #, % #, % #, % #, % #, % #, % #, %
Armenia 400 639 51 50 252 538 97 51
40.92 59.08 54.04 45.96 34.51 65.49 65.52 34.48
Bolivia 798 905 151 168 520 717 127 20
45.63 54.37 47.74 52.26 40.52 59.48 87.96 12.04
Colombia 841 867 181 147 561 708 99 12
47.5 52.5 59.84 40.16 40.64 59.36 91.01 8.99
Georgia 359 583 37 29 245 543 77 11
39.91 60.09 53.49 46.51 32.74 67.26 89.89 10.11
Ghana 931 1,147 106 107 576 960 249 80
43.66 56.34 49.07 50.93 35.88 64.12 73.66 26.34
Kenya 1,332 1,023 142 80 1,025 918 165 25
56 44 64.5 35.5 52.52 47.48 85.82 14.18
Laos 883 1,168 64 121 357 573 462 474
50.37 49.63 46.35 53.65 45.3 54.7 53.33 46.67
North Macedonia 999 825 184 164 647 616 168 45
51.87 48.13 49.38 50.62 48.28 51.72 78.03 21.97
Sri Lanka 924 641 131 190 495 327 298 124
60.86 39.14 42.6 57.4 61.48 38.52 71.96 28.04
Ukraine 437 761 121 132 211 566 105 63
37.75 62.25 46.66 53.34 30.18 69.82 63.67 36.33
Viet Nam 945 1,256 177 252 630 915 138 89
43.29 56.71 40.94 59.06 41.28 58.72 61.68 38.32
Total 8,849 9,815 1,345 1,440 5,519 7,381 1,985 994
46.88 53.12 49.12 50.88 40.73 59.27 68.61 31.39
Note: Shares of individuals in each sector were calculated using country-specific sample weights provided in STEP surveys. Other sectors include: agriculture, forestry and fishing; mining and quarrying; electricity, gas, steam and air conditioning supply; water supply, sewerage, waste management, remediation activities; and construction. Source: Author’s calculations based on STEP surveys.
19
Figure 3: Gender-specific composition of the manufacturing sector, full sample
Note: The shares of male and female workers in each subcategory of the manufacturing sector were calculated using country-specific sample weights provided in STEP surveys. Source: Author’s calculations based on STEP surveys.
Figure 4: Gender-specific composition of the service sector, full sample
Note: The shares of male and female workers in each subcategory of the service sector were calculated using country-specific sample weights provided in STEP surveys. Other service sectors include, for instance, activities of membership organizations, repair of computers and household goods. Source: Author’s calculations based on STEP surveys.
0
10
20
30
40
50
60
70
80
Food, beverages,tobacco
Textiles, leather Wood, paper Chemicals Metals Computer,electronics,
vehicles
Perc
enta
ge
Male Female
0
10
20
30
40
50
60
70
80
Perc
enta
ge
Male Female
20
Table 5 shows the share of male and female workers in different sectors by level of formal
education. In the full sample, the share of female workers who hold a tertiary degree is higher
than the share of male workers with a comparable degree (26.3 per cent and 22.5 per cent,
respectively). There are considerable differences across sectors, however. For instance, Table 6
illustrates these gender differences for the case of the manufacturing sector. Remarkably, the share
of highly-educated women is substantially lower compared to that of men in the manufacturing
sector’s subsectors “manufacture of food, beverages and tobacco” (20.3 per cent of highly
educated men compared to 8.8 per cent of highly educated women) and “manufacture of textiles
and leather” (20.7 per cent vs. 15.4 per cent, respectively). In all other subsectors of the
manufacturing sector, the share of highly educated female workers is higher compared to that of
highly educated male workers. For instance, in the subsector “manufacture of computer,
electronics and vehicles”, 39.4 per cent of male workers hold a tertiary degree compared to 50.8
per cent of female workers.
There are pronounced gender differences in educational attainment across countries (see Table
A4 in the Appendix). The share of highly educated workers is highest in transition economies
(Armenia, Georgia, North Macedonia and Ukraine), where the share of highly educated workers
is also higher among women than men. The female-male gap in educational attainment is largest
(and negative) in Ghana and in Laos.
Table 5: Gender differences in educational attainment by industrial sector, in %
Low (less than secondary degree)
Medium (secondary degree) High (tertiary degree)
Male Female Male Female Male Female
Full sample 18.36 18.74 59.18 54.93 22.45 26.33
Manufacturing 16.68 19.91 61.24 54.61 22.09 25.48
Services 14.89 19.17 55.74 45.42 29.37 35.41
Other sectors 39.47 39.94 46.49 44.33 14.04 15.74
Note: The observations are weighted using country-specific sample weights provided in STEP surveys. The highest achieved education level is measured according to the International Standard Classification of Education (ISCED 1997). The highest achieved levels of formal education: low (ISCED 1 or less), middle (ISCED 2, 3, 4A, and 4B), and high (ISCED 5 and 6). Other sectors include: agriculture, forestry and fishing; mining and quarrying; electricity, gas, steam and air conditioning supply; water supply, sewerage, waste management, remediation activities; and construction. Source: Author’s calculations based on STEP surveys.
21
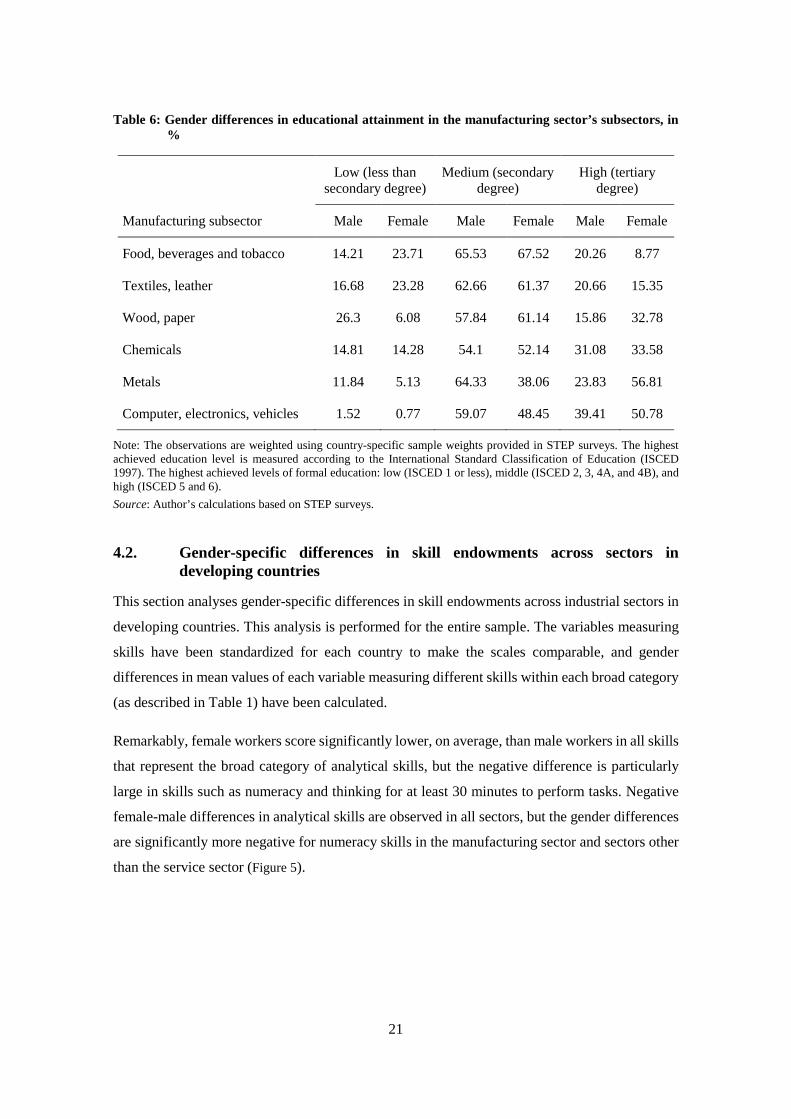
Table 6: Gender differences in educational attainment in the manufacturing sector’s subsectors, in %
Low (less than
secondary degree) Medium (secondary
degree) High (tertiary
degree)
Manufacturing subsector Male Female Male Female Male Female
Food, beverages and tobacco 14.21 23.71 65.53 67.52 20.26 8.77
Textiles, leather 16.68 23.28 62.66 61.37 20.66 15.35
Wood, paper 26.3 6.08 57.84 61.14 15.86 32.78
Chemicals 14.81 14.28 54.1 52.14 31.08 33.58
Metals 11.84 5.13 64.33 38.06 23.83 56.81
Computer, electronics, vehicles 1.52 0.77 59.07 48.45 39.41 50.78
Note: The observations are weighted using country-specific sample weights provided in STEP surveys. The highest achieved education level is measured according to the International Standard Classification of Education (ISCED 1997). The highest achieved levels of formal education: low (ISCED 1 or less), middle (ISCED 2, 3, 4A, and 4B), and high (ISCED 5 and 6). Source: Author’s calculations based on STEP surveys.
4.2. Gender-specific differences in skill endowments across sectors in developing countries
This section analyses gender-specific differences in skill endowments across industrial sectors in
developing countries. This analysis is performed for the entire sample. The variables measuring
skills have been standardized for each country to make the scales comparable, and gender
differences in mean values of each variable measuring different skills within each broad category
(as described in Table 1) have been calculated.
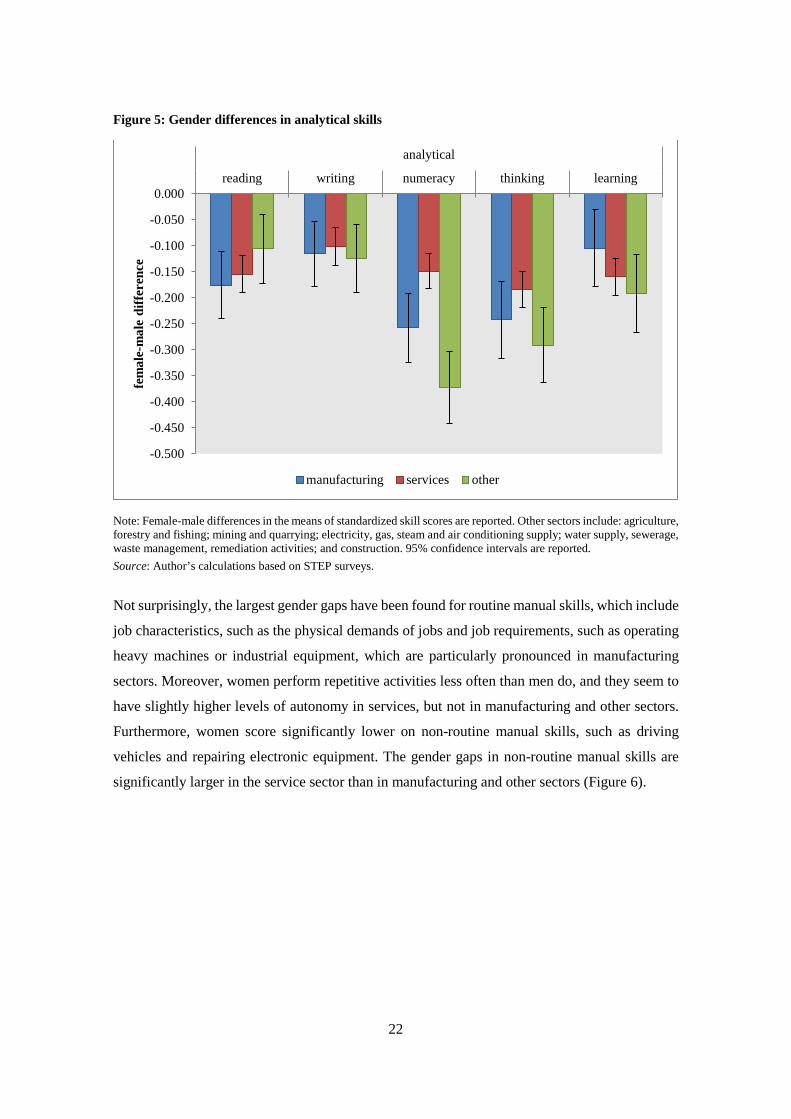
Remarkably, female workers score significantly lower, on average, than male workers in all skills
that represent the broad category of analytical skills, but the negative difference is particularly
large in skills such as numeracy and thinking for at least 30 minutes to perform tasks. Negative
female-male differences in analytical skills are observed in all sectors, but the gender differences
are significantly more negative for numeracy skills in the manufacturing sector and sectors other
than the service sector (Figure 5).
22
Figure 5: Gender differences in analytical skills
Note: Female-male differences in the means of standardized skill scores are reported. Other sectors include: agriculture, forestry and fishing; mining and quarrying; electricity, gas, steam and air conditioning supply; water supply, sewerage, waste management, remediation activities; and construction. 95% confidence intervals are reported. Source: Author’s calculations based on STEP surveys.
Not surprisingly, the largest gender gaps have been found for routine manual skills, which include
job characteristics, such as the physical demands of jobs and job requirements, such as operating
heavy machines or industrial equipment, which are particularly pronounced in manufacturing
sectors. Moreover, women perform repetitive activities less often than men do, and they seem to
have slightly higher levels of autonomy in services, but not in manufacturing and other sectors.
Furthermore, women score significantly lower on non-routine manual skills, such as driving
vehicles and repairing electronic equipment. The gender gaps in non-routine manual skills are
significantly larger in the service sector than in manufacturing and other sectors (Figure 6).
-0.500
-0.450
-0.400
-0.350
-0.300
-0.250
-0.200
-0.150
-0.100
-0.050
0.000reading writing numeracy thinking learning
analyticalfe
mal
e-m
ale
diff
eren
ce
manufacturing services other
23
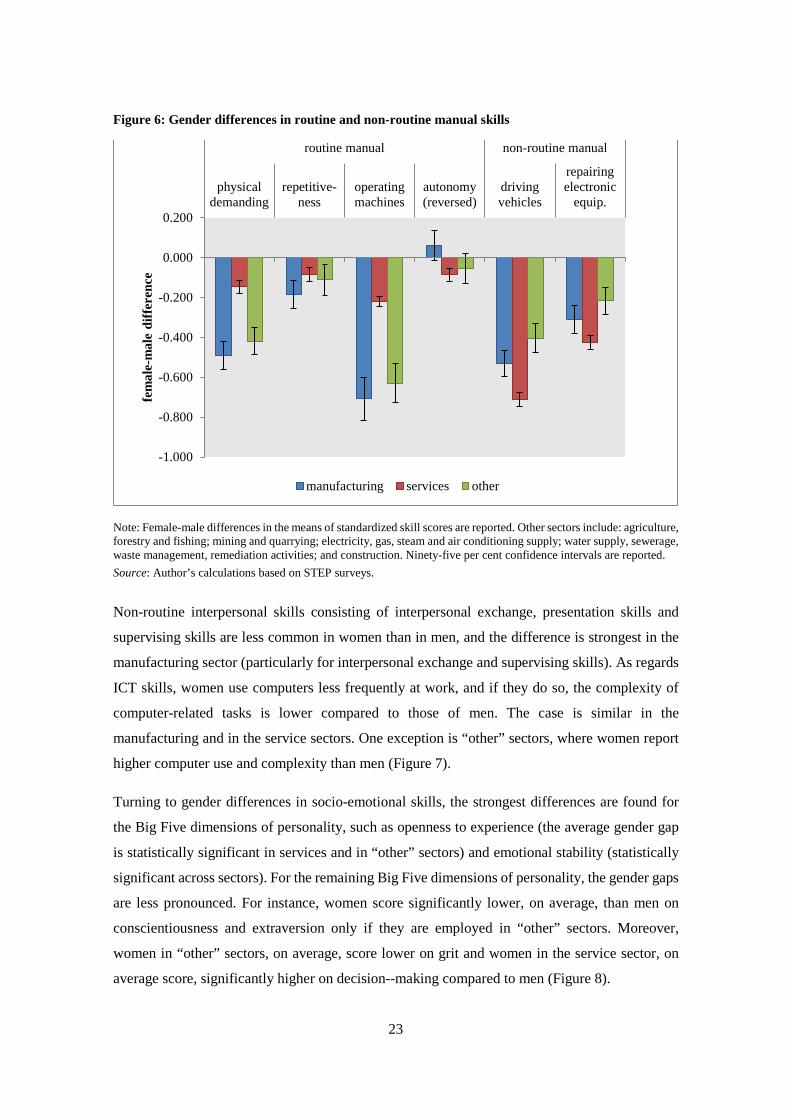
Figure 6: Gender differences in routine and non-routine manual skills
Note: Female-male differences in the means of standardized skill scores are reported. Other sectors include: agriculture, forestry and fishing; mining and quarrying; electricity, gas, steam and air conditioning supply; water supply, sewerage, waste management, remediation activities; and construction. Ninety-five per cent confidence intervals are reported. Source: Author’s calculations based on STEP surveys.
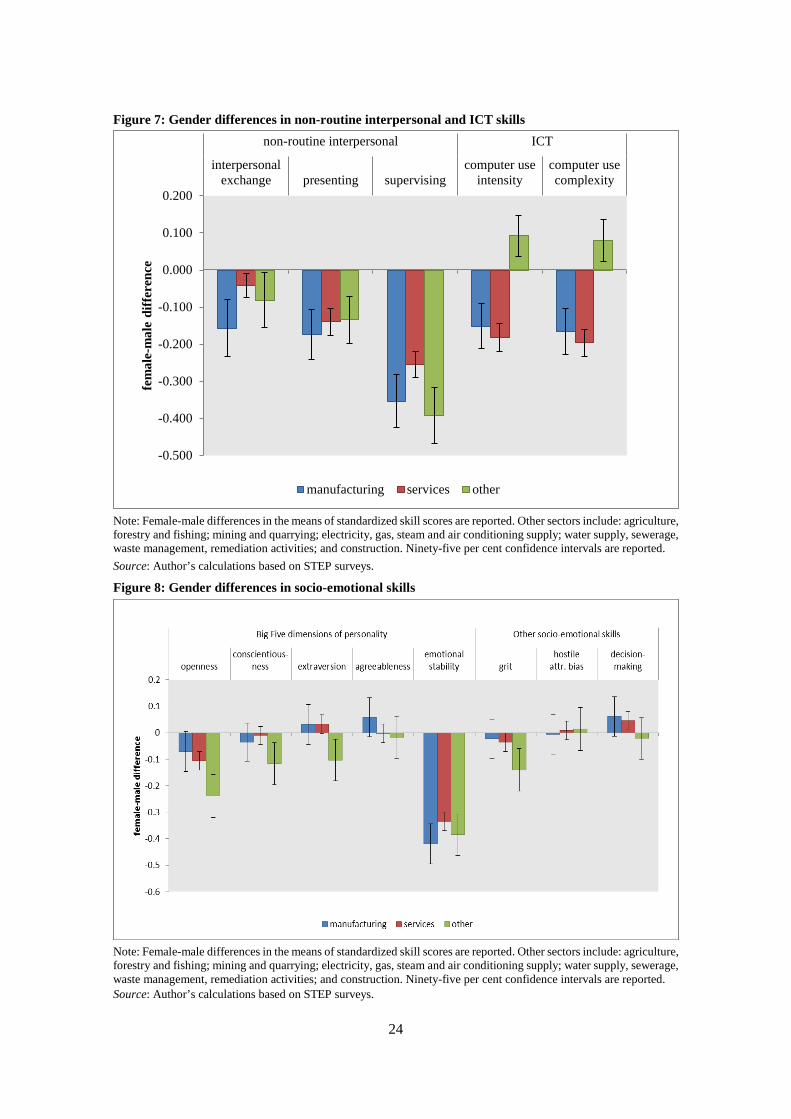
Non-routine interpersonal skills consisting of interpersonal exchange, presentation skills and
supervising skills are less common in women than in men, and the difference is strongest in the
manufacturing sector (particularly for interpersonal exchange and supervising skills). As regards
ICT skills, women use computers less frequently at work, and if they do so, the complexity of
computer-related tasks is lower compared to those of men. The case is similar in the
manufacturing and in the service sectors. One exception is “other” sectors, where women report
higher computer use and complexity than men (Figure 7).
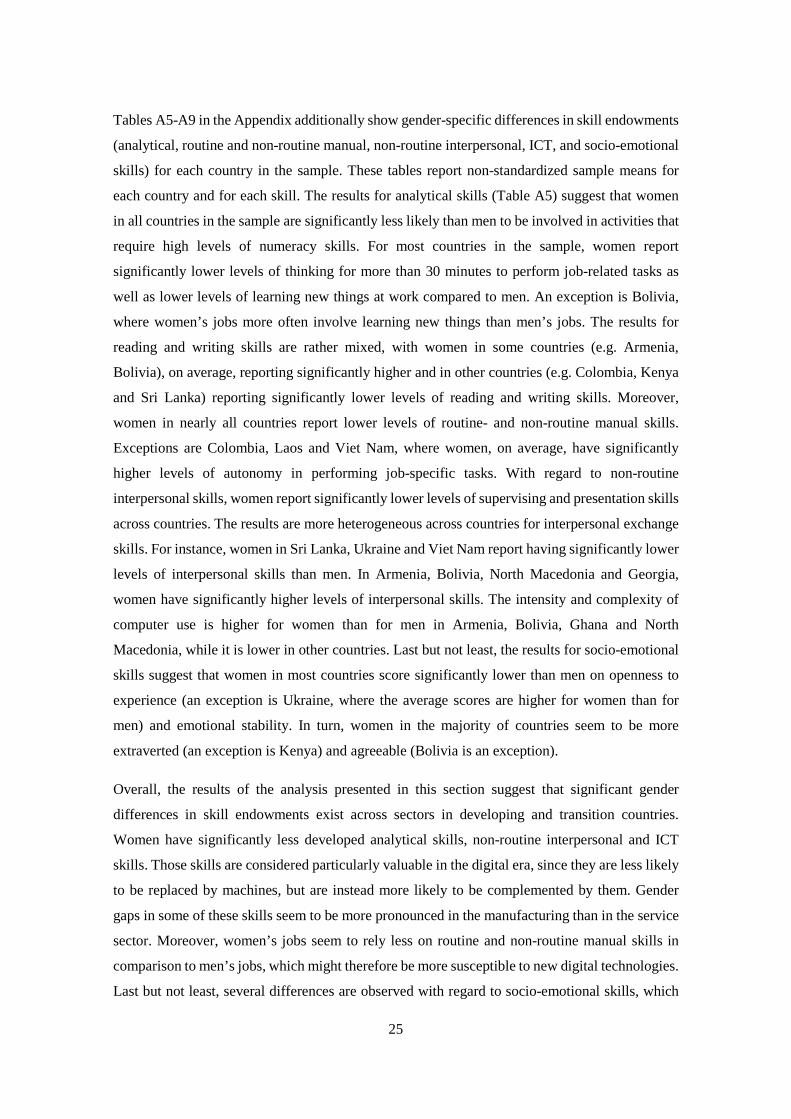
Turning to gender differences in socio-emotional skills, the strongest differences are found for
the Big Five dimensions of personality, such as openness to experience (the average gender gap
is statistically significant in services and in “other” sectors) and emotional stability (statistically
significant across sectors). For the remaining Big Five dimensions of personality, the gender gaps
are less pronounced. For instance, women score significantly lower, on average, than men on
conscientiousness and extraversion only if they are employed in “other” sectors. Moreover,
women in “other” sectors, on average, score lower on grit and women in the service sector, on
average score, significantly higher on decision--making compared to men (Figure 8).
-1.000
-0.800
-0.600
-0.400
-0.200
0.000
0.200
physicaldemanding
repetitive-ness
operatingmachines
autonomy(reversed)
drivingvehicles
repairingelectronic
equip.
routine manual non-routine manualfe
mal
e-m
ale
diff
eren
ce
manufacturing services other
24
Figure 7: Gender differences in non-routine interpersonal and ICT skills
Note: Female-male differences in the means of standardized skill scores are reported. Other sectors include: agriculture, forestry and fishing; mining and quarrying; electricity, gas, steam and air conditioning supply; water supply, sewerage, waste management, remediation activities; and construction. Ninety-five per cent confidence intervals are reported. Source: Author’s calculations based on STEP surveys.
Figure 8: Gender differences in socio-emotional skills
Note: Female-male differences in the means of standardized skill scores are reported. Other sectors include: agriculture, forestry and fishing; mining and quarrying; electricity, gas, steam and air conditioning supply; water supply, sewerage, waste management, remediation activities; and construction. Ninety-five per cent confidence intervals are reported. Source: Author’s calculations based on STEP surveys.
-0.500
-0.400
-0.300
-0.200
-0.100
0.000
0.100
0.200
interpersonalexchange presenting supervising
computer useintensity
computer usecomplexity
non-routine interpersonal ICTfe
mal
e-m
ale
diff
eren
ce
manufacturing services other
25
Tables A5-A9 in the Appendix additionally show gender-specific differences in skill endowments
(analytical, routine and non-routine manual, non-routine interpersonal, ICT, and socio-emotional
skills) for each country in the sample. These tables report non-standardized sample means for
each country and for each skill. The results for analytical skills (Table A5) suggest that women
in all countries in the sample are significantly less likely than men to be involved in activities that
require high levels of numeracy skills. For most countries in the sample, women report
significantly lower levels of thinking for more than 30 minutes to perform job-related tasks as
well as lower levels of learning new things at work compared to men. An exception is Bolivia,
where women’s jobs more often involve learning new things than men’s jobs. The results for
reading and writing skills are rather mixed, with women in some countries (e.g. Armenia,
Bolivia), on average, reporting significantly higher and in other countries (e.g. Colombia, Kenya
and Sri Lanka) reporting significantly lower levels of reading and writing skills. Moreover,
women in nearly all countries report lower levels of routine- and non-routine manual skills.
Exceptions are Colombia, Laos and Viet Nam, where women, on average, have significantly
higher levels of autonomy in performing job-specific tasks. With regard to non-routine
interpersonal skills, women report significantly lower levels of supervising and presentation skills
across countries. The results are more heterogeneous across countries for interpersonal exchange
skills. For instance, women in Sri Lanka, Ukraine and Viet Nam report having significantly lower
levels of interpersonal skills than men. In Armenia, Bolivia, North Macedonia and Georgia,
women have significantly higher levels of interpersonal skills. The intensity and complexity of
computer use is higher for women than for men in Armenia, Bolivia, Ghana and North
Macedonia, while it is lower in other countries. Last but not least, the results for socio-emotional
skills suggest that women in most countries score significantly lower than men on openness to
experience (an exception is Ukraine, where the average scores are higher for women than for
men) and emotional stability. In turn, women in the majority of countries seem to be more
extraverted (an exception is Kenya) and agreeable (Bolivia is an exception).
Overall, the results of the analysis presented in this section suggest that significant gender
differences in skill endowments exist across sectors in developing and transition countries.
Women have significantly less developed analytical skills, non-routine interpersonal and ICT
skills. Those skills are considered particularly valuable in the digital era, since they are less likely
to be replaced by machines, but are instead more likely to be complemented by them. Gender
gaps in some of these skills seem to be more pronounced in the manufacturing than in the service
sector. Moreover, women’s jobs seem to rely less on routine and non-routine manual skills in
comparison to men’s jobs, which might therefore be more susceptible to new digital technologies.
Last but not least, several differences are observed with regard to socio-emotional skills, which
26
are usually regarded as “soft” skills, which will likely be in higher demand in the future: women
are, on average, less emotionally stable and less open to experiences than men are. These results
are astonishingly robust across countries, although there are some differences between countries
concerning cognitive skills (reading and writing), interpersonal skills and ICT skills.
4.3. Impacts of new digital technologies on women’s and men’s jobs in developing countries
This section investigates how new digital technologies will likely affect men’s and women’s jobs.
Table 7 reports descriptive statistics (mean values) for both measures of digitalization—
computerization risk (destructive digitalization) and advances in AI (transformative
digitalization)—separately for male and female workers employed in different sectors.
In the full sample, the computerization risk is highest in the manufacturing sector (63.4 per cent
on average) and in “other” sectors (68.5 per cent on average), which include, for instance,
agriculture and mining, and it is substantially lower in the service sector (50.4 per cent on
average). Female workers in all sectors appear to face a significantly higher risk of
computerization in their occupation than male workers. The computerization risk, on average, is
about 2.9 per cent higher for women in the manufacturing sector and 3.7 per cent higher for
women in “other” sectors, while women in the service sector, on average, have a 1.9 per cent
higher computerization risk than men do.19 Women’s jobs are, on average, more likely to face a
higher computerization risk than men’s, if they are employed in manufacturing subsectors such
as “manufacture of food, beverages and tobacco”, “manufacture of textiles and leather” and
“manufacture of chemicals”. Women employed in the subsector “manufacture of metals” have,
on average, a lower computerization risk than men employed in the same sector. No significant
gender differences in computerization risk are observed in the subsector “manufacture of
computers, electronics and vehicles”. Remarkably, this manufacturing subsector is least affected
by computerization risk among all manufacturing subsectors.20
19 Figure A 1 in the Appensix additionally shows the distribution of computerization probabilities separately for both genders and for different sectors. It reveals that the manufacturing sector is affected more by destructive digitalization compared to the service sector, where a larger share of workers face only a relatively low computerization risk. 20 Figure A 3 in the Appendix additionally shows the share of jobs of male and female workers facing a very high risk of computerization (70 per cent and higher) in manufacturing subsectors. The share of jobs of both male and female workers strongly affected by computerization risk is lowest in the subsector “manufacture of computers, electronics and vehicles” (9.2 per cent for men vs. 3.6 per cent for women), and it is rather high in the subsector “manufacture of food, beverages and tobacco” (27.6 per cent for men vs. 50.7 per cent for women).
27
Table 7: Mean values of digitalization measures, by gender and industrial sector
Full sample Male Female
Female-male
difference
Comp. probability (corrected)
Full sample 0.551 0.550 0.552 0.001
Manufacturing 0.634 0.619 0.649 0.029***
Computers, electronics, vehicles 0.57 0.564 0.587 0.023
Other manuf. sectors: 0.639 0.623 0.652 0.029***
Food, beverages, tobacco 0.653 0.635 0.674 0.039***
Textiles, leather 0.650 0.633 0.655 0.023**
Wood, paper 0.619 0.621 0.614 -0.008
Chemicals 0.616 0.602 0.637 0.035*
Metals 0.607 0.621 0.534 -0.086**
Services 0.504 0.494 0.513 0.019***
Other sectors 0.685 0.673 0.710 0.037***
Advances in AI
Full sample 3.113 3.295 2.950 -0.345***
Manufacturing 3.088 3.272 2.916 -0.356***
Computers, electronics, vehicles 3.550 3.643 3.261 -0.382***
Other manuf. sectors: 3.036 3.228 2.885 -0.343***
Food, beverages, tobacco 2.965 3.103 2.827 -0.276***
Textiles, leather 2.883 3.014 2.839 -0.175***
Wood, paper 3.284 3.286 3.278 -0.008
Chemicals 3.269 3.406 3.066 -0.340***
Metals 3.410 3.448 3.210 -0.238**
Services 3.099 3.285 2.955 -0.329***
Other sectors 3.281 3.367 3.108 -0.259***
Note: Female-male differences in the mean values of digitalization measures. t-test of differences in means: *** p<0.000; ** p<0.05; * p<0.1. Other sectors include “agriculture, forestry and fishing”, “mining and quarrying”, “electricity, gas, steam and air conditioning supply”, “water supply, sewerage, waste management, remediation activities”, and “construction”. Source: Author’s calculations based on STEP surveys.
28
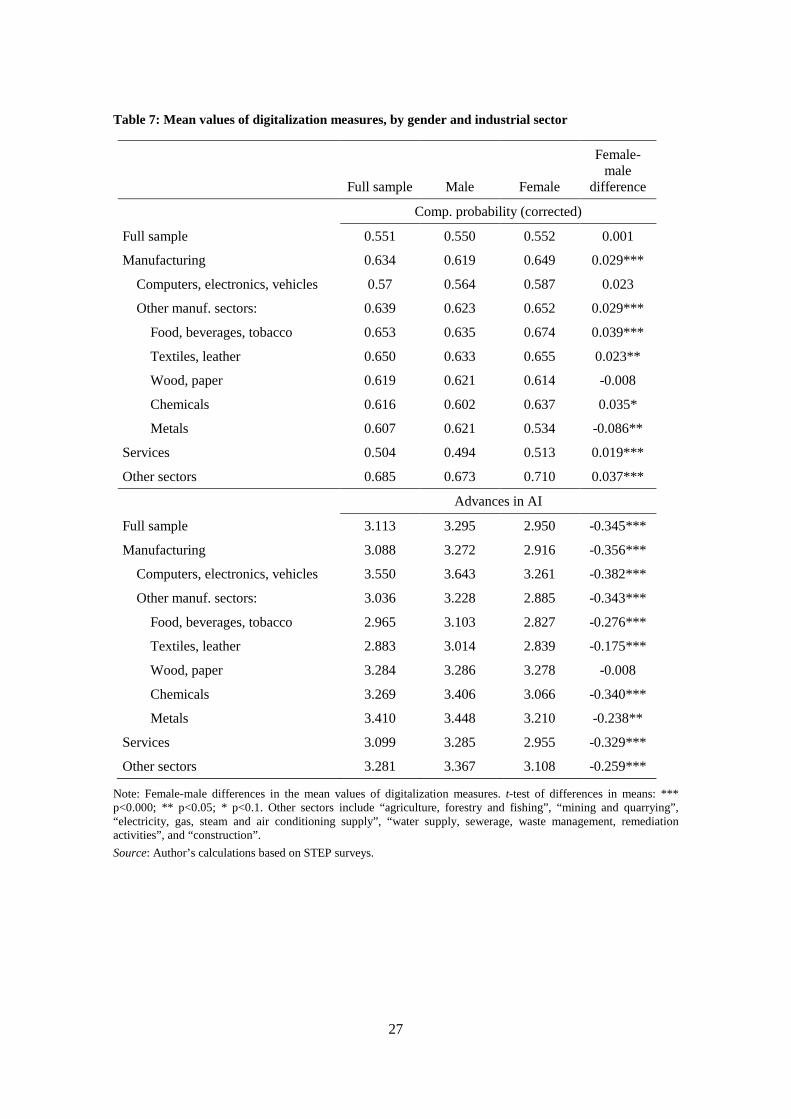
Turning to the advances in AI, which capture transformative digitalization, Table 7 reveals that
such advances have been particularly pronounced in the subsector “manufacture of computers,
electronics and vehicles” as well as in “other” sectors that include agriculture, mining and
construction, among others. Remarkably, women are significantly less likely than men to be
employed in occupations that consist of tasks in which strong advances have been made in AI in
the recent past. These gender differences are particularly strong in manufacturing subsectors, for
instance, “manufacture of computers, electronics and vehicles”, “manufacture of food and
beverages” and “manufacture of chemicals.”21
There are also considerable differences across countries (see Table A10 in the Appendix). The
average country-specific computerization risk varies between 39.4 per cent (in Georgia) and 65.1
per cent (in Laos). Women, on average, face a significantly higher computerization risk than men
in Bolivia, Colombia, Ghana, Kenya, Laos and Viet Nam. Women in Armenia, Georgia, North
Macedonia and Sri Lanka face, on average, a significantly lower computerization risk than men.
The impact of past advances in AI also varies considerably across countries: it is highest in
Armenia and Georgia and lowest in Ghana and Kenya. Past advances in AI have, on average,
been significantly slower in women’s jobs than in men’s jobs in all countries.
Table 8 reports the average levels of both digitalization measures separately for women and men
with different levels of formal education employed in different sectors. The impact of
digitalization varies considerably for individuals with different levels of formal education. We
find that the impact of destructive digitalization, which is operationalized by computerization
probabilities, is higher for individuals with lower levels of education, especially if they are
employed in the manufacturing and “other” sectors. For instance, the average risk of
computerization of occupations of male workers with low levels of education is 71.3 per cent in
the manufacturing sector and 65 per cent in the services sector. This suggests that the potential of
destructive digitalization to replace jobs of low-educated workers is much higher in the
manufacturing than in the service sector. For highly educated individuals, the average risk of
computerization is substantially lower and is around half of the level for low educated individuals.
Women in all sectors face a higher risk, on average, of computerization, independent of their level
21 Figure A 4 in the Appendix additionally shows the share of male and female workers who have witnessed an above average level of advances of AI in their occupations in manufacturing subsectors. The share of both male and female workers whose occupations have been strongly affected by advances in AI is highest in the subsector “manufacture of computers, electronics and vehicles” (93.5 per cent for men vs. 74.5 per cent for women), and it is rather low in the subsector “manufacture of textiles and leather” (34.9 per cent for men vs. 13.9 per cent for women).
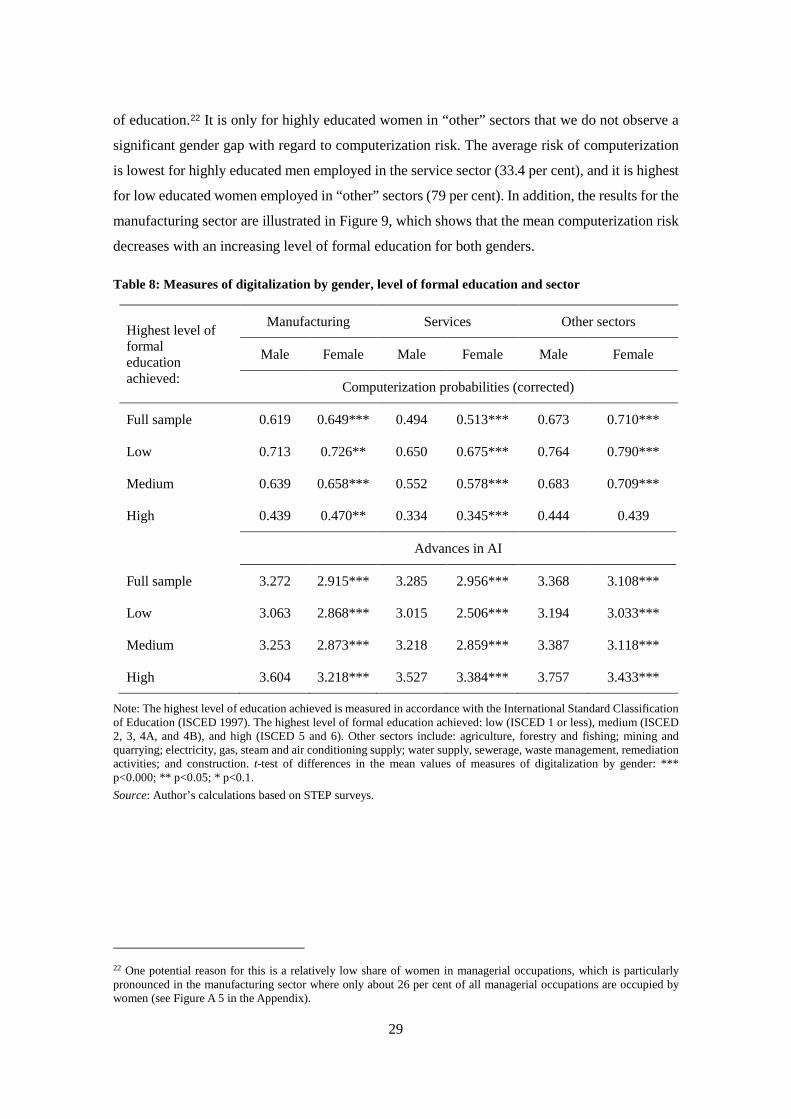
29
of education.22 It is only for highly educated women in “other” sectors that we do not observe a
significant gender gap with regard to computerization risk. The average risk of computerization
is lowest for highly educated men employed in the service sector (33.4 per cent), and it is highest
for low educated women employed in “other” sectors (79 per cent). In addition, the results for the
manufacturing sector are illustrated in Figure 9, which shows that the mean computerization risk
decreases with an increasing level of formal education for both genders.
Table 8: Measures of digitalization by gender, level of formal education and sector
Highest level of formal education achieved:
Manufacturing Services Other sectors
Male Female Male Female Male Female
Computerization probabilities (corrected)
Full sample 0.619 0.649*** 0.494 0.513*** 0.673 0.710***
Low 0.713 0.726** 0.650 0.675*** 0.764 0.790***
Medium 0.639 0.658*** 0.552 0.578*** 0.683 0.709***
High 0.439 0.470** 0.334 0.345*** 0.444 0.439
Advances in AI
Full sample 3.272 2.915*** 3.285 2.956*** 3.368 3.108***
Low 3.063 2.868*** 3.015 2.506*** 3.194 3.033***
Medium 3.253 2.873*** 3.218 2.859*** 3.387 3.118***
High 3.604 3.218*** 3.527 3.384*** 3.757 3.433***
Note: The highest level of education achieved is measured in accordance with the International Standard Classification of Education (ISCED 1997). The highest level of formal education achieved: low (ISCED 1 or less), medium (ISCED 2, 3, 4A, and 4B), and high (ISCED 5 and 6). Other sectors include: agriculture, forestry and fishing; mining and quarrying; electricity, gas, steam and air conditioning supply; water supply, sewerage, waste management, remediation activities; and construction. t-test of differences in the mean values of measures of digitalization by gender: *** p<0.000; ** p<0.05; * p<0.1. Source: Author’s calculations based on STEP surveys.
22 One potential reason for this is a relatively low share of women in managerial occupations, which is particularly pronounced in the manufacturing sector where only about 26 per cent of all managerial occupations are occupied by women (see Figure A 5 in the Appendix).
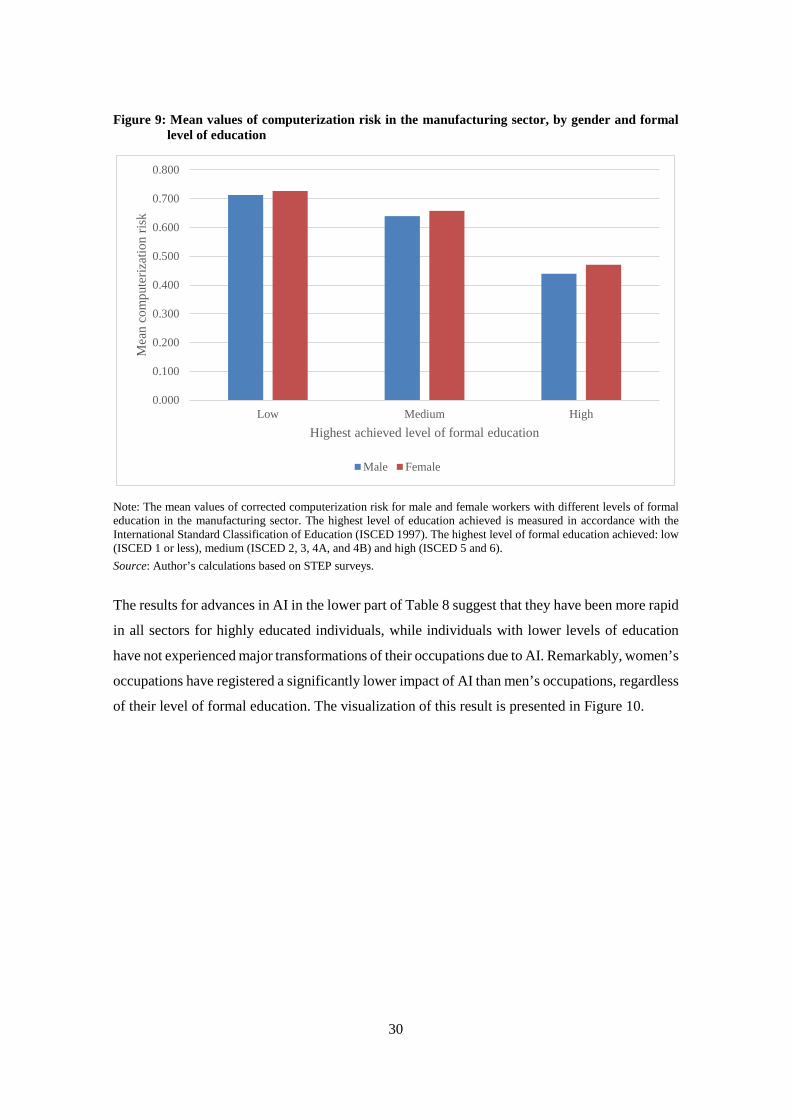
30
Figure 9: Mean values of computerization risk in the manufacturing sector, by gender and formal level of education
Note: The mean values of corrected computerization risk for male and female workers with different levels of formal education in the manufacturing sector. The highest level of education achieved is measured in accordance with the International Standard Classification of Education (ISCED 1997). The highest level of formal education achieved: low (ISCED 1 or less), medium (ISCED 2, 3, 4A, and 4B) and high (ISCED 5 and 6). Source: Author’s calculations based on STEP surveys.
The results for advances in AI in the lower part of Table 8 suggest that they have been more rapid
in all sectors for highly educated individuals, while individuals with lower levels of education
have not experienced major transformations of their occupations due to AI. Remarkably, women’s
occupations have registered a significantly lower impact of AI than men’s occupations, regardless
of their level of formal education. The visualization of this result is presented in Figure 10.
0.000
0.100
0.200
0.300
0.400
0.500
0.600
0.700
0.800
Low Medium High
Mea
n co
mpu
teriz
atio
n ris
k
Highest achieved level of formal education
Male Female
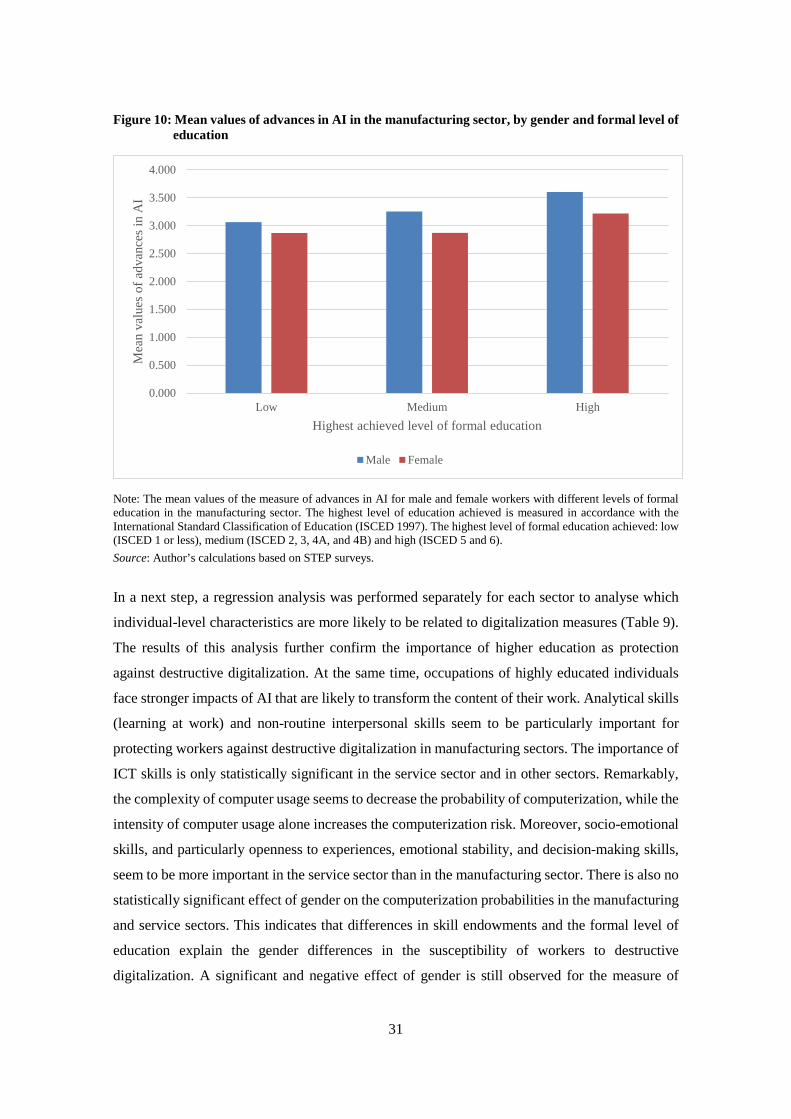
31
Figure 10: Mean values of advances in AI in the manufacturing sector, by gender and formal level of education
Note: The mean values of the measure of advances in AI for male and female workers with different levels of formal education in the manufacturing sector. The highest level of education achieved is measured in accordance with the International Standard Classification of Education (ISCED 1997). The highest level of formal education achieved: low (ISCED 1 or less), medium (ISCED 2, 3, 4A, and 4B) and high (ISCED 5 and 6). Source: Author’s calculations based on STEP surveys.
In a next step, a regression analysis was performed separately for each sector to analyse which
individual-level characteristics are more likely to be related to digitalization measures (Table 9).
The results of this analysis further confirm the importance of higher education as protection
against destructive digitalization. At the same time, occupations of highly educated individuals
face stronger impacts of AI that are likely to transform the content of their work. Analytical skills
(learning at work) and non-routine interpersonal skills seem to be particularly important for
protecting workers against destructive digitalization in manufacturing sectors. The importance of
ICT skills is only statistically significant in the service sector and in other sectors. Remarkably,
the complexity of computer usage seems to decrease the probability of computerization, while the
intensity of computer usage alone increases the computerization risk. Moreover, socio-emotional
skills, and particularly openness to experiences, emotional stability, and decision-making skills,
seem to be more important in the service sector than in the manufacturing sector. There is also no
statistically significant effect of gender on the computerization probabilities in the manufacturing
and service sectors. This indicates that differences in skill endowments and the formal level of
education explain the gender differences in the susceptibility of workers to destructive
digitalization. A significant and negative effect of gender is still observed for the measure of
0.000
0.500
1.000
1.500
2.000
2.500
3.000
3.500
4.000
Low Medium High
Mea
n va
lues
of a
dvan
ces i
n A
I
Highest achieved level of formal education
Male Female
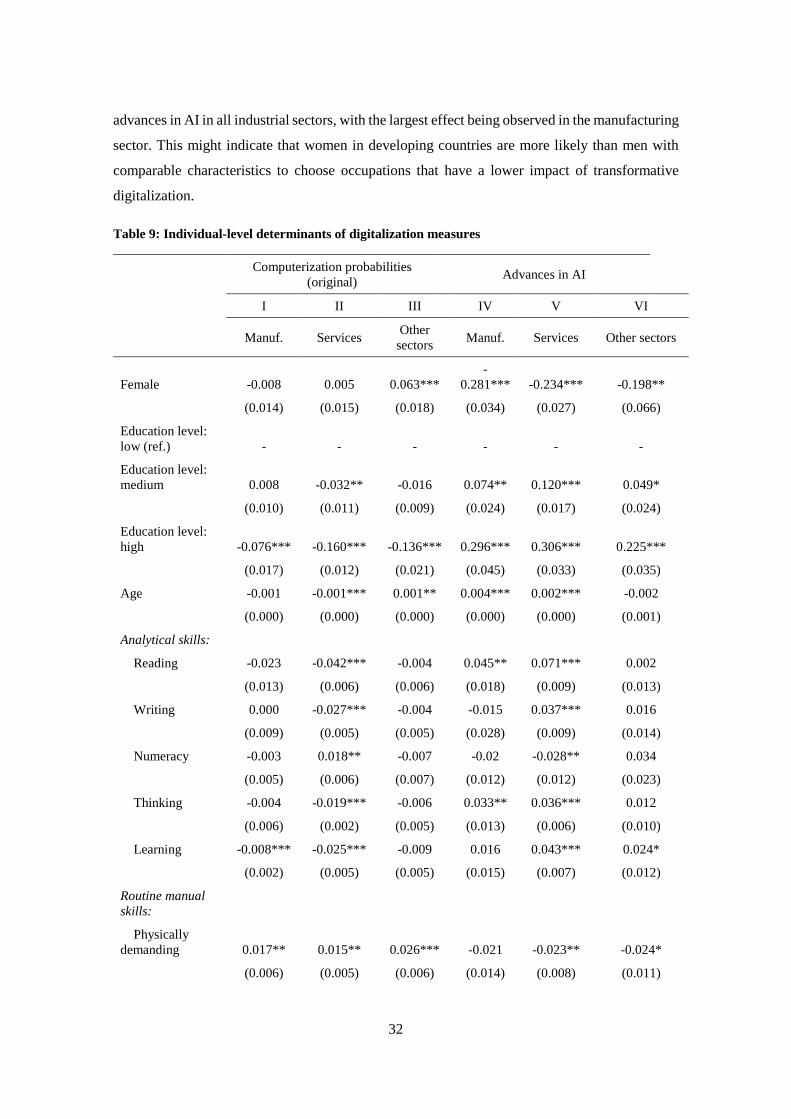
32
advances in AI in all industrial sectors, with the largest effect being observed in the manufacturing
sector. This might indicate that women in developing countries are more likely than men with
comparable characteristics to choose occupations that have a lower impact of transformative
digitalization.
Table 9: Individual-level determinants of digitalization measures
Computerization probabilities
(original) Advances in AI
I II III IV V VI
Manuf. Services Other sectors Manuf. Services Other sectors
Female -0.008 0.005 0.063*** -
0.281*** -0.234*** -0.198**
(0.014) (0.015) (0.018) (0.034) (0.027) (0.066)
Education level: low (ref.) - - - - - -
Education level: medium 0.008 -0.032** -0.016 0.074** 0.120*** 0.049*
(0.010) (0.011) (0.009) (0.024) (0.017) (0.024)
Education level: high -0.076*** -0.160*** -0.136*** 0.296*** 0.306*** 0.225***
(0.017) (0.012) (0.021) (0.045) (0.033) (0.035)
Age -0.001 -0.001*** 0.001** 0.004*** 0.002*** -0.002
(0.000) (0.000) (0.000) (0.000) (0.000) (0.001)
Analytical skills:
Reading -0.023 -0.042*** -0.004 0.045** 0.071*** 0.002
(0.013) (0.006) (0.006) (0.018) (0.009) (0.013)
Writing 0.000 -0.027*** -0.004 -0.015 0.037*** 0.016
(0.009) (0.005) (0.005) (0.028) (0.009) (0.014)
Numeracy -0.003 0.018** -0.007 -0.02 -0.028** 0.034
(0.005) (0.006) (0.007) (0.012) (0.012) (0.023)
Thinking -0.004 -0.019*** -0.006 0.033** 0.036*** 0.012
(0.006) (0.002) (0.005) (0.013) (0.006) (0.010)
Learning -0.008*** -0.025*** -0.009 0.016 0.043*** 0.024*
(0.002) (0.005) (0.005) (0.015) (0.007) (0.012)
Routine manual skills:
Physically demanding 0.017** 0.015** 0.026*** -0.021 -0.023** -0.024*
(0.006) (0.005) (0.006) (0.014) (0.008) (0.011)
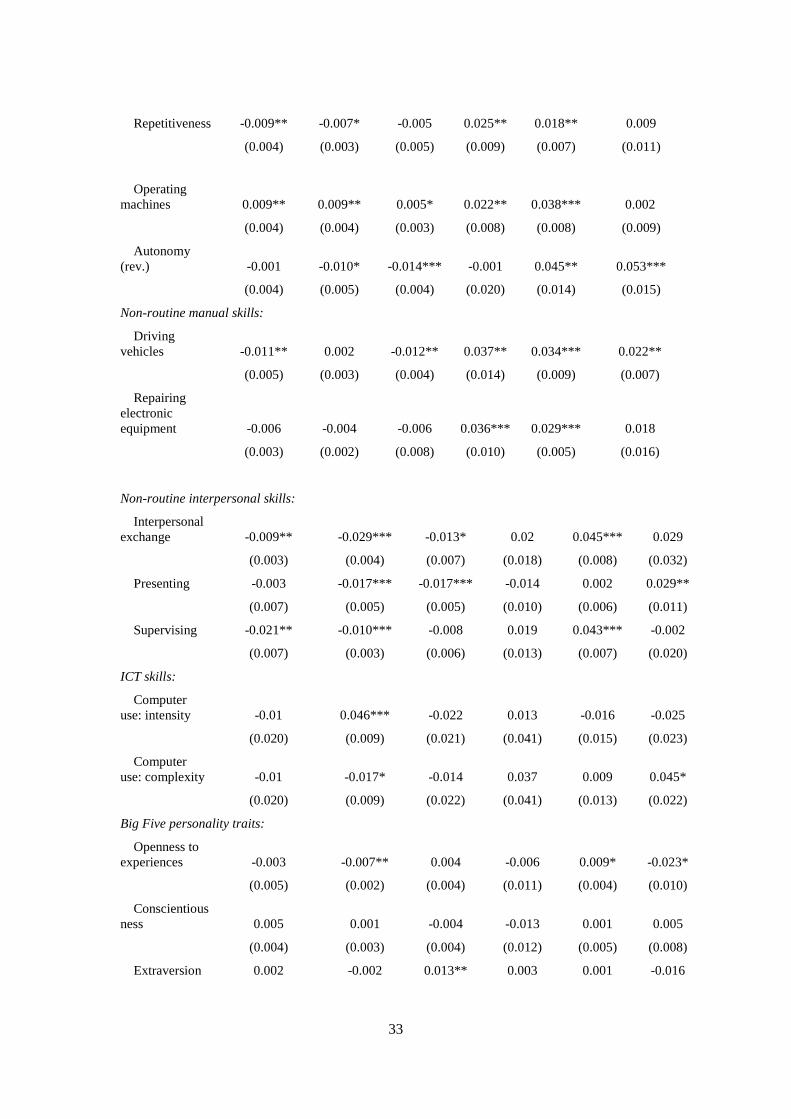
33
Repetitiveness -0.009** -0.007* -0.005 0.025** 0.018** 0.009
(0.004) (0.003) (0.005) (0.009) (0.007) (0.011)
Operating machines 0.009** 0.009** 0.005* 0.022** 0.038*** 0.002
(0.004) (0.004) (0.003) (0.008) (0.008) (0.009)
Autonomy (rev.) -0.001 -0.010* -0.014*** -0.001 0.045** 0.053***
(0.004) (0.005) (0.004) (0.020) (0.014) (0.015)
Non-routine manual skills:
Driving vehicles -0.011** 0.002 -0.012** 0.037** 0.034*** 0.022**
(0.005) (0.003) (0.004) (0.014) (0.009) (0.007)
Repairing electronic equipment -0.006 -0.004 -0.006 0.036*** 0.029*** 0.018
(0.003) (0.002) (0.008) (0.010) (0.005) (0.016)
Non-routine interpersonal skills:
Interpersonal exchange -0.009** -0.029*** -0.013* 0.02 0.045*** 0.029
(0.003) (0.004) (0.007) (0.018) (0.008) (0.032)
Presenting -0.003 -0.017*** -0.017*** -0.014 0.002 0.029**
(0.007) (0.005) (0.005) (0.010) (0.006) (0.011)
Supervising -0.021** -0.010*** -0.008 0.019 0.043*** -0.002
(0.007) (0.003) (0.006) (0.013) (0.007) (0.020)
ICT skills:
Computer use: intensity -0.01 0.046*** -0.022 0.013 -0.016 -0.025
(0.020) (0.009) (0.021) (0.041) (0.015) (0.023)
Computer use: complexity -0.01 -0.017* -0.014 0.037 0.009 0.045*
(0.020) (0.009) (0.022) (0.041) (0.013) (0.022)
Big Five personality traits:
Openness to experiences -0.003 -0.007** 0.004 -0.006 0.009* -0.023*
(0.005) (0.002) (0.004) (0.011) (0.004) (0.010)
Conscientiousness 0.005 0.001 -0.004 -0.013 0.001 0.005
(0.004) (0.003) (0.004) (0.012) (0.005) (0.008)
Extraversion 0.002 -0.002 0.013** 0.003 0.001 -0.016
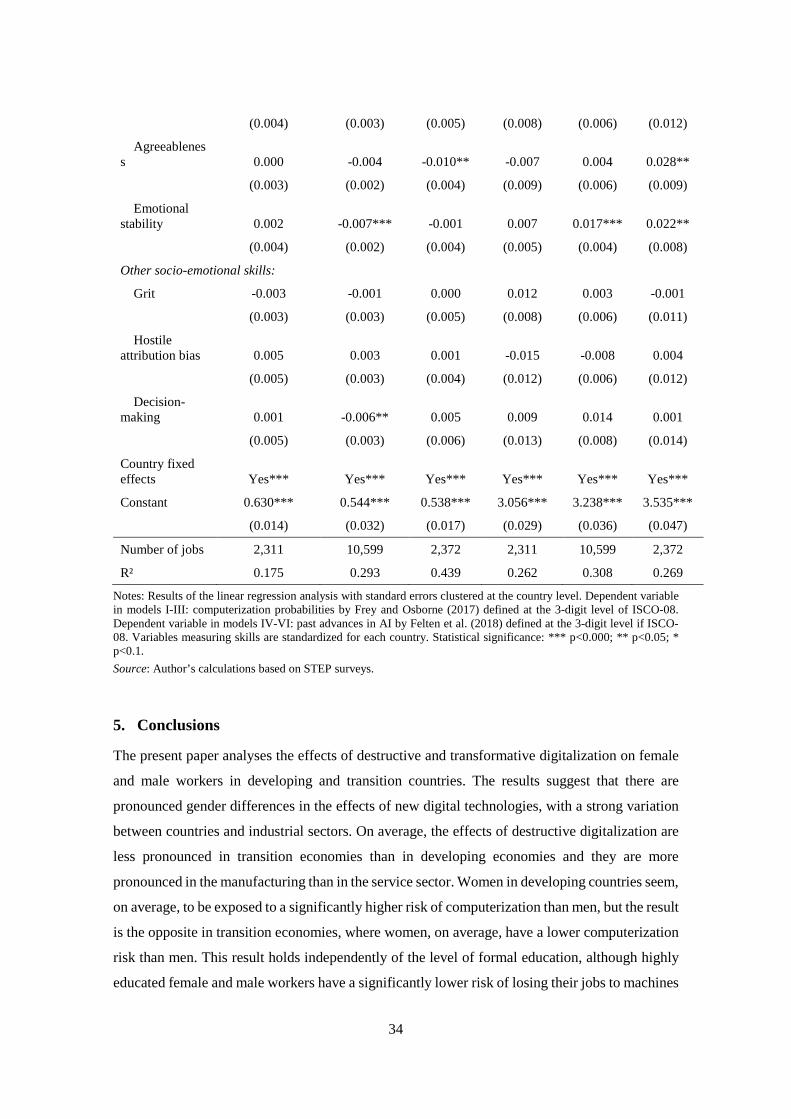
34
(0.004) (0.003) (0.005) (0.008) (0.006) (0.012)
Agreeableness 0.000 -0.004 -0.010** -0.007 0.004 0.028**
(0.003) (0.002) (0.004) (0.009) (0.006) (0.009)
Emotional stability 0.002 -0.007*** -0.001 0.007 0.017*** 0.022**
(0.004) (0.002) (0.004) (0.005) (0.004) (0.008)
Other socio-emotional skills:
Grit -0.003 -0.001 0.000 0.012 0.003 -0.001
(0.003) (0.003) (0.005) (0.008) (0.006) (0.011)
Hostile attribution bias 0.005 0.003 0.001 -0.015 -0.008 0.004
(0.005) (0.003) (0.004) (0.012) (0.006) (0.012)
Decision-making 0.001 -0.006** 0.005 0.009 0.014 0.001
(0.005) (0.003) (0.006) (0.013) (0.008) (0.014)
Country fixed effects Yes*** Yes*** Yes*** Yes*** Yes*** Yes***
Constant 0.630*** 0.544*** 0.538*** 3.056*** 3.238*** 3.535***
(0.014) (0.032) (0.017) (0.029) (0.036) (0.047)
Number of jobs 2,311 10,599 2,372 2,311 10,599 2,372
R² 0.175 0.293 0.439 0.262 0.308 0.269
Notes: Results of the linear regression analysis with standard errors clustered at the country level. Dependent variable in models I-III: computerization probabilities by Frey and Osborne (2017) defined at the 3-digit level of ISCO-08. Dependent variable in models IV-VI: past advances in AI by Felten et al. (2018) defined at the 3-digit level if ISCO-08. Variables measuring skills are standardized for each country. Statistical significance: *** p<0.000; ** p<0.05; * p<0.1. Source: Author’s calculations based on STEP surveys.
5. Conclusions
The present paper analyses the effects of destructive and transformative digitalization on female
and male workers in developing and transition countries. The results suggest that there are
pronounced gender differences in the effects of new digital technologies, with a strong variation
between countries and industrial sectors. On average, the effects of destructive digitalization are
less pronounced in transition economies than in developing economies and they are more
pronounced in the manufacturing than in the service sector. Women in developing countries seem,
on average, to be exposed to a significantly higher risk of computerization than men, but the result
is the opposite in transition economies, where women, on average, have a lower computerization
risk than men. This result holds independently of the level of formal education, although highly
educated female and male workers have a significantly lower risk of losing their jobs to machines
35
than workers with low levels of education. In the manufacturing sector, women are particularly
vulnerable to destructive digitalization, if they are employed in the manufacture of food,
beverages and tobacco, or in the manufacture of textiles and wearing apparel, where the share of
the female workforce is high. Indeed, several disruptive innovations in the textile industry, such
as automatic sewing machines and 3D printing technology, combined with a growing trend
towards higher demand for customized products, have a potential to displace a significant number
of workers in this industry.
Moreover, impacts of transformative digitalization also vary for male and female workers.
Women’s jobs are significantly less likely than men’s to be affected by recent advances in AI.
Past advances in AI can be regarded as a transformative aspect of digitalization that will likely
change the content of work, since it affects areas in which human workers interact with machines,
but cannot be entirely replaced by them. Transformative impacts of AI on women’s jobs are
significantly lower compared to men’s jobs in all countries in the sample (developing and
transition economies). The impact of AI is lowest and the gender difference in terms of AI’s
impact highest in the manufacturing sector. Moreover, the impact of AI is stronger for workers
with high levels of formal education. This suggests that the occupations of highly skilled workers,
in particular, will be affected by changes that will likely be due to transformative digital
technologies.
Significant gender gaps were observed in all countries in the so-called “skills of the future”, i.e.
skills that represent bottlenecks to digitalization, such as analytical and interpersonal skills, and
skills that are necessary to cope with the digital transformation of occupations, such as ICT skills
and socio-emotional skills. Gender differences in these skill endowments seem to explain the
gender differences in computerization risk in manufacturing and services. Gender differences in
ICT skills and in socio-emotional skills seem to play a more important role in services than in
manufacturing. Moreover, advanced ICT skills (the complexity of ICT use) are more relevant
than just the frequency of ICT use. In turn, women in all industrial sectors are less likely than men
to work in occupations that will be exposed to a high impact of AI (transformative digitalization),
even if they have comparable levels of formal education and skills. This result seems to be
particularly pronounced in manufacturing.
This paper is not without limitations. First, the STEP dataset comprises individuals who reside in
urban areas of developing and transition countries. However, it is likely that the urban population
in these countries differs from the rural population in terms of level of formal education and skill
endowments. Thus, we can expect to find even stronger gender differences in rural areas. To date,
there is no comparable dataset available that is representative of the entire population in these
36
countries. Second, the estimates of impacts of digitalization provided in this paper are based on
current technological possibilities. For instance, computerization probabilities measure the extent
to which it will be possible for a digital technology to replace human workers in their jobs in the
near future. In turn, past advances in AI reflect the speed at which this digital technology recently
developed in certain occupational areas, such as visual recognition and translation, among many
others. It might be the case, however, that developing and transition economies have a lower
technological absorptive capacity, which could be attributable to a number of reasons. For
example, low-skilled workers might not be prepared to use and maintain advanced technologies.
Moreover, there might be lower levels of capital available for investment in new digital
technologies. For these reasons, we can expect that the actual impact of new digital technologies
on the workforce will be lower (Manyika et al., 2017). In addition, the time horizons for the impact
of these technologies to fully unfold may be longer.
The results of this study highlight several implications for policymakers. First, female workers
seem to be particularly vulnerable to destructive digitalization of their occupations because they
lack analytical skills, such as numeracy skills; their jobs require less complex and abstract skills,
such as learning new things at work; and they possess lower levels of interpersonal skills, such as
supervising skills. New digital technologies will also require workers to have advanced ICT skills.
Women in many developing countries currently only possess relatively low ICT skills. Thus,
education programmes specifically designed for women are needed to reduce the digital gender
divide, and at the same time, the general level of digital literacy needs to be improved in these
countries. Second, the lack of interpersonal skills among women, particularly supervising skills,
is likely due to a relatively low share of women in managerial positions. This gender gap is
particularly striking in the manufacturing sector where women are generally underrepresented.
Given that new digital technologies have the potential to improve the quality of work by replacing
occupations with high risks for health (e.g. occupations that are very physically demanding), jobs
in the manufacturing sector may become more attractive for the female workforce in the future.
Further action should be taken to improve the opportunities for women to participate in
managerial occupations. Third, another important result of this study is that occupations held by
highly educated individuals will face major changes due to new digital technologies, such as AI.
This suggests that continuing education programmes for highly educated individuals need to be
designed to ensure that they can successfully deal with the transformative digitalization of their
occupations. This means that lifelong learning is likely to become an important form of education
in the digital age.
37
References
Acemoglu, D. and D. Autor (2011): Skills, tasks and technologies: Implications for employment and earnings. In: Ashenfelter, O. and D.E. Card (eds.): Handbook of Labor Economics, Vol. 4B, 1043-1171. Amsterdam: Elsevier B.V.
Arntz, M., T. Gregory, and U. Zierahn (2017): Revisiting the risk of automation. Economics Letters, 159, 157-160.
Autor, D.H. and M.J. Handel (2013): Putting Tasks to the Test: Human Capital, Job Tasks, and Wages, Journal of Labor Economics, 31(2), 59-96.
Autor, D.H., F. Levy, and R.J. Murnane (2003): The skill content of recent technological change: An empirical exploration. The Quarterly journal of economics, 118(4), 1279-1333.
Autor, D. H., D. Dorn, and G.H. Hanson (2015): Untangling trade and technology: Evidence from local labour markets. The Economic Journal, 125(584), 621-646.
Becker, S.O., K. Ekholm, and M.A. Muendler (2013): Offshoring and the onshore composition of tasks and skills. Journal of International Economics, 90(1), 91-106.
Berger, T. and C.B. Frey (2016): Structural Transformation in the OECD: Digitalisation, Deindustrialisation and the Future of Work. OECD Social, Employment and Migration Working Papers No. 193.
Bode E., S. Brunow, I. Ott, and A. Sorgner (2017): Worker Personality: Another Skills Bias Beyond Education in the Digital Age. Forthcoming in German Economic Review. https://doi.org/10.1111/geer.12165
Borghans L., A.L. Duckworth, J.J. Heckman, and B. ter Weel (2008): The Economics and Psychology of Personality Traits. Journal of Human Resources 43 (4): 972–1059.
Brussevich, M., E. Dabla-Norris, C. Kamunge, P. Karnane, S. Khalid, and K. Kochhar (2018): Gender, Technology, and the Future of Work. International Monetary Fund Staff Discussion Note. SDN18/07.
Brynjolfsson, E. and A. McAfee (2014): The second machine age: Work, progress, and prosperity in a time of brilliant technologies. WW Norton & Company.
Chang, J.-H. and P. Huynh (2016): ASEAN in Transformation: The Future of Jobs at Risk of Automation. Bureau for Employers’ Activities, Working Paper No 9, Internaltional Labour Office.
Christov-Moore, L., E.A. Simpson, G. Coudé, K. Grigaityte, M. Iacoboni, and P.F. Ferrari (2014): Empathy: gender effects in brain and behavior. Neuroscience and biobehavioral reviews, 46 Pt 4(Pt 4), 604-27.
Cobb-Clark, D. and S. Schurer (2012): The stability of big-five personality traits. Economics Letters, 115, 11-15.
Costa, P. T. and R.R. McCrae (1992): Revised NEO personality inventory (NEO-PI-R) and NEO five factor inventory (NEOFFI) professional manual. Odessa: PAR.
De La Rica, S. and L. Gortazar (2017): Digitalization at work, Job Tasks and Wages: Cross-Country evidence from PIAAC1. Global Labor Organization Discussion Paper No. 22. Deming, D.J. (2017): The growing importance of social skills in the labor market. The
Quarterly Journal of Economics, 132(4), 1593-1640. Dicarlo, E., A.M. Oviedo, S. Lo Bello, M.L. Sanchez-Puerta, S. Monroy-Taborda, and I. Santos
(2016): The Skill Content of Occupations across Low and Middle Income Countries: Evidence from Harmonized Data. IZA Discussion Paper Series, No. 10224.
38
EIGE (2018): Gender Equality and Digitalisation in the European Union. https://eige.europa.eu/publications/gender-equality-and-digitalisation-european-union
European Commission (2018): Women in the Digital Age. A study prepared for the European Commission. https://ec.europa.eu/digital-single-market/en/news/increase-gender-gap-digital-sector-study-women-digital-age
Felten, E.W., M. Raj, and R. Seamans (2018): A Method to Link Advances in Artificial Intelligence to Occupational Abilities. American Economic Association Papers and Proceedings, 108, 54-57.
Fossen, F. and A. Sorgner (2019a): New Digital Technologies and Heterogeneous Employment and Wage Dynamics in the United States: Evidence from Individual-Level Data. IZA Discussion Paper Series, No. 12242.
Fossen, F. and A. Sorgner (2019b): Mapping the Future of Occupations: Transformative and Destructive Effects of New Digital Technologies on Jobs. Foresight & STI Governance, 13(2), 10–18. DOI: 10.17323/2500-2597.2019.2.10.18.
Frey, C.B., and M.A. Osborne (2017): The Future of Employment: How Susceptible are Jobs to Computerization? Technological Forecasting and Social Change 114: 254–280.
Goos, M., A. Manning, and A. Salomons (2014): Explaining job polarization: Routine-Biased Technological Change and Offshoring. American Economic Review, 104(8), 2509-2526.
Graetz, G. and G. Michaels (2018): Robots at Work. Review of Economics and Statistics, 100(5), 753-768.
Heath, R. and A.M. Mobarak (2015): Manufacturing growth and the lives of Bangladeshi women, Journal of Development Economics, 115, 1-15.
Hilbert, M. (2011): Digital gender divide or technologically empowered women in developing countries? A typical case of lies, damned lies, and statistics. Women’s Studies International Forum, 34, 479-489.
Maloney, W.F. and C. Molina (2016): Are Automation and Trade Polarizing Developing Country Labor Markets, Too? World Bank Policy Research Working Paper #7922.
Manyika, J., S. Lund, M. Chui, J. Bughin, J. Woetzel, P. Batra, R. Ko, and S. Sanghvi (2017): Jobs lost, jobs gained: Workforce transitions in a time of automation. McKinsey Global Report.
Mariscal, J., G. Mayne, U. Aneja, and A. Sorgner (2019): Bridging the Gender Digital Gap. Economics: The Open-Access, Open-Assessment E-Journal, 13, 1-12.
OECD (2017): Going Digital: The Future of Work for Women. OECD Publishing, Paris, https://www.oecd.org/employment/Going-Digital-the-Future-of-Work-for-Women.pdf
OECD (2018): Bridging the Digital Gender Divide: Include, Upskill, Innovate, OECD Publishing, Paris, http://www.oecd.org/internet/bridging-the-digital-gender-divide.pdf
Ramirez F.O. and N. Kwak (2015): Women’s Enrollments in STEM in Higher Education: Cross-National Trends, 1970–2010. In: Pearson, Jr. W., Frehill L., and McNeely C. (eds.): Advancing Women in Science. Springer, Cham.
Rashid, A.T. (2016): Digital Inclusion and Social Inequality: Gender Differences in ICT Access and Use in Five Developing Countries. Gender, Technology and Development, 20(3), 306–332.
Schein, V. E. (2001): A global look at psychological barriers to women's progress in management. Journal of Social issues, 57(4), 675-688.
39
Schmitt, D. P., A. Realo, M. Voracek, and J. Alik (2008): Why can’t a man be more like a woman? Sex differences in Big Five personality traits across 55 cultures. Journal of Personality and Social Psychology, 94, 168–192.
Schmitt, D.P., A.E. Long, A. McPhearson, K. O’Brien, B. Remmert, and S.H. Shah (2017): Personality and gender differences in global perspective, International Journal of Psychology, 52(1), 45–56. DOI: 10.1002/ijop.12265.
Sorgner A., Bode, E., and Krieger-Boden, C. (2017): The Effects of Digitalization on Gender Equality in the G20 economies. E-book. Kiel Institute for the World Economy, Kiel, https://www.ifw-kiel.de/pub/e-books/digital_women-final_report.pdf.
Spitz-Oener, A. (2006): Technical change, job tasks, and rising educational demands: looking outside the wage structure. Journal of Labor Economics, 24(2), 235-270.
Stoet, G. and D.C. Geary (2018): The Gender-Equality Paradox in Science, Technology, Engineering, and Mathematics Education, Psychological Science, 29(4), 581–593, https://doi.org/10.1177/0956797617741719
Strohmeyer, R., V. Tonoyan, and J.E. Jennings (2017): Jacks-(and Jills)-of-all-trades: On whether, how and why gender influences firm innovativeness. Journal of Business Venturing, 32(5), 498-518.
Weisberg, Y., C.G. DeYoung, and J.B. Hirsh (2011): Gender differences in personality across the ten aspects of the Big Five. Frontiers in Psychology, DOI: 10.3389/fpsyg.2011.00178.
World Bank (2016): Digital Dividends. World Development Report 2016.
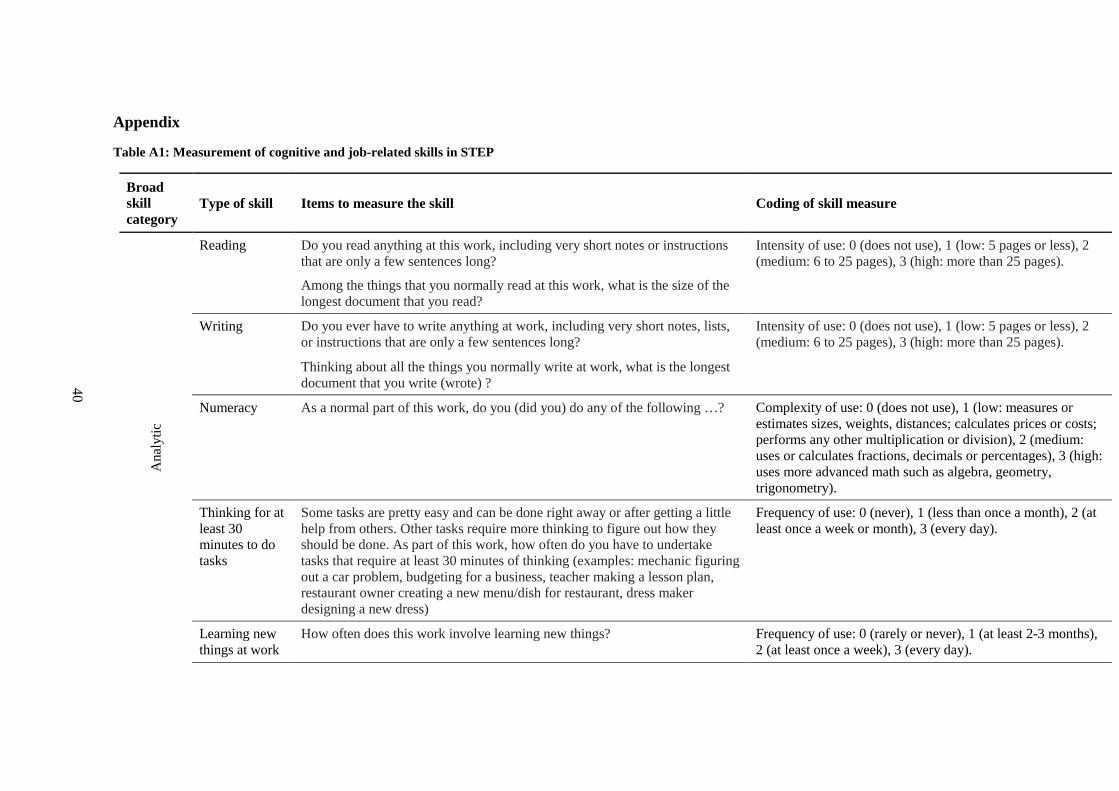
40
Appendix
Table A1: Measurement of cognitive and job-related skills in STEP
Broad skill category
Type of skill Items to measure the skill Coding of skill measure
Ana
lytic
Reading Do you read anything at this work, including very short notes or instructions that are only a few sentences long?
Intensity of use: 0 (does not use), 1 (low: 5 pages or less), 2 (medium: 6 to 25 pages), 3 (high: more than 25 pages).
Among the things that you normally read at this work, what is the size of the longest document that you read?
Writing Do you ever have to write anything at work, including very short notes, lists, or instructions that are only a few sentences long?
Intensity of use: 0 (does not use), 1 (low: 5 pages or less), 2 (medium: 6 to 25 pages), 3 (high: more than 25 pages).
Thinking about all the things you normally write at work, what is the longest document that you write (wrote) ?
Numeracy As a normal part of this work, do you (did you) do any of the following …? Complexity of use: 0 (does not use), 1 (low: measures or estimates sizes, weights, distances; calculates prices or costs; performs any other multiplication or division), 2 (medium: uses or calculates fractions, decimals or percentages), 3 (high: uses more advanced math such as algebra, geometry, trigonometry).
Thinking for at least 30 minutes to do tasks
Some tasks are pretty easy and can be done right away or after getting a little help from others. Other tasks require more thinking to figure out how they should be done. As part of this work, how often do you have to undertake tasks that require at least 30 minutes of thinking (examples: mechanic figuring out a car problem, budgeting for a business, teacher making a lesson plan, restaurant owner creating a new menu/dish for restaurant, dress maker designing a new dress)
Frequency of use: 0 (never), 1 (less than once a month), 2 (at least once a week or month), 3 (every day).
Learning new things at work
How often does this work involve learning new things? Frequency of use: 0 (rarely or never), 1 (at least 2-3 months), 2 (at least once a week), 3 (every day).
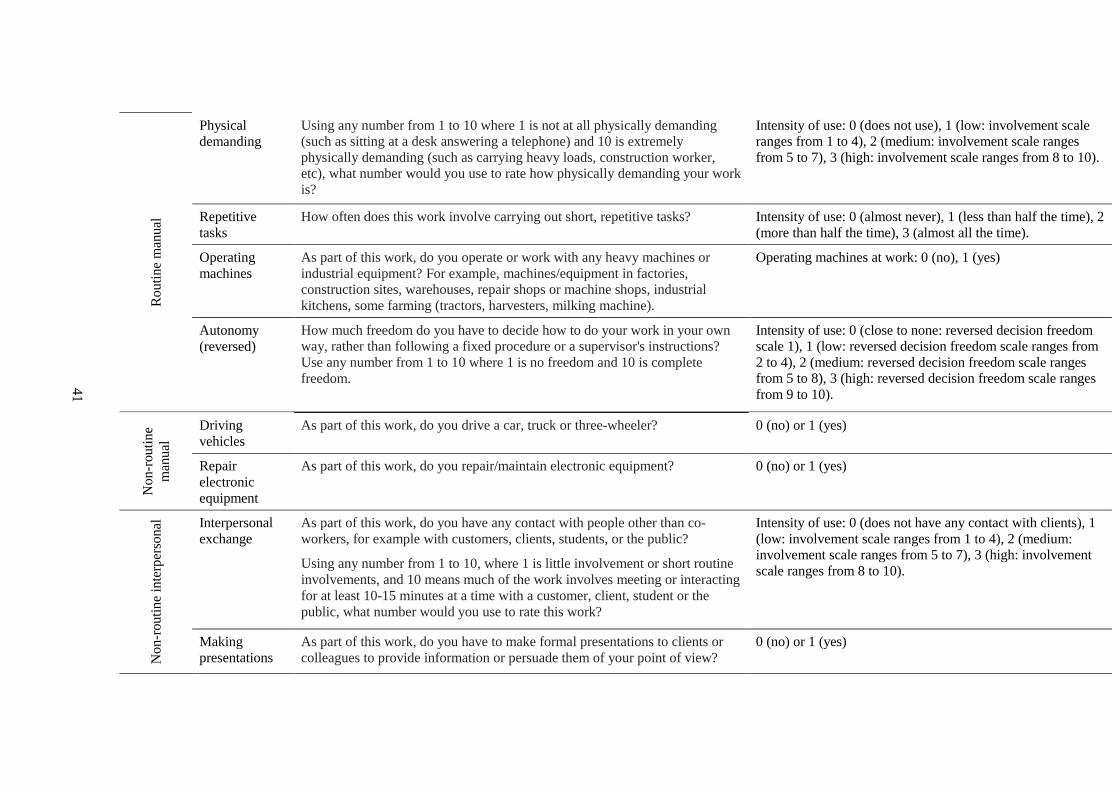
41
Rou
tine
man
ual
Physical demanding
Using any number from 1 to 10 where 1 is not at all physically demanding (such as sitting at a desk answering a telephone) and 10 is extremely physically demanding (such as carrying heavy loads, construction worker, etc), what number would you use to rate how physically demanding your work is?
Intensity of use: 0 (does not use), 1 (low: involvement scale ranges from 1 to 4), 2 (medium: involvement scale ranges from 5 to 7), 3 (high: involvement scale ranges from 8 to 10).
Repetitive tasks
How often does this work involve carrying out short, repetitive tasks? Intensity of use: 0 (almost never), 1 (less than half the time), 2 (more than half the time), 3 (almost all the time).
Operating machines
As part of this work, do you operate or work with any heavy machines or industrial equipment? For example, machines/equipment in factories, construction sites, warehouses, repair shops or machine shops, industrial kitchens, some farming (tractors, harvesters, milking machine).
Operating machines at work: 0 (no), 1 (yes)
Autonomy (reversed)
How much freedom do you have to decide how to do your work in your own way, rather than following a fixed procedure or a supervisor's instructions? Use any number from 1 to 10 where 1 is no freedom and 10 is complete freedom.
Intensity of use: 0 (close to none: reversed decision freedom scale 1), 1 (low: reversed decision freedom scale ranges from 2 to 4), 2 (medium: reversed decision freedom scale ranges from 5 to 8), 3 (high: reversed decision freedom scale ranges from 9 to 10).
Non
-rout
ine
man
ual
Driving vehicles
As part of this work, do you drive a car, truck or three-wheeler? 0 (no) or 1 (yes)
Repair electronic equipment
As part of this work, do you repair/maintain electronic equipment? 0 (no) or 1 (yes)
Non
-rout
ine
inte
rper
sona
l Interpersonal exchange
As part of this work, do you have any contact with people other than co-workers, for example with customers, clients, students, or the public?
Intensity of use: 0 (does not have any contact with clients), 1 (low: involvement scale ranges from 1 to 4), 2 (medium: involvement scale ranges from 5 to 7), 3 (high: involvement scale ranges from 8 to 10). Using any number from 1 to 10, where 1 is little involvement or short routine
involvements, and 10 means much of the work involves meeting or interacting for at least 10-15 minutes at a time with a customer, client, student or the public, what number would you use to rate this work?
Making presentations
As part of this work, do you have to make formal presentations to clients or colleagues to provide information or persuade them of your point of view?
0 (no) or 1 (yes)
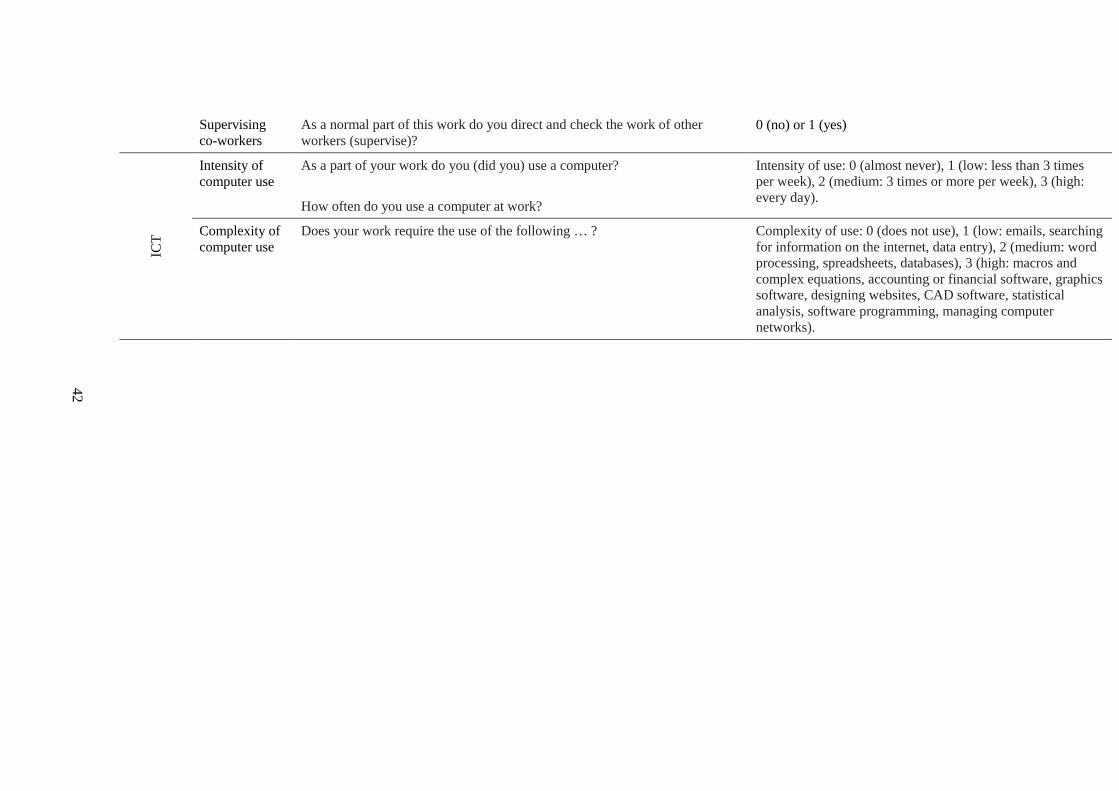
42
Supervising co-workers
As a normal part of this work do you direct and check the work of other workers (supervise)?
0 (no) or 1 (yes)
ICT
Intensity of computer use
As a part of your work do you (did you) use a computer? Intensity of use: 0 (almost never), 1 (low: less than 3 times per week), 2 (medium: 3 times or more per week), 3 (high: every day). How often do you use a computer at work?
Complexity of computer use
Does your work require the use of the following … ? Complexity of use: 0 (does not use), 1 (low: emails, searching for information on the internet, data entry), 2 (medium: word processing, spreadsheets, databases), 3 (high: macros and complex equations, accounting or financial software, graphics software, designing websites, CAD software, statistical analysis, software programming, managing computer networks).
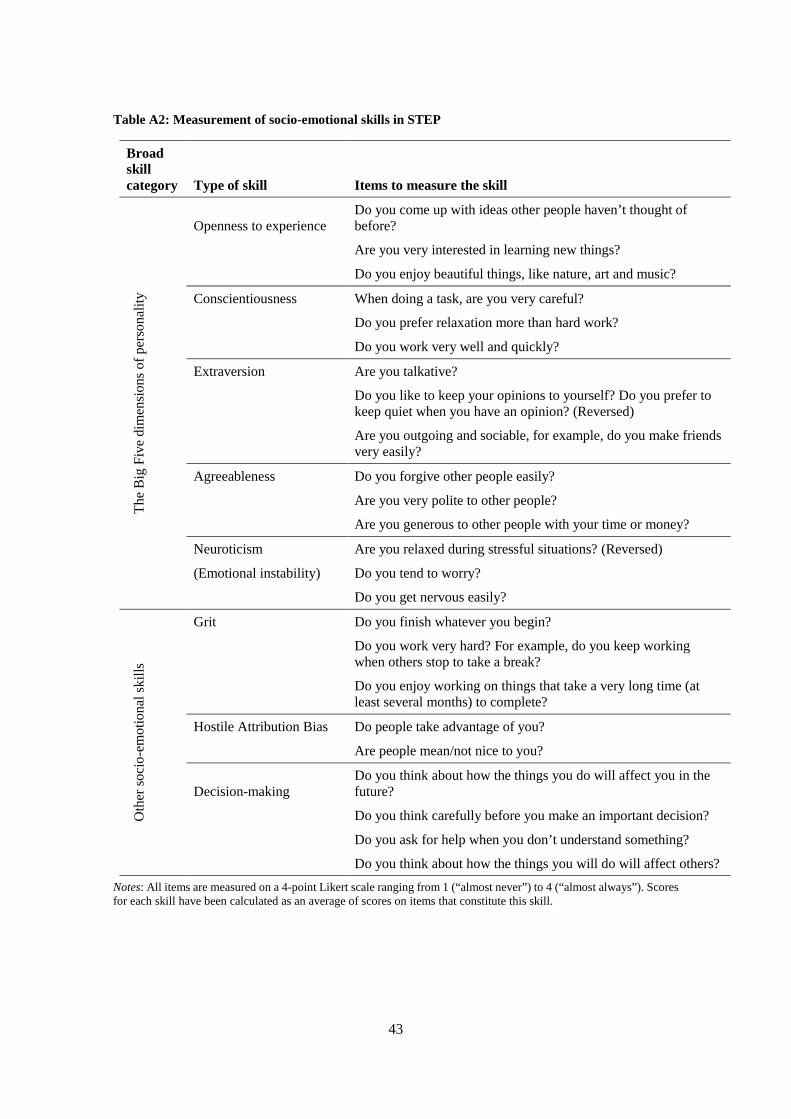
43
Table A2: Measurement of socio-emotional skills in STEP
Broad skill category Type of skill Items to measure the skill
The
Big
Fiv
e di
men
sions
of p
erso
nalit
y
Openness to experience Do you come up with ideas other people haven’t thought of before?
Are you very interested in learning new things?
Do you enjoy beautiful things, like nature, art and music?
Conscientiousness When doing a task, are you very careful?
Do you prefer relaxation more than hard work?
Do you work very well and quickly?
Extraversion Are you talkative?
Do you like to keep your opinions to yourself? Do you prefer to keep quiet when you have an opinion? (Reversed)
Are you outgoing and sociable, for example, do you make friends very easily?
Agreeableness Do you forgive other people easily?
Are you very polite to other people?
Are you generous to other people with your time or money?
Neuroticism Are you relaxed during stressful situations? (Reversed)
(Emotional instability) Do you tend to worry?
Do you get nervous easily?
Oth
er so
cio-
emot
iona
l ski
lls
Grit Do you finish whatever you begin?
Do you work very hard? For example, do you keep working when others stop to take a break?
Do you enjoy working on things that take a very long time (at least several months) to complete?
Hostile Attribution Bias Do people take advantage of you?
Are people mean/not nice to you?
Decision-making Do you think about how the things you do will affect you in the future?
Do you think carefully before you make an important decision?
Do you ask for help when you don’t understand something?
Do you think about how the things you will do will affect others? Notes: All items are measured on a 4-point Likert scale ranging from 1 (“almost never”) to 4 (“almost always”). Scores for each skill have been calculated as an average of scores on items that constitute this skill.
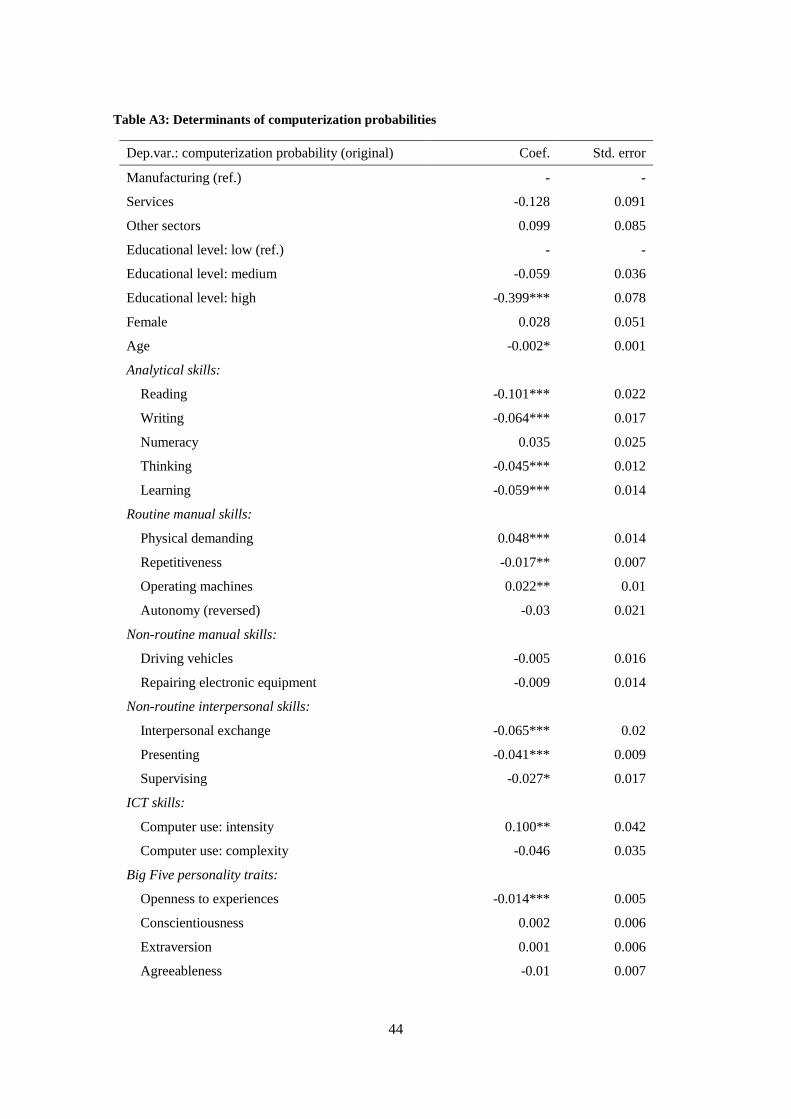
44
Table A3: Determinants of computerization probabilities
Dep.var.: computerization probability (original) Coef. Std. error
Manufacturing (ref.) - -
Services -0.128 0.091
Other sectors 0.099 0.085
Educational level: low (ref.) - -
Educational level: medium -0.059 0.036
Educational level: high -0.399*** 0.078
Female 0.028 0.051
Age -0.002* 0.001
Analytical skills:
Reading -0.101*** 0.022
Writing -0.064*** 0.017
Numeracy 0.035 0.025
Thinking -0.045*** 0.012
Learning -0.059*** 0.014
Routine manual skills:
Physical demanding 0.048*** 0.014
Repetitiveness -0.017** 0.007
Operating machines 0.022** 0.01
Autonomy (reversed) -0.03 0.021
Non-routine manual skills:
Driving vehicles -0.005 0.016
Repairing electronic equipment -0.009 0.014
Non-routine interpersonal skills:
Interpersonal exchange -0.065*** 0.02
Presenting -0.041*** 0.009
Supervising -0.027* 0.017
ICT skills:
Computer use: intensity 0.100** 0.042
Computer use: complexity -0.046 0.035
Big Five personality traits:
Openness to experiences -0.014*** 0.005
Conscientiousness 0.002 0.006
Extraversion 0.001 0.006
Agreeableness -0.01 0.007
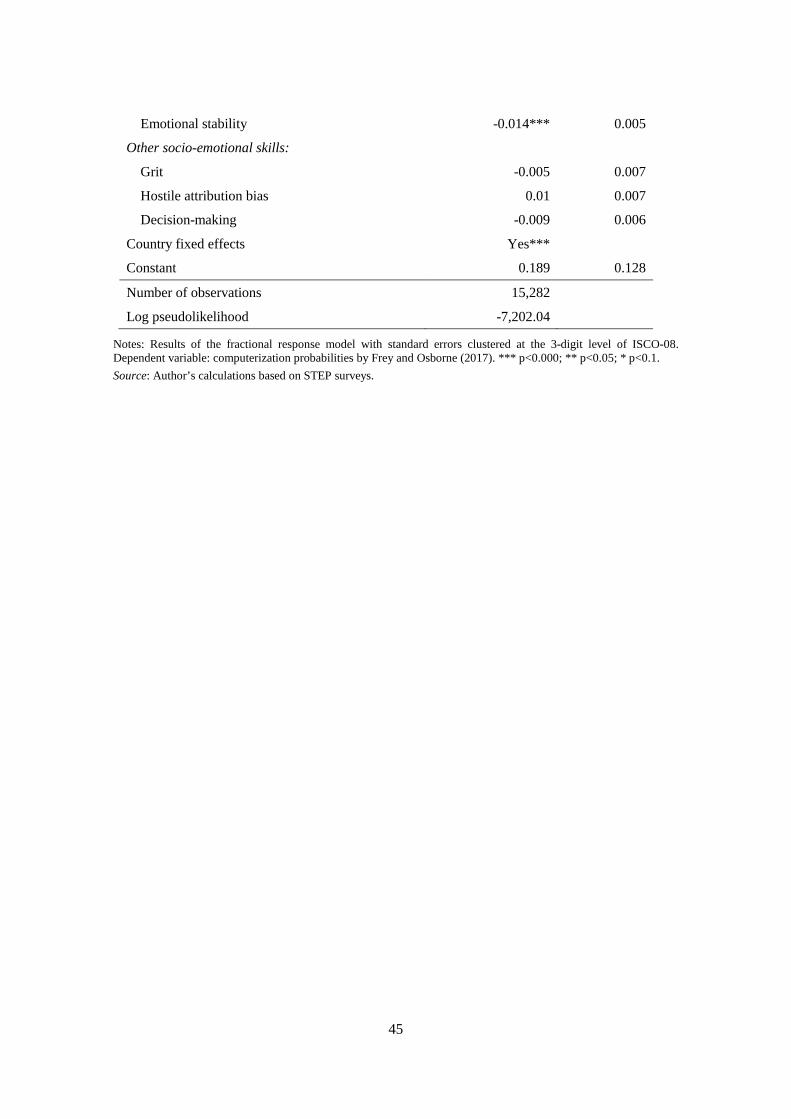
45
Emotional stability -0.014*** 0.005
Other socio-emotional skills:
Grit -0.005 0.007
Hostile attribution bias 0.01 0.007
Decision-making -0.009 0.006
Country fixed effects Yes***
Constant 0.189 0.128
Number of observations 15,282
Log pseudolikelihood -7,202.04
Notes: Results of the fractional response model with standard errors clustered at the 3-digit level of ISCO-08. Dependent variable: computerization probabilities by Frey and Osborne (2017). *** p<0.000; ** p<0.05; * p<0.1. Source: Author’s calculations based on STEP surveys.
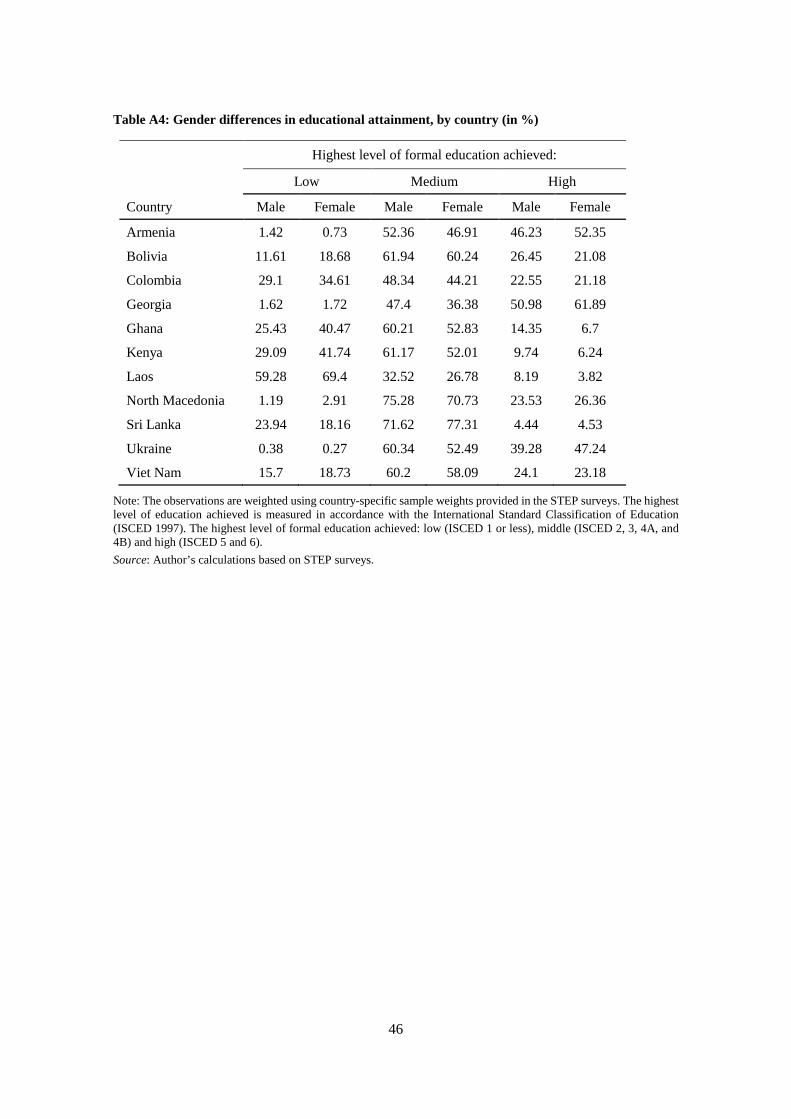
46
Table A4: Gender differences in educational attainment, by country (in %)
Highest level of formal education achieved:
Low Medium High
Country Male Female Male Female Male Female
Armenia 1.42 0.73 52.36 46.91 46.23 52.35
Bolivia 11.61 18.68 61.94 60.24 26.45 21.08
Colombia 29.1 34.61 48.34 44.21 22.55 21.18
Georgia 1.62 1.72 47.4 36.38 50.98 61.89
Ghana 25.43 40.47 60.21 52.83 14.35 6.7
Kenya 29.09 41.74 61.17 52.01 9.74 6.24
Laos 59.28 69.4 32.52 26.78 8.19 3.82
North Macedonia 1.19 2.91 75.28 70.73 23.53 26.36
Sri Lanka 23.94 18.16 71.62 77.31 4.44 4.53
Ukraine 0.38 0.27 60.34 52.49 39.28 47.24
Viet Nam 15.7 18.73 60.2 58.09 24.1 23.18
Note: The observations are weighted using country-specific sample weights provided in the STEP surveys. The highest level of education achieved is measured in accordance with the International Standard Classification of Education (ISCED 1997). The highest level of formal education achieved: low (ISCED 1 or less), middle (ISCED 2, 3, 4A, and 4B) and high (ISCED 5 and 6). Source: Author’s calculations based on STEP surveys.
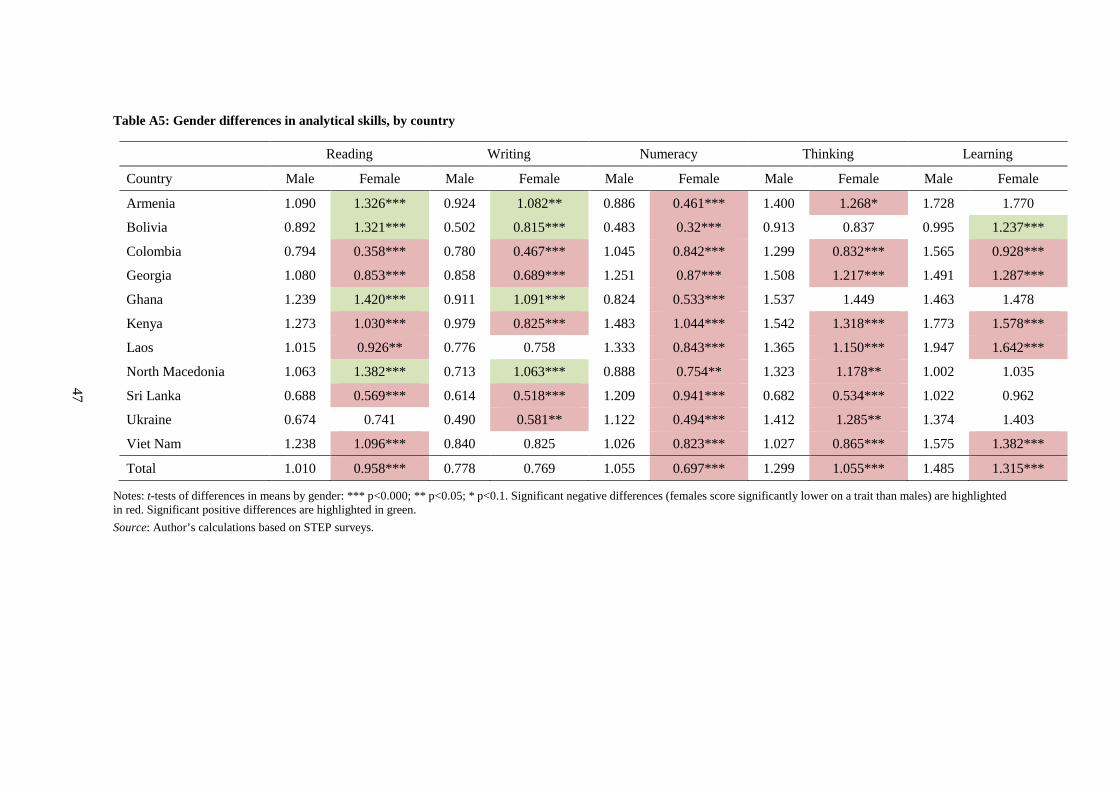
47
Table A5: Gender differences in analytical skills, by country
Reading Writing Numeracy Thinking Learning
Country Male Female Male Female Male Female Male Female Male Female
Armenia 1.090 1.326*** 0.924 1.082** 0.886 0.461*** 1.400 1.268* 1.728 1.770
Bolivia 0.892 1.321*** 0.502 0.815*** 0.483 0.32*** 0.913 0.837 0.995 1.237***
Colombia 0.794 0.358*** 0.780 0.467*** 1.045 0.842*** 1.299 0.832*** 1.565 0.928***
Georgia 1.080 0.853*** 0.858 0.689*** 1.251 0.87*** 1.508 1.217*** 1.491 1.287***
Ghana 1.239 1.420*** 0.911 1.091*** 0.824 0.533*** 1.537 1.449 1.463 1.478
Kenya 1.273 1.030*** 0.979 0.825*** 1.483 1.044*** 1.542 1.318*** 1.773 1.578***
Laos 1.015 0.926** 0.776 0.758 1.333 0.843*** 1.365 1.150*** 1.947 1.642***
North Macedonia 1.063 1.382*** 0.713 1.063*** 0.888 0.754** 1.323 1.178** 1.002 1.035
Sri Lanka 0.688 0.569*** 0.614 0.518*** 1.209 0.941*** 0.682 0.534*** 1.022 0.962
Ukraine 0.674 0.741 0.490 0.581** 1.122 0.494*** 1.412 1.285** 1.374 1.403
Viet Nam 1.238 1.096*** 0.840 0.825 1.026 0.823*** 1.027 0.865*** 1.575 1.382***
Total 1.010 0.958*** 0.778 0.769 1.055 0.697*** 1.299 1.055*** 1.485 1.315***
Notes: t-tests of differences in means by gender: *** p<0.000; ** p<0.05; * p<0.1. Significant negative differences (females score significantly lower on a trait than males) are highlighted in red. Significant positive differences are highlighted in green. Source: Author’s calculations based on STEP surveys.
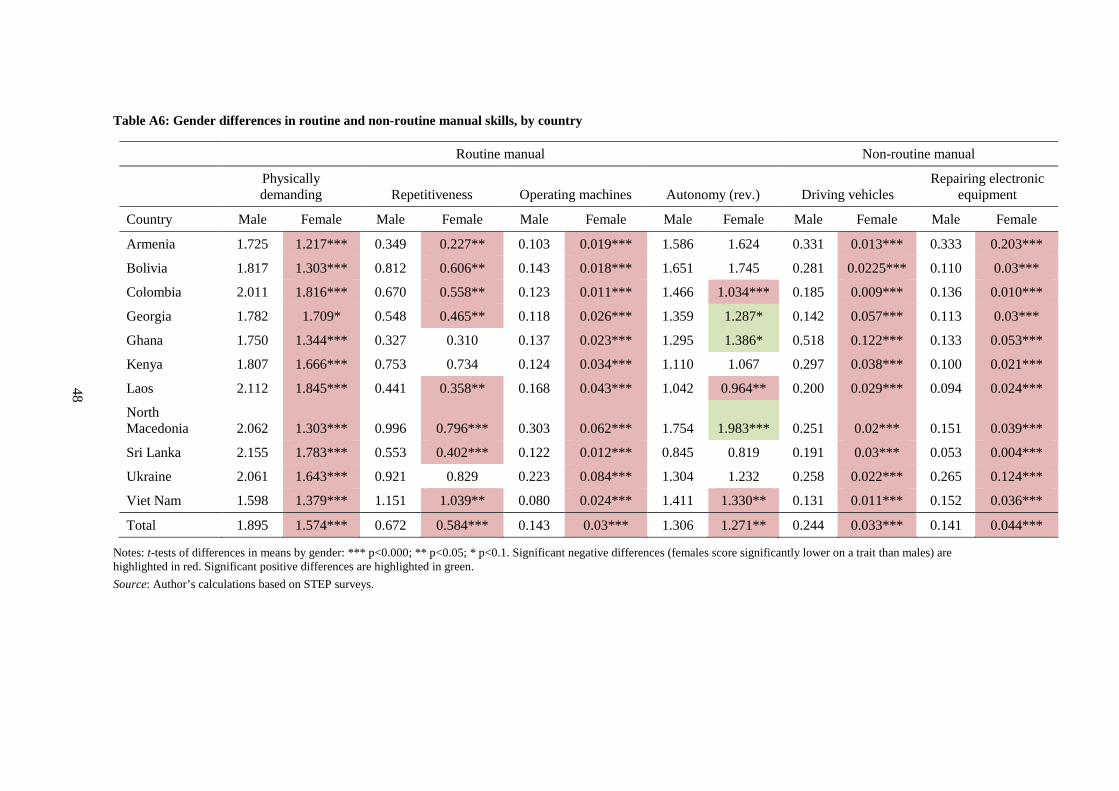
48
Table A6: Gender differences in routine and non-routine manual skills, by country
Routine manual Non-routine manual
Physically demanding Repetitiveness Operating machines Autonomy (rev.) Driving vehicles
Repairing electronic equipment
Country Male Female Male Female Male Female Male Female Male Female Male Female
Armenia 1.725 1.217*** 0.349 0.227** 0.103 0.019*** 1.586 1.624 0.331 0.013*** 0.333 0.203***
Bolivia 1.817 1.303*** 0.812 0.606** 0.143 0.018*** 1.651 1.745 0.281 0.0225*** 0.110 0.03***
Colombia 2.011 1.816*** 0.670 0.558** 0.123 0.011*** 1.466 1.034*** 0.185 0.009*** 0.136 0.010***
Georgia 1.782 1.709* 0.548 0.465** 0.118 0.026*** 1.359 1.287* 0.142 0.057*** 0.113 0.03***
Ghana 1.750 1.344*** 0.327 0.310 0.137 0.023*** 1.295 1.386* 0.518 0.122*** 0.133 0.053***
Kenya 1.807 1.666*** 0.753 0.734 0.124 0.034*** 1.110 1.067 0.297 0.038*** 0.100 0.021***
Laos 2.112 1.845*** 0.441 0.358** 0.168 0.043*** 1.042 0.964** 0.200 0.029*** 0.094 0.024***
North Macedonia 2.062 1.303*** 0.996 0.796*** 0.303 0.062*** 1.754 1.983*** 0.251 0.02*** 0.151 0.039***
Sri Lanka 2.155 1.783*** 0.553 0.402*** 0.122 0.012*** 0.845 0.819 0.191 0.03*** 0.053 0.004***
Ukraine 2.061 1.643*** 0.921 0.829 0.223 0.084*** 1.304 1.232 0.258 0.022*** 0.265 0.124***
Viet Nam 1.598 1.379*** 1.151 1.039** 0.080 0.024*** 1.411 1.330** 0.131 0.011*** 0.152 0.036***
Total 1.895 1.574*** 0.672 0.584*** 0.143 0.03*** 1.306 1.271** 0.244 0.033*** 0.141 0.044***
Notes: t-tests of differences in means by gender: *** p<0.000; ** p<0.05; * p<0.1. Significant negative differences (females score significantly lower on a trait than males) are highlighted in red. Significant positive differences are highlighted in green. Source: Author’s calculations based on STEP surveys.
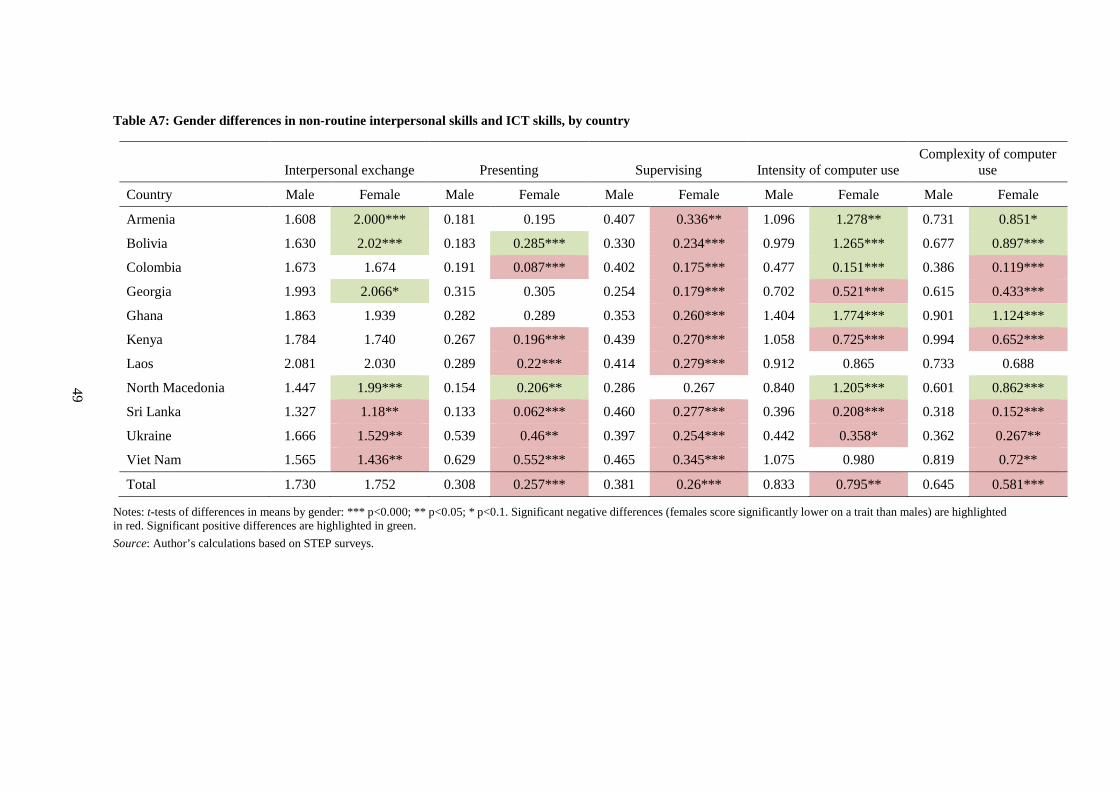
49
Table A7: Gender differences in non-routine interpersonal skills and ICT skills, by country
Interpersonal exchange Presenting Supervising Intensity of computer use Complexity of computer
use
Country Male Female Male Female Male Female Male Female Male Female
Armenia 1.608 2.000*** 0.181 0.195 0.407 0.336** 1.096 1.278** 0.731 0.851*
Bolivia 1.630 2.02*** 0.183 0.285*** 0.330 0.234*** 0.979 1.265*** 0.677 0.897***
Colombia 1.673 1.674 0.191 0.087*** 0.402 0.175*** 0.477 0.151*** 0.386 0.119***
Georgia 1.993 2.066* 0.315 0.305 0.254 0.179*** 0.702 0.521*** 0.615 0.433***
Ghana 1.863 1.939 0.282 0.289 0.353 0.260*** 1.404 1.774*** 0.901 1.124***
Kenya 1.784 1.740 0.267 0.196*** 0.439 0.270*** 1.058 0.725*** 0.994 0.652***
Laos 2.081 2.030 0.289 0.22*** 0.414 0.279*** 0.912 0.865 0.733 0.688
North Macedonia 1.447 1.99*** 0.154 0.206** 0.286 0.267 0.840 1.205*** 0.601 0.862***
Sri Lanka 1.327 1.18** 0.133 0.062*** 0.460 0.277*** 0.396 0.208*** 0.318 0.152***
Ukraine 1.666 1.529** 0.539 0.46** 0.397 0.254*** 0.442 0.358* 0.362 0.267**
Viet Nam 1.565 1.436** 0.629 0.552*** 0.465 0.345*** 1.075 0.980 0.819 0.72**
Total 1.730 1.752 0.308 0.257*** 0.381 0.26*** 0.833 0.795** 0.645 0.581***
Notes: t-tests of differences in means by gender: *** p<0.000; ** p<0.05; * p<0.1. Significant negative differences (females score significantly lower on a trait than males) are highlighted in red. Significant positive differences are highlighted in green. Source: Author’s calculations based on STEP surveys.
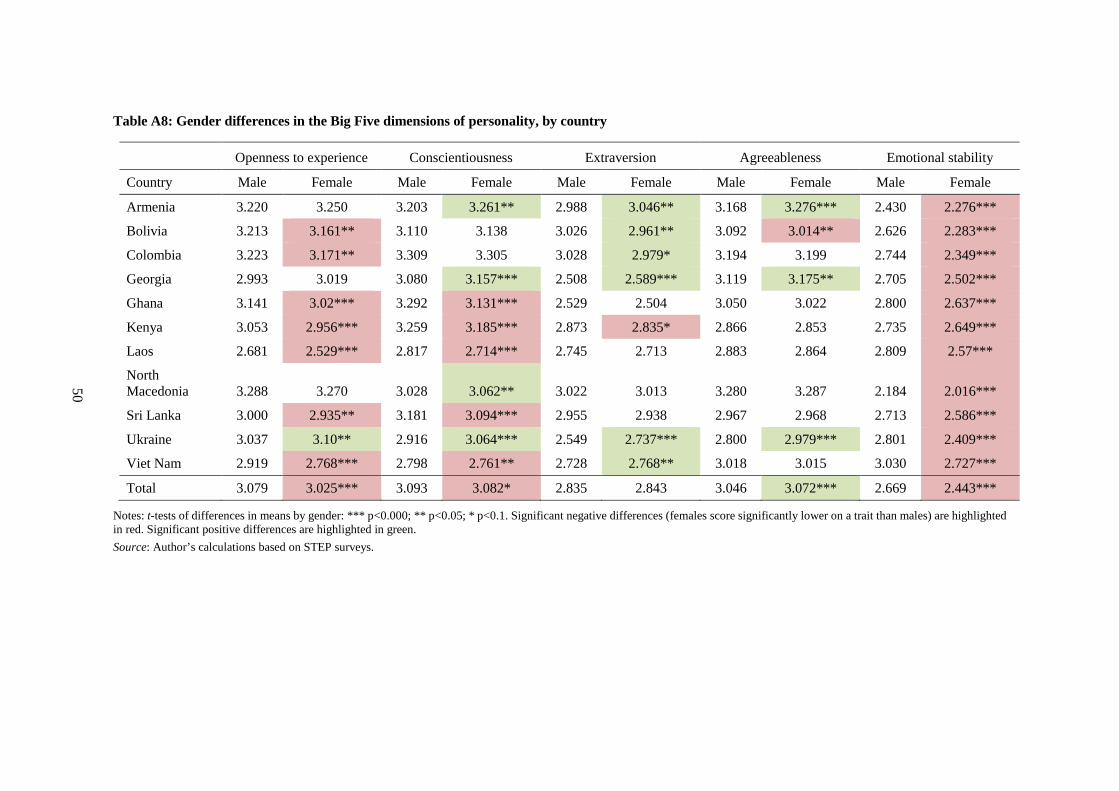
50
Table A8: Gender differences in the Big Five dimensions of personality, by country
Openness to experience Conscientiousness Extraversion Agreeableness Emotional stability
Country Male Female Male Female Male Female Male Female Male Female
Armenia 3.220 3.250 3.203 3.261** 2.988 3.046** 3.168 3.276*** 2.430 2.276***
Bolivia 3.213 3.161** 3.110 3.138 3.026 2.961** 3.092 3.014** 2.626 2.283***
Colombia 3.223 3.171** 3.309 3.305 3.028 2.979* 3.194 3.199 2.744 2.349***
Georgia 2.993 3.019 3.080 3.157*** 2.508 2.589*** 3.119 3.175** 2.705 2.502***
Ghana 3.141 3.02*** 3.292 3.131*** 2.529 2.504 3.050 3.022 2.800 2.637***
Kenya 3.053 2.956*** 3.259 3.185*** 2.873 2.835* 2.866 2.853 2.735 2.649***
Laos 2.681 2.529*** 2.817 2.714*** 2.745 2.713 2.883 2.864 2.809 2.57***
North Macedonia 3.288 3.270 3.028 3.062** 3.022 3.013 3.280 3.287 2.184 2.016***
Sri Lanka 3.000 2.935** 3.181 3.094*** 2.955 2.938 2.967 2.968 2.713 2.586***
Ukraine 3.037 3.10** 2.916 3.064*** 2.549 2.737*** 2.800 2.979*** 2.801 2.409***
Viet Nam 2.919 2.768*** 2.798 2.761** 2.728 2.768** 3.018 3.015 3.030 2.727***
Total 3.079 3.025*** 3.093 3.082* 2.835 2.843 3.046 3.072*** 2.669 2.443***
Notes: t-tests of differences in means by gender: *** p<0.000; ** p<0.05; * p<0.1. Significant negative differences (females score significantly lower on a trait than males) are highlighted in red. Significant positive differences are highlighted in green. Source: Author’s calculations based on STEP surveys.
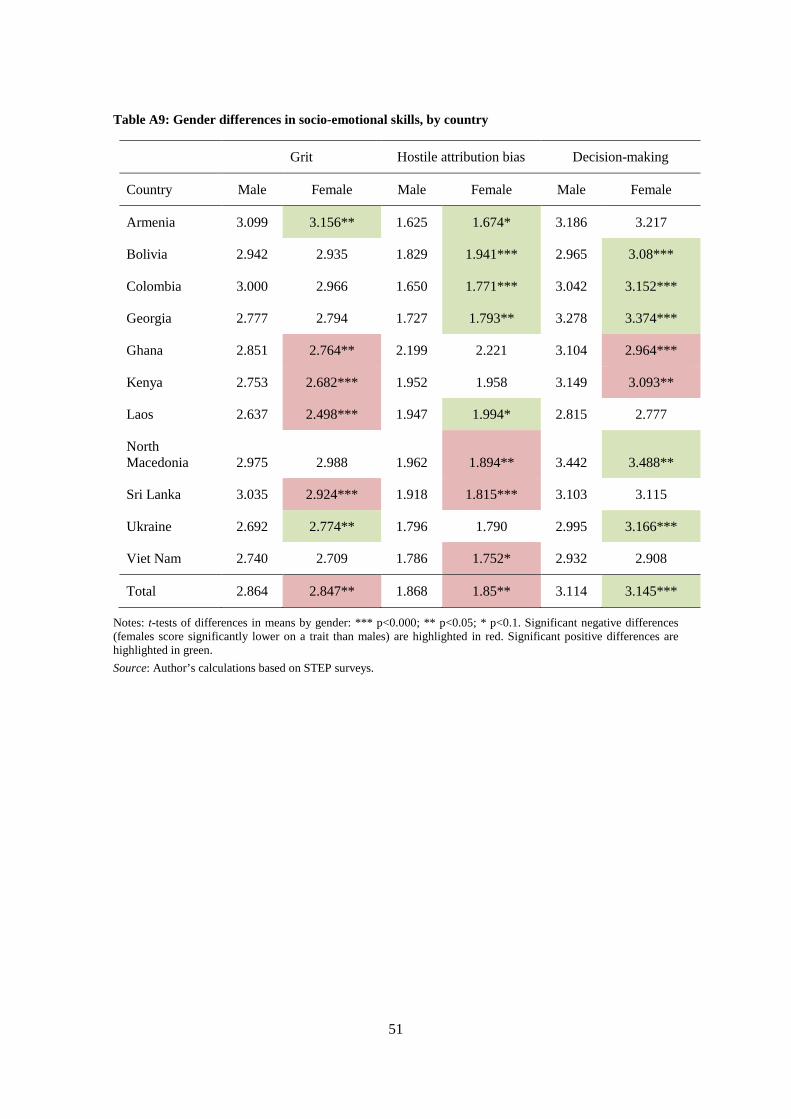
51
Table A9: Gender differences in socio-emotional skills, by country
Grit Hostile attribution bias Decision-making
Country Male Female Male Female Male Female
Armenia 3.099 3.156** 1.625 1.674* 3.186 3.217
Bolivia 2.942 2.935 1.829 1.941*** 2.965 3.08***
Colombia 3.000 2.966 1.650 1.771*** 3.042 3.152***
Georgia 2.777 2.794 1.727 1.793** 3.278 3.374***
Ghana 2.851 2.764** 2.199 2.221 3.104 2.964***
Kenya 2.753 2.682*** 1.952 1.958 3.149 3.093**
Laos 2.637 2.498*** 1.947 1.994* 2.815 2.777
North Macedonia 2.975 2.988 1.962 1.894** 3.442 3.488**
Sri Lanka 3.035 2.924*** 1.918 1.815*** 3.103 3.115
Ukraine 2.692 2.774** 1.796 1.790 2.995 3.166***
Viet Nam 2.740 2.709 1.786 1.752* 2.932 2.908
Total 2.864 2.847** 1.868 1.85** 3.114 3.145***
Notes: t-tests of differences in means by gender: *** p<0.000; ** p<0.05; * p<0.1. Significant negative differences (females score significantly lower on a trait than males) are highlighted in red. Significant positive differences are highlighted in green. Source: Author’s calculations based on STEP surveys.
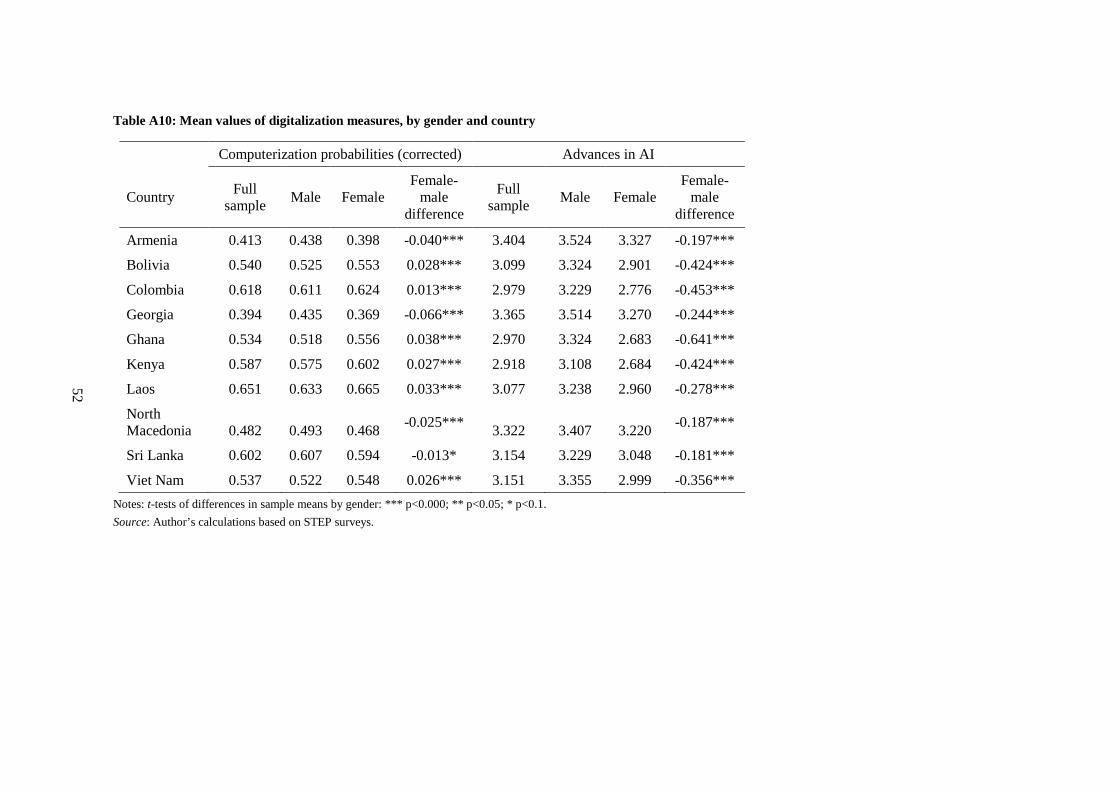
52
Table A10: Mean values of digitalization measures, by gender and country
Computerization probabilities (corrected) Advances in AI
Country Full sample Male Female
Female-male
difference
Full sample Male Female
Female-male
difference
Armenia 0.413 0.438 0.398 -0.040*** 3.404 3.524 3.327 -0.197***
Bolivia 0.540 0.525 0.553 0.028*** 3.099 3.324 2.901 -0.424***
Colombia 0.618 0.611 0.624 0.013*** 2.979 3.229 2.776 -0.453***
Georgia 0.394 0.435 0.369 -0.066*** 3.365 3.514 3.270 -0.244***
Ghana 0.534 0.518 0.556 0.038*** 2.970 3.324 2.683 -0.641***
Kenya 0.587 0.575 0.602 0.027*** 2.918 3.108 2.684 -0.424***
Laos 0.651 0.633 0.665 0.033*** 3.077 3.238 2.960 -0.278***
North Macedonia 0.482 0.493 0.468 -0.025*** 3.322 3.407 3.220 -0.187***
Sri Lanka 0.602 0.607 0.594 -0.013* 3.154 3.229 3.048 -0.181***
Viet Nam 0.537 0.522 0.548 0.026*** 3.151 3.355 2.999 -0.356***Notes: t-tests of differences in sample means by gender: *** p<0.000; ** p<0.05; * p<0.1. Source: Author’s calculations based on STEP surveys.
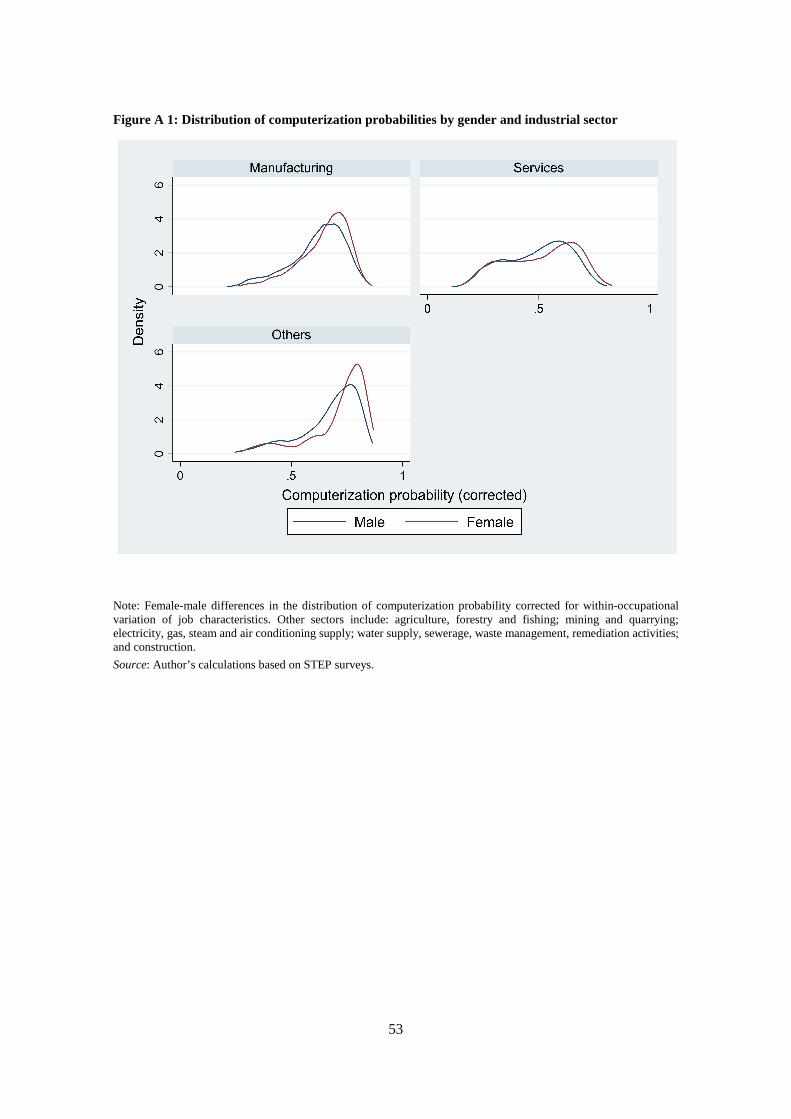
53
Figure A 1: Distribution of computerization probabilities by gender and industrial sector
Note: Female-male differences in the distribution of computerization probability corrected for within-occupational variation of job characteristics. Other sectors include: agriculture, forestry and fishing; mining and quarrying; electricity, gas, steam and air conditioning supply; water supply, sewerage, waste management, remediation activities; and construction. Source: Author’s calculations based on STEP surveys.
02
46
02
46
0 .5 1
0 .5 1
Manufacturing Services
Others
Male Female
Den
sity
Computerization probability (corrected)
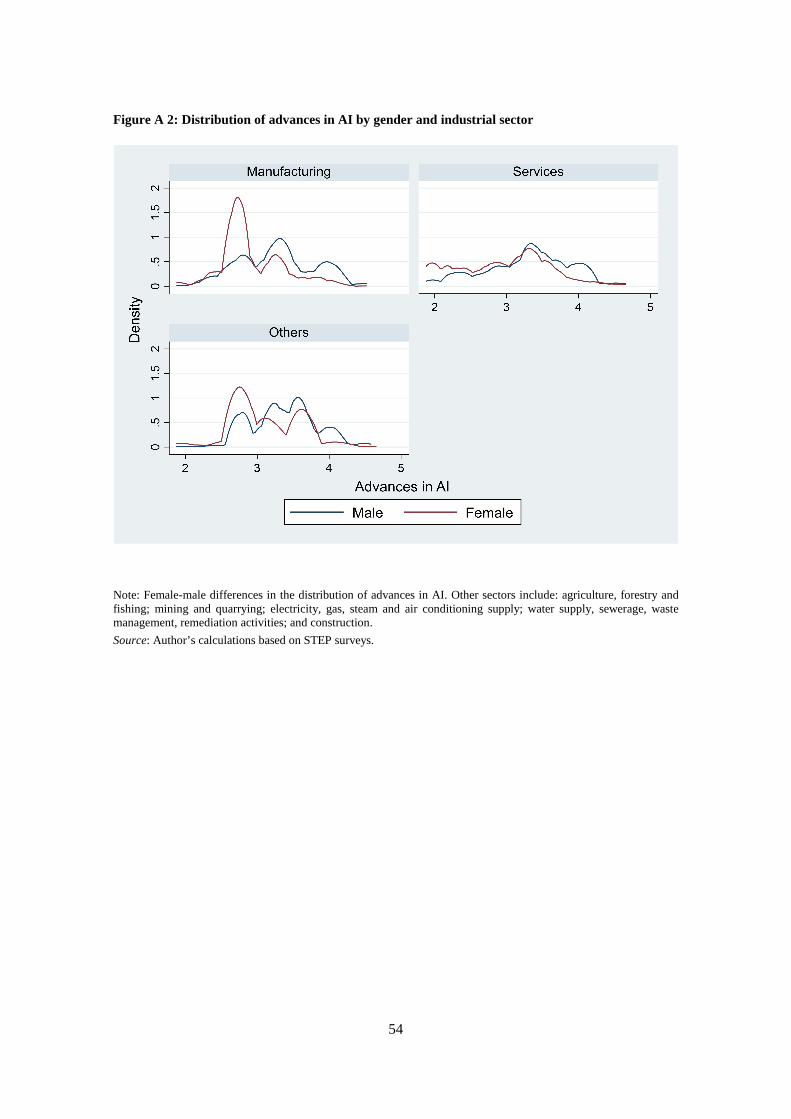
54
Figure A 2: Distribution of advances in AI by gender and industrial sector
Note: Female-male differences in the distribution of advances in AI. Other sectors include: agriculture, forestry and fishing; mining and quarrying; electricity, gas, steam and air conditioning supply; water supply, sewerage, waste management, remediation activities; and construction. Source: Author’s calculations based on STEP surveys.
0.5
11.
52
0.5
11.
52
2 3 4 5
2 3 4 5
Manufacturing Services
Others
Male Female
Den
sity
Advances in AI
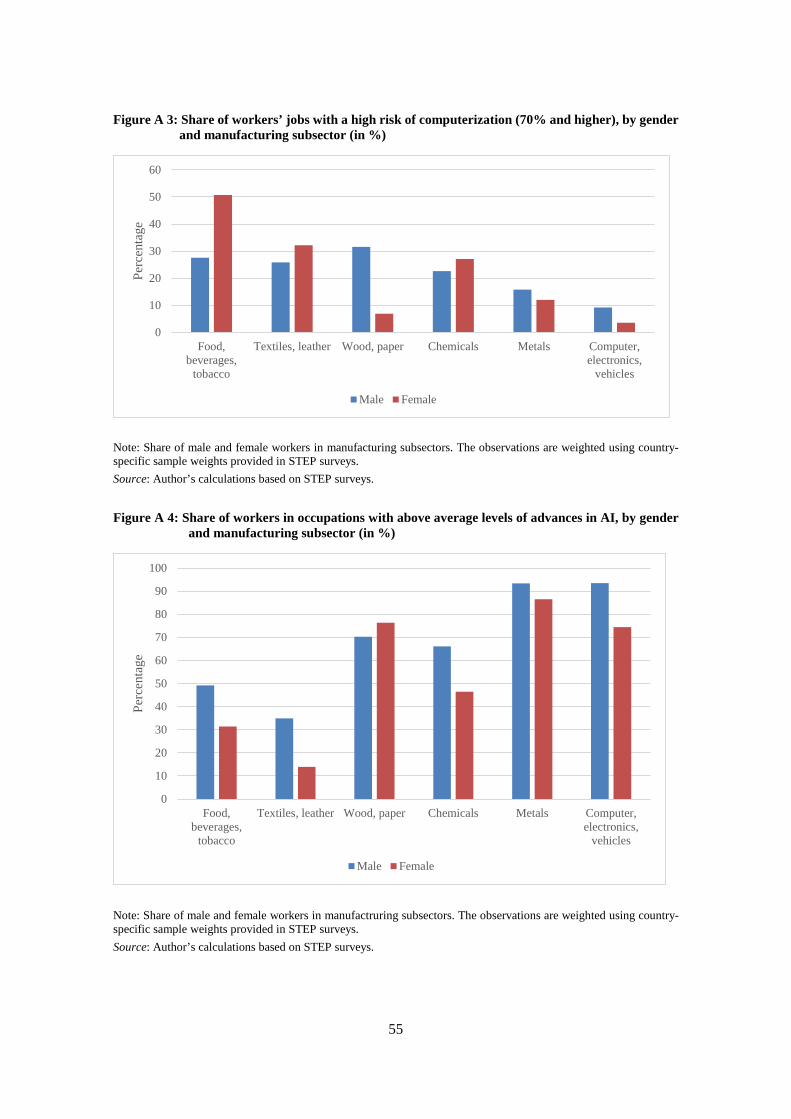
55
Figure A 3: Share of workers’ jobs with a high risk of computerization (70% and higher), by gender and manufacturing subsector (in %)
Note: Share of male and female workers in manufacturing subsectors. The observations are weighted using country-specific sample weights provided in STEP surveys. Source: Author’s calculations based on STEP surveys.
Figure A 4: Share of workers in occupations with above average levels of advances in AI, by gender and manufacturing subsector (in %)
Note: Share of male and female workers in manufactruring subsectors. The observations are weighted using country-specific sample weights provided in STEP surveys. Source: Author’s calculations based on STEP surveys.
0
10
20
30
40
50
60
Food,beverages,
tobacco
Textiles, leather Wood, paper Chemicals Metals Computer,electronics,
vehicles
Perc
enta
ge
Male Female
0
10
20
30
40
50
60
70
80
90
100
Food,beverages,
tobacco
Textiles, leather Wood, paper Chemicals Metals Computer,electronics,
vehicles
Perc
enta
ge
Male Female
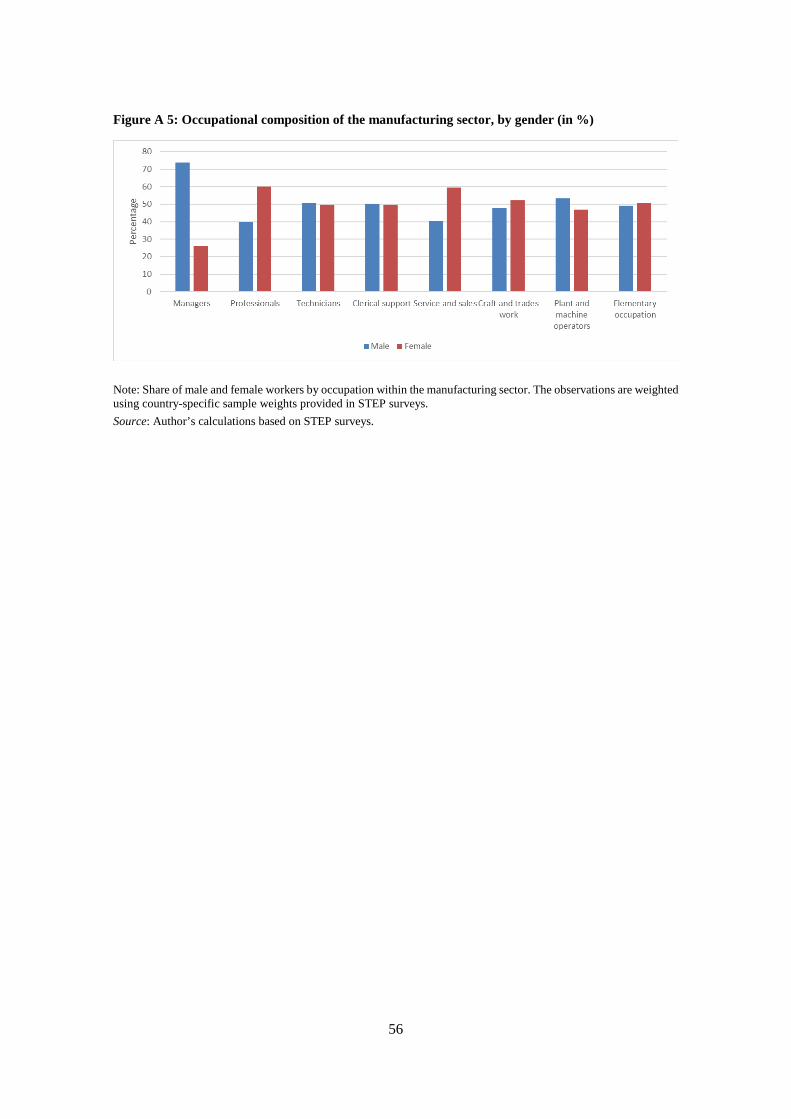
56
Figure A 5: Occupational composition of the manufacturing sector, by gender (in %)
Note: Share of male and female workers by occupation within the manufacturing sector. The observations are weighted using country-specific sample weights provided in STEP surveys. Source: Author’s calculations based on STEP surveys.

Vienna International Centre · P.O. Box 300 9 · 1400 Vienna · AustriaTel.: (+43-1) 26026-o · E-mail: [email protected]