Embed Size (px)
Citation preview
Cite asAl-Humadi HW, Al-Saigh R, Sahib A. The impact of low alcohol consumption on the liver and inflammatory cytokines in diabetic rats. Adv Clin Exp Med. 2019;28(3):331–337. doi:10.17219/acem/77085
DOI10.17219/acem/77085
Copyright© 2019 by Wroclaw Medical University This is an article distributed under the terms of the Creative Commons Attribution Non-Commercial License(http://creativecommons.org/licenses/by-nc-nd/4.0/)
Address for correspondenceHussam Al-HumadiE-mail: [email protected]
Funding sourcesNone declared
Conflict of interestNone declared
AcknowledgementsThe authors gratefully thank the College of Pharmacy, Babylon University, Al-Hilla, Iraq, for the availability of the laboratory and technical assistance.
Received on February 16, 2017Reviewed on March 6, 2017Accepted on September 19, 2017
Published online on August 29, 2018
AbstractBackground. Diabetes mellitus (DM) and alcohol consumption is still one of the important research models that simulate variable clinical conditions and metabolic diseases, such as alcoholic liver diseases.
Objectives. The aim of this study was to evaluate the long-term cumulative effects of low alcohol consump-tion on the liver tissue, biochemical assays and some inflammatory cytokines in experimentally-induced DM rats.
Material and methods. Ethanol was administered in the drinking water (3% v/v) for 30 days to adult male Sprague-Dawley rats, with or without DM induced by streptozocin injection. Histological and biochemical parameters as well as some inflammatory cytokines – interleukin (IL)-4, IL-6, IL-10, and tumor necrosis factor alpha (TNF-α) – were measured.
Results. A significant increase in blood glucose level in the combination group was accompanied by a sig-nificant decrease in plasma insulin (p < 0.001 vs controls). Hepatic histopathology of the combination group revealed steatosis and fibrosis in addition to a significant increase in the gamma-glutamyltransferase (γ-GT) and alkaline phosphatase (ALP) levels (p < 0.05 and p < 0.001, respectively). A non-high-density lipoprotein (HDL) lipid profile (total cholesterol (TC), triglycerides (TG) and low-density lipoprotein (LDL)) revealed a significant increase in comparison to controls (p < 0.05), while HDL showed no significant change. The IL-4 and IL-6 levels were significantly higher (p < 0.05), while IL-10 and TNF-α revealed non-significant changes.
Conclusions. Depletion of the hyperglycemic response in the case of low alcohol consumption in DM rats was associated with elevated plasma cytokines, especially IL-6 and IL-4, which could be a part of a host defense mechanism to repair the hepatic and pancreatic damage through this inflammatory process. The severe liver damage under insult of low alcohol consumption and DM could serve as inhibitory factors in gluconeogenesis and glycogenolysis, with little or no impact on insulin levels.
Key words: alcohol, cytokines, diabetes, liver, rat
Original papers
The impact of low alcohol consumption on the liver and inflammatory cytokines in diabetic rats
Hussam W. Al-Humadi1,2,A–F, Rafal Al-Saigh3,B,C,F, Ahmed Sahib2,B,C,F
1 Department of Pharmacology and Toxicology, Pharmacy College, Babylon University, Al-Hilla, Iraq2 Department of Pharmacology, Medical School, National and Kapodistrian University of Athens, Greece3 Department of Clinical and Laboratory Sciences, Pharmacy College, Babylon University, Al-Hilla, Iraq
A – research concept and design; B – collection and/or assembly of data; C – data analysis and interpretation; D – writing the article; E – critical revision of the article; F – final approval of the article
Advances in Clinical and Experimental Medicine, ISSN 1899–5276 (print), ISSN 2451–2680 (online) Adv Clin Exp Med. 2019;28(3):331–337
H. Al-Humadi, R. Al-Saigh, A. Sahib. Effect of alcohol and diabetes on the liver and cytokines332
Introduction
Diabetes mellitus (DM) is a public health problem which has reached epidemic proportions worldwide.1 Insulin-deficient DM is associated with severe complications.2,3
Therefore, inflammatory cytokines provide important signals in the pathophysiology and complications of DM, being markedly elevated, and are thought to contribute to several complications (neuropathy, nephropathy, reti-nopathy, and periodontal lesions).4–7 The relationships be-tween plasma inflammatory markers and an increased risk of clinical DM are inconsistent, just like the relationships between these cytokines and other metabolic risk factors, such as dyslipidemia and hepatotoxicity, although hepatic damage is probably a major contributor to dyslipidemia in insulin-deficient DM.3,8,9
Recent studies have shown that moderate alcohol intake is associated with changes in the levels of several cytokines, especially pro-inflammatory ones – interleukin (IL)-6 and tumor necrosis factor alpha (TNF-α) – in different physi-ological and pathological states.10
Interleukin-6 protects against alcoholic liver injury via the activation of the signal transducer and activator of transcrip-tion 3 (STAT3), regulating liver fibrosis and inflammation, and promoting liver regeneration,while IL-10 inhibits alcoholic liver inflammation via the activation of STAT3 in Kupffer cells/mac-rophages (targeting immune cells) and the subsequent inhibi-tion of liver inflammation.11,12 Recent studies have suggested that IL-10 may play a dual role in controlling ethanol-induced steatosis and liver injury via the inhibition of pro-inflammatory cytokines, such as TNF-α, thereby decreasing alcoholic liver injury, or via the inhibition of the hepatoprotective cytokine IL-6, thereby potentiating alcoholic liver injury.13
Furthermore, it has been suggested that ethanol might modulate the production of these cytokines and their clearance at several sites, including adipose tissue.14 Nev-ertheless, data on the relationship between alcohol intake and circulating cytokine levels is scant.
The precise role of inflammatory cytokines in the ini-tiation and progression of pathological processes in DM, and its relationship with low alcohol consumption are not fully clear. However, our study contributed to evaluating the changes of the liver (histologically and biochemically) in ad-dition to evaluating the inflammatory response by measur-ing proinflammatory (IL-6 and TNF-α) and anti-inflamma-tory (IL-4 and IL-10) cytokines under insult of low alcohol consumption in streptozotocin (STZ)-induced DM in rats.
Material and methods
Animals
Twenty-four male Sprague-Dawley rats (8–10 weeks old, weighing 221 ±39 g) were used in the experiments. The rats were purchased from the National Center for Drug Research and Quality Control, Baghdad, Iraq. They
were kept in the animal house of the Department of Phar-macology and Toxicology, Pharmacy College, University of Babylon, Al-Hilla, Iraq. They were housed 6 per cage, at a constant room temperature (22 ±1°C) and relative hu-midity (60–70%), and under a 12-hour light/12-hour dark cycle (light 8:00 am–8:00 pm). Standard food and water (treated or not) were provided ad libitum. All experiments were performed according to the international guidelines of laboratory animal care and the ethical guidelines for investigations on experimental animals (International So-ciety for Applied Ethology).15
Induction of diabetes and alcohol consumption
The rats were divided into 4 main groups (n = 6 per group) as follows: control (C), alcohol consumption (ACH), diabetic (DM), and alcohol consumption with diabetic (ACH+DM). Diabetes mellitus was induced with a single intraperitoneal injection of STZ (65 mg/kg body weigh (b.w.)), diluted in a 0.1 mol/L citrate solution, pH 4.5 (Sigma-Aldrich), while low alcohol administration was performed ad libitum through drinking water consump-tion with 3% v/v ethanol (99% pure EtOH) (Sigma-Aldrich, St. Louis, USA) to simulate a dosage ranging from 4.0 to 5.0 g/kg b.w.16 This dose might be enough to induce peripheral insulin sensitization.17 The body weight of rats was measured once every 5 days. The rats were sacrificed after 30 days of the experiment.
Blood sample collection
On the last day of the experiment, blood was collected from the inferior vena cava and the serum was used to es-timate the examined biochemical parameters and inflam-matory cytokines.
Histological examination
The liver specimens were excised and fixed in 4% for-malin, then embedded in paraffin wax as per conventional techniques. The sections cut (4 μm) were stained with he-matoxylin and eosin (H&E). The specimens were examined by a double-blinded examiner. The morphological changes produced in the liver were histopathologically estimated under a high power field (×400) microscope.18
Biochemical assays
In order to assess blood glucose, hepatic functional integ-rity – serum alanine transaminase (ALT), aspartate trans-aminase (AST), gamma-glutamyltransferase (γ-GT), and alkaline phosphatase (ALP), as well as lipid profile – total cholesterol (TG), triglycerides (TG), high-density lipoprotein (HDL), and low-density lipoprotein (LDL), a biochemical automatic analyzer was used (Hitachi, Roche, USA).
Adv Clin Exp Med. 2019;28(3):331–337 333
Plasma insulin and cytokines
Plasma insulin was measured by an enzyme-linked im-munosorbent assay (ELISA) kit (EZRMI-13K; Linco Re-search, St. Charles, USA) and the quantity was recorded in ng/mL. Inflammatory cytokines were also measured by an ELISA kit (R&D Systems, Minneapolis, USA). In-terleukin-6 was determined by an R6 000B Quantikine kit, IL-4 by an R4 000 Quantikine kit, IL-10 by an R1 000 Quantikine kit, and TNF-α by an RTA00 kit according to the manufacturer’s protocol (R&D Systems); each assay was run with known standards (provided with the kit) to de-termine the quantity of cytokines in each sample in pg/mL.
Statistical analysis
The data is expressed as means ± standard deviation (SD) and was analyzed using a one-way analysis of variance (ANOVA), followed by multiple comparisons with Bonferroni’s method and Tukey’s honestly significant difference method. The sig-nificance level for all analyses was set at a probability p < 0.05. All analyses were performed by GraphPad Prism v. 5.3 for Windows (GraphPad Software, San Diego, USA).
Results
Body weight
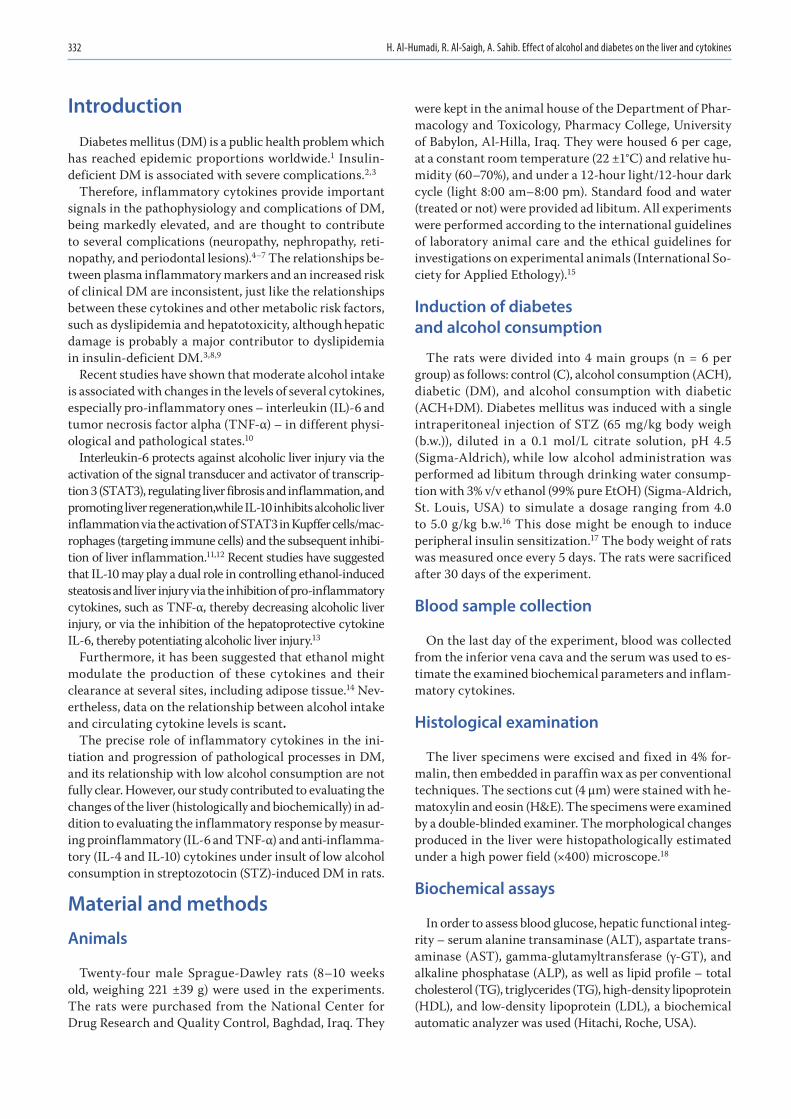
The body weight of adult rats was not significantly dif-ferent in the ACH group compared to the controls, but a marked and significant decrease in weight gain appeared in both the DM and ACH+DM groups between 10 and 30 days of the experimental period (p < 0.05 and p < 0.01 for DM, p < 0.001 for ACH+DM vs controls) (Fig. 1), in ad-dition to a significant increase in the liver weight/body weight ratio in the ACH and ACH+DM groups (p < 0.001 for both groups vs controls) (Fig. 2).
Blood glucose and plasma insulin levels
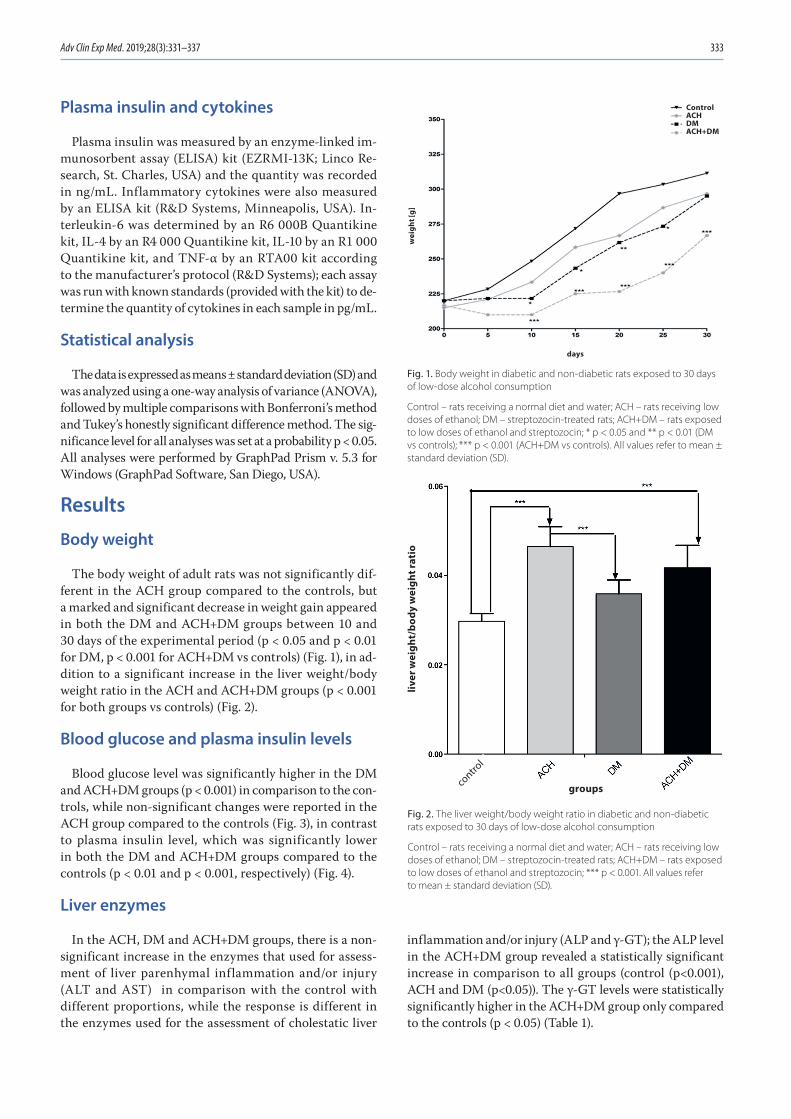
Blood glucose level was significantly higher in the DM and ACH+DM groups (p < 0.001) in comparison to the con-trols, while non-significant changes were reported in the ACH group compared to the controls (Fig. 3), in contrast to plasma insulin level, which was significantly lower in both the DM and ACH+DM groups compared to the controls (p < 0.01 and p < 0.001, respectively) (Fig. 4).
Liver enzymes
In the ACH, DM and ACH+DM groups, there is a non-significant increase in the enzymes that used for assess-ment of liver parenhymal inflammation and/or injury (ALT and AST) in comparison with the control with different proportions, while the response is different in the enzymes used for the assessment of cholestatic liver
inflammation and/or injury (ALP and γ-GT); the ALP level in the ACH+DM group revealed a statistically significant increase in comparison to all groups (control (p<0.001), ACH and DM (p<0.05)). The γ-GT levels were statistically significantly higher in the ACH+DM group only compared to the controls (p < 0.05) (Table 1).
Fig. 1. Body weight in diabetic and non-diabetic rats exposed to 30 days of low-dose alcohol consumption
Control – rats receiving a normal diet and water; ACH – rats receiving low doses of ethanol; DM – streptozocin-treated rats; ACH+DM – rats exposed to low doses of ethanol and streptozocin; * p < 0.05 and ** p < 0.01 (DM vs controls); *** p < 0.001 (ACH+DM vs controls). All values refer to mean ± standard deviation (SD).
Fig. 2. The liver weight/body weight ratio in diabetic and non-diabetic rats exposed to 30 days of low-dose alcohol consumption
Control – rats receiving a normal diet and water; ACH – rats receiving low doses of ethanol; DM – streptozocin-treated rats; ACH+DM – rats exposed to low doses of ethanol and streptozocin; *** p < 0.001. All values refer to mean ± standard deviation (SD).
liver
wei
ght/
body
wei
ght r
atio
ControlACHDMACH+DM
days
wei
ght [
g]
groupscontro
l
H. Al-Humadi, R. Al-Saigh, A. Sahib. Effect of alcohol and diabetes on the liver and cytokines334
Determination of the lipid profile
The TC and TG levels revealed a significant increase in the ACH+DM group compared to the control group and the ACH group (p < 0.05) (Table 2). Low-density li-poprotein level was significantly higher in the ACH+DM group compared to the controls (p < 0.05), while in the ACH and DM groups, there was no significant difference compared to the control group. High-density lipoprotein measurement revealed no significant differences in the ACH, DM and ACH+DM groups compared to the control group (Table 2).
Histopathology
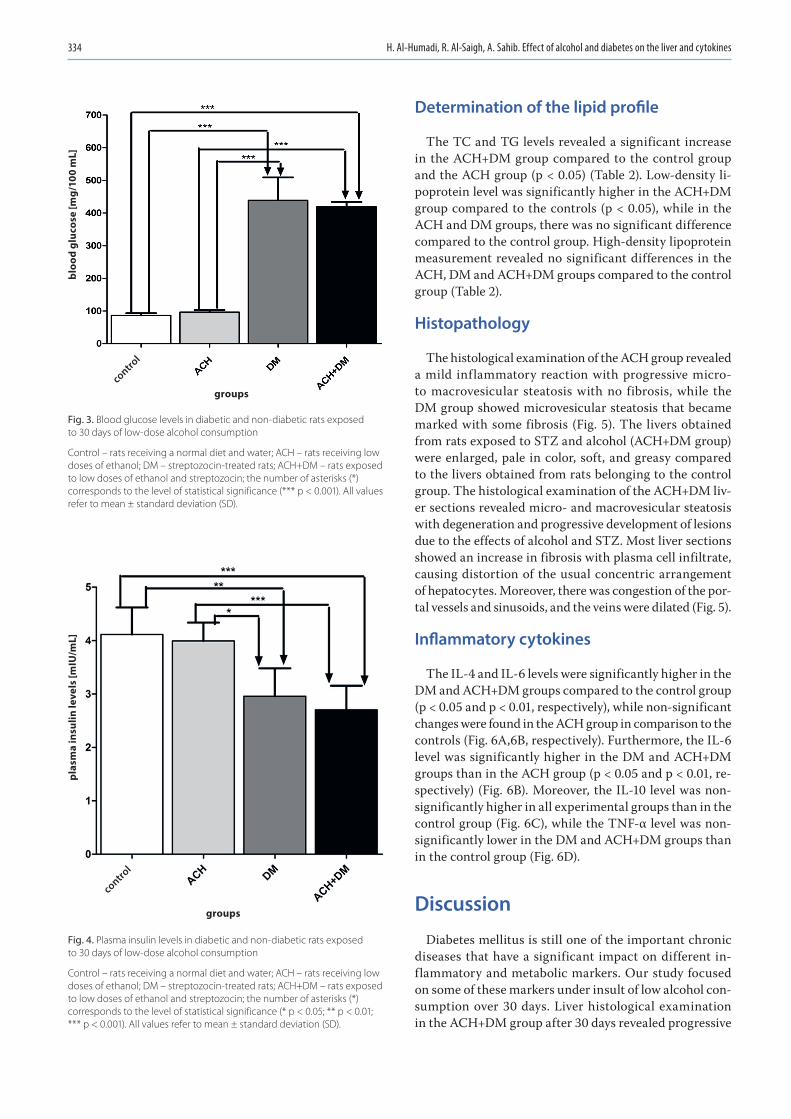
The histological examination of the ACH group revealed a mild inflammatory reaction with progressive micro- to macrovesicular steatosis with no fibrosis, while the DM group showed microvesicular steatosis that became marked with some fibrosis (Fig. 5). The livers obtained from rats exposed to STZ and alcohol (ACH+DM group) were enlarged, pale in color, soft, and greasy compared to the livers obtained from rats belonging to the control group. The histological examination of the ACH+DM liv-er sections revealed micro- and macrovesicular steatosis with degeneration and progressive development of lesions due to the effects of alcohol and STZ. Most liver sections showed an increase in fibrosis with plasma cell infiltrate, causing distortion of the usual concentric arrangement of hepatocytes. Moreover, there was congestion of the por-tal vessels and sinusoids, and the veins were dilated (Fig. 5).
Inflammatory cytokines
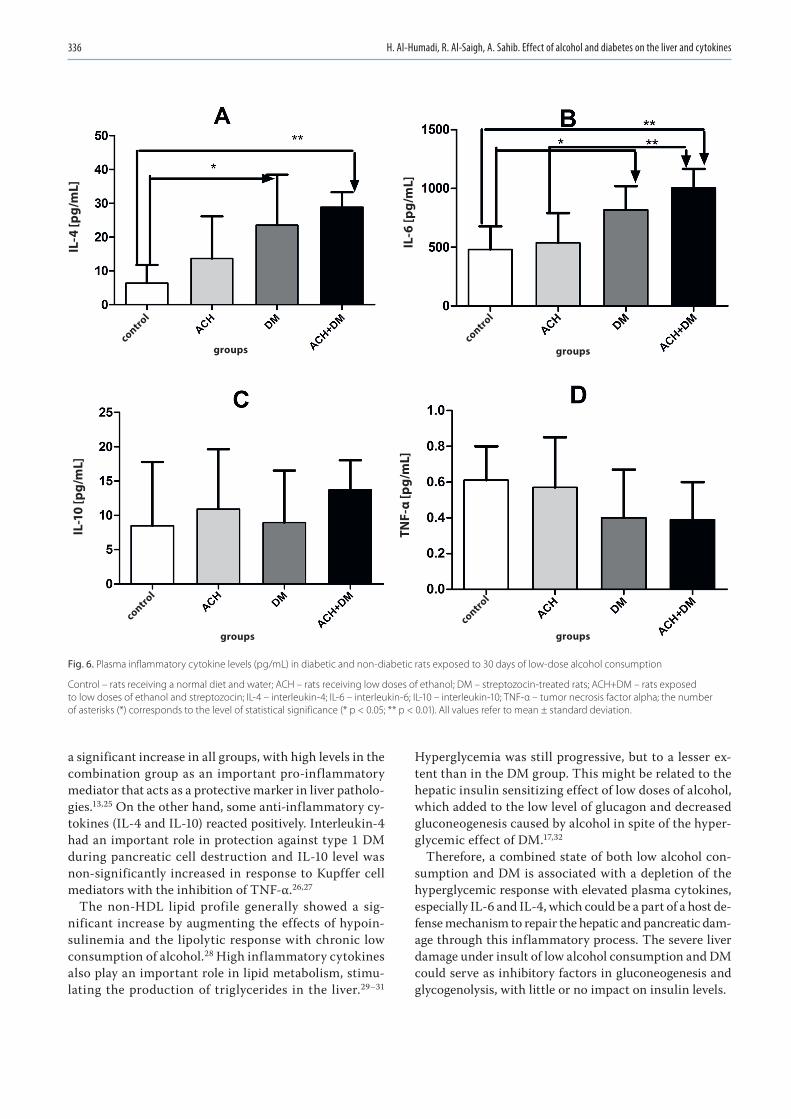
The IL-4 and IL-6 levels were significantly higher in the DM and ACH+DM groups compared to the control group (p < 0.05 and p < 0.01, respectively), while non-significant changes were found in the ACH group in comparison to the controls (Fig. 6A,6B, respectively). Furthermore, the IL-6 level was significantly higher in the DM and ACH+DM groups than in the ACH group (p < 0.05 and p < 0.01, re-spectively) (Fig. 6B). Moreover, the IL-10 level was non-significantly higher in all experimental groups than in the control group (Fig. 6C), while the TNF-α level was non-significantly lower in the DM and ACH+DM groups than in the control group (Fig. 6D).
Discussion
Diabetes mellitus is still one of the important chronic diseases that have a significant impact on different in-flammatory and metabolic markers. Our study focused on some of these markers under insult of low alcohol con-sumption over 30 days. Liver histological examination in the ACH+DM group after 30 days revealed progressive
Fig. 3. Blood glucose levels in diabetic and non-diabetic rats exposed to 30 days of low-dose alcohol consumption
Control – rats receiving a normal diet and water; ACH – rats receiving low doses of ethanol; DM – streptozocin-treated rats; ACH+DM – rats exposed to low doses of ethanol and streptozocin; the number of asterisks (*) corresponds to the level of statistical significance (*** p < 0.001). All values refer to mean ± standard deviation (SD).
Fig. 4. Plasma insulin levels in diabetic and non-diabetic rats exposed to 30 days of low-dose alcohol consumption
Control – rats receiving a normal diet and water; ACH – rats receiving low doses of ethanol; DM – streptozocin-treated rats; ACH+DM – rats exposed to low doses of ethanol and streptozocin; the number of asterisks (*) corresponds to the level of statistical significance (* p < 0.05; ** p < 0.01; *** p < 0.001). All values refer to mean ± standard deviation (SD).
bloo
d gl
ucos
e [m
g/10
0 m
L]
plas
ma
insu
lin le
vels
[mIU
/mL]
groupscontro
l
groups
control
Adv Clin Exp Med. 2019;28(3):331–337 335
micro- and macrovesicular steatosis with degenerative changes; these hepatic fatty deposits were probably due to the inability of the liver to export triglycerides, which had been previously rationalized by the effects of hypoin-sulinemia induced by STZ.19 Moreover, mild fibrosis with plasma cell infiltrate and congestion of the portal vessels and sinusoids were found.20,21 On the other hand, signifi-cant weight loss was observed in the combination group, in spite of the fatty liver, due to progressive and severe liver damage, which affected its function and disturbed the normal metabolism by augmenting the catabolic state. This result is in contrast to the weight gain in the DM-only group that was shown by Chowdhury et al., who detected the changes in weight after the induction by STZ with hyperphagia.22 Moreover, there was a significant increase in the liver weight/body weight ratio, which is in accor-dance with previous studies, confirming a decrease in body weight gain in diabetic rats without the influence of food consumption.16 Furthermore, this combination group (our model) led to a leakage of liver enzymes (ALT, AST, ALP, and γ-GT), which became significant only in the case of ALP and γ-GT. This may be related to the duration of the experiment, resulting in a fluctuation in the levels of enzymes in addition to the hepatotoxic effect of both alcohol and DM.23,24 Additionally, inflammatory cytokines variably reacted to the pro- or anti-inflammatory media-tors at the end of day 30 in the combination group. Tu-mor necrosis factor alpha as a pro-inflammatory cytokine showed a non-significant decrease, which might enhance the repair processes of liver damage, while IL-6 showed
Table 1. The levels of serum liver enzymes indicative of liver functional integrity in diabetic and non-diabetic rats exposed to low-dose alcohol consumption
Experimental group ALT AST ALP γ-GT
Control 351.2 ±26.3 74.3 ±16.1 162.2 ±13.4 0.33 ±0.15
ACH 373.6 ±37.1 109.8 ±38.6 383.4 ±73.2 1.6 ±0.24
DM 392.5 ±29.9 128.1 ±25.4 409.1 ±161.8 2.5 ±1.07
ACH+DM 388.1 ±82.1 128.2 ±13.9 699.2 ±365.0***### 3.2 ±2.50*
Control – rats receiving a normal diet and water; ACH – rats receiving low doses of ethanol; DM – streptozocin-treated rats; ACH+DM – rats exposed to low doses of ethanol and streptozocin; ALT – alanine aminotransferase; AST – aspartate aminotransferase; ALP – alkaline phosphatase; γ-GT – gamma-glutamyltransferase; the number of asterisks (*) or hashes (#) corresponds to the level of statistical significance (*** p < 0.001 combination vs control; # p < 0.05 combination vs ACH; ## p < 0.05 combination vs DM). All values refer to mean ± standard deviation (SD) serum levels, expressed in IU/L.
Fig. 5. Overview of the hematoxylin and eosin (H&E) staining of liver sections obtained from diabetic and non-diabetic rats exposed to 30 days of low-dose alcohol consumption
Liver sections representing the control group show normal liver morphology; the ACH group liver sections present with mild micro- and macrovesicular steatosis; liver sections obtained from the DM group show mild steatosis; the ACH+DM group sections present with micro- and macrovesicular steatosis with degeneration; control – rats receiving a normal diet and water; ACH – rats receiving low doses of ethanol; DM – streptozocin (STZ)-treated rats; ACH+DM – rats exposed to low doses of ethanol and STZ.
Table 2. The lipid profile in diabetic and non-diabetic rats exposed to low-dose alcohol consumption
Experimental group TC TG HDL LDL
Control 51.1 ±15.2 131.2 ±58.9 34.1 ±3.4 17.3 ±10.5
ACH 48.6 ±13.1 132.1 ±71.3 31.1 ±2.8 20.7 ±6.6
DM 59.3 ±16.4 165.5 ±65.1 29.5 ±3.2 22.6 ±11.7
ACH+DM 80.5 ±24.6*# 299.4 ±192.5*# 24.5 ±12.6 38.8 ±16.3*
Control – rats receiving a normal diet and water; ACH – rats receiving low doses of ethanol; DM – streptozocin-treated rats; ACH+DM – rats exposed to low doses of ethanol and streptozocin; TC – total cholestrol; TG – triglyceride; HDL – high-density lipoprotein; LDL – low-density lipoprotein; the number of asterisks (*) or hashes (#) corresponds to the level of statistical significance (* p < 0.05 combination vs control; # p < 0.05 combination vs ACH). All values refer to mean ± standard deviation (SD) serum levels, expressed in mmol/L.
H. Al-Humadi, R. Al-Saigh, A. Sahib. Effect of alcohol and diabetes on the liver and cytokines336
a significant increase in all groups, with high levels in the combination group as an important pro-inflammatory mediator that acts as a protective marker in liver patholo-gies.13,25 On the other hand, some anti-inflammatory cy-tokines (IL-4 and IL-10) reacted positively. Interleukin-4 had an important role in protection against type 1 DM during pancreatic cell destruction and IL-10 level was non-significantly increased in response to Kupffer cell mediators with the inhibition of TNF-α.26,27
The non-HDL lipid profile generally showed a sig-nificant increase by augmenting the effects of hypoin-sulinemia and the lipolytic response with chronic low consumption of alcohol.28 High inflammatory cytokines also play an important role in lipid metabolism, stimu-lating the production of triglycerides in the liver.29–31
Hyperglycemia was still progressive, but to a lesser ex-tent than in the DM group. This might be related to the hepatic insulin sensitizing effect of low doses of alcohol, which added to the low level of glucagon and decreased gluconeogenesis caused by alcohol in spite of the hyper-glycemic effect of DM.17,32
Therefore, a combined state of both low alcohol con-sumption and DM is associated with a depletion of the hyperglycemic response with elevated plasma cytokines, especially IL-6 and IL-4, which could be a part of a host de-fense mechanism to repair the hepatic and pancreatic dam-age through this inflammatory process. The severe liver damage under insult of low alcohol consumption and DM could serve as inhibitory factors in gluconeogenesis and glycogenolysis, with little or no impact on insulin levels.
Fig. 6. Plasma inflammatory cytokine levels (pg/mL) in diabetic and non-diabetic rats exposed to 30 days of low-dose alcohol consumption
Control – rats receiving a normal diet and water; ACH – rats receiving low doses of ethanol; DM – streptozocin-treated rats; ACH+DM – rats exposed to low doses of ethanol and streptozocin; IL-4 – interleukin-4; IL-6 – interleukin-6; IL-10 – interleukin-10; TNF-α – tumor necrosis factor alpha; the number of asterisks (*) corresponds to the level of statistical significance (* p < 0.05; ** p < 0.01). All values refer to mean ± standard deviation.
IL-4
[pg/
mL]
IL-6
[pg/
mL]
IL-1
0 [p
g/m
L]
TNF-
α [p
g/m
L]
groups groups
groups groups
control
control
control
control
Adv Clin Exp Med. 2019;28(3):331–337 337
References1. Hodge AM, Dowse GK, Collins VR, Zimmet PZ. Abnormal glucose toler-
ance and alcohol consumption in three popula tions at high risk of non-insulin-dependent diabetes mellitus. Am J Epidemiol. 1993;137(2): 178–189.
2. Zlotnik A, Gruenbaum BF, Klin Y, et al. The effects of insulin, glucagon, glutamate, and glucose infusion on blood glutamate and plasma glu-cose levels in naive rats. J Neurosurg Anesthesiol. 2011;23(4):323–328. doi: 10.1097/ANA.0b013e3182299b15
3. Wannamethee SG, Shaper AG, Perry IJ, Alberti KG. Alcohol consump-tion and the incidence of type II diabetes. J Epidemiol Commun Health. 2002;56(7):542–548.
4. Hotamisligil GS, Shargill NS, Spiegelman BM. Adipose expression of tumor necrosis factor-alpha: Direct role in obesity-linked insulin resistance. Science. 1993;259(5091):87–91.
5. Siragy HM, Awad A, Abadir P, Webb R. The angiotensin II type 1 recep-tor mediates renal interstitial content of tumor necrosis factor alpha in diabetic rats. Endocrinology. 2003;144(6):2229–2233.
6. Satoh J, Yagihashi S, Toyota T. The possible role of tumor necrosis fac-tor-alpha in diabetic polyneuropathy. Exp Diabesity Res. 2003;4(2):65–71.
7. Nishimura F, Iwamoto Y, Mineshiba J, Shimizu A, Soga Y, Muraya-ma Y. Periodontal disease and diabetes mellitus: The role of tumor necrosis factor-alpha in a 2-way relationship. J Periodontol. 2003;74(1): 97–102.
8. Barzilay JI, Abraham L, Heckbert SR, et al. The relation of markers of inflammation to the development of glucose disorders in the elderly: The Cardiovascular Health Study. Diabetes. 2001;50(10):2384–2389.
9. Duncan BB, Schmidt MI, Pankow JS, et al. Low-grade systemic inflam-mation and the development of type 2 diabetes: The atherosclero-sis risk in communities study. Diabetes. 2003;52(7):1799–1805.
10. Bathina S, Srinivas N, Das UN. Streptozotocin produces oxidative stress, inflammation and decreases BDNF concentrations to induce apoptosis of RIN5F cells and type 2 diabetes mellitus in Wistar rats. Biochem Biophys Res Commun. 2017;486(2):406–413. doi: 10.1016/j.bbrc.2017.03.054
11. Hill DB, Marsano L, Cohen D, Allen J, Shedlofsky S, McClain CJ. Increased plasma interleukin-6 concentrations in alcoholic hepati-tis. J Lab Clin Med. 1992;119(5):547–552.
12. Horiguchi N, Wang L, Mukhopadhyay P, et al. Cell type-dependent pro- and anti-inflammatory role of signal transducer and activator of transcription 3 in alcoholic liver injury. Gastroenterology. 2008; 134(4):1148–1158.
13. Gao B. Hepatoprotective and anti-inflammatory cytokines in alco-holic liver disease. J Gastroenterol Hepatol. 2012;27(Suppl 2):89–93.
14. McCarty MF. Interleukin-6 as a central mediator of cardiovascular risk associated with chronic inflammation, smoking, diabetes, and visceral obesity: Down-regulation with essential fatty acids, ethanol and pentoxifylline. Med Hypotheses. 1999;52(5):465–477.
15. Sherwin CM, Christiansen SB, Duncan IJ, et al. Guidelines for the ethical use of animals in applied ethology. Appl Anim Behav Sci. 2003;81(3):291–305.
16. Akbarzadeh A, Norouzian D, Mehrabi MR, et al. Induction of diabe-tes by Streptozotocin in rats. Indian J Clin Biochem. 2007;22(2):60–64.
17. Furuya DT, Binsack R, Machado UF. Low ethanol consumption increas-es insulin sensitivity in Wistar rats. Braz J Med Biol Res. 2003;36(1): 125–130.
18. Al-Humadi H, Theocharis S, ne Dontas I, et al. Hepatic injury due to com-bined choline-deprivation and thioacetamide administration: An experi-mental approach to liver diseases. Dig Dis Sci. 2012;57(12):3168–3177.
19. Ohno T, Horio F, Tanaka S, Terada M, Namikawa T, Kitch J. Fatty liver and hyperlipidemia in IDDM (insulin-dependent diabetes mellitus) of streptozotocin-treated shrews. Life Sci. 2000;66(2):125–131.
20. Sahai A, Malladi P, Pan X, et al. Obese and diabetic db/db mice devel-op marked liver fibrosis in a model of nonalcoholic steatohepatitis: Role of short-form leptin receptors and osteopontin. Am J Physiol Gastrointest Liver Physiol. 2004;287(5):G1035–G1043.
21. Degirmenci I, Kalender S, Ustuner MC, et al. The effects of acarbose and Rumex patientia on liver ultrastructure in streptozotocin-induced diabetic (type-II) rats. Drugs Exp Clin Res. 2002;28(6):229–234.
22. Chowdhury SK, Zherebitskaya E, Smith DR, et al. Mitochondrial respi-ratory chain dysfunction in dorsal root ganglia of streptozotocin-induced diabetic rats and its correction by insulin treatment. Dia-betes. 2010;59(4):1082–1091.
23. Ghanbari E, Nejati V, Khazaei M. Improvement in serum biochem-ical alterations and oxidative stress of liver and pancreas follow-ing use of royal jelly in streptozotocin-induced diabetic rats. Cell J. 2016;18(3):362–370.
24. Hickman IJ, Macdonald GA. Impact of diabetes on the severity of liver disease. Am J Med. 2007;120(120):829–834.
25. Haghighi S, Amini M, Pournaghshband Z, Amini P, Hovsepiana S. Rela-tionship between gamma-glutamyl transferase and glucose intoler-ance in first degree relatives of type 2 diabetics patients. J Res Med Sci. 2011;16(2):123–129.
26. Liu R, Bal HS, Desta T, Behl Y, Graves DT. Tumor necrosis factor-alpha mediates diabetes-enhanced apoptosis of matrix-producing cells and impairs diabetic healing. Am J Pathol. 2006;168(3):757–764.
27. Mi QS, Ly D, Zucker P, McGarry M, Delovitch TL. Interleukin-4 but not interleukin-10 protects against spontaneous and recurrent type 1 diabetes by activated CD1d-restricted invariant natural killer T-cells. Diabetes. 2004;53(5):1303–1310.
28. Bloomgarden ZT. Inflammation, atherosclerosis, and aspects of insu-lin action. Diabetes Care. 2005;28(9):2312–2319.
29. Crosby-Nwaobi R, Chatziralli I, Sergentanis T, Dew T, Forbes A, Siv-aprasad S. Cross talk between lipid metabolism and inflammatory markers in patients with diabetic retinopathy. J Diabetes Res. 2015; 2015:191382. doi:10.1155/2015/191382
30. Feingold KR, Doerrler W, Dinarello CA, Fiers W, Grunfeld C. Stimula-tion of lipolysis in cultured fat cells by tumor necrosis factor, inter-leukin-1, and the interferons is blocked by inhibition of prostaglan-din synthesis. Endocrinology. 1992;130(1):10–16.
31. Zhao L, Zhong S, Qu H, et al. Chronic inflammation aggravates meta-bolic disorders of hepatic fatty acids in high-fat diet-induced obese mice. Sci Rep. 2015;5:10222. doi: 10.1038/srep10222
32. Dunning BE, Gerich JE. The role of alpha-cell dysregulation in fast-ing and postprandial hyperglycemia in type 2 diabetes and thera-peutic implications. Endocr Rev. 2007;28(3):253–283.