Embed Size (px)
Citation preview
Submitted 9 August 2016Accepted 27 September 2016Published 27 October 2016
Corresponding authorShaohui Tang,[email protected]
Academic editorBob Patton
Additional Information andDeclarations can be found onpage 19
DOI 10.7717/peerj.2633
Copyright2016 Cao et al.
Distributed underCreative Commons CC-BY 4.0
OPEN ACCESS
Alcohol consumption and risk of fattyliver disease: a meta-analysisGuoli Cao1,*, Tingzhuang Yi1,2,*, Qianqian Liu1,*, Min Wang1 and Shaohui Tang1
1Department of Gastroenterology, The First Affiliated Hospital, Jinan University, Guangzhou, Guangdong,China
2Department of Gastroenterology, Affiliated Hospital of Youjiang Medical University for Nationlities, BaiSe,GuangXi, China
*These authors contributed equally to this work.
ABSTRACTBackground. Observational studies have shown inconsistent results regarding alcoholconsumption and risk of fatty liver. We performed a meta-analysis of publishedliterature to investigate the association between alcohol consumption and fatty liverdisease (FLD).Methods. We searched Medline, Embase, Web of Science, and several Chinesedatabases, identifying studies that reported an association between alcohol consump-tion and the risk of FLD.Results. A total of 16 studies with 76,608 participants including 13 cross-sectionalstudies, two cross-sectional following longitudinal studies, and one cohort study metthe inclusion criteria. For light to moderate alcohol consumption (LMAC), there wasa 22.6% reduction in risk of FLD (odds ratio [OR] = 0.774, 95% confidence intervalCI [0.695–0.862], P <0.001), and subgroup analysis showed that a greater reductionin risk of FLD was found in the female drinkers (30.2%) and the drinkers with BMI≥25 kg/m2 (31.3%) compared with the male drinkers (22.6%) and the drinkers withBMI <25 kg/m2 (21.3%), respectively. For heavy alcohol consumption, there was nosignificant influence on risk of FLD (OR = 0.869, 95% CI [0.553–1.364], P = 0.541)in Japanese women, but there was a 33.7% reduction in risk of FLD (OR= 0.663, 95%CI [0.574–0.765], P < 0.001) in Japanese men and a significant increased risk of FLD(OR = 1.785, 95% CI [1.064–2.996], P = 0.028) in Germans.Conclusion. LMAC is associated with a significant protective effect on FLD in thestudied population, especially in the women and obese population. However, the effectof heavy alcohol consumption on FLD remains unclear due to limited studies and smallsample sizes.
Subjects Evidence Based Medicine, Gastroenterology and Hepatology, Public HealthKeywords Alcohol, Fatty liver disease, Risk, Meta-analysis
INTRODUCTIONFatty liver disease (FLD) is caused by the excessive accumulation of fat in the liver cells(Bedogni, Nobili & Tiribelli, 2014)which encompasses amorphological spectrumconsistingof hepatic steatosis (fatty liver) and steatohepatitis that can progress to cirrhosis andhepatocellular carcinoma (Reddy & Rao, 2006). FLD is commonly divided into alcoholicliver disease (ALD) and nonalcoholic fatty liver disease (NAFLD) (Reddy & Rao, 2006).
How to cite this article Cao et al. (2016), Alcohol consumption and risk of fatty liver disease: a meta-analysis. PeerJ 4:e2633; DOI10.7717/peerj.2633
ALD is a liver injury as a consequence of excessive or harmful alcohol use, whichincludes a spectrum of injury, ranging from simple steatosis to cirrhosis (O’Shea, Dasarathy& McCullough, 2010; Torruellas, French & Medici, 2014). NAFLD is defined as either theexcessive fat accumulation or steatosis in the liver in patients who consume less thanor equal to 30 g of alcohol per day for men and 20 g of alcohol per day for womenafter the exclusion of other causes such as hepatitis virus infection, use of steatogenicmedication or hereditary disorders (Abd El-Kader & El-Den Ashmawy, 2015). NAFLD hasbeen considered to be the hepatic manifestation in the patients with metabolic syndrome(Angulo et al., 1999), but it may also occur in 29% of lean patients lacking associative riskfactors (Bugianesi et al., 2005).
Although it has long been known that long-term heavy drinking is a cause of livercirrhosis and liver cancer, the findings from recent observational studies have shownthat light (Dunn, Xu & Schwimmer, 2008; Nishioji et al., 2015), moderate (Moriya et al.,2013), and even heavier alcohol consumption (Gunji et al., 2009; Moriya et al., 2015) maydecrease the risk of FLD. The mechanisms that explain the inverse association betweenalcohol consumption and FLD risk remain unknown, and the suggested mechanisms ofprotection by alcohol consumption include decreased insulin resistance, enhanced hepaticblood flow, antioxidant agents in alcoholic beverages, decreased triglyceride content inthe liver, and increased circulating adiponectin (Moriya et al., 2013), Conversely, Lau et al.(2015) indicated that light alcohol consumption was associated with a higher prevalenceof FLD; Cotrim et al. (2009) reported that light to moderate alcohol consumption (LMAC)had no impact on the severity of activity and stage of FLD. Since the effect of alcoholconsumption on FLD development is still controversial, we therefore combined allpublished epidemiologic studies on this issue to evaluate the association between alcoholconsumption and FLD risk.
MATERIALS AND METHODSSearch strategyGuoli Cao and Tingzhuang Yi independently searched Medline, Embase, Web of Science,and Chinese data sources including CNKI, Wanfang Data, and the VIP database withoutyear restrictions, identifying studies that reported an association between alcoholconsumption and the risk of FLD. Key words searched were as follows: (‘‘alcohol’’OR ‘‘alcohols’’ OR ‘‘ethanol’’ OR ‘‘drinking’’ OR ‘‘wine’’ OR ‘‘beer’’ OR ‘‘spirits’’ OR‘‘prevalence’’) AND (‘‘fatty liver’’ OR ‘‘hepatic steatosis’’ OR ‘‘steatohepatitis’’). We alsochecked the reference lists of the articles retrieved fromPubMed search. English andChineselanguage was used. Two independent reviewers made an initial judgment of whether thestudies were eligible to be included in the meta-analysis, and any disagreements wereresolved by consulting Shaohui Tang.
Inclusion and exclusion criteriaThe inclusion criteria required studies to: (1) have cross-sectional, case–control, cohortstudy or randomized controlled trial (RCT) design; (2) provide information on alcoholconsumption in relation to FLD, and the referent group are non-drinkers; (3) report odds
Cao et al. (2016), PeerJ, DOI 10.7717/peerj.2633 2/23
ratios (ORs) with their corresponding 95% confidence intervals (CIs) or original dataallowing us to compute them; (4) diagnose populations with fatty liver (hepatic steatosis)or steatohepatitis through the imaging, laboratory tests or liver biopsy. Exclusion criteriaincluded duplicate reports, abstracts, case reports, review articles, editorials, and clinicalguidelines.
Data extractionData extracted from each study included the name of the first author, study design, studyregion, study period, publication year, diagnostic method, the age and sex of subjects,sample size, adjustments, inclusion and exclusion criteria, average consumption of alcohol,the OR and their 95% CI. All risk estimates are converted to OR by directly extractingfrom the study or calculating from raw data. The data extraction was performed by GuoliCao and Qianqian Liu. Investigators independently reviewed and cross-checked the data,and any disagreements were resolved by discussion between two authors or by consultingShaohui Tang. If results were published more than once, the results from the most recentone were selected.
Definition of different alcohol consumption levelsAccording to the recommendations of the World Health Organization (WHO, 2000), theaverage ethanol intake per drinking day can be usefully classified as ‘‘Low risk’’ (≤20 g/dayfor women and≤40 g/day for men), ‘‘Medium risk’’ (>20–40 g/day for women and >40–60g/day for men) and ‘‘High risk’’ (>40 g/day for women and >60 g/day for men). Based onthe different levels of alcohol consumption reported in the included studies, we classifiedthe drinkers into four groups: non-drinkers, persons who drink 0 g/day of alcohol; lightdrinkers, persons who drink ≤20 g/day (or ≤140 g/week) of alcohol; moderate drinkers,persons who drink >20–40 g/day (or >140–280 g/week); and heavy drinkers, persons whodrink >40 g/day (or >280 g/week).
Quality assessmentThe quality of cross-sectional studies was assessed by the Agency for Healthcare Researchand Quality (AHRQ) criteria (Rostom et al., 2004). The quality of cohort study was assessedby Newcastle-Ottawa Scale (NOS) (Wells et al., 2011), including representativeness of theexposed cohort, selection of the unexposed cohort, ascertainment of exposure, outcome ofinterest not present at start of study, control for the most important factor or the secondimportant factor, outcome assessment, follow-up long enough for outcomes to occur,adequacy of follow-up of cohorts.
Statistical analysisStatistical analysis was performed using STATA version 12.0 (Stata Corp, College Station,Texas). The results were expressed in terms of OR and 95% CI. Statistical heterogeneitywas evaluated through the Q test and I 2 statistic (Higgins & Thompson, 2002; Higgins et al.,2003), and P < 0.05 was considered statistically significant. The test statistic was distributedas χ2.Q statistics was used to evaluate heterogeneity, with its P values revealed by the forestplot. I 2 was used to estimate the size of the heterogeneity, with its P values revealed by
Cao et al. (2016), PeerJ, DOI 10.7717/peerj.2633 3/23
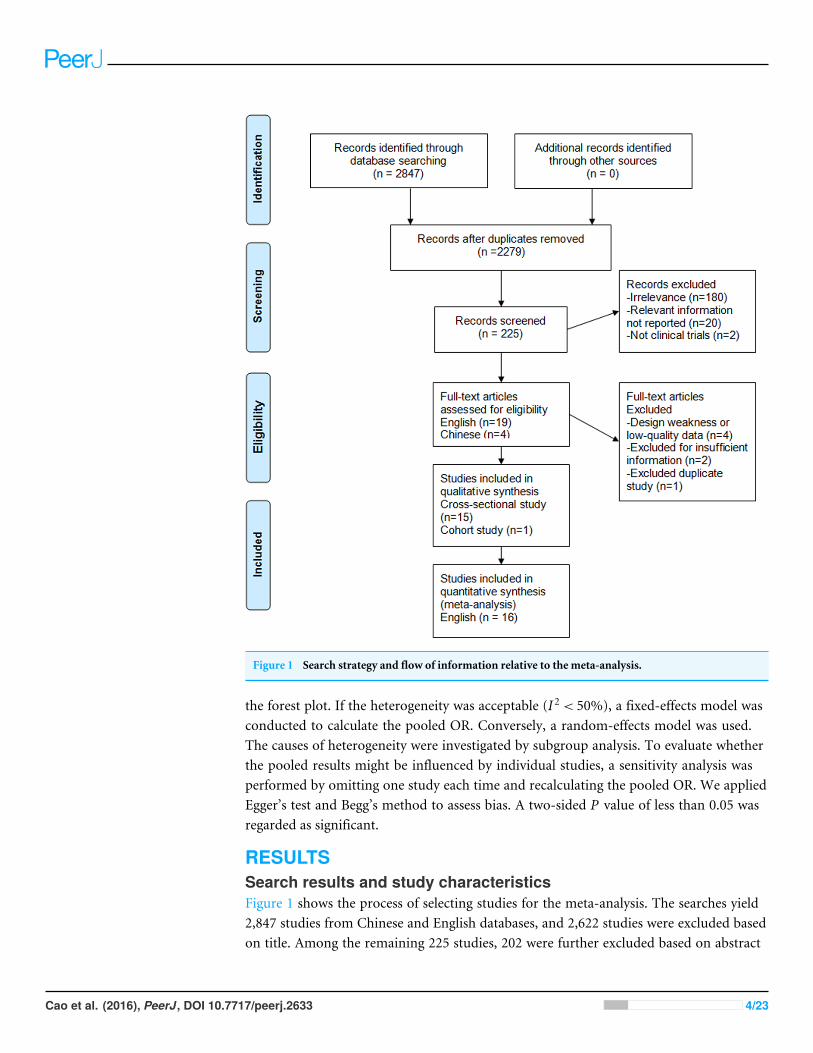
Figure 1 Search strategy and flow of information relative to the meta-analysis.
the forest plot. If the heterogeneity was acceptable (I 2< 50%), a fixed-effects model wasconducted to calculate the pooled OR. Conversely, a random-effects model was used.The causes of heterogeneity were investigated by subgroup analysis. To evaluate whetherthe pooled results might be influenced by individual studies, a sensitivity analysis wasperformed by omitting one study each time and recalculating the pooled OR. We appliedEgger’s test and Begg’s method to assess bias. A two-sided P value of less than 0.05 wasregarded as significant.
RESULTSSearch results and study characteristicsFigure 1 shows the process of selecting studies for the meta-analysis. The searches yield2,847 studies from Chinese and English databases, and 2,622 studies were excluded basedon title. Among the remaining 225 studies, 202 were further excluded based on abstract
Cao et al. (2016), PeerJ, DOI 10.7717/peerj.2633 4/23

or full text because they did not fulfill the inclusion criteria. Then, 19 English and fourChinese studies remained for complete evaluation, four Chinese studies were excludeddue to design weakness or low quality data, two English studies were excluded due toa lack of data for calculation, and one English study was discarded due to duplication.In the end, 16 observational articles with a total of 76,608 participants including 39,198nondrinkers, 31,942 light to moderate drinkers (LM drinkers), and 5,468 heavy drinkersmet our inclusion criteria (Dunn, Xu & Schwimmer, 2008; Cotrim et al., 2009; Gunji etal., 2009; Yamada et al., 2010; Hiramine et al., 2011; Dunn et al., 2012; Hamaguchi et al.,2012; Wong et al., 2012; Moriya et al., 2013; Sookoian, Castaño & Pirola, 2014; Hashimotoet al., 2015; Kächele et al., 2015; Lau et al., 2015; Moriya et al., 2015; Nishioji et al., 2015;Sogabe et al., 2015). There were 13 cross-sectional studies (Dunn, Xu & Schwimmer, 2008;Cotrim et al., 2009;Gunji et al., 2009;Hiramine et al., 2011;Dunn et al., 2012;Hamaguchi etal., 2012; Wong et al., 2012; Moriya et al., 2013; Sookoian, Castaño & Pirola, 2014; Kächeleet al., 2015; Lau et al., 2015; Nishioji et al., 2015; Sogabe et al., 2015), two cross-sectionalfollowing longitudinal studies (Yamada et al., 2010; Moriya et al., 2015) and one cohortstudy (Hashimoto et al., 2015). Of the studies, 10 were conducted in Asia (nine in Japan(Gunji et al., 2009; Yamada et al., 2010; Hiramine et al., 2011; Hamaguchi et al., 2012;Moriya et al., 2013; Hashimoto et al., 2015; Moriya et al., 2015; Nishioji et al., 2015; Sogabeet al., 2015) and one in Hong Kong (Wong et al., 2012)) and six in other countries (two inthe US (Dunn, Xu & Schwimmer, 2008; Dunn et al., 2012), 1 in Brazil (Cotrim et al., 2009),1 in Argentina (Sookoian, Castaño & Pirola, 2014) and 2 in Germany (Kächele et al., 2015;Lau et al., 2015)). A total of 12 studies provided adjusted risk estimate, and four studiesreported only crude data. One study (Moriya et al., 2011) was excluded because it wasduplicate study (Tables 1 and 2).
Study qualityMost of the cross-sectional studies had provided specific inclusion and exclusion criteria,source of information, and controlled confounding factors. But only a few studies obtaineda follow-up (Yamada et al., 2010; Moriya et al., 2015) and explained how missing datawere handled (Dunn, Xu & Schwimmer, 2008; Moriya et al., 2013; Kächele et al., 2015; Lauet al., 2015;Moriya et al., 2015; Nishioji et al., 2015; Sogabe et al., 2015). Most of the studies(Dunn, Xu & Schwimmer, 2008; Gunji et al., 2009; Hiramine et al., 2011; Hamaguchi et al.,2012; Wong et al., 2012; Moriya et al., 2013; Kächele et al., 2015; Lau et al., 2015; Nishioji etal., 2015; Sogabe et al., 2015; Yamada et al., 2010;Moriya et al., 2015) were evaluated as lowrisk of bias, 2 studies (Cotrim et al., 2009; Dunn et al., 2012) had moderate risk of bias, and1 study (Sookoian, Castaño & Pirola, 2014) had high risk of bias (Table 3). The quality ofcohort study (Hashimoto et al., 2015) was full score of 9, and a score ≥6 stars is consideredto be high quality.
Light to moderate drinkers (LM drinkers) vs non-drinkersA meta-analysis was conducted with the data from the 16 heterogeneous studies(I 2 = 79.3%, P < 0.001) with 31,942 LM drinkers, showing the LMAC was associatedwith a 22.6% reduction in risk of FLD (OR = 0.774, 95% CI [0.695–0.862], P < 0.001)
Cao et al. (2016), PeerJ, DOI 10.7717/peerj.2633 5/23
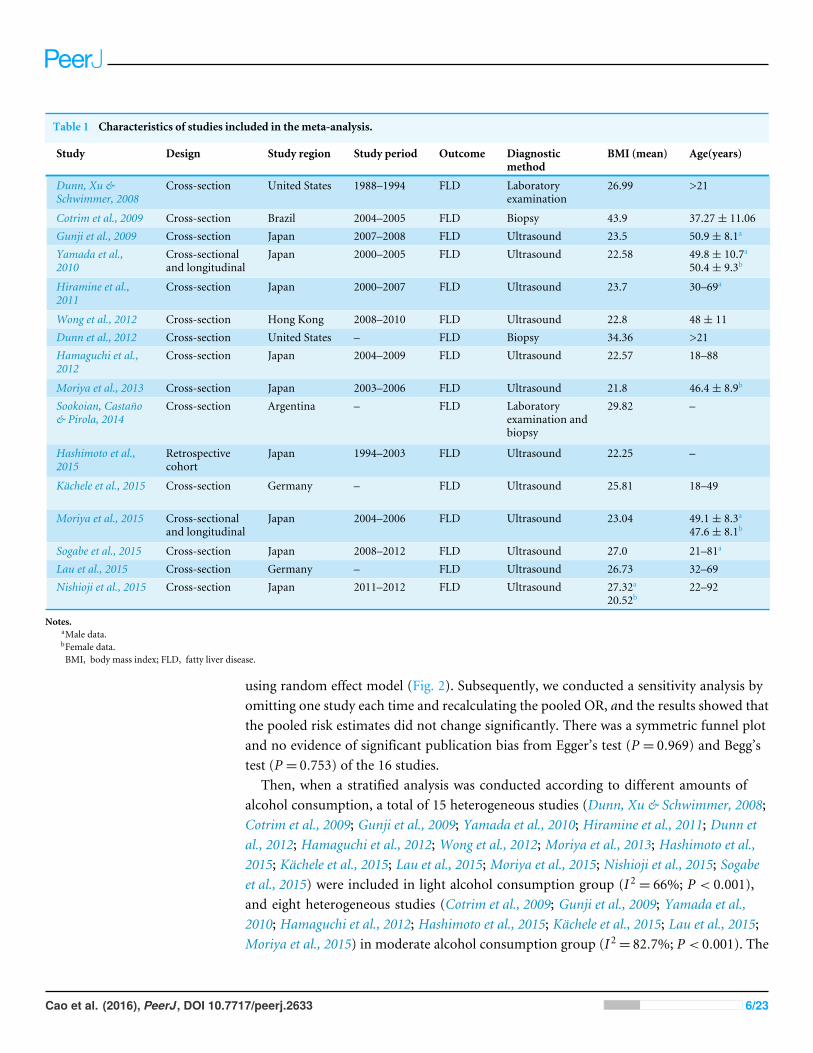
Table 1 Characteristics of studies included in the meta-analysis.
Study Design Study region Study period Outcome Diagnosticmethod
BMI (mean) Age(years)
Dunn, Xu &Schwimmer, 2008
Cross-section United States 1988–1994 FLD Laboratoryexamination
26.99 >21
Cotrim et al., 2009 Cross-section Brazil 2004–2005 FLD Biopsy 43.9 37.27± 11.06Gunji et al., 2009 Cross-section Japan 2007–2008 FLD Ultrasound 23.5 50.9± 8.1a
Yamada et al.,2010
Cross-sectionaland longitudinal
Japan 2000–2005 FLD Ultrasound 22.58 49.8± 10.7a50.4± 9.3b
Hiramine et al.,2011
Cross-section Japan 2000–2007 FLD Ultrasound 23.7 30–69a
Wong et al., 2012 Cross-section Hong Kong 2008–2010 FLD Ultrasound 22.8 48± 11Dunn et al., 2012 Cross-section United States – FLD Biopsy 34.36 >21Hamaguchi et al.,2012
Cross-section Japan 2004–2009 FLD Ultrasound 22.57 18–88
Moriya et al., 2013 Cross-section Japan 2003–2006 FLD Ultrasound 21.8 46.4± 8.9b
Sookoian, Castaño& Pirola, 2014
Cross-section Argentina – FLD Laboratoryexamination andbiopsy
29.82 –
Hashimoto et al.,2015
Retrospectivecohort
Japan 1994–2003 FLD Ultrasound 22.25 –
Kächele et al., 2015 Cross-section Germany – FLD Ultrasound 25.81 18–49
Moriya et al., 2015 Cross-sectionaland longitudinal
Japan 2004–2006 FLD Ultrasound 23.04 49.1± 8.3a47.6± 8.1b
Sogabe et al., 2015 Cross-section Japan 2008–2012 FLD Ultrasound 27.0 21–81a
Lau et al., 2015 Cross-section Germany – FLD Ultrasound 26.73 32–69Nishioji et al., 2015 Cross-section Japan 2011–2012 FLD Ultrasound 27.32a
20.52b22–92
Notes.aMale data.bFemale data.BMI, body mass index; FLD, fatty liver disease.
using random effect model (Fig. 2). Subsequently, we conducted a sensitivity analysis byomitting one study each time and recalculating the pooled OR, and the results showed thatthe pooled risk estimates did not change significantly. There was a symmetric funnel plotand no evidence of significant publication bias from Egger’s test (P = 0.969) and Begg’stest (P = 0.753) of the 16 studies.
Then, when a stratified analysis was conducted according to different amounts ofalcohol consumption, a total of 15 heterogeneous studies (Dunn, Xu & Schwimmer, 2008;Cotrim et al., 2009; Gunji et al., 2009; Yamada et al., 2010; Hiramine et al., 2011; Dunn etal., 2012; Hamaguchi et al., 2012; Wong et al., 2012; Moriya et al., 2013; Hashimoto et al.,2015; Kächele et al., 2015; Lau et al., 2015; Moriya et al., 2015; Nishioji et al., 2015; Sogabeet al., 2015) were included in light alcohol consumption group (I 2 = 66%; P < 0.001),and eight heterogeneous studies (Cotrim et al., 2009; Gunji et al., 2009; Yamada et al.,2010; Hamaguchi et al., 2012; Hashimoto et al., 2015; Kächele et al., 2015; Lau et al., 2015;Moriya et al., 2015) in moderate alcohol consumption group (I 2= 82.7%; P < 0.001). The
Cao et al. (2016), PeerJ, DOI 10.7717/peerj.2633 6/23
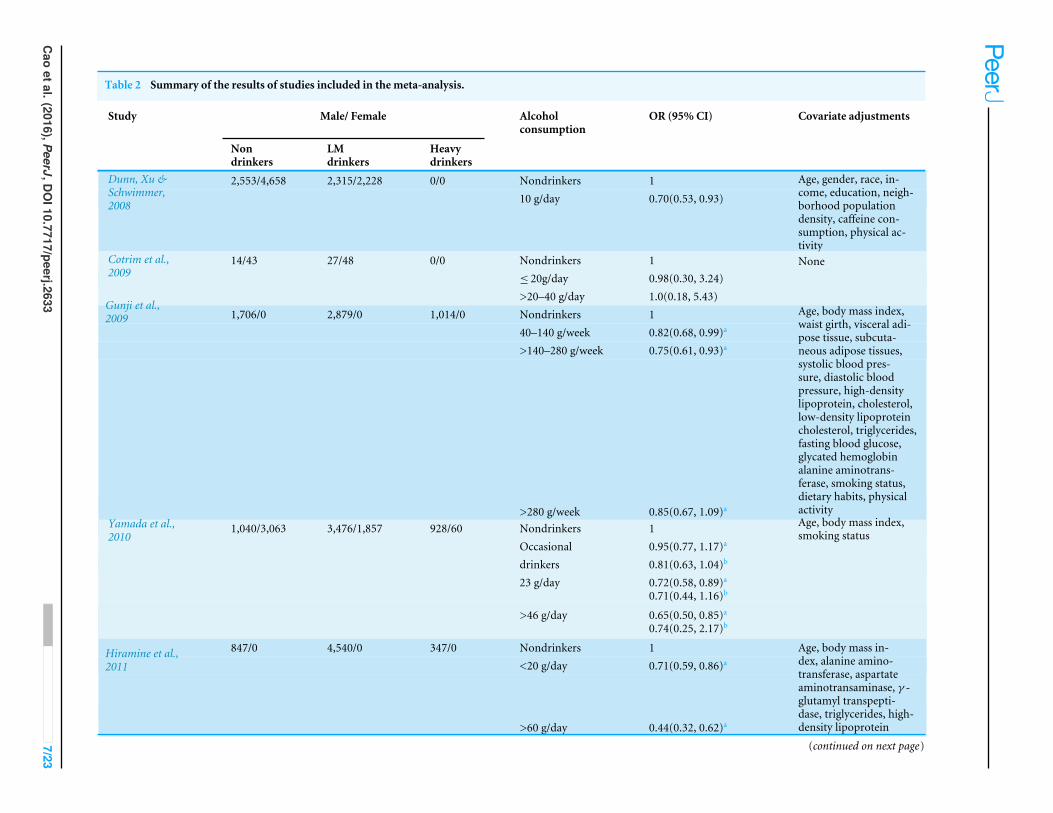
Table 2 Summary of the results of studies included in the meta-analysis.
Study Male/ Female Alcoholconsumption
OR (95% CI) Covariate adjustments
Nondrinkers
LMdrinkers
Heavydrinkers
2,553/4,658 2,315/2,228 0/0 Nondrinkers 1Dunn, Xu &Schwimmer,2008 10 g/day 0.70(0.53, 0.93)
Age, gender, race, in-come, education, neigh-borhood populationdensity, caffeine con-sumption, physical ac-tivity
14/43 27/48 0/0 Nondrinkers 1≤ 20g/day 0.98(0.30, 3.24)
Cotrim et al.,2009
>20–40 g/day 1.0(0.18, 5.43)
None
1,706/0 2,879/0 1,014/0 Nondrinkers 140–140 g/week 0.82(0.68, 0.99)a
>140–280 g/week 0.75(0.61, 0.93)a
Gunji et al.,2009
>280 g/week 0.85(0.67, 1.09)a
Age, body mass index,waist girth, visceral adi-pose tissue, subcuta-neous adipose tissues,systolic blood pres-sure, diastolic bloodpressure, high-densitylipoprotein, cholesterol,low-density lipoproteincholesterol, triglycerides,fasting blood glucose,glycated hemoglobinalanine aminotrans-ferase, smoking status,dietary habits, physicalactivity
1,040/3,063 3,476/1,857 928/60 Nondrinkers 1Occasional 0.95(0.77, 1.17)a
drinkers 0.81(0.63, 1.04)b
23 g/day 0.72(0.58, 0.89)a0.71(0.44, 1.16)b
Yamada et al.,2010
>46 g/day 0.65(0.50, 0.85)a0.74(0.25, 2.17)b
Age, body mass index,smoking status
847/0 4,540/0 347/0 Nondrinkers 1<20 g/day 0.71(0.59, 0.86)a
Hiramine et al.,2011
>60 g/day 0.44(0.32, 0.62)a
Age, body mass in-dex, alanine amino-transferase, aspartateaminotransaminase, γ -glutamyl transpepti-dase, triglycerides, high-density lipoprotein
(continued on next page)
Cao
etal.(2016),PeerJ,DOI10.7717/peerj.2633
7/23

Table 2 (continued)Study Male/ Female Alcohol
consumptionOR (95% CI) Covariate adjustments
Nondrinkers
LMdrinkers
Heavydrinkers
720c 148c 0c Nondrinkers 1Wong et al.,2012 <10 g/day 1.37(0.89, 2.11)
Demographic, metabolicfactors
70/181 128/203 0/0 Non-drinks 1Dunn et al.,2012
<20 g/day 0.56(0.39, 0.84)
Gender, age,race, income,education, glycatedhemoglobin, alanineaminotransferase,recreational, non-recreational physicalactivity, smoking,total calories per day,percent calories fromcarbohydrates, percentcalories from fat
6,154/6,892 3,350/613 1,478/84 Nondrinkers 140–140 g/week 0.69(0.60, 0.79)a
0.54(0.34, 0.88)b
>140–280 g/week 0.72(0.63, 0.83)a0.43(0.21, 0.88)b
Hamaguchi etal., 2012
>280 g/week 0.74(0.64, 0.85)a1.02(0.44, 2.35)b
Age, use of drugs.metabolic syndrome,regular exercise,smoking
0/3,403 0/1,219 0/0 Nondrinkers 1<70 g/week 0.74(0.55, 0.98)b
Moriya et al.,2013
70–139.9 g/week 0.67(0.44, 1.00)b
Obesity, atherogenic,dyslipidemia, glucoseintolerance, hyper-uricemia, hypertension,current smoking status,age
172/159 40/43 0/0 Nondrinkers 1Sookoian, Cas-taño & Pirola,2014
<40 g/day 0.49(0.30, 0.79)
–
1,704/1,765 1,332/208 411/17 Nondrinkers 140–140 g/week 0.602(0.486 ,0.745)a
0.539(0.216,1.344)b
>140–280 g/week 0.607(0.484, 0.763)a0.366(0.050, 2.680)b
Hashimoto et al.,2015
>280 g/week 0.573(0.436, 0.751)a1.052(0.138 ,8.012)b
None
(continued on next page)
Cao
etal.(2016),PeerJ,DOI10.7717/peerj.2633
8/23
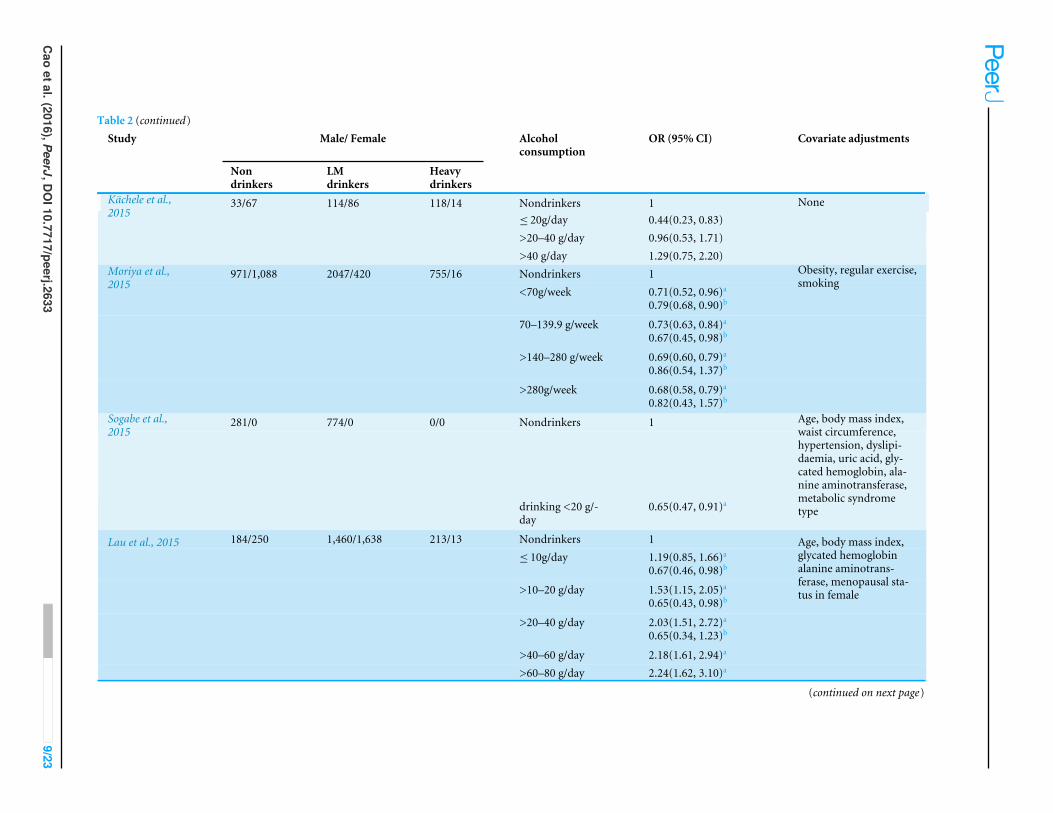
Table 2 (continued)Study Male/ Female Alcohol
consumptionOR (95% CI) Covariate adjustments
Nondrinkers
LMdrinkers
Heavydrinkers
33/67 114/86 118/14 Nondrinkers 1≤ 20g/day 0.44(0.23, 0.83)>20–40 g/day 0.96(0.53, 1.71)
Kächele et al.,2015
>40 g/day 1.29(0.75, 2.20)
None
971/1,088 2047/420 755/16 Nondrinkers 1<70g/week 0.71(0.52, 0.96)a
0.79(0.68, 0.90)b
70–139.9 g/week 0.73(0.63, 0.84)a0.67(0.45, 0.98)b
>140–280 g/week 0.69(0.60, 0.79)a0.86(0.54, 1.37)b
Moriya et al.,2015
>280g/week 0.68(0.58, 0.79)a0.82(0.43, 1.57)b
Obesity, regular exercise,smoking
281/0 774/0 0/0 Nondrinkers 1Sogabe et al.,2015
drinking <20 g/-day
0.65(0.47, 0.91)a
Age, body mass index,waist circumference,hypertension, dyslipi-daemia, uric acid, gly-cated hemoglobin, ala-nine aminotransferase,metabolic syndrometype
184/250 1,460/1,638 213/13 Nondrinkers 1≤ 10g/day 1.19(0.85, 1.66)a
0.67(0.46, 0.98)b
>10–20 g/day 1.53(1.15, 2.05)a0.65(0.43, 0.98)b
>20–40 g/day 2.03(1.51, 2.72)a0.65(0.34, 1.23)b
>40–60 g/day 2.18(1.61, 2.94)a
Lau et al., 2015
>60–80 g/day 2.24(1.62, 3.10)a
Age, body mass index,glycated hemoglobinalanine aminotrans-ferase, menopausal sta-tus in female
(continued on next page)
Cao
etal.(2016),PeerJ,DOI10.7717/peerj.2633
9/23
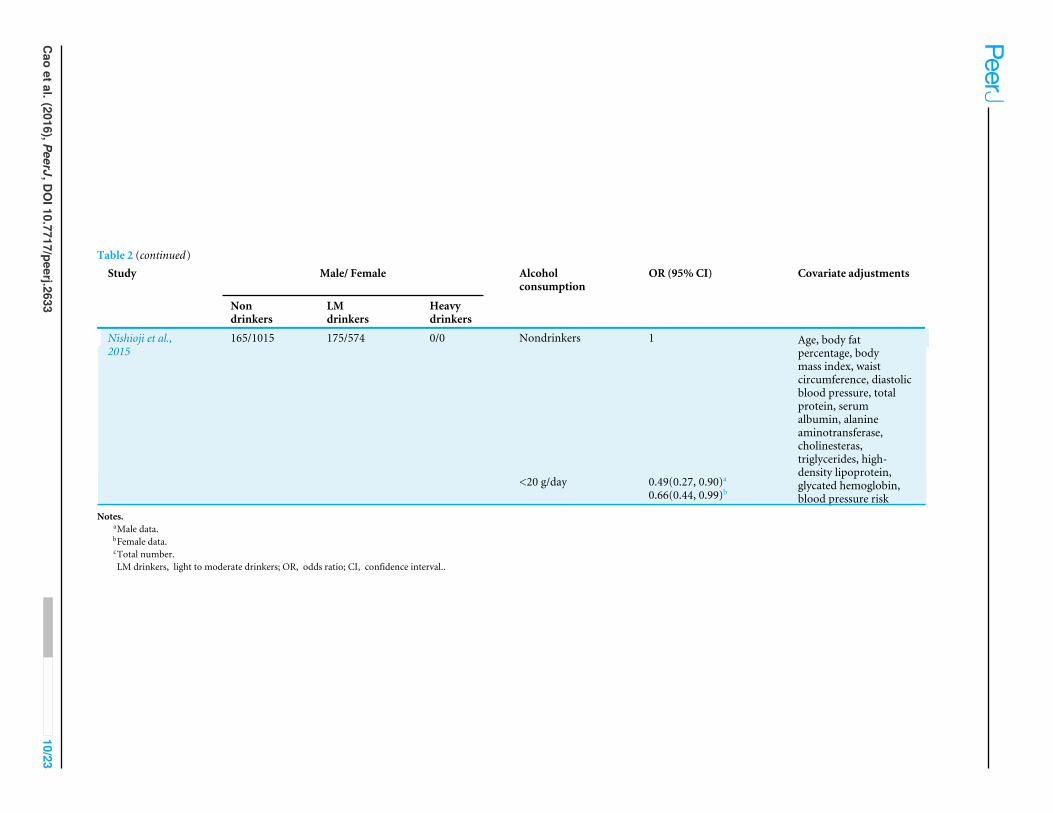
Table 2 (continued)Study Male/ Female Alcohol
consumptionOR (95% CI) Covariate adjustments
Nondrinkers
LMdrinkers
Heavydrinkers
165/1015 175/574 0/0 Nondrinkers 1Nishioji et al.,2015
<20 g/day 0.49(0.27, 0.90)a0.66(0.44, 0.99)b
Age, body fatpercentage, bodymass index, waistcircumference, diastolicblood pressure, totalprotein, serumalbumin, alanineaminotransferase,cholinesteras,triglycerides, high-density lipoprotein,glycated hemoglobin,blood pressure risk
Notes.aMale data.bFemale data.cTotal number.LM drinkers, light to moderate drinkers; OR, odds ratio; CI, confidence interval..
Cao
etal.(2016),PeerJ,DOI10.7717/peerj.2633
10/23
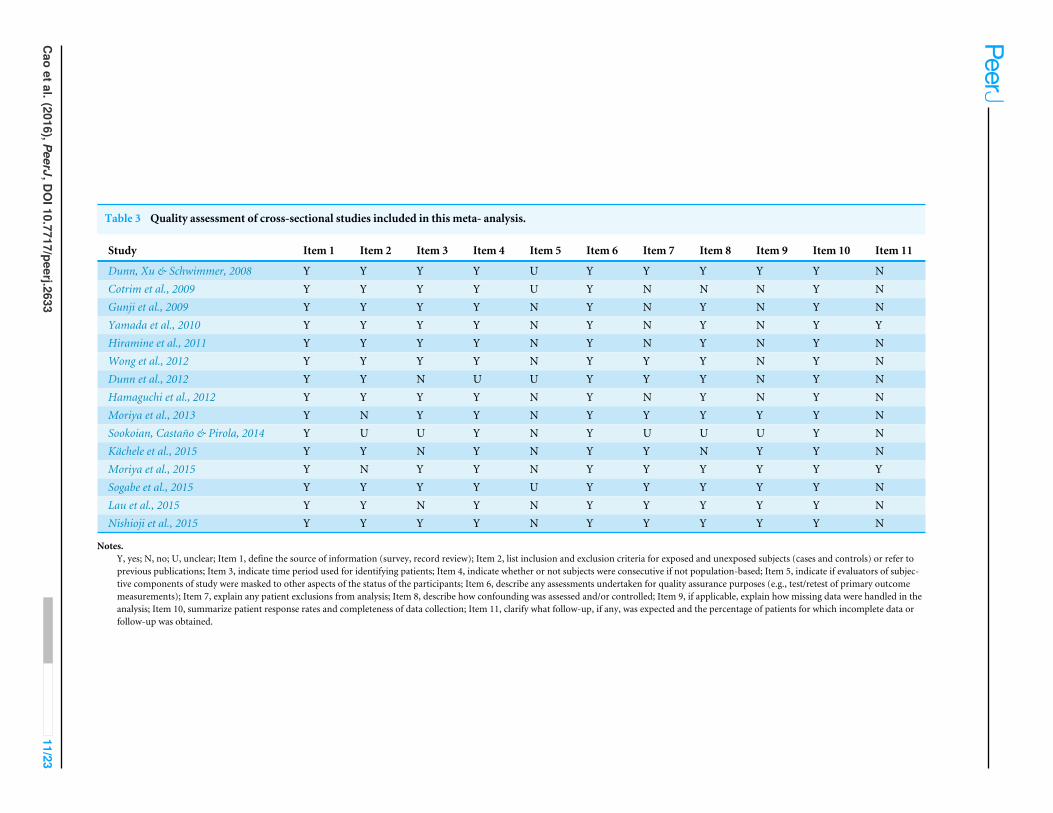
Table 3 Quality assessment of cross-sectional studies included in this meta- analysis.
Study Item 1 Item 2 Item 3 Item 4 Item 5 Item 6 Item 7 Item 8 Item 9 Item 10 Item 11
Dunn, Xu & Schwimmer, 2008 Y Y Y Y U Y Y Y Y Y NCotrim et al., 2009 Y Y Y Y U Y N N N Y NGunji et al., 2009 Y Y Y Y N Y N Y N Y NYamada et al., 2010 Y Y Y Y N Y N Y N Y YHiramine et al., 2011 Y Y Y Y N Y N Y N Y NWong et al., 2012 Y Y Y Y N Y Y Y N Y NDunn et al., 2012 Y Y N U U Y Y Y N Y NHamaguchi et al., 2012 Y Y Y Y N Y N Y N Y NMoriya et al., 2013 Y N Y Y N Y Y Y Y Y NSookoian, Castaño & Pirola, 2014 Y U U Y N Y U U U Y NKächele et al., 2015 Y Y N Y N Y Y N Y Y NMoriya et al., 2015 Y N Y Y N Y Y Y Y Y YSogabe et al., 2015 Y Y Y Y U Y Y Y Y Y NLau et al., 2015 Y Y N Y N Y Y Y Y Y NNishioji et al., 2015 Y Y Y Y N Y Y Y Y Y N
Notes.Y, yes; N, no; U, unclear; Item 1, define the source of information (survey, record review); Item 2, list inclusion and exclusion criteria for exposed and unexposed subjects (cases and controls) or refer toprevious publications; Item 3, indicate time period used for identifying patients; Item 4, indicate whether or not subjects were consecutive if not population-based; Item 5, indicate if evaluators of subjec-tive components of study were masked to other aspects of the status of the participants; Item 6, describe any assessments undertaken for quality assurance purposes (e.g., test/retest of primary outcomemeasurements); Item 7, explain any patient exclusions from analysis; Item 8, describe how confounding was assessed and/or controlled; Item 9, if applicable, explain how missing data were handled in theanalysis; Item 10, summarize patient response rates and completeness of data collection; Item 11, clarify what follow-up, if any, was expected and the percentage of patients for which incomplete data orfollow-up was obtained.
Cao
etal.(2016),PeerJ,DOI10.7717/peerj.2633
11/23
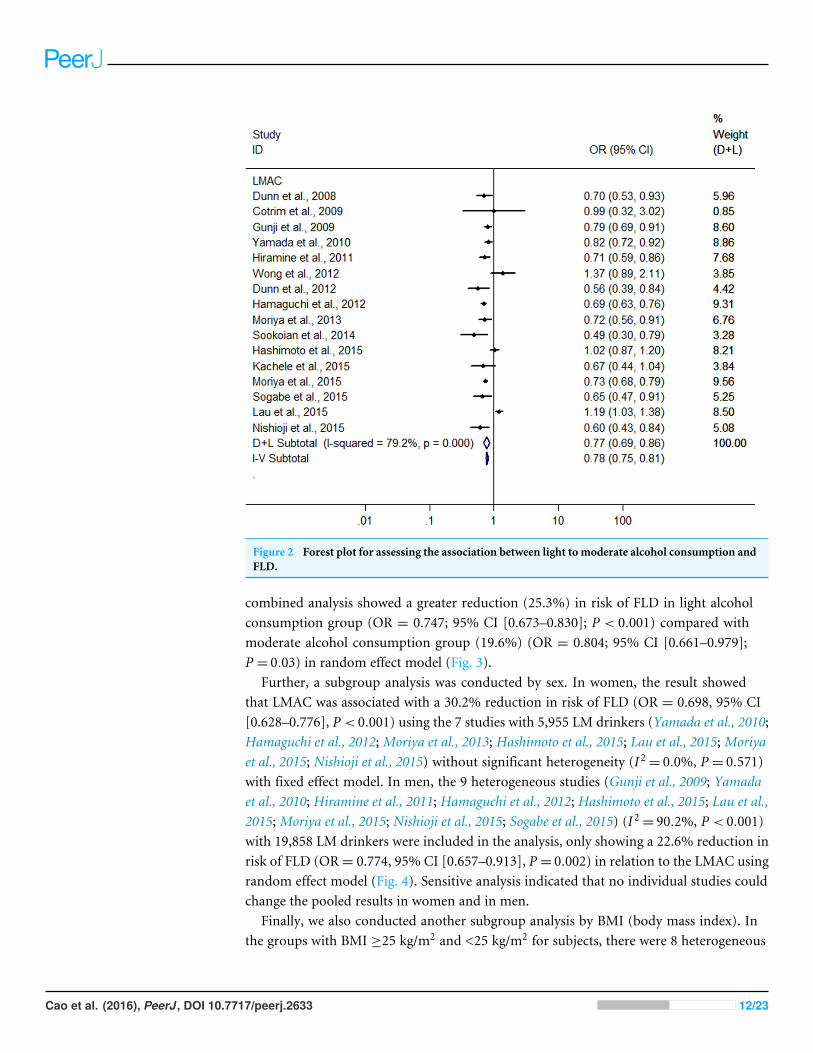
Figure 2 Forest plot for assessing the association between light to moderate alcohol consumption andFLD.
combined analysis showed a greater reduction (25.3%) in risk of FLD in light alcoholconsumption group (OR = 0.747; 95% CI [0.673–0.830]; P < 0.001) compared withmoderate alcohol consumption group (19.6%) (OR = 0.804; 95% CI [0.661–0.979];P = 0.03) in random effect model (Fig. 3).
Further, a subgroup analysis was conducted by sex. In women, the result showedthat LMAC was associated with a 30.2% reduction in risk of FLD (OR = 0.698, 95% CI[0.628–0.776], P < 0.001) using the 7 studies with 5,955 LM drinkers (Yamada et al., 2010;Hamaguchi et al., 2012; Moriya et al., 2013; Hashimoto et al., 2015; Lau et al., 2015; Moriyaet al., 2015; Nishioji et al., 2015) without significant heterogeneity (I 2= 0.0%, P = 0.571)with fixed effect model. In men, the 9 heterogeneous studies (Gunji et al., 2009; Yamadaet al., 2010; Hiramine et al., 2011; Hamaguchi et al., 2012; Hashimoto et al., 2015; Lau et al.,2015; Moriya et al., 2015; Nishioji et al., 2015; Sogabe et al., 2015) (I 2= 90.2%, P < 0.001)with 19,858 LM drinkers were included in the analysis, only showing a 22.6% reduction inrisk of FLD (OR= 0.774, 95% CI [0.657–0.913], P = 0.002) in relation to the LMAC usingrandom effect model (Fig. 4). Sensitive analysis indicated that no individual studies couldchange the pooled results in women and in men.
Finally, we also conducted another subgroup analysis by BMI (body mass index). Inthe groups with BMI ≥25 kg/m2 and <25 kg/m2 for subjects, there were 8 heterogeneous
Cao et al. (2016), PeerJ, DOI 10.7717/peerj.2633 12/23
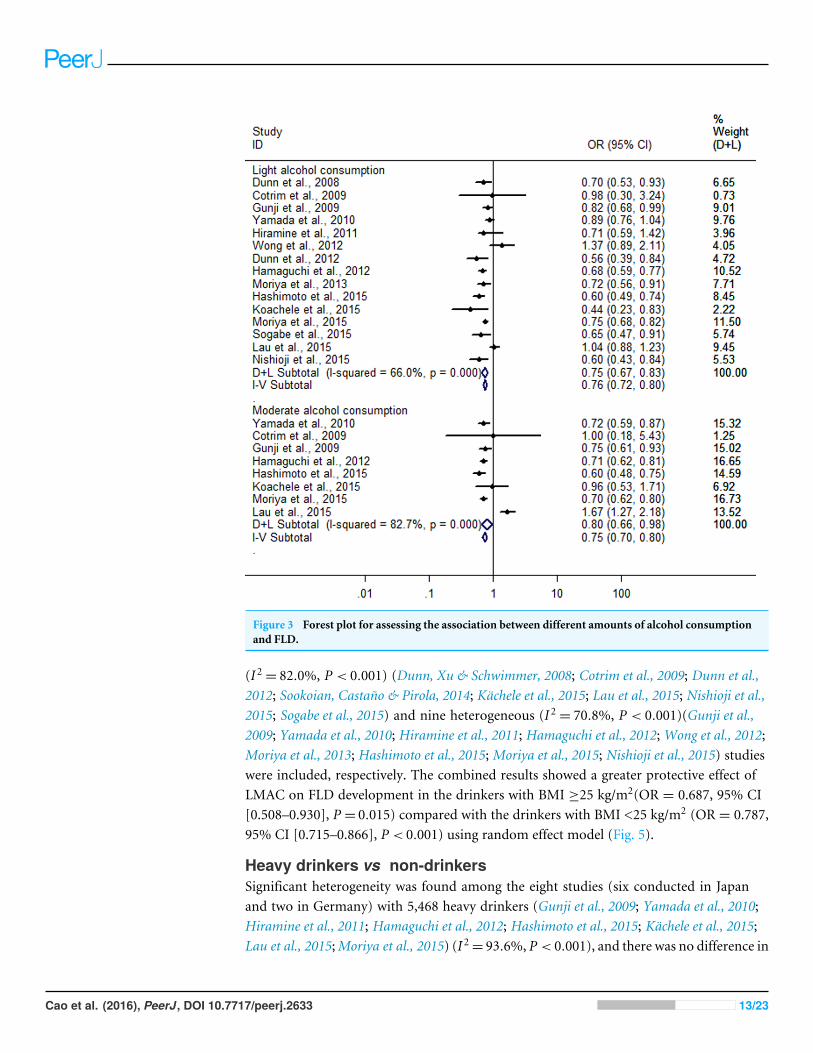
Figure 3 Forest plot for assessing the association between different amounts of alcohol consumptionand FLD.
(I 2= 82.0%, P < 0.001) (Dunn, Xu & Schwimmer, 2008; Cotrim et al., 2009; Dunn et al.,2012; Sookoian, Castaño & Pirola, 2014; Kächele et al., 2015; Lau et al., 2015; Nishioji et al.,2015; Sogabe et al., 2015) and nine heterogeneous (I 2 = 70.8%, P < 0.001)(Gunji et al.,2009; Yamada et al., 2010; Hiramine et al., 2011; Hamaguchi et al., 2012; Wong et al., 2012;Moriya et al., 2013; Hashimoto et al., 2015; Moriya et al., 2015; Nishioji et al., 2015) studieswere included, respectively. The combined results showed a greater protective effect ofLMAC on FLD development in the drinkers with BMI ≥25 kg/m2(OR = 0.687, 95% CI[0.508–0.930], P = 0.015) compared with the drinkers with BMI <25 kg/m2 (OR = 0.787,95% CI [0.715–0.866], P < 0.001) using random effect model (Fig. 5).
Heavy drinkers vs non-drinkersSignificant heterogeneity was found among the eight studies (six conducted in Japanand two in Germany) with 5,468 heavy drinkers (Gunji et al., 2009; Yamada et al., 2010;Hiramine et al., 2011; Hamaguchi et al., 2012; Hashimoto et al., 2015; Kächele et al., 2015;Lau et al., 2015;Moriya et al., 2015) (I 2= 93.6%, P < 0.001), and there was no difference in
Cao et al. (2016), PeerJ, DOI 10.7717/peerj.2633 13/23
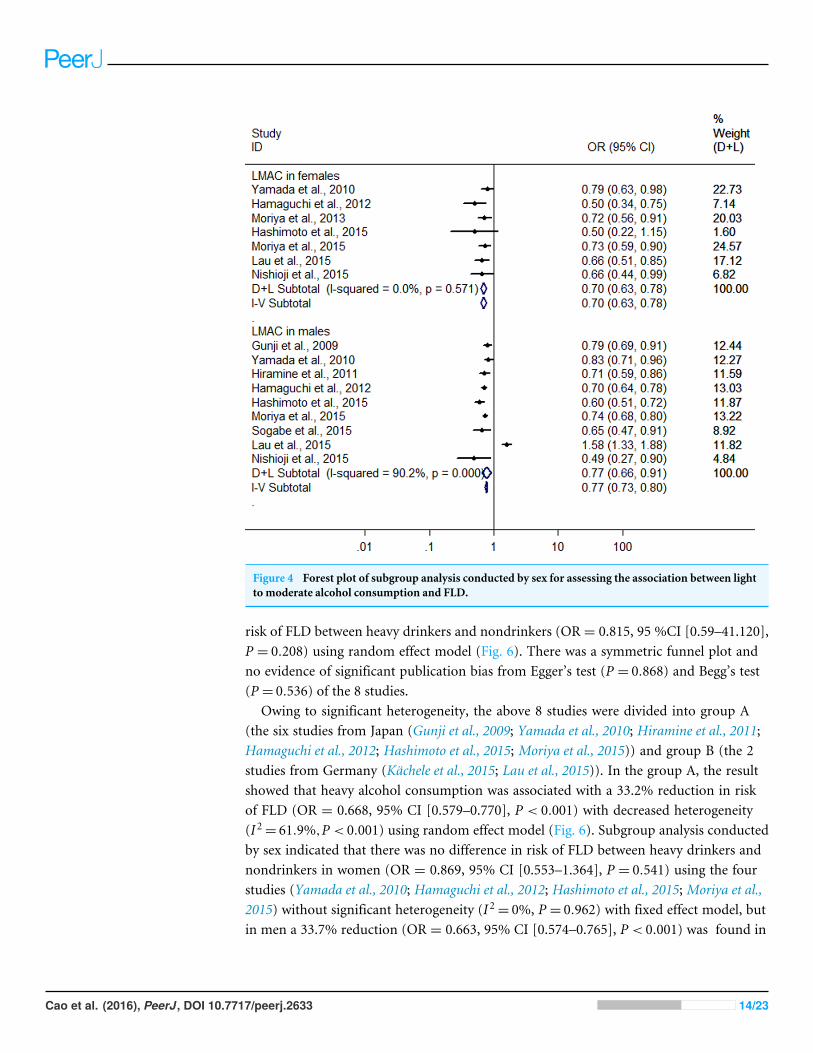
Figure 4 Forest plot of subgroup analysis conducted by sex for assessing the association between lightto moderate alcohol consumption and FLD.
risk of FLD between heavy drinkers and nondrinkers (OR = 0.815, 95 %CI [0.59–41.120],P = 0.208) using random effect model (Fig. 6). There was a symmetric funnel plot andno evidence of significant publication bias from Egger’s test (P = 0.868) and Begg’s test(P = 0.536) of the 8 studies.
Owing to significant heterogeneity, the above 8 studies were divided into group A(the six studies from Japan (Gunji et al., 2009; Yamada et al., 2010; Hiramine et al., 2011;Hamaguchi et al., 2012; Hashimoto et al., 2015; Moriya et al., 2015)) and group B (the 2studies from Germany (Kächele et al., 2015; Lau et al., 2015)). In the group A, the resultshowed that heavy alcohol consumption was associated with a 33.2% reduction in riskof FLD (OR = 0.668, 95% CI [0.579–0.770], P < 0.001) with decreased heterogeneity(I 2= 61.9%,P < 0.001) using random effect model (Fig. 6). Subgroup analysis conductedby sex indicated that there was no difference in risk of FLD between heavy drinkers andnondrinkers in women (OR = 0.869, 95% CI [0.553–1.364], P = 0.541) using the fourstudies (Yamada et al., 2010; Hamaguchi et al., 2012; Hashimoto et al., 2015; Moriya et al.,2015) without significant heterogeneity (I 2= 0%, P = 0.962) with fixed effect model, butin men a 33.7% reduction (OR = 0.663, 95% CI [0.574–0.765], P < 0.001) was found in
Cao et al. (2016), PeerJ, DOI 10.7717/peerj.2633 14/23

Figure 5 Forest plot of subgroup analysis conducted by BMI for assessing the association betweenlight to moderate alcohol consumption and FLD.
risk of FLD regarding heavy alcohol consumption using the six studies (Gunji et al., 2009;Yamada et al., 2010; Hiramine et al., 2011; Hamaguchi et al., 2012; Hashimoto et al., 2015;Moriya et al., 2015) with decreased heterogeneity (I 2= 61.6%, P = 0.023) using randomeffect model (Fig. 7). In the group B, 132 heavy drinkers and 213 male heavy drinkerswere included by Kächele et al. (2015) and Lau et al. (2015), respectively, and an increasedrisk of FLD was observed in relation to heavy alcohol consumption (OR = 1.785, 95%CI [1.064–2.996], P = 0.028) with decreased heterogeneity (I 2= 69.9%, P = 0.068) usingrandom effect model (Fig. 6).
DISCUSSIONAlcohol consumption is a common lifestyle factor and has been associated with cancer,cardiovascular diseases, type 2 diabetes, liver cirrhosis and stroke (Corrao et al., 2004;Ronksley et al., 2011). However, it has been suggested, in contrast, that moderate alcoholconsumption shows a beneficial influence on coronary heart disease, stroke, type 2 diabetesmellitus, and cataract (Rimm et al., 1999; Rehm et al., 2003; Koppes et al., 2005; Ronksley etal., 2011; Gong et al., 2015). Similarly, several epidemiological studies have also revealedthat moderate alcohol consumption has a protective effect on the development of FLD
Cao et al. (2016), PeerJ, DOI 10.7717/peerj.2633 15/23
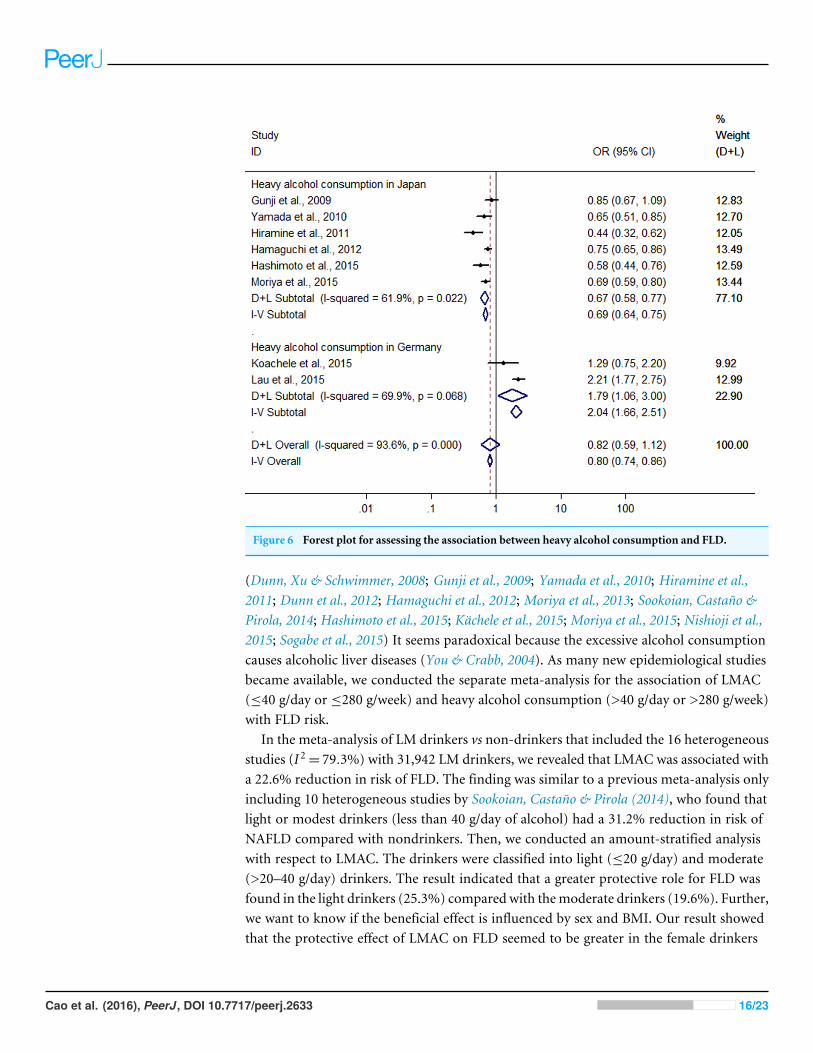
Figure 6 Forest plot for assessing the association between heavy alcohol consumption and FLD.
(Dunn, Xu & Schwimmer, 2008; Gunji et al., 2009; Yamada et al., 2010; Hiramine et al.,2011; Dunn et al., 2012; Hamaguchi et al., 2012; Moriya et al., 2013; Sookoian, Castaño &Pirola, 2014; Hashimoto et al., 2015; Kächele et al., 2015; Moriya et al., 2015; Nishioji et al.,2015; Sogabe et al., 2015) It seems paradoxical because the excessive alcohol consumptioncauses alcoholic liver diseases (You & Crabb, 2004). As many new epidemiological studiesbecame available, we conducted the separate meta-analysis for the association of LMAC(≤40 g/day or ≤280 g/week) and heavy alcohol consumption (>40 g/day or >280 g/week)with FLD risk.
In the meta-analysis of LM drinkers vs non-drinkers that included the 16 heterogeneousstudies (I 2= 79.3%) with 31,942 LM drinkers, we revealed that LMAC was associated witha 22.6% reduction in risk of FLD. The finding was similar to a previous meta-analysis onlyincluding 10 heterogeneous studies by Sookoian, Castaño & Pirola (2014), who found thatlight or modest drinkers (less than 40 g/day of alcohol) had a 31.2% reduction in risk ofNAFLD compared with nondrinkers. Then, we conducted an amount-stratified analysiswith respect to LMAC. The drinkers were classified into light (≤20 g/day) and moderate(>20–40 g/day) drinkers. The result indicated that a greater protective role for FLD wasfound in the light drinkers (25.3%) compared with themoderate drinkers (19.6%). Further,we want to know if the beneficial effect is influenced by sex and BMI. Our result showedthat the protective effect of LMAC on FLD seemed to be greater in the female drinkers
Cao et al. (2016), PeerJ, DOI 10.7717/peerj.2633 16/23
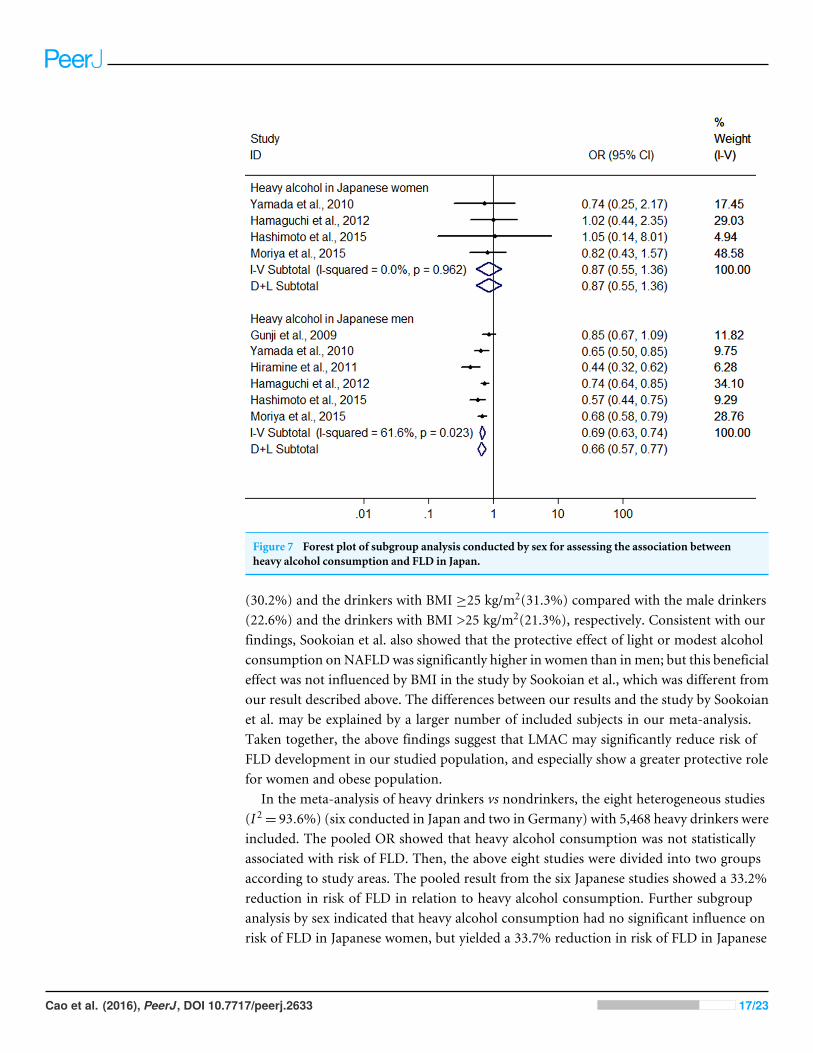
Figure 7 Forest plot of subgroup analysis conducted by sex for assessing the association betweenheavy alcohol consumption and FLD in Japan.
(30.2%) and the drinkers with BMI ≥25 kg/m2(31.3%) compared with the male drinkers(22.6%) and the drinkers with BMI >25 kg/m2(21.3%), respectively. Consistent with ourfindings, Sookoian et al. also showed that the protective effect of light or modest alcoholconsumption on NAFLDwas significantly higher in women than inmen; but this beneficialeffect was not influenced by BMI in the study by Sookoian et al., which was different fromour result described above. The differences between our results and the study by Sookoianet al. may be explained by a larger number of included subjects in our meta-analysis.Taken together, the above findings suggest that LMAC may significantly reduce risk ofFLD development in our studied population, and especially show a greater protective rolefor women and obese population.
In the meta-analysis of heavy drinkers vs nondrinkers, the eight heterogeneous studies(I 2= 93.6%) (six conducted in Japan and two in Germany) with 5,468 heavy drinkers wereincluded. The pooled OR showed that heavy alcohol consumption was not statisticallyassociated with risk of FLD. Then, the above eight studies were divided into two groupsaccording to study areas. The pooled result from the six Japanese studies showed a 33.2%reduction in risk of FLD in relation to heavy alcohol consumption. Further subgroupanalysis by sex indicated that heavy alcohol consumption had no significant influence onrisk of FLD in Japanese women, but yielded a 33.7% reduction in risk of FLD in Japanese
Cao et al. (2016), PeerJ, DOI 10.7717/peerj.2633 17/23

men. However, in the meta-analysis from the two Germanic studies that included 132heavy drinkers and 213 male heavy drinkers, an increased risk of FLD was found in relationto heavy alcohol consumption. Concordant with our results from Japanese studies, Knottet al. reported that reductions in the risk of type 2 diabetes were present at all levels ofalcohol intake <63 g/day (Knott, Bell & Britton, 2015); Larsson, Orsini & Wolk (2015) notedthat high alcohol consumption (≥14 drinks/week) did not increase risk of heart failure.However, because of the limited studies and small sample sizes, the effect of heavy alcoholconsumption on FLD remains unclear, and more prospective studies are needed.
The causal impact of alcohol on liver cirrhosis has long been known. However, thelikelihood of developing progressive alcohol-induced liver disease or cirrhosis is notcompletely dose-dependent, because it occurs in only a subset of patients (O’Shea,Dasarathy & McCullough, 2010). Bellentani et al. (1997) reported that, in a population-based cohort study of almost 7000 subjects in Italy, even among subjects with very highdaily alcohol intake (120 g/day), only 13.5% developed ALD, which means that heavyalcohol consumption is likely not to increase risk of liver disease in most of the subjects. Ithas been shown that the development and progression of alcohol-associated liver diseasemay depend upon multiple risk factors, including the dose, duration, and type of alcoholconsumption, drinking patterns, sex, ethnicity, and genetic factors, and so on (O’Shea,Dasarathy & McCullough, 2010).
In the two previous meta-analysis conducted by Corrao et al. (1998) and Rehm et al.(2010), they included 15 and 17 epidemiological studies, respectively, mainly from the USAand Europe, and assessed the association between alcohol consumption and liver cirrhosis,demonstrating that heavy alcohol consumption significantly increases risk of liver cirrhosis.Corrao et al. also found that the same amount of average alcohol consumption was relatedto a higher risk of liver cirrhosis in women than in men. In the present meta-analysis, weevaluated the association of alcohol consumption with risk of FLD by including the 16observational studies mainly from Asia, especially Japan. Our results, which have beendescribed above, are inconsistent with the findings in the two previous meta-analysis.The different results between our study and the two previous meta-analysis may beexplained in part by the differences in different stages of FLD development, and ethnicityand genetic factors. The two meta-analysis by Corrao et al. and Rehm et al. assessed theassociation of alcohol consumption with frank liver cirrhosis, namely end-stage liverdisease of ALD development, whereas our meta-analysis evaluated the correlation betweenalcohol consumption and risk of the relative early stages of ALD development, namely fattyliver (simple steatosis) and steatohepatitis. On the other hand, Kwon et al. reported thataldehyde dehydrogenase 2 (ALDH2) deficiency can ameliorate alcoholic fatty liver in mice(Kwon et al., 2014). Approximately 40–50% of East Asians carry an inactive ALDH2 gene(ALDH2*2 allele) (Singh et al., 1989), but it is very rarely that ALDH2*2 allele is found inEuropean (Peterson, Goldman & Long, 1999). The above data appear to partly explain thereason why even excessive alcohol consumption also seemed to have a protective effect onFLD in Japanese men.
There were limitations to our meta-analysis that should be considered. The mainlimitation of this study was a small number of included studies and subjects (only 16
Cao et al. (2016), PeerJ, DOI 10.7717/peerj.2633 18/23
studies and 76,608 subjects), so further subgroup analysis were not able to be performaccording to type of alcoholic beverages, frequency of alcohol consumption, duration ofalcohol consumption, study region and age groups. Secondly, this meta-analysis containedonly one cohort study, and the remaining 15 were cross-sectional studies that signify a lowquality, because self-reported data on alcohol consumption in epidemiological studies maynot be reliable. Thirdly, in the 10 Asian studies included, nine were from Japan and onewas from Hong Kong, thus the study coverage in Asian was limited because of absence ofstudies from other Asian countries, especially Chinese Mainland. Moreover, just 6 studiesfrom other countries (USA, Brazil, Argentina and Germany) were included, thus the studycoverage in the world was limited because of absence of studies from Africa and Australia,and a small number of the studies from the USA and Europe. Therefore, the value ofour results is limited for other areas except the countries involved in the study (such asChina, Africa, Australia, most European countries, and so on). Fourthly, because FLD isa multi-factorial disease, it is uncertain whether other factors may have influenced theresults. Fifthly, because early stages of ALD are often asymptomatic, and most of subjectsin the included studies were asymptomatic from health check-up at hospital, therefore theresults of meta-analysis from these studies can’t be effectively broadened so as to representthe population at large. Lastly, potential publication bias might have influence the results,despite no bias indicated from either the funnel plot or Egger’s test.
CONCLUSIONSIn summary, LMAC is associated with a significant protective effect on FLD in the studiedpopulation, especially in the women and obese population. However, the effect of heavyalcohol consumption on FLD remains unclear due to limited studies and small samplesizes.
However, because of the accepted involvement of alcohol consumption, especiallyexcessive drinking in liver disease or cirrhosis, these findings should be treated withcaution. Further better prospective studies are needed to answer the question of whetheralcohol consumption has a diverse effect on FLD in different areas, and whether differentkinds of beverages or drinking patterns have a diverse effect on FLD.
ADDITIONAL INFORMATION AND DECLARATIONS
FundingThe authors received no funding for this work.
Competing InterestsThe authors declare there are no competing interests.
Author Contributions• Guoli Cao performed the experiments, analyzed the data, wrote the paper, preparedfigures and/or tables, reviewed drafts of the paper.
Cao et al. (2016), PeerJ, DOI 10.7717/peerj.2633 19/23
• Tingzhuang Yi and Qianqian Liu performed the experiments, analyzed the data,contributed reagents/materials/analysis tools, reviewed drafts of the paper.• Min Wang contributed reagents/materials/analysis tools, reviewed drafts of the paper.• Shaohui Tang conceived and designed the experiments, wrote the paper, prepared figuresand/or tables, reviewed drafts of the paper.
Data AvailabilityThe following information was supplied regarding data availability:
The raw data has been supplied as Data S1.
Supplemental InformationSupplemental information for this article can be found online at http://dx.doi.org/10.7717/peerj.2633#supplemental-information.
REFERENCESAbd El-Kader SM, EI-Den Ashmawy EM. 2015. Non-alcoholic fatty liver dis-
ease: the diagnosis and management.World Journal of Hepatology 7:846–858DOI 10.4254/wjh.v7.i6.846.
Angulo P, Keach JC, Batts KP, Lindor KD. 1999. Independent predictors of liverfibrosis in patients with nonalcoholic steatohepatitis. Hepatology 30:1356–1362DOI 10.1002/hep.510300604.
Bedogni G, Nobili V, Tiribelli C. 2014. Epidemiology of fatty liver: an update.WorldJournal of Gastroenterology 20:9050–9054 DOI 10.3748/wjg.v20.i27.9050.
Bellentani S, Saccoccio G, Costa G, Tiribelli C, Manenti F, SoddeM, Saveria Crocè L,Sasso F, Pozzato G, Cristianini G, Brandi G. 1997. Drinking habits as cofactors ofrisk for alcohol induced liver damage. Gut 41:845–850 DOI 10.1136/gut.41.6.845.
Bugianesi E, Gastaldelli A, Vanni E, Gambino R, Cassader M, Baldi S, Ponti V, PaganoG, Ferrannini E, Rizzetto M. 2005. Insulin resistance in non-diabetic patients withnon-alcoholic fatty liver disease: sites and mechanisms. Diabetologia 48:634–642DOI 10.1007/s00125-005-1682-x.
Corrao G, Bagnardi V, Zambon A, Torchio P. 1998.Meta-analysis of alcohol in-take in relation to risk of liver cirrhosis. Alcohol and Alcoholism 33:381–392DOI 10.1093/oxfordjournals.alcalc.a008408.
Corrao G, Bagnardi V, Zambon A, La Vecchia C. 2004. A meta-analysis of alco-hol consumption and the risk of 15 diseases. Preventive Medicine 38:613–619DOI 10.1016/j.ypmed.2003.11.027.
CotrimHP, Freitas LA, Alves E, Almeida A, May DS, Caldwell S. 2009. Effects oflight-to-moderate alcohol consumption on steatosis and steatohepatitis in severelyobese patients. European Journal of Gastroenterology and Hepatology 21:969–972DOI 10.1097/MEG.0b013e328328f3ec.
DunnW, Sanyal AJ, Brunt EM, Unalp-Arida A, DonohueM,McCullough AJ, Schwim-mer JB. 2012.Modest alcohol consumption is associated with decreased prevalence
Cao et al. (2016), PeerJ, DOI 10.7717/peerj.2633 20/23
of steatohepatitis in patients with non-alcoholic fatty liver disease (NAFLD). Journalof Hepatology 57:384–391 DOI 10.1016/j.jhep.2012.03.024.
DunnW, Xu R, Schwimmer JB. 2008.Modest wine drinking and decreased preva-lence of suspected nonalcoholic fatty liver disease. Hepatology 47:1947–1954DOI 10.1002/hep.22292.
Gong Y, Feng K, Yan N, Xu Y, Pan CW. 2015. Different amounts of alcohol consump-tion and cataract: a meta-analysis. Optometry and Vision Science 92:471–479DOI 10.1097/OPX.0000000000000558.
Gunji T, Matsuhashi N, Sato H, Fujibayashi K, OkumuraM, Sasabe N, Urabe A. 2009.Light and moderate alcohol consumption significantly reduces the prevalence offatty liver in the Japanese male population. American Journal of Gastroenterology104:2189–2195 DOI 10.1038/ajg.2009.361.
Hamaguchi M, Kojima T, Ohbora A, Takeda N, Fukui M, Kato T. 2012. Protective effectof alcohol consumption for fatty liver but not metabolic syndrome.World Journal ofGastroenterology 18:156–167 DOI 10.3748/wjg.v18.i2.156.
Hashimoto Y, Hamaguchi M, Kojima T, Ohshima Y, Ohbora A, Kato T, Nakamura N,Fukui M. 2015. The modest alcohol consumption reduces the incidence of fatty liverin men: a population-based large-scale cohort study. Journal of Gastroenterology andHepatology 30:546–552 DOI 10.1111/jgh.12786.
Higgins JP, Thompson SG. 2002. Quantifying heterogeneity in a meta-analysis. Statisticsin Medicine 21:1539–1558 DOI 10.1002/sim.1186.
Higgins JP, Thompson SG, Deeks JJ, Altman DG. 2003.Measuring inconsistency inmeta-analyses. British Medical Journal 327:557–560 DOI 10.1136/bmj.327.7414.557.
Hiramine Y, Imamura Y, Uto H, Koriyama C, Horiuchi M, Oketani M, Hosoya-mada K, Kusano K, Ido A, Tsubouchi H. 2011. Alcohol drinking patterns andthe risk of fatty liver in Japanese men. Journal of Gastroenterology 46:519–528DOI 10.1007/s00535-010-0336-z.
Kächele M,Wolff S, KratzerW, Haenle M, Homann J, Trischler G, KoenigW, ImhofA. 2015. Presence of fatty liver and the relationship between alcohol consump-tion and markers of inflammation.Mediators of Inflammation 2015:278785DOI 10.1155/2015/278785.
Knott C, Bell S, Britton A. 2015. Alcohol consumption and the risk of type 2 diabetes:a systematic review and dose-response meta-analysis of more than 1.9 millionindividua. Diabetes Care 38:1804–1812 DOI 10.2337/dc15-0710/-/DC1.
Koppes LL, Dekker JM, Hendriks HF, Bouter LM, Heine RJ. 2005.Moderate alcoholconsumption lowers the risk of type 2 diabetes: a meta-analysis of prospectiveobservational studies. Diabetes Care 28:719–725 DOI 10.2337/diacare.28.3.719.
KwonHJ,Won YS, Park O, Chang B, Duryee MJ, Thiele GE, Matsumoto A, SinghS, AbdelmegeedMA, Song BJ, Kawamoto T, Vasiliou V, Thiele GM, Gao B.2014. Aldehyde dehydrogenase 2 deficiency ameliorates alcoholic fatty liverbut worsens liver inflammation and fibrosis in mice. Hepatology 60:146–157DOI 10.1002/hep.27036.
Cao et al. (2016), PeerJ, DOI 10.7717/peerj.2633 21/23

Larsson SC, Orsini N,Wolk A. 2015. Alcohol consumption and risk of heart failure:a dose–response meta-analysis of prospective studies. European Journal of HeartFailure 17:367–373 DOI 10.1002/ejhf.228.
Lau K, Baumeister SE, LiebW,Meffert PJ, LerchMM,Mayerle J, Völzke H. 2015.The combined effects of alcohol consumption and body mass index on hepaticsteatosis in a general population sample of European men and women. AlimentaryPharmacology and Therapeutics 41:467–476 DOI 10.1111/apt.13067.
Moriya A, Iwasaki Y, Ohguchi S, Kayashima E, Mitsumune T, Ikeda F, AndoM,Yamamoto K. 2013. Roles of alcohol drinking pattern in fatty liver in Japanesewomen. Hepatology International 7:859–868 DOI 10.1007/s12072-013-9449-9.
Moriya A, Iwasaki Y, Ohguchi S, Kayashima E, Mitsumune T, Taniguchi H, AndoM, Yamamoto K. 2015. Roles of alcohol consumption in fatty liver: a longitudinalstudy. Journal of Hepatology 62:921–927 DOI 10.1016/j.jhep.2014.11.025.
Moriya A, Iwasaki Y, Ohguchi S, Kayashima E, Mitsumune T, Taniguchi H, IkedaF, Shiratori Y, Yamamoto K. 2011. Alcohol consumption appears to protectagainst non-alcoholic fatty liver disease. Alimentary Pharmacology and Therapeutics33:378–388 DOI 10.1111/j.1365-2036.2010.04520.x.
Nishioji K, Sumida Y, Kamaguchi M, Mochizuki N, Kobayashi M, Nishimura T, Yam-aguchi K, Itoh Y. 2015. Prevalence of and risk factors for non-alcoholic fatty liverdisease in a non-obese Japanese population, 2011-2012. Journal of Gastroenterology50:95–108 DOI 10.1007/s00535-014-0948-9.
O’Shea RS, Dasarathy S, McCullough AJ. 2010. Alcoholic liver disease. Hepatology51:307–328 DOI 10.1002/hep.23258.
Peterson RJ, Goldman D, Long JC. 1999. Effects of worldwide population subdivision onALDH2 linkage disequilibrium. Genome Research 9:844–852 DOI 10.1101/gr.9.9.844.
Reddy JK, RaoMS. 2006. Lipid metabolism and liver inflammation. II. Fatty liver diseaseand fatty acid oxidation. American Journal of Physiology-Gastrointestinal and LiverPhysiology 290:G852–G858 DOI 10.1152/ajpgi.00521.2005.
Rehm J, Room R, GrahamK,Monteiro M, Gmel G, Sempos CT. 2003. The relationshipof average volume of alcohol consumption and patterns of drinking to burden of dis-ease: an overview. Addiction 98:1209–1228 DOI 10.1046/j.1360-0443.2003.00467.x.
Rehm J, Taylor B, Mohapatra S, Irving H, Baliunas D, Patra J, Roerecke M. 2010.Alcohol as a risk factor for liver cirrhosis: a systematic review and meta-analysis.Drug and Alcohol Review 29:437–445 DOI 10.1111/j.1465-3362.2009.00153.x.
Rimm EB,Williams P, Fosher K, Criqui M, Stampfer MJ. 1999.Moderate alco-hol intake and lower risk of coronary heart disease: meta-analysis of effectson lipids and haemostatic factors. British Medical Journal 319:1523–1528DOI 10.1136/bmj.319.7224.1523.
Ronksley PE, Brien SE, Turner BJ, Mukamal KJ, Ghali WA. 2011. Association of alcoholconsumption with selected cardiovascular disease outcomes: a systematic review andmeta-analysis. British Medical Journal 342:1–13 DOI 10.1136/bmj.d671.
Rostom A, Dube C, Cranney A, Saloojee N, Sy R, Garritty C, SampsonM, Zhang L,Yazdi F, Mamaladze V, Pan I, McNeil J, Moher D, Mack D, Patel D. 2004. Celiac
Cao et al. (2016), PeerJ, DOI 10.7717/peerj.2633 22/23
Disease. Evidence reports/technology assessments, No.104. Agency for HealthcareResearch and Quality, Rockville. Available at http://www.ncbi.nlm.nih.gov/books/NBK35156 (accessed on 15 April 2016).
Singh S, Fritze G, Fang BL, Harada S, Paik YK, Eckey R, Agarwal DP, Goedde HW.1989. Inheritance of mitochondrial aldehyde dehydrogenase: genotyping in Chinese,Japanese and South Korean families reveals dominance of the mutant allele. HumanGenetics 83:119–121 DOI 10.1007/BF00286702.
SogabeM, Okahisa T, Taniguchi T, Tomonari T, Tanaka T, Tanaka H, NakasonoM, Takayama T. 2015. Light alcohol consumption plays a protective role againstnon-alcoholic fatty liver disease in Japanese men with metabolic syndrome. LiverInternational 35:1707–1714 DOI 10.1111/liv.12754.
Sookoian S, Castaño GO, Pirola CJ. 2014.Modest alcohol consumption decreases therisk of non-alcoholic fatty liver disease: a meta-analysis of 43175 individuals. Gut63:530–532 DOI 10.1136/gutjnl-2013-305718.
Torruellas C, French SW,Medici V. 2014. Diagnosis of alcoholic liver disease.WorldJournal of Gastroenterology 20:11684–11699 DOI 10.3748/wjg.v20.i33.11684.
Wells GA, Shea B, O’Connell D, Peterson D,Welch V, Losos M, Tugwell P. 2011. TheNewcastel-Ottawa Scale (NOS) for assessing the quality of nonrandomised studies inmeta-analyses. Ottawa Hospital Research Institute. Available at http://www.ohri.ca/programs/ clinical_epidemiology/oxford.asp (accessed on 15 April 2016).
WHO. 2000. International guide for monitoring alcohol consumption and related harm.Geneva: World Health Organization.
Wong VW, ChuWC,Wong GL, Chan RS, Chim AM, Ong A, Yeung DK, Yiu KK, ChuSH,Woo J, Chan FK, Chan HL. 2012. Prevalence of non-alcoholic fatty liver diseaseand advanced fibrosis in Hong Kong Chinese: a population study using proton-magnetic resonance spectroscopy and transient elastography. Gut 61:409–415DOI 10.1136/gutjnl-2011-300342.
Yamada T, FukatsuM, Suzuki S, Yoshida T, Tokudome S, Joh T. 2010. Alcohol drinkingmay not be a major risk factor for fatty liver in japanese undergoing a healthcheckup. Digestive Diseases and Sciences 55:176–182 DOI 10.1007/s10620-008-0693-0.
YouM, Crabb DW. 2004. Recent advances in alcoholic liver disease II. Minireview:molecular mechanisms of alcoholic fatty liver. American Journal of Physiology-gastrointestinal and Liver Physiology 287:G1–G6 DOI 10.1152/ajpgi.00056.2004.
Cao et al. (2016), PeerJ, DOI 10.7717/peerj.2633 23/23