Embed Size (px)
Citation preview

THE IMPACT OF LANGUAGE ON PERSONALITY ASSESSMENT WITH THE BASIC TRAITS
INVENTORY
by
SONJA GROBLER
submitted in accordance with the requirements for the degree
DOCTOR OF COMMERCE
in the subject
INDUSTRIAL AND ORGANISATIONAL PSYCHOLOGY
at the
UNIVERSITY OF SOUTH AFRICA
Supervisor: Prof. Marié de Beer
Jan 2014

i
DECLARATION
Student number: 0774-647-4
I, Sonja Grobler, declare that
THE IMPACT OF LANGUAGE ON PERSONALITY ASSESSMENT WITH THE BASIC TRAITS
INVENTORY
is my own work and that all the sources that I have used or quoted have been indicated
and acknowledged by means of complete references.
_____________ ____________ S GROBLER DATE (Mrs)

ii
ACKNOWLEDGEMENTS
I would like to wholeheartedly thank the following people who have helped me to make
this dissertation possible:
• The Lord, my God for this opportunity and His guidance and grace throughout this
project.
• My husband, Anton for encouraging me and believing in me.
• My two beautiful daughters, Anja and Tiana for their faith in me and their
unconditional love.
• My father and mother, Nico and Yvonne for providing me with the necessary life skills
to achieve my goals.
• My in-laws, Johan and Martie for their encouragement and their support of me.
• My supervisor Prof. Marié de Beer for her expert guidance, patience, friendship and
for her confidence in my ability.
• Prof. Deon Meiring for his inspiration and assistance with literature.
• Dr Nicola Taylor at Jopie van Rooyen and Partners for all the ideas and advice.
• The South African Police Service for granting permission to use the data.
• Unisa for the bursary and the opportunity to further my qualifications.

iii
SUMMARY
Personality psychology became an identifiable discipline in the social sciences in the 1930s
when Allport (1937) published an article on the psychological interpretation of personality.
The field of personality traditionally emphasised the study of the whole person, the dynamics
of human motivation and the identification and measurement of individual differences
(McAdams, 1997). Since the publication of Allport’s article, personality has been extensively
researched and several theories exist that attempt to organise and explain the differences in
human behaviour.
Personality instruments are based on personality theories and aim to assist psychologists
with the prediction of human behaviour. Psychologists use personality instruments as part of
a selection battery to assist organisations with the screening and selection of individuals who
have the potential to be successful within a specific work environment.
The Basic Traits Inventory (BTI), a personality instrument that is based on the Five-Factor
model, was developed in South Africa by Taylor and De Bruin (2006). The BTI is a valid and
reliable personality instrument as indicated by results from research by Taylor (2004), Taylor
and De Bruin (2006) and Taylor (2008) on its utility within the multicultural and
multilingual environment of South Africa. Taylor (2008) nevertheless identified some
problematic items when she analysed the construct, item, and response bias of the BTI
across cultures for three language groups – Afrikaans, English and indigenous African
languages – and consequently indicated the need for further research in this regard.
The current study therefore explores the possible bias of the items of the BTI, and uses a
sample large enough to analyse each of the eleven of the official languages of South
Africa separately. The study focuses on the impact of the eleven official languages of South
Africa on assessment of the Big Five personality factors with the BTI.
The actual sample consisted of 105 342 respondents, resulting in the sub-samples per
official language group being larger than 1 000. Each of the eleven official South African

iv
language groups could therefore be analysed separately, which has not been possible in
previous studies.
Analysis of the responses of the total sample to the BTI items generally yielded high
reliability in terms of Cronbach alpha coefficients (α) and the Person Separation Index
(PSI). The results were reported as follows: Extraversion (α=.86; PSI=.85); Neuroticism
(α=.89; PSI=.86); Conscientiousness (α=.93; PSI=.88); Openness to experience (α=.90;
PSI=.84); Agreeableness (α=.94; PSI=.86); and Social desirability (α=.72; PSI=.70).
MANOVA results indicated statistically significant differences between the mean values of
each of the BTI factors for the different language groups. Rasch analysis methods were
used to further analyse the differences in terms of item responses for each of the eleven
official language groups in South Africa.
Respondents generally interpret and endorse the items of a personality instrument according
to their intrinsic personality characteristics and their interpretation of the words used in the
items of the personality instrument. In order to assess the respondents’ understanding of the
administration language, English, two English proficiency tests were administered together
with the BTI. The combined English proficiency scores were used to differentiate between
respondents who understood English very well (top 25% – high English proficiency group)
and those who struggled to understand English terminology (bottom 25% – low English
proficiency group).
Rasch analysis techniques were used to analyse the data for the whole sample as well as
for the high and low English proficiency groups. Some items showed statistically
significant differences for the language groups, indicating item bias in the BTI. Contrary to
expectation, a larger number of biased items were indicated for the higher English
proficiency group than for the total group or for the low English proficiency group. Due to
the number of biased items for the high English proficiency group, it was concluded that
the differences between the eleven official language groups may be a result of the
differences in the intrinsic personality characteristics of the respondents, rather than

v
measurement errors or item bias of the BTI instrument. Further research in this regard
was recommended.
The current study confirms that home language and English proficiency, as indicators of
the level of understanding of the language in which the personality instrument was
administered, undeniably influence the individual’s response pattern. Far fewer items
indicated bias than those identified in Taylor’s (2008) study, where a smaller sample was
used and language groups were combined. Despite some BTI items showing bias, the
conclusion was reached that this personality instrument can be used with confidence to
assess personality traits in persons speaking any of the eleven official South African
languages.
vi
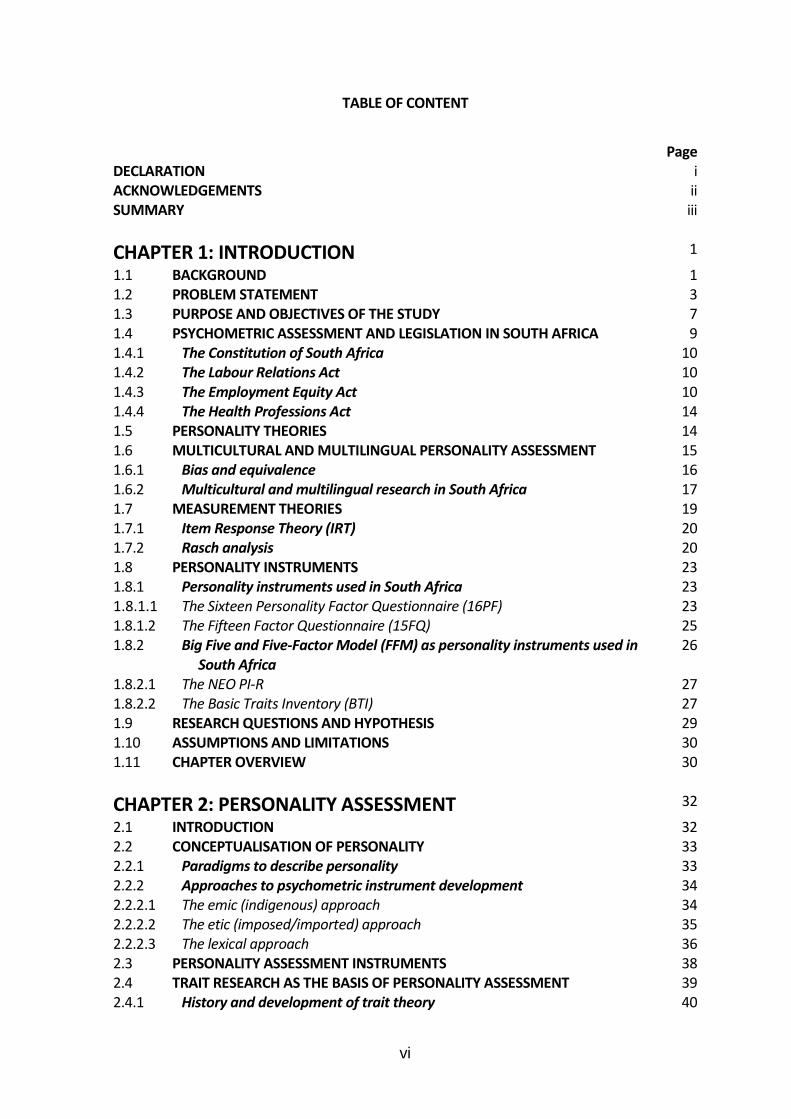
TABLE OF CONTENT
Page
DECLARATION i ACKNOWLEDGEMENTS ii SUMMARY iii
CHAPTER 1: INTRODUCTION 1
1.1 BACKGROUND 1 1.2 PROBLEM STATEMENT 3 1.3 PURPOSE AND OBJECTIVES OF THE STUDY 7 1.4 PSYCHOMETRIC ASSESSMENT AND LEGISLATION IN SOUTH AFRICA 9 1.4.1 The Constitution of South Africa 10 1.4.2 The Labour Relations Act 10 1.4.3 The Employment Equity Act 10 1.4.4 The Health Professions Act 14 1.5 PERSONALITY THEORIES 14 1.6 MULTICULTURAL AND MULTILINGUAL PERSONALITY ASSESSMENT 15 1.6.1 Bias and equivalence 16 1.6.2 Multicultural and multilingual research in South Africa 17 1.7 MEASUREMENT THEORIES 19 1.7.1 Item Response Theory (IRT) 20 1.7.2 Rasch analysis 20 1.8 PERSONALITY INSTRUMENTS 23 1.8.1 Personality instruments used in South Africa 23 1.8.1.1 The Sixteen Personality Factor Questionnaire (16PF) 23 1.8.1.2 The Fifteen Factor Questionnaire (15FQ) 25 1.8.2 Big Five and Five-Factor Model (FFM) as personality instruments used in
South Africa 26
1.8.2.1 The NEO PI-R 27 1.8.2.2 The Basic Traits Inventory (BTI) 27 1.9 RESEARCH QUESTIONS AND HYPOTHESIS 29 1.10 ASSUMPTIONS AND LIMITATIONS 30 1.11 CHAPTER OVERVIEW 30 CHAPTER 2: PERSONALITY ASSESSMENT 32
2.1 INTRODUCTION 32 2.2 CONCEPTUALISATION OF PERSONALITY 33 2.2.1 Paradigms to describe personality 33 2.2.2 Approaches to psychometric instrument development 34 2.2.2.1 The emic (indigenous) approach 34 2.2.2.2 The etic (imposed/imported) approach 35 2.2.2.3 The lexical approach 36 2.3 PERSONALITY ASSESSMENT INSTRUMENTS 38 2.4 TRAIT RESEARCH AS THE BASIS OF PERSONALITY ASSESSMENT 39 2.4.1 History and development of trait theory 40

vii
2.4.1.1 First stage – Early trait theories 40 a. Allport and Odbert (1936) 40 b. Cattell (1943) 41 2.4.1.2 Second stage theories – discovering the Big Five personality traits 42 a. Fiske (1949) 42 b. Tupes and Christal (1961) 43 c. Norman (1963) 43 d. Goldberg (1990) 44 2.4.1.3 Third stage – development of the Five Factor Model of Personality 45 2.4.2 Further development of the Big Five and Five Factor Model (FFM) 46 2.4.2.1 Defining the factors 47 2.4.2.2 Comparability between the Big Five and the FFM 47 2.4.3 Limitations of the Big Five and FFM 48 2.4.3.1 Theoretical limitations of the Big Five theory 49 2.4.3.2 Factor analysis limitations 49 2.4.3.3 The number of factors 50 2.4.3.4 Completeness of the Big Five as trait taxonomy 51 2.4.3.5 Limitations in predicting life outcomes 52 2.4.3.6 The Big Five derived from a natural language perspective 53 2.5 RESEARCH ON PERSONALITY INSTRUMENTS 54 2.5.1 General personality instruments (non-Big Five and non-FFM) 54 2.5.1.1 The 16PF 54 2.5.1.2 The 15FQ+ 58 2.5.2 Big Five and FFM personality instruments 59 2.5.2.1 Comrey Personality Scales (CPS) 61 2.5.2.2 The NEO Personality Inventory – Revised (NEO PI-R) 62 2.6 PERSONALITY INSTRUMENTS DEVELOPED IN SOUTH AFRICA 64 2.6.1 The South African Personality Questionnaire (SAPQ) 64 2.6.2 The Basic Traits Inventory (BTI) 66 2.7 SUMMARY 69 CHAPTER 3: THE IMPACT OF LANGUAGE ON PERSONALITY ASSESSMENT
70
3.1 INTRODUCTION 70 3.2 RESEARCH ON THE IMPACT OF LANGUAGE ON PERSONALITY
ASSESSMENT 70
3.3 OFFICIAL LANGUAGES IN SOUTH AFRICA 77 3.4 LANGUAGE PROFICIENCY AND PERSONALITY ASSESSMENT 79 3.5 PROPOSED SOLUTIONS FOR MULTICULTURAL AND MULTILINGUAL
CHALLENGES IN PERSONALITY ASSESSMENT 83
3.5.1 Multi-language personality norms 84 3.5.1.1 Sample differences 84 3.5.1.2 Cultural differences 85 3.5.1.3 Translation differences 85 3.6 TRANSLATION 86 3.6.1 Translation of the 16PF (5th edition) 87 3.6.2 Translation of the NEO PI-R 88

viii
3.6.3 Translation of the Big Five and FFM personality instruments 89 3.7 CROSS CULTURAL PERSONALITY RESEARCH 90 3.7.1 Trends in language research of general (non-Big Five and non-FFM)
personality instruments 91
3.7.2 Trends in language research of Big Five and FFM personality instruments 93 3.8 PERSONALITY RELATED PERSPECTIVES WITHIN CULTURES 97 3.8.1 Collectivism versus individualism 97 3.9 LANGUAGE AND THE DEVELOPMENT OF THE BTI 99 3.10 SUMMARY 100 CHAPTER 4: METHODOLOGY 101
4.1 INTRODUCTION 101 4.2 PSYCHOMETRIC INSTRUMENTS 103 4.2.1 Instruments for measuring English proficiency 103 4.2.1.1 Reading comprehension 104 4.2.1.2 Verbal reasoning 105 4.2.2 Basic Traits Inventory (BTI) for measuring personality 106 4.3 THE SAMPLE 108 4.4 RESEARCH DESIGN 111 4.5 THEORETICAL BASIS FOR MEASUREMENT 111 4.5.1 Classical test theory (CTT) 112 4.5.2 Modern test theory (MTT) 113 4.6 COMPARISON OF MEASUREMENT THEORIES 113 4.7 DATA ANALYSIS TECHNIQUES 116 4.8 STATISTICAL ANALYSIS 116 4.8.1 Descriptive statistics 116 4.8.2 Multivariate analysis – MANOVA 117 4.8.3 MTT methods 118 4.8.3.1 Fit indices 119 4.8.3.2 Internal consistency reliability 120 4.8.3.3 Differential item functioning (DIF) 121 4.9 POSTULATES 121 4.9.1 Item bias 122 4.10 SUMMARY 123 CHAPTER 5: RESULTS 124
5.1 INTRODUCTION 124 5.2 DESCRIPTIVE STATISTICS 124 5.3 TEST FOR NORMALITY 126 5.4 INTERNAL CONSISTENCY RELIABILITY 127 5.5 EFFECT SIZES IN CROSS-CULTURAL RESEARCH 130 5.6 MULTIVARIATE ANALYSIS (MANOVA) 131 5.7 PROFILE PLOTS 138 5.7.1 Extraversion 139 5.7.2 Neuroticism 141 5.7.3 Conscientiousness 143 5.7.4 Openness to experience 145

ix
5.7.5 Agreeableness 147 5.7.6 Social desirability 149 5.8 RASCH ANALYSIS 152 5.8.1 Local independence (variance) 152 5.8.2 Unidimensionality 153 5.8.3 Item location parameters 153 5.8.3.1 Rasch person-item map 153 5.8.3.2 Fit indices 155 5.8.4 Differential item functioning (DIF) 158 5.8.4.1 DIF – lower performers on English proficiency (bottom 25%) 173 5.8.4.2 DIF – higher performers on English proficiency (top 25%) 173 5.9 SUMMARY 179 CHAPTER 6: DISCUSSION AND CONCLUSION 182
6.1 INTRODUCTION 182 6.2 RELIABILITY 184 6.3 MULTIVARIATE ANALYSIS (MANOVA) 185 6.4 RASCH ASSUMPTIONS 188 6.4.1 Local independence 189 6.4.2 Dimensionality 189 6.5 FIT INDICES 189 6.6 DIFFERENTIAL ITEM FUNCTIONING (DIF) 190 6.7 IMPLICATIONS OF THE RESULTS 192 6.8 LIMITATIONS 194 6.9 PRACTICAL AND THEORETICAL CONTRIBUTION 195 6.10 RECOMMENDATIONS 196 6.11 CONCLUSION 198 REFERENCES 200

x
LIST OF TABLES
Table 3.1 The Official Languages of South Africa 77 Table 4.1 Demographic Composition of the Sample 109 Table 4.2 Language Distribution 110 Table 4.3 ‘Rules’ of Measurement 115 Table 5.1 Descriptive Statistics - Total Sample (N=105 342) 125 Table 5.2 Distribution – Normality 126 Table 5.3 Cronbach Alpha Coefficients and PSI for Psychometric Instruments
(N=105 342) 128
Table 5.4 Cronbach Alpha Coefficients and PSI of BTI Factors for South African Languages
129
Table 5.5 Multivariate Analysis – MANOVA (Wilks’ Lambda) 131 Table 5.6 Extraversion – Statistically Significant Mean Differences between
Languages 132
Table 5.7 Neuroticism – Statistically Significant Mean Differences between Languages
133
Table 5.8 Conscientiousness – Statistically Significant Mean Differences between Languages
134
Table 5.9 Openness to Experience – Statistically Significant Mean Differences between Languages
135
Table 5.10 Agreeableness – Statistically Significant Mean Differences between Languages
136
Table 5.11 Social Desirability – Statistically Significant Mean Differences between Languages
137
Table 5.12 Extraversion – Statistically Significant Mean Differences between Languages per English Proficiency Groups
141
Table 5.13 Neuroticism – Statistically Significant Mean Differences between Languages per English Proficiency Groups
143
Table 5.14 Conscientiousness – Statistically Significant Mean Differences between Languages per English proficiency groups
145
Table 5.15 Openness to Experience – Statistically Significant Mean Differences between Languages per English Proficiency Groups
147
Table 5.16 Agreeableness – Statistically Significant Mean Differences between Languages per English Proficiency Groups
149
Table 5.17 Social Desirability – Statistically Significant Mean Differences between Languages per English proficiency Groups
151
Table 5.18 Correlations of Residuals (Local Independence) 152 Table 5.19 Infit MNSQ - Item Location Parameters (MNSQ>1.4 and/or
MNSQ<.6) 156
Table 5.20 Infit MNSQ - Lower Performers (Bottom 25%) on English Proficiency 157 Table 5.21 Infit MNSQ - Higher Performers (Top 25%) on English Proficiency
(MNSQ>1.4 and/or MNSQ<.6) 157
Table 5.22 Extraversion - DIF Contrast Values for ENGLISH (N=2 261) 159 Table 5.23 Neuroticism - DIF Contrast Values for ENGLISH (N=2 261) 160 Table 5.24 Conscientiousness - DIF Contrast Values for ENGLISH (N=2 261) 161 Table 5.25 Openness to Experience - DIF Contrast Values for ENGLISH (N=2 261) 162

xi
Table 5.26 Agreeableness - DIF Contrast Values for ENGLISH (N=2 261) 164 Table 5.27 Social Desirability - DIF Contrast Values for ENGLISH (N=2 261) 165 Table 5.28 Extraversion - DIF Contrast Values for AFRIKAANS (N=6 786) 165 Table 5.29 Neuroticism - DIF Contrast Values for AFRIKAANS (N=6 786) 166 Table 5.30 Conscientiousness - DIF contrast values for AFRIKAANS (N=6 786) 168 Table 5.31 Openness to Experience - DIF Contrast Values for AFRIKAANS (N=6 786) 169 Table 5.32 Agreeableness - DIF Contrast Values for AFRIKAANS (N=6 786) 170 Table 5.33 Social Desirability - DIF Contrast Values for AFRIKAANS (N=6 786) 171 Table 5.34 DIF Contrast Values for AFRICAN LANGUAGES (N=96 295) 172 Table 5.35 DIF Contrast Values for AFRIKAANS – Low Performers (Bottom 25%) on
English Proficiency 173
Table 5.36 DIF Contrast Values for ENGLISH – High Performers (Top 25%) on English Proficiency
174
Table 5.37 DIF Contrast Values for AFRIKAANS – High Performers (Top 25%) on English Proficiency
176
Table 5.38 DIF Contrast Values amongst AFRICAN LANGUAGES Separately – High Performers (Top 25%) on English Proficiency
177
Table 5.39 Summary of Items Indicating DIF per Language 177 Table 5.40 Summary of Items Indicating DIF per BTI Factor 178
LIST OF FIGURES
Figure 5.1 Estimated Marginal Means: EXTRAVERSION 140 Figure 5.2 Estimated Marginal Means: NEUROTICISM 142 Figure 5.3 Estimated Marginal Means: CONSCIENTIOUSNESS 144 Figure 5.4 Estimated Marginal Means: OPENNESS TO EXPERIENCE 146 Figure 5.5 Estimated Marginal Means: AGREEABLENESS 148 Figure 5.6 Estimated Marginal Means: SOCIAL DESIRABILITY 150 Figure 5.7 Person-Item Map for BTI Items per Factor
154
APPENDICES
Appendix A: Mean Differences between the Official Language Groups 235 Appendix B: Mean Differences between the Levels of English Proficiency 258

1
CHAPTER 1: INTRODUCTION
1.1 BACKGROUND
Various psychologists such as Allport, Cattell, Rogers, Jung and Maslow were intrigued by
the reasons for differences in human behaviour and the identification of such differences
(Ewen, 2010). Even though Pervin and John (1997) concluded that all people are similar in
some way, behavioural psychologists are more concerned with the way in which people differ
and the reasons for these differences. Studies of behavioural differences can be traced as far
back as 600 BC (Hogan & Sussner, 2001). Together with the psychologists mentioned above,
researchers like Adler, Freud and Sullivan tried to explain and capture by means of theories
the complexity of human behaviour and the reasons why people differ, especially in terms of
personality. Even though personality theories that explain these differences in human
behaviour have become more complex, the basic underlying question remains the same:
Why do people act the way they do (Pervin & John, 1997)? Although many theories of
personality exist, one theory should not be seen as superior to the rest and an integration of
the best qualities from different theories should provide a more integrated logical description
of personality as a whole and make human behaviour more understandible (Pervin & John,
1997). Ewen (2010) explained that the understanding and use of constructs from different
theories can be useful and that a more flexible approach to personality theories can assist
psychologists to unravel the mysteries of human behaviour.
Human behaviour is largely determined by personality characteristics (Pervin & John, 1997),
which refer to important, relatively stable and long-lasting aspects that have a strong
influence on human behaviour (Ewen, 2010). According to Patel (2006) it is evident from the
many theories and personality instruments available that no final agreement has been
reached on the identification or measurement of personality characteristics that give rise to
differences in human behaviour. Patel (2006) also indicated that each of the personality
theories and instruments come with its own set of strengths and weaknesses and that none
of them should be classified as being better than another.

2
Integrating the best qualities of each theory with the personality instrument with the most
strengths can assist psychologists in capturing the uniqueness of personality characteristics
more accurately (Johnson, 1997).
In an attempt to measure personality characteristics in the work environment, industrial
psychologists use inter alia personality instruments to assess personality characteristics and
attempt to predict work-related behaviour from these personality characteristics (Ewen,
2010). Career choices and other potentially life-changing decisions (e.g. in respect of selection
and/or promotion decisions; career guidance and counselling; therapeutic interventions
and/or diagnoses) (Huysamen, 2002; Van der Merwe & Maritz, 2002) are often based on
the results of personality instruments. Hence such instruments should provide the
respondents with a fair chance to articulate their personality, and the personality instrument
should provide an accurate reflection of the respondents’ personality profile (Ewen, 2010).
Personality assessment in South Africa is complex as the country has a unique environment in
terms of its many different cultures and eleven official languages. Various personality
instruments (mostly imported and adapted for local use – referred to as the epic approach)
are being used in the local working environment, but surprisingly, the diversity due to eleven
official languages is not always kept in mind (Van de Vijver & Rothmann, 2004). The language
diversity of South Africa is also not always accommodated in the development or research of
psychometric instruments (Van de Vijver & Rothmann, 2004).
From the relevant literature and research findings it is evident that the situation in South
Africa is unique and multifaceted (Meiring, 2007). It is far more complicated than merely
identifying the most comprehensive personality theory and identifying the most appropriate
personality instrument to accurately measure the personality characteristics to predict work
behaviour (Meiring, 2007) . Approximately 25 different languages are spoken in South Africa,
of which eleven have been granted official status in terms of Section 6 of the Constitution
(Government Gazette, 1996) on the grounds that their users constitute about 98% of the
total population.

3
Psychologists in South Africa are therefore faced with the challenge of not only assessing
individuals speaking various of the eleven official languages, but also identifying the most
appropriate personality instrument. In addition to the validity and reliability research
normally done on a personality instrument, the possibility of bias with regard to different
language groups also has to be investigated. The language in which a psychometric
instrument is administered has a definite impact on the understanding by the respondent of
what the item means and consequently on the respondents’ answers, especially when the
instrument has to be completed in a language that is not the individual’s home language
(Meiring, 2007).
For the purpose of the current study, a distinction was made between two broad categories
of personality instruments, namely a general category (16PF, 16PF (SA92), 16PF5, 15FQ,
15FQ+ and SAPQ) and a category for personality instruments based on the Big Five theory
and Five-Factor Model (FFM) (Comrey, NEO PI-R, BTI). The NEO PI-R will be discussed
extensively as an instrument developed and used internationally, as it was the basis for the
development of the BTI, which will be discussed as an instrument developed and used locally.
Both these personality instruments are based on the Big Five and FFM theory.
The Basic Traits Inventory (BTI) (Taylor & De Bruin, 2006) that was used in the current
study was developed in an attempt to increase the availability of locally developed and
validated personality instruments. The current study also included language proficiency
tests to identify the respondents’ understanding of the assessment language, which was
English. The current study endeavoured to promote insight into and identify the impact
that home language and English language proficiency have on the assessment of
personality with the BTI for all eleven official language groups of South Africa.
1.2 PROBLEM STATEMENT
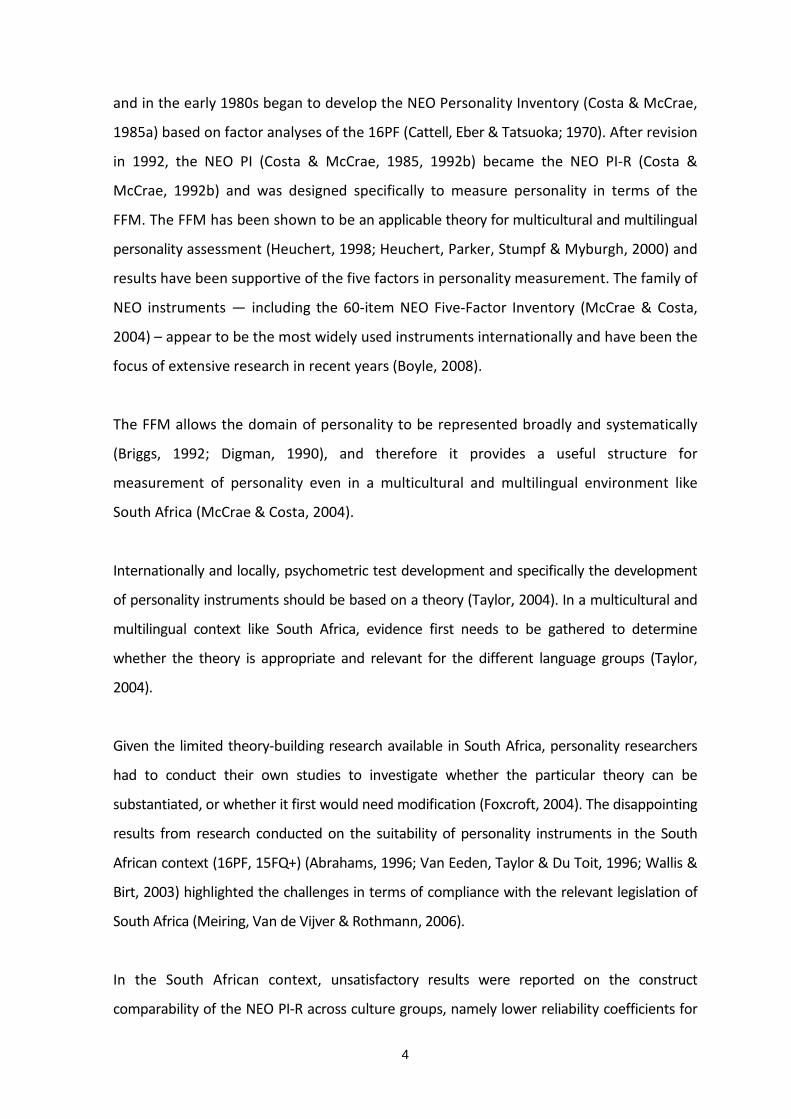
The Neo-Personality Inventory Revised (NEO PI-R) (Costa & McCrae, 1992b) measures the
Big Five personality factors, namely Extraversion (E), Neuroticism (N), Conscientiousness
(C), Openness to experience (O) and Agreeableness (A). McCrae and Costa (1985a, 1985b,
1985c) generated a vast amount of research in respect of the Five-Factor Model (FFM)
4
and in the early 1980s began to develop the NEO Personality Inventory (Costa & McCrae,
1985a) based on factor analyses of the 16PF (Cattell, Eber & Tatsuoka; 1970). After revision
in 1992, the NEO PI (Costa & McCrae, 1985, 1992b) became the NEO PI-R (Costa &
McCrae, 1992b) and was designed specifically to measure personality in terms of the
FFM. The FFM has been shown to be an applicable theory for multicultural and multilingual
personality assessment (Heuchert, 1998; Heuchert, Parker, Stumpf & Myburgh, 2000) and
results have been supportive of the five factors in personality measurement. The family of
NEO instruments — including the 60-item NEO Five-Factor Inventory (McCrae & Costa,
2004) – appear to be the most widely used instruments internationally and have been the
focus of extensive research in recent years (Boyle, 2008).
The FFM allows the domain of personality to be represented broadly and systematically
(Briggs, 1992; Digman, 1990), and therefore it provides a useful structure for
measurement of personality even in a multicultural and multilingual environment like
South Africa (McCrae & Costa, 2004).
Internationally and locally, psychometric test development and specifically the development
of personality instruments should be based on a theory (Taylor, 2004). In a multicultural and
multilingual context like South Africa, evidence first needs to be gathered to determine
whether the theory is appropriate and relevant for the different language groups (Taylor,
2004).
Given the limited theory-building research available in South Africa, personality researchers
had to conduct their own studies to investigate whether the particular theory can be
substantiated, or whether it first would need modification (Foxcroft, 2004). The disappointing
results from research conducted on the suitability of personality instruments in the South
African context (16PF, 15FQ+) (Abrahams, 1996; Van Eeden, Taylor & Du Toit, 1996; Wallis &
Birt, 2003) highlighted the challenges in terms of compliance with the relevant legislation of
South Africa (Meiring, Van de Vijver & Rothmann, 2006).
In the South African context, unsatisfactory results were reported on the construct
comparability of the NEO PI-R across culture groups, namely lower reliability coefficients for

5
samples from the black population (Taylor, 2000). Even though the FFM structure did not
emerge for the black sample, Taylor (2000) proposed that it could be due to the instrument’s
difficult wording, rather than to the lack of transferability of the Big Five factors of personality
in South Africa. This confirms the relevance of checking English proficiency in the current
study.
Theron (2007) highlighted that psychologists can avoid measurement bias through the careful
selection of instruments but unfair discrimination cannot be avoided only through the use of
reliable, valid and unbiased instruments. The effect of group membership methodically also
impacts on the parameters measured in personality instruments and therefore all variables
should be considered and negative impacts limited to ensure fair discrimination (Theron,
2007).
The need for an instrument that would be tailored to the unique South African context led to
the development of the BTI (Taylor & De Bruin, 2006). Taylor (2004) confirmed the FFM as a
suitable model for South Africa, and Taylor and De Bruin (2006) therefore based their
development of the Basic Traits Inventory (BTI) on the FFM personality theory. The
Inventory was developed to address the specific and unique features of the South African
population and aimed at measuring personality more effectively in the South African context
with its many indigenous languages (Taylor & De Bruin, 2006). Taylor and De Bruin (2006)
developed and researched the BTI extensively to ensure that the instrument was reliable and
valid and to ensure that it could be applied fairly to all South Africans as prescribed by the
Employment Equity Act (Government Gazette, 1998). (The relevant South African legislation
will be discussed later in this Chapter.)
Previous research on imported instruments (etic approach) indicated problematic and/or
inaccurate measurement of personality characteristics for South African samples (Abrahams
& Mauer, 1999a, 1999b; Foxcroft, 2004; Moyo & Theron, 2011; Meiring et al., 2006; Taylor,
2000). The apparent inaccurate measurement of personality with imported personality
instruments in the multicultural context of South Africa will be discussed in Chapter 2.

6
Taylor (2004) investigated the construct comparability of the Big Five model and FFM for
South African students using the BTI as a locally developed South African personality
instrument. In terms of the reliability of the five factors of the BTI, Taylor (2004) reported
Cronbach alpha coefficients above .88 for the different sub-dimensions for the total group.
The alpha coefficients reported for the race groups were all above .80, for the gender groups
above .85 and for the limited available language groups above .83. Satisfactory internal
consistency reliabilities were reported as above .8 (Fan, 1998) and therefore the internal
consistency reliabilities of the BTI are considered satisfactory, since values above .80 are
generally indicated as acceptable (Kaplan & Saccuzzo, 2001).
Taylor (2004) further found that the results of the factor analysis of the BTI demonstrated a
satisfactory fit with the theoretical Five-Factor Model for the total group, as well as for the
available race groups (black and white), gender groups (male and female) and language
groups (English, Afrikaans and indigenous African). The five factors that were extracted in the
factor analysis were identifiable as the five factors expected from the FFM theory. The results
in terms of the factor congruence indicated a relatively stable five-factor structure for the BTI
(Taylor & De Bruin, 2006).
Further research showed that all five factors manifested similarly (shared the same meaning)
across the black and white ethnic groups, with Tucker’s phi coefficients for the BTI factors
ranging between .95 and .98 (Taylor & De Bruin, 2004). Since Tucker’s phi is used as the
coefficient of agreement or congruence to investigate the factorial agreement between
different groups, it was used to investigate the factorial similarity of groups. A value of .95 or
above indicates factorial similarity, and values below .90 indicate incongruencies in the factor
structures of the two groups that are being compared (Van de Vijver & Leung, 1997).
However, due to the small size of the black group (n=114) and the indigenous African
language group (n=73), Taylor (2004) recommended that more research should be done with
larger samples in order to verify the structure and the psychometric properties of the BTI.
Suggestions for future research included replication of the analyses conducted, but with a
larger, more representative sample (Taylor, 2004), which is addressed in the current study.

7
The emphasis in the development of a personality instrument should be on the validity and
applicability of the theory, especially in a multicultural and multilingual environment (De
Bruin, Schepers & Taylor, 2005). Comparisons with the 16PF (Fifth Edition) provided
statistically significant evidence for the construct validity of the BTI (De Bruin et al., 2005).
Taylor (2008) found that, statistically, the BTI performs well in terms of little or no construct,
item and response bias for the sample of students used in her study. Using the Rasch analysis
model, Taylor (2008) further investigated the bias in terms of gender (men versus women),
ethnicity (black versus white students) and language groups (English, Afrikaans and
indigenous African languages). She found good support for the transportability of the Big Five
personality constructs in the South African context, as well as support for the use of the BTI
across the different subgroups.
Research by Taylor (2008) indicated that the BTI can be used in South Africa as a reliable
instrument to measure the Big Five personality factors. She clearly identified a need for a
larger and more representative sample, which led to the current study being done with a
large sample that includes enough members in each of the eleven official language groups to
analyse each language group separately and to compare response patterns across all eleven
official language groups.
1.3 PURPOSE AND OBJECTIVES OF THE STUDY
Internationally, psychologists use personality instruments in the work environment to
measure personality characteristics and to predict work-related behaviour based on these
characteristics (Ewen, 2010). Individuals furthermore make career and other life-changing
decisions based on these results and predictions (Huysamen, 2002; Van der Merwe &
Maritz, 2002) and therefore personality instruments need to be properly researched in
terms of reliability and validity.
The NEO PI-R has been shown through various research studies to be a valid and reliable
personality instrument internationally (Costa & McCrae, 1992b; Marshall, De Fruyt, Rolland &
Bagby, 2005).

8
Personality assessment in South Africa is mainly conducted with imported instruments from
Europe and the USA and these instruments are often administered without being adapted for
local use or having been thoroughly researched before use (Meiring, Van de Vijver, Rothman
& Barrick, 2005). This creates various challenges with regard to potential bias and possible
non-equivalence of the personality instruments, as shown in various previous studies
(Abrahams & Mauer, 1999a, 1999b; Foxcroft, 2004; Taylor, 2000; Meiring et al., 2005;
Meiring et al., 2006). Constricted sample sizes and the scarcity of large representative
samples that include all eleven official languages of South Africa have generally hampered
meaningful research with regard to the impact of language on personality profiles.
In view of the implications of the Employment Equity Act (Government Gazette, 1998),
further studies need to be conducted on the comparability of the results of different
indigenous groups (Van de Vijver & Rothmann, 2004), especially in terms of the comparison
of psychometric properties of personality instruments for the different language groups.
The BTI was used in the current study and although extensive research has been conducted
on the BTI as a South African personality instrument (De Bruin & Taylor, 2005; De Bruin et al.,
2005; Taylor, 2004; Taylor 2008; Taylor & De Bruin, 2004; Taylor & De Bruin, 2006), such
research focused firstly on developing and evaluating the reliability of the instrument, and
secondly on its construct validity.
Research by Taylor (2008) on the response patterns of different language groups was based
on a university student sample, with resulting limitations regarding the generalisation of the
results as the eleven official languages of South Africa were not appropriately represented.
She recommended that research be done on the BTI using samples other than students, so as
to enhance the generalisability of results and to improve the understanding of bias in
personality instruments due to language barriers. She also grouped languages together
according to their similar origins and grammatical structure, but suggested that research is
needed on a large enough sample to investigate the eleven different languages of South
Africa separately.

9
Internationally the current study can contribute towards understanding the impact that
home language and language proficiency in the assessment language have on personality
assessment, since it explores the influence of all eleven South African languages in terms of
the response patterns on the BTI. The potential contribution of the current study furthermore
lies in the fact that large samples of adults from all the different language groups in South
Africa with Grade 12 education were included, thereby addressing shortcomings of previous
studies and allowing generalisation of the findings. The results can be utilised to sensitise
researchers and test developers to further refine and improve the BTI and to set an example
for the development of new personality or other psychometric instruments for use in South
Africa in adherence to the prescriptions of the Employment Equity Act (Government Gazette,
1998).
1.4 PSYCHOMETRIC ASSESSMENT AND LEGISLATION IN SOUTH AFRICA
The International Test Commission (ITC) provides guidelines for promoting effective
psychometric assessments, as well as for the development of assessment policies (ITC, 2011).
The ITC is an international association of national psychological associations, test
commissions, publishers and other organisations that are committed to the endorsement
of effective testing and assessment policies, as well as to the proper development,
evaluation and use of educational and psychological instruments (ITC, 2011). The ITC
Guidelines stipulate that the reliability, validity and standardisation procedures of a
psychometric instrument should be specified in the technical manual of the specific
instrument (ITC, 2011). Contextual factors that have been identified in the ITC Guidelines
as factors that affect psychometric assessments include social, political, institutional,
linguistic, and cultural differences (ITC, 2011). It is therefore essential to investigate these
factors extensively to ensure that their possible effect on the assessment results is taken
into account during the choice of a personality instrument and the interpretation of the
results obtained from that instrument.
Psychometric assessment in South Africa is regulated by various bodies that provide
guidelines and legislative frameworks to ensure fair and effective assessments (Meiring et al.,
2005). Within South Africa, the legal frameworks that regulate psychometric assessments are

10
the Constitution (Government Gazette, 1996), the Labour Relations Act (Government
Gazette, 1995), the Health Professions Act (Government Gazette, 1974) and the
Employment Equity Act (Government Gazette, 1998).
1.4.1 The Constitution of South Africa
In the Constitution (Government Gazette, 1996), specifically in Section 9 which focuses on
equality, unfair discrimination is specifically prohibited, while fair discrimination is required to
be based on valid grounds. Fair discrimination refers to any distinction, exclusion or
preference in the recruitment and selection of respondents for a particular position that is in
adherence to an Affirmative Action requirement (Government Gazette, 1996). To
discriminate fairly, any assessment decisions must be based on inherent job requirements or
bona fide occupational qualifications or requirements (Government Gazette, 1996).
1.4.2 The Labour Relations Act
The Labour Relations Act (Government Gazette, 1995) regulates unfair labour practices in
terms of
• any unfair act or omission that arises between an employer and employee; based on any
of the following grounds: race, gender, sex, pregnancy, marital status, family
responsibility, ethnic or social origin, colour, sexual orientation, age, disability, religion,
HIV status, conscience, belief, political opinion, culture, language or birth;
• applicants for employment; and
• implementing employment policies to achieve adequate protection and advancement of
persons disadvantaged by unfair discrimination (Government Gazette, 1995).
1.4.3 The Employment Equity Act
Language diversity and its impact on psychometric assessment is further emphasised with
specific legislation regulating assessments in South Africa. The demands on the
appropriateness of psychometric assessment were highlighted in 1998 with the promulgation
of the Employment Equity Act (Government Gazette, 1998, p. 7), which stipulates that:

11
Psychological testing and other similar assessments of an employee are prohibited
unless the test or assessment being used (a) has been scientifically shown to be valid
and reliable, (b) can be applied fairly to all employees, and (c) is not biased against any
employee or group.
Although the section of the Employment Equity Act (Government Gazette, 1998) that deals
with assessment is aimed at improving the quality of assessments in South Africa, this
legislation highlights a number of dillemas. One of these is that all three requirements set
out by the legislation involve the validity of tests. A test cannot in general be described as
being ‘valid’, since a particular test can only be considered valid for certain people in certain
situations at a certain time, provided that evidence in support of this interpretation can be
provided (Taylor, 2004). The concept of validity relates to the interpretation of test results
within a particular context and for a particular group as well as for a specific purpose (Prinsloo
& Ebersöhn, 2002). If the test is suitable for the particular person, in the particular setting,
and for the particular purpose, then the test may very well be ‘fairly’ applied. Validity refers
less to the aspects of the test than it does to the application thereof, while interpretation is
based on cumulative and ongoing scientific evidence in support of the use of test results for
specific groups and for particular purposes and in specific contexts (Taylor, 2004).
The fair application of a psychometric instrument needs to be investigated even after the
instrument has been found to be reliable and valid (Taylor, 2004). Bedell, Van Eeden and Van
Staden (1999) emphasised that there is a need for increasing sensitivity towards the context
in which individuals function and for the responsible use of psychometric instruments and
other psychological assessment procedures. According to Prinsloo and Ebersöhn (2002), the
fair administration of personality instruments depends on the context of application. Despite
the challenges of multiple languages in South Africa, the local practice of personality testing
has still largely followed international trends by importing instruments from abroad and
applying these mutatis mutandis in all sectors of the community (Bedell et al., 1999; Foxcroft,
1997; Van de Vijver & Rothmann, 2004). Psychologists assessing personality in South Africa
still mainly use the etic (imported) approach and the instruments used are often not

12
sufficiently researched to ensure that they are appropriate for a multilingual and multicultural
society (Meiring, 2007).
To adhere to the specifications of the Employment Equity Act (Government Gazette, 1998),
psychometric test users should scrutinise psychometric instruments more thoroughly for
reliability, validity, fairness and bias – including fairness with regard to the different language
groups of South Africa (Meiring et al., 2005). Even though this Act specifies the required
psychometric properties, a very limited amount of research has been conducted on
multilingual and multicultural personality assessment in South Africa (Abrahams, 1996, 2002;
Abrahams & Mauer, 1999a, 1999b; Meiring, 2007; Spence, 1982; Taylor, 2000; Taylor &
Boeyens, 1991; Wallice & Birt, 2003). Various personality instruments have been criticised in
these studies, but due to insufficient samples and unsophisticated research methodologies
such criticism should not merely be accepted without proper inspection (Prinsloo &
Ebersöhn, 2002).
The Employment Equity Act (Government Gazette, 1998) indicates many types of bias that
could affect instrument scores in different ways, for example constuct, method and item bias
(Van de Vijver & Rothman, 2004). An instrument may have good psychometric properties,
perform well across groups, but still display some bias (Van de Vijver & Rothman, 2004). The
effect that a particular type of bias may have on an instrument’s performance may seem
insignificant, but the bias is nevertheless present (Meiring et al., 2005). Therefore, all bias
effects need to be thoroughly evaluated, explained and considered during interpretation of
the results to ensure the fair application of the particular instrument (Van de Vijver &
Rothman, 2004).
To develop and standardise psychometric instruments that are valid, reliable and fair in the
South African context, psychologists should not only reduce sources of bias or inequality, but
also improve their understanding of the South African language groups and associated
cultures in order to improve the quality of instruments available (Taylor, 2004).
South African legislation places enormous pressure on psychologists to use only psychometric
instruments that meet the criteria specified. Consequently test developers or psychologists

13
are more likely to follow the emic approach (developing assessment instruments in the
specific country) when developing psychological instruments for South Africa (Van de Vijver &
Rothmann, 2004). One of the challenges for psychologists – specifically in the current study
referring to personality instruments – is that they need to use psychometric instruments that
give all South Africans (regardless of their home language) an equal opportunity to reflect
their unique personality characteristics.
Since respondents become increasingly more informed about their rights, psychologists may
expect to be held accountable for the improper use of psychometric instruments (Meiring et
al., 2005). Van de Vijver and Rothmann (2004) anticipated that the Employment Equity Act
(Government Gazette, 1998) could enhance the professional level of psychological practice by
• highlighting the importance of bias and equivalence research to improve multicultural
assessment in the South African context; and
• inspiring the emic approach towards developing new psychometric instruments and
standardising these for all culture groups in South Africa.
It is reasonable to consider the Employment Equity Act (Government Gazette, 1998) as an
idealistic goal to be pursued by psychologists, researchers and test developers – in fact, by
any person involved in psychological assessment (Taylor, 2004).
Van de Vijver and Rothmann (2004) advised that in order for psychology as a profession to
meet the requirements set by all relevant legislation, much more research is needed to
establish the level of equivalence and the possible impact and sources of bias on assessment
tools used in South Africa. Recent studies on item bias of psychological instruments in South
Africa have shown that there is little evidence of investigation into the potential impact of the
eleven official languages on specific personality instruments (Meiring, 2007).
Research on the standardisation and validation of personality instruments for use in the
South African context has generally involved adapting personality instruments based on
Western theories, even though the latter have not been fully verified for the broader South
African context (Meiring et al., 2005). This failing has most probably reduced the accuracy of

14
personality instruments and, as such, the quality of the decisions based on their results
(Foxcroft, 2004; Meiring et al., 2005).
1.4.4 The Health Professions Act
The Health Professions Act (Government Gazette, 1974) governs and regulates the
administration of psychometric instruments in terms of people who may administer
psychometric instruments, the procedures prior to, during and after an assessment session
and the ethical implications of psychometric assessments are concerned, in order to promote
fairness. Locally the classification of psychometric instruments are done by the Health
Professions Council of South Africa (HPCSA).
In view of the above, the motivation for the current study was twofold. Firstly, the need for
ongoing and extensive research on personality instruments (in the case of the current study
the BTI as an emic-approach South African personality instrument); and secondly, to identify
the impact of the eleven official South African languages as well as English proficiency on
response patterns.
1.5 PERSONALITY THEORIES
In order to conceptualise the essense of personality and personality characteristics,
Allport and Odbert (1936) identified 17 953 terms, which they soon realised were too
many. They combined the related terms, which resulted in a list of 4 504 personality trait
names, but this was still unmanageable for any one psychologist. Through research and many
debates (to be discussed in Chapter 2), these terms or personality characteristics were further
reduced to 35 variables describing personality that can be measured by among others, 16
multi-dimensional scales as represented by the 16 Personality Factor questionnaire (16PF)
(Cattell, 1947).
Following the earlier research by Allport and Odbert (1936) as well as Cattell (1947), and
in a further attempt to measure the complexity of personality, Eysenck (1990, 1992)
focused on a three-factor model for personality assessment, namely the Giant Three

15
(Psychoticism, Extraversion and Neuroticism (PEN)). Eysenck (1992) claimed that research
has completely failed to show evidence of basic factors similar to Agreeableness,
Conscientiousness and Openness – instead, three factors always emerged at the highest
level in his analyses, and those factors resembled the Psychoticism, Extraversion and
Neuroticism (PEN) model. He developed the Eysenck Personality Inventory (EPI) (Eysenck
& Eysenck, 1965), later the short form of the revised Eysenck Personality Inventory (EPI-R)
(Eysenck, Eysenck & Barrett, 1985), and ultimately the Eysenck Personality Questionnaire
(EPQ) (Eysenck, 1992). These instruments were based on a three-factor theory in which it
was proposed that the core of personality consists of three super traits: psychoticism;
introversion/extraversion; and neuroticism/stability (PEN) (Eysenck, 1990).
McCrae and Costa (1987) followed by recommending a Five-Factor Model (FFM) to
portray the essense of personality as comprising of five factors labelled as Extraversion
(E), Neuroticism (N), Conscientiousness (C), Openness to experience (O) and
Agreeableness (A), also referred to as the ‘Big Five’. The same five factors were also
identified by other researchers as they consistently emerged in personality research studies
(Costa & McCrae, 1988a; 1988b; 1992a; 1992b; Digman, 1990; Goldberg, 1990; 1993;
John, 1990b; McCrae, 1992; McCrae & Costa, 1987). Based on these five factors as the
core of personality, different personality instruments such as the Big Five or Five-Factor
Model were developed (to be discussed in detail in Chapter 2).
1.6 MULTICULTURAL AND MULTILINGUAL PERSONALITY ASSESSMENT
The wide distribution of the eleven official languages is confirmed in the 2011 census results
and highlights the cultural diversity of South Africa (Statistics South Africa, 2012). It is
reported that 75% of South African citizens have an indigenous African language as a
home/first language, while 13.5% have Afrikaans and 9.6% have English as a home/first
language. Even though a minority of South Africans have English as their home language, the
majority of psychological instruments, especially personality instruments, are administered in
English (Nel, 2008). English is the language used in governmental administration as well as the
language of business, politics and most of the media in South Africa (Meiring et al., 2006).
Even though the Constitution of South Africa (Government Gazette, 1996) grants official

16
status to eleven languages, the practical accommodation of eleven languages is generally
not possible. Extra and Maartens (1998) indicated that the primary focus in education is
on the learning of English as a communication medium. The majority of psychological
instruments are available and administered in English, which can lead to bias and unfair
application due to the wrong interpretation or misunderstanding of the words used in the
instruments by individuals with other home languages (Van de Vijver & Rothmann, 2004).
1.6.1 Bias and equivalence
Key concepts in multicultural and multilingual assessments are bias and equivalence, and
three different types of bias are defined by Van de Vijver and Rothman (2004):
• Construct bias, which refers mainly to the constructs measured.
• Method bias, which results from the methods used, for example an incomparable
sample, instrument inconsistencies and administration problems.
• Item bias, which results from problematic items.
Due to the assessment of persons from multicultural and multilingual backgrounds (a
common feature of the South African population), there is a definite possibility that the
language in which the assessment is conducted may contribute to method bias (Wallis & Birt,
2003). The complexity introduced by multiple languages was mentioned by Foxcroft (1997)
and again highlighted by McDonald (2011). Both explained that the language in which the
instrument is administered may incorporate a range of concepts that the respondents do not
understand, as these concepts might not be available or known in their home language.
Item bias and the effect of multiple languages was summarised by Owen (1992) in terms of
methods and recommendations for administering psychometric assessments in a diverse
society like South Africa’s. He identified the development of unbiased instruments as one of
the major challenges to be met and stressed that the emphasis should be on promoting
insight into and understanding of the real nature of bias, rather than merely identifying
and eliminating irregular items.

17
Equivalence refers to the comparability of scores between different cultures or language
groups (Van de Vijver & Rothman, 2004). Types of equivalence are defined by Van de Vijver
and Rothman (2004) as
• construct equivalence, measurement unit equivalence, which indicates similar origins for
the measurement units; and
• scalar equivalence, which is an indication of the same scales even when the origin and
measurement units are not the same.
Acceptable results in respect of bias analysis and equivalent results for different sub-groups
would therefore be required before an instrument can be accepted as valid and fair for use
with various sub-groups (Van de Vijver & Rothman, 2004).
1.6.2 Multicultural and multilingual research in South Africa
In the South African context, some research on the impact of language on psychometric
instruments has been conducted. Examples are Claassen and Hugo (1993) who
highlighted the relevance of the General Scholastic Aptitude Test (GSAT) for pupils who
do not have English as their mother tongue. Furthermore Owen (1991) investigated the
applicability of a junior aptitude instrument in terms of test bias for the constructs
measured across different languages in South Africa. The practical application of an
intelligence instrument in the diverse South African context was investigated by Grieve and
Van Eeden (1997). Even though neither of these studies investigated personality
instruments, which is the focus area of the current study, they both highlighted the fact
that language has an enormous impact on psychometric assessments. Some local
research with regard to personality instruments is evident in the work of Meiring et al.
(2006) who investigated the bias in an adapted version of the 15FQ+; Taylor and Boeyens
(1991) who researched the comparability of the scores of blacks and whites on the South
African Personality Questionnaire (SAPQ); and Taylor and De Bruin (2004) who did research
on personality (measured with the BTI) across the South African cultures. The findings of
these studies emphasised the general need for further research in South Africa with regard to
the impact of the multicultural and multilingual environment on personality assessment.

18
With the current study the aim is to sensitise psychologists about the impact of language
on personality assessment and the research techniques available for these kinds of
analyses.
Research in which the focus falls on the influence of language on personality assessment
in South Africa has been limited, but will be discussed extensively in the next two
chapters. A few examples of the types of research projects are those of Abrahams (1996)
and Abrahams and Mauer (1999a, 1999b), who questioned the applicability of the 16PF.
Both these studies highlighted the influence of language on personality assessment.
Prinsloo and Ebersöhn (2002) investigated the applicability of the 16PF especially in terms
of its fairness towards different South African language groups, and they concluded that
the research methodologies used in the Abrahams (1996) study were not sufficient. They
recommended that other, more applicable techniques be used.
Reseach on several versions of the 16PF followed, namely the 16PFi for industrial usage,
the 15FQ, 15 FQ+ and the 16PF5. The 16PF5 was developed by Van Eeden et al. (1996) as
an adapted and standardised version of the 16PF for use in South Africa.
Bias studies were not done on these different versions, but the impact of language on the
psychometric properties of the fifth version of the 16PF was researched by McDonald
(2011). She compared the level of understanding of native English-speaking students and
non-native English-speaking students of the vocabulary used in the 16PF5 and concluded
that language does influence the understanding of the items in the 16PF5 and that
language creates definite challenges when psychometric assessments are done
(McDonald, 2011).
To scientifically scrutinise personality instruments, it is essential to use advanced research
methodologies and representative samples, specifically for cross-cultural research on
personality instruments (Meiring et al., 2005). Before any decisions or predictions can be
made on the basis of assessment results, it is necessary to evaluate the personality
instrument thoroughly for comparability across the different language and culture groups
(Cheung, Van de Vijver & Leong, 2011).

19
Meiring et al. (2005) conducted research in South Africa on the different types of bias for
two cognitive instruments and a personality instrument. They reported factorial invariance
and low levels of construct bias for all the different language groups on the cognitive
instruments, but found poor structural equivalence for the personality instrument across the
different language groups, as well as low internal consistencies for the African language
groups. Seeing that Meiring et al. (2005) recommended that the particular personality
instrument be used with caution for African language groups, especially in selection
contexts, items from the personality instrument were subsequently adapted in an attempt to
improve their cross-cultural equivalence. In another study, Meiring et al. (2006) again found
low internal consistencies and therefore recommended that the instrument should not be
used for selection in South Africa.
Previous research indicated that the differences in personality characteristics across different
language groups can be a result of ‘real’ characteristic differences and care needs to be taken
when personality instruments are interpreted (Taylor, 2000). In South Africa with its eleven
official languages the probability of different personality characteristics for the different
language groups is even higher, and psychologists, test developers and researchers should be
alerted to the fact that the differences between the group responses may not necessarily be
due to bias or unfair items in the personality instrument.
The above studies are an indication of researchers’ growing awareness of the influence
and the importance of language when psychometric instruments are administered in a
multicultural and multilingual environment like South Africa. The impact of language on
personality assessment in particular will be discussed in more detail in Chapter 3.
1.7 MEASUREMENT THEORIES
Psychometric instruments can be analysed according to two major measurement
theories, namely the Classical Test Theory (CTT) and the Modern Test Theory (MTT)
(Henard, 2000). Both these theories were implemented in the current investigation into
the impact of language on responses to the BTI.

20
The MTT evolved from the shortcomings and assumptions associated with the CTT
(Gulliksen, 1950) and to provide information for decision making that is not available
through the CTT (Henard, 2000). An advantage of the MTT is that it does not require
assumptions about sampling or normal distributions (Fan, 1998). Methods that require
the measurement error values to be considered equal for all respondents are found to
restrict the analysis (Fan, 1998).
One limitation of the CTT was that the item statistics – item difficulty and item
discrimination – are dependent on the specific sample (Hambleton, 2004). A second
limitation was that respondents can only be compared on the same (or parallel) tests
(Hambleton, 2004).
In the 1950s, Frederic Lord produced a psychometric theory (MTT) that assessed
respondents in a way that did not depend directly on the particular test items or the
particular sample (Henard, 2000). This was the beginning of the Item Response Theory.
1.7.1 Item Response theory (IRT)
IRT, as a MTT, is a theory that focuses on item level as opposed to the test-level focus of
the CTT (Fan, 1998). It is a model-based measurement approach that is based on the
application of mathematical models (Osborne, 2008). IRT is based on the idea that the
probability of a response to an item is a mathematical function of both person and item
parameters (Osborne, 2008).
1.7.2 Rasch analysis
Rasch analysis methods were initiated by two independent mathematicians namely Rasch
(1960) and Birnbaum (1968). The research done by Rasch (1960) initiated a probabilistic
approach to making sense of a particular theoretical framework, which was later called the
Rasch theory. Birnbaum (1968), on the other hand, presented a probabilistic model that led
to a mathematical theory in which the goal of measurement was to choose the model that

21
accounts for the most variance in the data – referred to as the Rash analysis or Latent Trait
Theory (LTT) (Osborne, 2008). Rasch models estimate item locations independent of the
sample and allow the researcher to make inferences about the psychometric instrument,
regardless of the sample distribution (Bond & Fox, 2001).
Rasch (1960) initiated this probabilistic model to produce an interval scale on which item
difficulties and person abilities are indicated. The Rasch model is known as a fundamental
measurement model. It is based on the assumption that the probability of achieving higher
scores on a psychometric instrument respectively increases for individuals who possess more
of the latent trait, and decreases for individuals who possess less of the latent trait being
measured (Green & Frantom, 2002).
Rasch analysis allows users to create an interval scale of scores for both the difficulty
levels of an item and the ability levels of a respondent (Bond & Fox, 2001). These scores
are reported in units called logits and are typically placed on a vertical ruler called a
logistic ruler (Osborne, 2008). Just like a yardstick measures length in inches, the logistic
ruler measures in logits with persons’ ability level on one side of the ruler and item
difficulty level on the other. Just as two inches are twice as long as one inch; two logits
are twice as large as one logit, therefore an item with a logit score of 3 is twice as difficult
as an item with a logit score of 1.5 (Bond & Fox, 2001).
The Rasch model is based on mathematical formulas that are used to calculate the
probability of how a person will respond to an item (Rasch, 1960). It determines the
probability that the item will be answered correctly in the case of dichotomous items, or
the probability for endorsing specific alternatives for polytomous items (Rasch, 1960). For
dichotomous items the probability of having an item correctly answered may be different
from what actually occurs, for instance a person with high ability may answer an easy
item in the ability test incorrectly, which indicates that the item may not fit the
predictions of the mathematical model (Taylor, 2008). Thus, for dichotomous items, the
probability of a particular response to a question (correct or incorrect) is a function of the
difficulty of the item and the ability of the person (Green & Frantom, 2002).
22
For polytomous items (used in personality instruments), the item difficulty could be described
as the item endorsability, which is related to the person’s standing on the specific latent trait
that is measured by the item (Green & Frantom, 2002). This refers to how easy or hard it is
for a person of a particular standing on the trait being measured to endorse (agree with) the
item that measures a specific personality trait at a particular level on the logit scale (Bond &
Fox, 2001). For example, a person who is more extraverted would be expected to agree more
strongly (been more inclined to endorse) with items on an extraversion scale than someone
who is more introverted (Green & Frantom, 2002). Should this not be the case, then it means
that the item does not fit the expectations of the model and therefore the item should be
changed or removed (Taylor, 2008).
Rasch analysis techniques determine fit statistics, in other words it requires the data to fit
the model to ensure that a person’s response pattern to sufficient items are indeed the
way it is expected to be. In Rasch analysis, two fit statistics are reported, namely infit and
outfit statistics (Bond & Fox, 2001). Through the use of these fit statistics, the Rasch model
helps to identify items that do not fit the model (thereby decreasing both the validity and
reliability of the instrument). It further identifies any respondents whose scores do not
appear to be consistent with the model (Taylor, 2008). Respondents whose response
patterns were not consistent with what expected responses should be (accrding to the
model) are those respondents who were to anxious or those respondents whos standing
on the latent trait were not measured appropriately, maybe due to their
misunderstanding of the items (Taylor, 2008). For example respondents that endorse
more strongly worded statements, while not endorsing more weakly worded statements,
or for cognitive assessments, answering more difficult questions correctly while
answering easier questions incorrectly. The results of the Rasch analysis make it possible
to identify items that are more difficult than others to answer correctly (dichotomous
items) or more difficult to endorse (polytomous items). This will allow researchers/test
distributors to modify the items by making them easier (dichotomous items) or more
attractable to endorse (polytomous items) or removing the specific items. They may also
decide to raise the level of education/awareness to improve the understanding of those
specific items, if lack of understanding the items made it more difficult to answer or

23
endorse the specific items (Taylor, 2008). A more complete description of the Rasch analysis
methods used in the current study follows in Chapter 4.
1.8 PERSONALITY INSTRUMENTS
There are many different types of personality instruments, the most common of which is
the self-report inventory. Self-report inventory instruments involve the administration of
many items, phrased as statements to respondents, who respond by indicating their level
of agreement in respect of each item. The most widely used personality instrument is the
NEO PI-R (Boyle, 2008), which is based on the FFM. The NEO PI-R and the BTI are self-report
inventories where the respondents are given statements for which they have to indicate their
level of agreement.
Generally, personality instruments are imported from Europe and the USA and administered
without adaptation for South Africa’s unique environment (Meiring et al., 2005). This practice
not only creates various challenges with regard to possible bias and lack of equivalence, as
shown in some studies on these instruments (Abrahams & Mauer, 1999a, 1999b; Foxcroft,
2004; Taylor, 2000; Meiring et al., 2005; Meiring et al., 2006), but is also not in line with local
legislation. The mandatory practices as set out in South African legislation require the
personality instruments to be reliable, valid and fair, therefore researchers and practitioners
should provide evidence that any psychometric instrument measures consistently and
without bias. In addition, it is obligatory that the instrument be used in a fair way.
1.8.1 Personality instruments used in South Africa
According to Foxcroft, Patterson, Le Roux and Herbst (2004), the most popular personality
inventories administered in South Africa are the Sixteen Personality Factor Questionnaire
(16PF) (Cattell et al., 1970), the Fifteen Factor Questionnaire Plus (15FQ+) (Psytech, 2002) and
the NEO PI-R (Costa & McCrae, 1992). All of these instruments are imported from Europe or
the USA and adapted for local use (referred to as the etic approach).

24
1.8.1.1 The Sixteen Personality Factor Questionnaire (16PF)
Although the most extensively researched and widely used personality inventory in South
Africa is the 16 Personality Factor Questionnaire (16PF), the cross-cultural research for the
different languages is still not sufficient (Meiring et al., 2005). Abrahams (1996) conducted
cross-cultural research on the comparability of the 16PF and included a section where words
were identified from some items in the 16PF and respondents were asked to write down
synonyms for these words. The synonyms provided by the participants were checked against
dictionary synonyms for the words for accuracy. Many of these words were interpreted
inaccurately as the synonyms were imprecise according to the dictionary comparison
procedure followed. Abrahams (1996) consequently concluded that the words used in the
16PF are not understood equally well by all language groups in South Africa and thus the
16PF could not provide comparable results for the different groups or be used as a fair
personality instrument.
Abrahams and Mauer (1999b) conducted further research on the impact of home language
on 16PF responses and reported that significant differences were found between the mean
scores of the different language groups (poor construct comparability). No indication was
given if these were measurement differences or intrinsic characteristic differences for the
different language groups. They further concluded that the 16PF is not suitable for use in
South Africa. Since differences in mean scores might be because of ‘real’ differences between
test-takers on certain personality factors and not just an indication of poor construct
comparability, this is not the best method to identify construct equivalence (Urbina, 2004).
Factor analysis and scientific comparisons with other measures are considered more suitable
ways of determining construct equivalence (Urbina, 2004).
Prinsloo and Ebersöhn (2002) responded to the research of Abrahams and Mauer (1999b) by
stating that more sophisticated research methods are needed to analyse personality
instruments. Their criticism was specifically related to the impact of language on responses,
arguing that the language aspect may have been over-accentuated. While Abrahams and
Mauer (1999b) argued that the 16PF is an inappropriate instrument to measure personality
characteristics in the multicultural and multilingual South Africa, Prinsloo and Ebersöhn

25
(2002) argued that certain variables were not taken into account in Abrahams and Mauer’s
(1999b) research, e.g. their sample was not representative (983 students were involved).
It was further argued that firstly advanced methodologies were not used to investigate the
influence of reading skills on factor structures. Secondly, differential item functioning analysis
and language proficiency assessment were not included in Abrahams and Mauer’s research
(Prinsloo & Ebersöhn, 2002).
Further research on the 16PF regarding the factors identified for different language groups
was conducted by Van Eeden and Prinsloo (1997). They performed an exploratory factor
analysis on the 16PF that resulted in their extraction of five second-order factors, namely
Extraversion, Anxiety, Independence, Compulsivity and Emotional Sensitivity. These
second-order factors were found for the English/Afrikaans group, and all but the fifth factor
(Emotional Sensitivity) were found for the African language group. From these results Van
Eeden and Prinsloo (1997) concluded that the 16PF can be used cross-culturally, but cultural
and gender-specific trends need to be taken into account when interpreting the results. Van
Eeden et al. (1996) adapted some doubtful items of the 16PF and renamed the inventory
to the 16PF5. The level of understanding of the vocabulary of the 16PF5 by native English-
speaking students and non-native English-speaking students was compared in a study
(McDonald, 2011) similar to that of Abrahams (1996) and Wallis and Birt (2003).
McDonald (2011) used a different form of the 16PF and also applied different
methodologies as recommended by Prinsloo and Ebersöhn (2002). McDonald (2011)
reported that there was a statistically significant difference in the 16PF5 results when the
native English-speaking and non-native English-speaking groups were compared, as well
as when a black group and a white group were compared. She reported a statistically
significant relationship between students’ academic literacy levels and their scores
achieved on the 16PF5.
1.8.1.2 The Fifteen Factor Questionnaire (15FQ)
The 15 Factor Personality Questionnaire (15FQ) was developed as a revision of the 16PF, to
be utilised more within an industrial and organisational context (Psytech, 2002). The 15FQ
measures fifteen of the core personality factors identified by Cattell in 1943 (Cattell, 1947). As

26
the 16PF is not a timed test, Factor B (Intellectance), which is more an indicator of cognitive
ability, was not found to be reliable and subsequently left out in the 15FQ (first edition)
(Psytech, 2002). Factor B (Intellectance) was however reintroduced in the 15FQ+ as a meta-
cognitive personality variable, rather than a cognitive ability variable (Psytech, 2002).
Acceptable psychometric properties were reported for both these instruments (Psytech,
2002). Internal consistency reliability values above .7 were reported for all the factors
measured with the 15FQ+ and construct validity studies were conducted by comparing
results with other forms of the 16PF and significant correlations were found (Psytech, 2002).
Comparisons with the NEO PI-R also resulted in statistically significant correlations between
the 15FQ primary factors and the NEO PI-R global factors. Correlations between the 15FQ and
the OPQ32i were only moderate and it was concluded that the reason for this may be that
the OPQ32i does not fully assess the primary traits (Psytech, 2002). Various other personality
instruments, for example the Jung Type Indicator (JTI), the Myers-Briggs Type Indicator
(MBTI), the EPQR, the PPQ, the Occupational Personality Profile (OPP) and the Ocupational
Interest Profile Plus (OIP+) were used to assess the construct validity of the 15FQ, all with
very significant correlations (Psytech, 2002). With regard to bias studies, the homogeneity of
the 15FQ primary factors were tested for black South Africans and it was concluded that the
bias that was found reflected differences in verbal abilities, rather than racial differences
(Psytech, 2002). The difference in verbal abilities rather than bias in items was confirmed by a
meta-study done by Van der Walt, Meiring, Rothman and Barrick (2002) who analysed the
relationship between personality instruments and job performance in South Africa.
1.8.2 Big Five and Five-Factor Model (FFM) as personality instruments used in South
Africa
The FFM presents a hierarchical structure of personality traits based on five basic traits or
factors (the so-called ‘Big Five’). The history and discovery of the Big Five Personality Traits
will be expanded on in Chapter 2.
In terms of the Big Five and FFM personality instruments, the Neo-Personality Inventory
Revised (NEO PI-R) is a personality instrument that is frequently used in industry in South
Africa (Taylor, 2000). It measures the so-called ‘Big Five’ personality factors, namely

27
Extraversion (E), Neuroticism (N), Conscientiousness (C), Openness to experience (O) and
Agreeableness (A).
Costa and McCrae (1985) began the development of the NEO Personality Inventory based
on factor analyses of the 16PF (Cattell et al., 1970). Since then they have generated a vast
amount of research in terms of the Five-Factor Model (FFM). The NEO PI (Costa &
McCrae, 1985) – revised in 1992 to the NEO PI-R (Costa & McCrae, 1992) – was designed
specifically to measure personality in terms of the FFM.
1.8.2.1 The NEO PI-R
Taylor (2000) investigated the construct comparability of the NEO PI-R for black and white
employees at a South African factory. The sample consisted of 300 respondents (150 black
and 150 white), all with at least a Grade 12 level of education. Reported Cronbach alpha
coefficients for the black sample (αN = .82, αE = .75, αO = .65, αA = .66, and αC = .82) were
slightly lower than for the white sample (αN = .85, αE = .78, αO = .74, αA = .74, and αC = .82).
After various rotation methods, Taylor (2000) found that the five-factor structure emerged
for the white sample, but did not fit the black sample. At item level, the black sample seemed
to experience difficulty with the language used in some of the items. Consequently the
interpretation of factor results with regard to the black sample would have to be made with
caution (Taylor, 2000). Words such as ‘permissiveness’, ‘broad-minded’, ‘controversial’, and
‘shrewdness’ were found to have unclear meanings for respondents in the black sample
(Taylor, 2000). The lowest alpha coefficient was reported in the black sample for Openness
to Experience, which also had the lowest congruence coefficient (.78) with the American
normative data (Taylor, 2000). Taylor (2000) concluded that the NEO PI-R is useful for
personality assessment of white South Africans, but caution had to be taken when
interpreting the NEO PI-R results of black South Africans. She also reported that a possible
reason for the poor replication of the five factors in the black sample was the lack of
understanding of difficult terminology used in the NEO PI-R, as many of the American
terms and expressions are not commonly used in South Africa. Taylor (2000) concluded
that language is often an obstacle to personality assessment, and therefore the influence of
language had to be acknowledged and researched thoroughly.

28
1.8.2.2 The Basic Traits Inventory (BTI)
The BTI was selected for this research project as it was the only valid and reliable personality
instrument developed on a South African sample and previous research on the BTI (De Bruin
& Taylor, 2005b; Taylor, 2004, 2008 and Taylor & De Bruin, 2004, 2006) indicated that it was
suitable for cross-cultural assessments in South Africa.
Research on another South African developed personality instrument, the SAPQ, developed
by Steyn (1974), indicated that it was not suitable for personality assessment across black and
white cultures (Taylor & Boeyens, 1991).
Furthermore reseach on Afrikaans speaking students indicated that yet another personality
instrument used in South Africa, the Comrey, merely confirmed the presence of Eysenck’s
(1970) three factor model (De Bruin, 2000). This research was however only conducted on
Afrikaans speaking students. Therefore, the BTI (Taylor & De Bruin, 2006) has made a
valuable contribution as a South African developed personality instrument. The BTI, used in
the current study is based on the FFM and was developed as a Big Five personality
instrument, with each of the five factors comprising four or five facets. The BTI was the first
reliable and valid personality instrument, developed with a South African sample and
successfully standardised for South African use (Taylor & De Bruin, 2006).
The Big Five personality factors have received extensive world wide support for their cross-
cultural applicability (Taylor, 2004). The methodologies of studies on the Big Five personality
factors often involve a comparison between the resultant personality factor structure of the
instrument in one culture and that of another culture, in order to determine the structural
equivalence of the instrument across cultures (Van de Vijver & Rothmann, 2004).
Different approaches can be followed to develop a personality instrument; in the case of the
BTI the dimensional perspective was followed. The dimensional perspective explains
individual differences in terms of traits that manifest on a continuum as overt styles of
thinking, feeling and acting (McCrae & John, 1992; Taylor & De Bruin, 2006). The influence

29
of language and specific terminology used in the measurement of personality traits affords an
opportunity for studying personality in a broader, more meaningful way (McCrae, 2001).
The development of the trait approach to personality measurement will be thoroughly
discussed in Chapter 2.
1.9 RESEARCH QUESTIONS AND HYPOTHESIS
Theoretical- and practical errors are unintentionally made when psychologists base their
decisions on personality instruments, for example during selections. The decisions are
usually based on the face value of the instrument, not considering the underlying
dynamics of the culture and/or language groups involved. Therefore the need for a more
extensive cross-cultural study on the BTI were identified to ensure fair usage thereof
within South Africa.
Verhoeven and De Jong (1992) indicated that the construct of language proficiency is very
important for any cross-cultural study in a multicultural and multilingual environment.
Since personality assessment is typically done in English, Prinsloo and Ebersöhn (2002)
proposed that by testing respondents’ English proficiency, the psychologist can help to
assess the impact of language proficiency on respondents’ performance on the
personality instrument. The psychometric properties of a personality instrument can only
be accepted as fair if all the assessed respondents’ understanding of English is shown to
be comparable, or if the responses on the items are not influenced by respondents’
understanding or lack of understanding thereof (Verhoeven & De Jong, 1992).
In the current study, English language proficiency was measured with two tests, namely a
Reading Comprehension test and a Verbal Reasoning test that had been specifically
designed for use within the government organisation concerned. The sample was divided
into two separate groups for comparison, namely a low English proficiency group and a
high English proficiency group. These two groups were used to compare item response
patterns (on the BTI personality instrument) of the eleven different language groups of
South Africa with each other, as well as with the total group.

30
The research questions addressed in the current study were:
• Q1: Whether home language impacts on the responses to BTI items?
• Q2: Whether English proficiency, as an additional independent variable, impacts on the
response patterns on the BTI?
In line with the research questions posed, the main research hypotheses for the current study
were the following:
• H1: Home language impacts on the responses to BTI items.
• H2: English proficiency, as an additional independent variable, impacts on the response
patterns on the BTI.
1.10 ASSUMPTIONS AND LIMITATIONS
The current study used a sample of convenience that consisted of voluntary applicants
who had been shortlisted for appointment within a specific government organisation.
Hence, even though the sample was large and represented all the official languages of
South Africa, it cannot necessarily be considered entirely representative of the total
population.
It was assumed that the BTI would measure the Big Five personality characteristics that it was
supposed to measure and that the interpretation of the data would accurately reflect the
personality traits of the respondents (as concluded earlier by Taylor (2008)).
A limitation to the current study could be that many variables outside the control of the
researcher may have impacted on the response patterns on the BTI. These variables could
include human error, faking, motivation, socialisation, age, gender, race, culture, etc. Analysis
of these variables is considered outside the scope of this research project and will therefore
not be discussed in this thesis.
1.11 CHAPTER OVERVIEW
Chapter 1: Introduction.

31
In this chapter, the background, relevant South African legislation, motivation for the
research and theoretical framework have been presented. The hypotheses, purpose and
objectives, as well as assumptions and limitations of the research were identified.
Chapter 2: Personality assessment.
In this chapter, the assessment of personality within the model of cross-cultural
psychology will be explained. The focus will be specifically on personality trait assessment
and on the Basic Trait Inventory (BTI), the Big Five personality assessment instrument
developed in South Africa.
Chapter 3: The impact of language on personality assessment.
The focus in this chapter is on concepts of bias and issues related to language in terms of
personality assessment research in South Africa. The different approaches to studying
personality across different languages will be discussed in this chapter.
Chapter 4: Methodology.
This chapter presents the research methodology and design used in the current study.
The instruments used as well as the sample and procedures used will be described.
Chapter 5: Results.
The results obtained in the study will be discussed in Chapter 5. The descriptive statistics
will be given, followed by comparisons in respect of the different response patterns and
factors that may influence the differences in responses, e.g. home language and English
proficiency.
Chapter 6: Discussion and conclusion.
In this chapter, the conclusions reached from the findings in Chapter 5 will be discussed.
The limitations of the study will be laid out. Recommendations will be made for further
research and the future research direction will be suggested for personality assessment in
a multicultural and multilingual environment such as South Africa.

32
CHAPTER 2: PERSONALITY ASSESSMENT
2.1 INTRODUCTION
Laher (2008) explained that personality is a dynamic concept due to its interaction with
the environment. Personality should not be seen in isolation as the influence of the
environment in which the individual exists should also be considered. Regarding the
assessment of this dynamic construct, Retief (1992) reported that personality instruments
can assist to formulate theory on how personality traits manifest. This is especially true in
terms of how differences in behaviour are influenced by social and cultural backgrounds.
The influence of social and cultural backgrounds is particularly important in South Africa
with its many diverse societies and cultures (Meiring et al., 2005).
In order to understand or attempt to predict work behaviour in different situations,
psychologists must accurately measure the personality characteristics that result in
different behaviours (Meiring et al., 2006). This is attempted through the use of
personality instruments based on personality theories that have evolved over many years
and will be discussed comprehensively in this chapter.
The controversy surrounding the use of personality instruments changed in the 1980s
when industrial psychologists recognised the value of personality instruments as
predictors of work performance (Hogan, 2005). The publication of the NEO-PI (Costa &
McCrae, 1985) and the Hogan Personality Inventory (Hogan, 1986) showed the
advantages of using personality assessment to select potential employees. Barrick and
Mount (1991) highlighted the value of personality instruments, especially those organised
in terms of the FFM, in predicting occupational performance.
The focus will be on the history of personality assessment in terms of the different
approaches and theories associated with personality, and will proceed to a discussion of
the Five-Factor Model (FFM) (Costa & McCrae, 1992), which is the foundation for the BTI
(Taylor & De Bruin, 2006), the personality instrument used in the current study.

33
2.2 CONCEPTUALISATION OF PERSONALITY
Personality theory is not only complex due to the enormous range of dynamic elements
influencing it, but the uniqueness of individuals also makes it difficult to fully define
personality (Lamiel, 1997). A common way to describe personality is in terms of the core
conceptual orientations such as structure, dynamics involved, development, assessment
and changes in personality over time (Lamiel, 1997). Although there are many debates on
the exact definition of personality, two major themes surface regularly, namely human
nature and individual differences (McCrae & Costa, 1985a; 2004; Lee & Ashton, 2005; Pace
& Brannick, 2010). Human nature deals with the general characteristics of humans that
are universal, such as shared motives, goals and psychological processes (Briggs, 1989).
Individual differences on the other hand, deal with the most important habits and
behaviours in respect of which individuals differ. Briggs (1989) indicated that these
individual differences are best captured by traits, which were defined by McCrae, Costa
and Piedmont (1993, p. 4) as “consistent patterns of individual differences in thoughts,
feelings and behaviours”. Personality as a concept was also described by Ryckman (1993)
as the scientific analysis and explanation of individual differences that determine how
people behave in different situations.
2.2.1 Paradigms to describe personality
Various approaches exist that attempt to define personality and each approach is valid
and useful in its own right, provided that an appropriate fit is found between theory,
conceptual scope and practical application requirements (Runyan, 1997). Two of the
broad paradigms in terms of describing personality are
• the ideographic paradigm, which focuses on the individual and the impact of
contextual variables; and
• the nomothetic paradigm, which describes and predicts individual differences in
terms of predefined personality attributes (Chamorro-Premuzic, 2007) or universal
laws of the human mind (Dumont, 2010).

34
Trait theories focus empirically on the conscious and concrete aspects of personality in
straightforward terms (e.g. friendliness) (Ewen, 2010). From this perspective, personality
is seen as the consistent and unchanging dispositions to think, feel and act, regardless of
the context (Chamorro-Premuzic, 2007).
2.2.2 Approaches to psychometric instrument development
Three main approaches for the development of personality instruments will be discussed
next – the emic (indigenous) approach, etic (imposed) approach and the lexical (language-
focused) approach (Meiring et al., 2005). The terms emic and etic were first used in 1954
by linguist Kenneth Pike, who argued that the tools developed for describing linguistic
behaviours could be adapted to the description of any human social behaviour (Berry,
Poortinga, Segall & Dasen, 2002). The words emic and etic are derived from the linguistic
terms phonemic and phonetic respectively and were proposed by Pike (1954) as a way
around philosophic issues about the nature of objectivity.
2.2.2.1 The emic (indigenous) approach
In cross-cultural psychology the emic approach represents attempts to describe
behaviour and psychological functioning from within a particular culture (Taylor, 2008).
The emic (indigenous) approach utilises a culture-specific orientation relevant to the local
context (Cheung, Cheung, Wada & Zhang, 2003). Dumont (2010) defined the term emic as
the domain of behaviours found in a single society/culture or a cluster of related
societies/cultures. In social psychology the indigenous (emic) approach was defined by Ho
(1998) as the study of human behaviour and mental processes within a cultural context
that are linked to specific values, beliefs, concepts and methodologies. With the emic
approach the importance and meaningfulness of traits are investigated from within a
particular culture (Church & Katigbak, 2000).

35
2.2.2.2 The etic (imposed/imported) approach
The etic approach represents attempts to describe behaviour and psychological
functioning from outside the cultural system, and often involves the comparison of
behaviour and psychological functioning between the different cultures (Taylor, 2008).
The etic approach emphasises ‘core similarities’ in all human beings (Cheung et al., 2003).
The dilemma with the etic approach is that, while researchers should be objective, their
perspectives are often clouded by their own cultural experiences and concepts; therefore
this strategy is seen as an ‘imposed’ strategy (the researcher imposes his/her own views
on the interpretation of behaviour in the other culture) (Berry, 1969).
In terms of personality assessment with the etic approach, one or more inventories that
are imported from other countries or cultures are primarily used to measure and
interpret personality traits for a local group (Nel, 2008). In South Africa, psychologists
mainly use personality instruments that were imported (the etic approach) from Europe
or the USA and adapted for local use, for example the 16PF (Cattell et al., 1970), the
Fifteen Factor Questionnaire Plus (15FQ+) (Psytech, 2002), the NEO PI-R (Costa & McCrae,
1985), the Jung Personality Inventory (JPI) (Du Toit, 1987), the Myers-Briggs Type Indicator
(MBTI) (Myers & McCaulley, 1985), and the Occupational Personality Questionnaire (OPQ)
(Saville & Holdsworth, 1993). The personality instruments used in South Africa are often not
researched well enough to substantiate their reliable, valid, bias free and fair application
in this multicultural and multilingual environment (Meiring, 2007). Most of them do not
take into account the multicultural, multilingual, political, social and economic history of
South Africa, all of which could have a major impact on the bias and fairness of
personality instruments (Meiring, 2007).
Cross-cultural studies of personality based on the etic approach deal mainly with the
relevance and comparability of traits (John & Benet-Martinez, 2000). The imposed or etic
approach is particularly clear in studies of cross-cultural personality assessment, which
have traditionally relied on translating and adapting English-language instruments for use
in countries where English is not the primary language (Cheung et al., 2001).

36
The etic approach is furthermore based on the assumption that the traits measured by
these instruments sufficiently and satisfactorily represent the personality dimensions in
all cultures (Cheung et al., 2001). It stresses the fact that there are general and common
characteristics found in all human beings, and that most people around the world can be
described using these universal personality traits (Cheung et al., 2003). Yik and Bond
(1993) however, stated that the limitation of the etic approach lies in its possible
omission of important culture-specific language and personality characteristics.
South Africa’s multicultural and multilingual population is unique and test developers
have generally relied on the etic approach for the validation and standardisation of
personality instruments, without combining it with other approaches (Nel, Valchev,
Rothmann, Van de Vijver, Meiring & De Bruin, 2012). Nel et al. (2012) recommended that
both (emic and etic) approaches should be used, since the strengths and weaknesses
complement one another. For example the strength of the etic approach is that it helps to
identify commonalities. A weakness of the etic approach is that the focus on
commonalities may lead to an underrepresentation of the unique aspects of a specific
culture. In contrast, the strength of the emic approach can be found in a strong focus on
the unique aspects of a specific culture at the cost of commonalities (as a weakness of the
emic approach) across cultures (Nel et al., 2012).
The current development of the South African Personality Inventory (SAPI) is a project
that aims to provide an indigenous personality instrument for all eleven official languages
in South Africa, using a mixed-method approach (Nel et al., 2012).
2.2.2.3 The lexical approach
In addition to the emic and etic approaches, the lexical approach can be used to develop
psychometric instruments for measuring personality characteristics (Ashton & Lee, 2005).
In the lexical approach it is assumed that individual differences that are prominent and
socially relevant will manifest as words in the ordinary language (Goldberg, 1990).

37
It therefore emphasises that differences in personality should be represented by a large
number of similar but distinct words (generally adjectives) (Saucier, Hampson &
Goldberg, 2000). These words should be used by lay people in the everyday description of
their own and others’ personalities (Saucier et al., 2000).
The lexical hypothesis is founded on two basic assumptions:
• The frequency of use of any specific term has a rough correspondence with its
importance.
• The number of words referring to a particular personality attribute will be a rough
indication of the importance of that attribute for the speakers of the language
(Saucier & Goldberg, 2001).
According to the lexical approach, vigilant analyses of everyday adjectives in a specific
language would reveal the primary indicators of personality (De Raad, 2000). These
primary indicators can help to identify the personality types that are significant to the
speakers of that language, for example, friendly, generous, even-tempered and punctual
(Stagner, 1977). These words are the basic ways in which individuals understand and
portray themselves and others (De Raad, 2000).
A complete theory of personality must ultimately explain the phenomena to which the
terms (the lexical approach) refer and the ways in which they are used in everyday life
(De Raad, 2000). Psychologists often rely on self-reports and peer ratings to gather their
data, consequently they must speak and understand the language of their respondents
(Stagner, 1977). Researchers agree that the importance of language should not be
underestimated as it clearly surfaces in all the different approaches towards personality
assessment (Abrahams, 1996, 2002; Abrahams & Mauer, 1999a, 1999b; Meiring, 2007;
Spence, 1982; Taylor, 2000; Taylor & Boeyens, 1991; Wallice & Birt, 2003).
The Basic Trait Inventory (BTI) used in the current study is a locally developed (emic)
personality instrument that measures the Big Five personality factors that evolved from
research using the lexical approach (Taylor & De Bruin, 2006).

38
The BTI personality instrument is based on the nomothetic paradigm, where traits are
used in an ordinal way (clear ordering of the variables) to describe personality attributes
and types (Dumont, 2010).
In order to fully understand the complexity of personality assessment, the history of
personality psychology (specifically traits) will be discussed, after which the different
personality instruments developed in South Africa will be presented.
2.3 PERSONALITY ASSESSMENT INSTRUMENTS
Personality instruments are used to attempt to scientifically measure personality
characteristics (Foxcroft & Roodt, 2005). The assessment of personality is however
strongly influenced by the verbalisation thereof in different cultures (Berry et al., 2002).
Even though personality structure is assumed to be universal, the articulation across
cultures differs comprehensively (Berry et al., 2002).
In South Africa, the assessment of personality across different cultures has resulted in
extensive criticism, especially in terms of cross-cultural applicability (Abrahams & Mauer,
1999a, 1999b; Block, 1995). Nonetheless, personality assessment still represents an
essential component in personnel selection and therefore the use of personality
instruments cannot simply be discarded (Barrick & Mount, 1991). The Employment Equity
Act (Government Gazette, 1998) requires the fair application of reliable and valid
psychometric instruments, also personality instruments, in the South African employment
context. The responsibility therefore lies with the psychologist to provide evidence in
support of psychometric properties, namely reliability, validity, unbiased and fair
application of all psychometric instruments used, as required by the Employment Equity
Act (Government Gazette, 1998).
The assessment of personality is even more complex, particularly with regard to the
development and validation of assessment instruments that comply with the regulating
criteria set by the ITC (International Test Commission, 2011). The ITC criteria for good test
use practice can be summarised as follows:

39
• Test users must take responsibility for the ethical use of the test, which includes the
professional and ethical manner in which a test users should act
• Test users need to ensure that they are competent to use a specific test and they
should take responsibility for the use thereof.
• Test users must keep the test material safe and secure and treat the results
confidentially.
• Test users must evaluate the potential utility value of the test in an assessment
situation to ensure good technical properties and appropriateness of the test, to
ensure fairness of testing, and to administer, score and analyse the test properly and
accurately
• Test users must communicate the results clearly and accurately to the relevant
persons
• Test users need to review the appropriateness of the test for the specific situation in
which a test will be used.
South Africa’s uniqueness in respect of different race groups and eleven official languages is
often overlooked when personality instruments are imported and adapted (Meiring et al.,
2005). Race and language are very important moderators of test performance (Bedell et
al., 1999) and over time the assessment of black South Africans has become more
systematic and thorough (Bedell et al., 1999).
2.4 TRAIT RESEARCH AS THE BASIS OF PERSONALITY ASSESSMENT
Barrick, Parks and Mount (2005) defined traits as characteristics or enduring patterns of
thought, emotion and behaviour that are stable over time and that explain people’s
behaviour in different situations. Most personality psychologists view traits as major
elements of personality; some (e.g. Buss, 1984) even see traits as the only element of
personality. Costa and McCrae (1992b) concluded that rapid progress had been made
towards a consensus on personality structure with the development and acceptance of
the ‘Big-Five’ trait approach. Chamorro-Premuzic (2007, p.15) defined traits as “the
internal psychological dispositions that remain largely unchanged throughout the
lifespan” and suggested that traits determine differences between individuals.

40
Traits were found to be generally stable across the adult lifespan (McCrae & Costa, 1999),
although Agreeableness and Conscientiousness increase moderately with age and
Neuroticism, Openness and Extraversion decrease moderately with age.
2.4.1 History and development of trait theory
There are three major stages in the history of Trait Theory. The initial stage can be
labelled as the early trait theories. The main contributors to this stage were Allport and
Odbert (1936) as well as Cattell (1943). The second stage involved the discovery of the Big
Five personality traits. The contributors to this phase were Fiske (1949), Tupes and
Christal (1961), Norman (1963) and Goldberg (1990), who all found in their research that
there were five broad traits in personality. The third stage was the further development
of the five-factor model of personality where Costa and McCrae (1992a) played a very
important role with the development of the Neo Personality Inventory (NEO PI). The
various stages are discussed in more detail next.
2.4.1.1 First stage - Early trait theories
The first stage is discussed in terms of the contributors to the early trait theories.
a. Allport and Odbert (1936)
Allport and Odbert (1936) were among the earliest psychologists to do research on
personality traits using the lexical approach. Allport (1937) was the first to formally
articulate personality in the publication, Personality: A Psychological Interpretation. He
viewed personality psychology as the study of the individual as a whole. In 1937 he
defined personality as “the dynamic organisation within the individual of those
psychophysical systems that determine his unique adjustment to his environment”
(Allport, 1937, p. 26). This definition was later changed to “...his characteristic behaviour
and thought” (Allport, 1961, p. 82)

41
Allport and Odbert (1936) used a full-length English dictionary – Webster’s New
International Dictionary – to compile a list of all the words that could be used to
distinguish the behaviour of one human being from another. Their complete alphabetical
list resulted in 17 953 single-word descriptor terms, which they then sorted into four
major categories with 4 504 non-judgemental ‘trait names’. This classification, even
though it was a very large set of terms, provided a basic structure for further taxonomical
research on the personality trait perspective (McAdams, 1997). Cattell (1943) used these
4 504 terms and reduced them through factor analysis to a much smaller number of 171
adjectives, which were more descriptive and complete than the ‘trait names’ provided by
Allport and Odbert (1936).
b. Cattell (1943)
Cattell (1943) used Allport and Odbert’s (1936) list of ‘trait names’ as a basis for further
research. He became known as the originator of the lexical approach as he stated that all
aspects of human personality that are (or have been) of importance, interest or utility,
are recorded in language (Cattell, 1943). As a starting point, he used only the first
category of Allport and Odbert’s (1936) list (which consisted of 4 504 personality trait
names) and added as much information as possible on each description to make the list
as complete as possible and to not only use the dictionary description. Through an
undocumented sequence of semantic decisions Cattell tried to shorten this list by
applying his personal judgement at various stages in the elimination sequence (Block,
1995). After this elimination process, Cattell (1943) used factor analysis and ended up
with a list of 171 adjectives, which he claimed to be representative of the personality
sphere. It was however still too voluminous to assess with a single personality instrument
as this would have been too costly and complex (John & Srivastava, 1999). The 171
adjectives were further clustered by conducting a correlation analysis and Cattell’s
semantic understanding of them, until 60 clusters remained (Cattell, 1943, 1945). Further
factor analysis, as well as semantic and experimental clustering by Cattell (1943) resulted
in a further reduction of clusters which were labelled as 35 bipolar traits (Ewen, 2010).

42
Cattell (1943) regarded factor analysis as the only way to identify the basic components
of personality with only some traits as unique; he indicated many common traits that are
shared by all individuals, but to varying degrees. This drastic reduction was necessary
because of the data-analytic limitations that made factor analyses of a large number of
variables too costly and complex (John & Srivastava, 1999). Using the list of 35, Cattell
(1945) conducted several further factor analyses and identified twelve primary
personality factors, which eventually became part of his 16 Personality Factors
Questionnaire when he added four extra factors specific to the instrument domain
(Cattell et al., 1970). These twelve primary personality factors were labelled
Abstractedness (Imaginative versus practical); Apprehension (Worried versus confident);
Dominance (Forceful versus submissive); Emotional Stability (Calm versus high strung);
Liveliness (Spontaneous versus restrained); Openness to Change (Flexible versus
attached to the familiar); Perfectionism (Controlled versus undisciplined); Privateness
(Discreet versus open); Reasoning (Abstract versus concrete); Rule Consciousness
(Conforming versus non-conforming); Self-Reliance (Self-sufficient versus dependent);
and Sensitivity (Tender-hearted versus tough-minded) (Cattell, 1946). The four factors
specific to the instrument domain, as identified by Cattell (1946), were labelled Social
Boldness (Uninhibited versus shy); Tension (Impatient versus relaxed); Vigilance
(Suspicious versus trusting); and Warmth (Outgoing versus reserved).
Cattell’s (1943, 1945, 1946) ground-breaking work and the availability of a shorter list of
variables stimulated several other researchers to examine the dimensional structure of
traits (Fiske, 1949; Goldberg, 1981; Norman, 1963; Tupes & Christal, 1961).
2.4.1.2 Second stage – Discovering the Big Five personality traits
The following researchers expanded on the early trait theories, which led to the
development of the Big Five theory of personality traits.
a. Fiske (1949)

43
Fiske (1949) constructed simplified descriptions for 22 of Cattell’s (1947) 35 bipolar traits.
The factor structures that were identified from self-ratings, peer ratings and ratings by
psychological staff members, were very similar and resembled what would later be
known as the Big Five (John & Srivastava, 1999).
b. Tupes and Christal (1961)
Tupes and Christal were employed by the United States of America Air Force to improve
officer selection and promotion procedures (Block, 1995). To clarify the factors found by
Fiske (1949), Tupes and Christal (1961) proceeded to reanalyse correlation matrices for
eight different samples. In all the analyses, Tupes and Christal (1961) found five relatively
strong and recurring factors that, according to McCrae (1992), laid the foundation for the
five-factor model. John and Srivastava (1999) reported that the factors were typically
labelled as follows:
• Extraversion (talkative, assertive, energetic)
• Agreeableness (good-natured, cooperative, trustful)
• Conscientiousness (orderly, responsible, dependable)
• Emotional Stability versus Neuroticism (calm, not neurotic, not easily upset)
• Intellect or Openness (intellectual, imaginative, independent-minded)
These factors eventually became known as the Big Five (Goldberg, 1981) that summarise
a large number of personality characteristics (John & Srivastava, 1999). The five-factor
structure was also replicated by Norman (1963) in lists derived from Cattell’s 35 variables.
c. Norman (1963)
Norman (1963) used Cattell’s (1947) 35 variables in four studies in which he confirmed
the five-factor structure. However, he was of the opinion that there could be more
factors present in the natural (everyday-used) language than the 35 listed by Cattell
(1945). In later research, Norman (1967) supplemented the original Allport and Odbert
(1936) list with terms obtained from a second edition of Webster’s Unabridged Dictionary

44
of the English Language. In his search for additional personality indicators that may have
been omitted by Cattell (1943) and Tupes and Christal (1961), Norman (1967) presented a
list of 2 800 single-word descriptors deemed to represent ‘stable traits’. These were
presented to undergraduates to empirically test their understanding thereof. After
Norman (1967) had removed the terms judged as ambiguous or unfamiliar, he was left
with 1 431 terms which he believed was suitable for the development of a structured
taxonomy. Further semantic sorting of the ‘stable traits’ resulted in the classification of 75
semantic categories which were sorted into five dimensions (Extraversion, Neuroticism,
Openness to experience, Agreeableness and Conscientiousness), and each was assigned a
positive and negative pole (Norman, 1967).
d. Goldberg (1990)
Goldberg researched the role of the evaluation component in adjective use (Peabody &
Goldberg, 1989); the frequency of adjectives in various category use (Hampson, John &
Goldberg, 1986); the consistency with which the adjectives are used by laypersons
(Goldberg & Kilkowski, 1985); the level of abstractness of the adjectives (John, Hampson
& Goldberg, 1991); the influence of unipolar and bipolar context (Goldberg, 1992); and
the factor structure underlying laypersons’ use of adjective descriptors (Goldberg &
Kilkowski, 1985). Using Norman’s (1967) listing of 75 semantic categories, Goldberg
(1990) constructed an inventory of 1 710 trait adjectives that participants could use to
describe their own personality. He then scored these responses to the inventory and
conducted factor analyses on the inter-correlations of the self-rated data. After a variety
of different methods of factor extraction and rotation, the first five factors basically
remained the same, namely Extraversion, Neuroticism, Openness to experience,
Agreeableness and Conscientiousness (Goldberg, 1990).
Goldberg (1990) referred to these factors as the ‘Big Five Factors’ of personality. He
stated: “It now seems reasonable to conclude that analysis of any reasonably large
sample of English trait adjectives in either self- or peer descriptions will elicit a variant of
the Big Five factor structure and therefore that virtually all such terms can be represented
within this model” (Goldberg, 1990, p. 223).

45
Goldberg (1993) highlighted the complexity of personality by stating that proponents of
the Five-Factor Model (FFM) never intended to reduce the rich tapestry of personality to
a mere five traits, but rather to simplify it through a well-researched taxonomy.
2.4.1.3 Third stage – Developing the Five-Factor Model of Personality
Various personality researchers tried to develop an integrative framework by conducting
a meta-analysis of different personality inventories (Barrick & Mount, 1991; Clarke &
Robertson, 2008; Connor-Smith & Flachsbart, 2007; Judge, Heller & Mount, 2002; Pace &
Brannick, 2010; Prinzie, Stams, Dekovic, Reijntjes & Belsky, 2009; Salgado, 1997; Tett,
Jackson & Rothstein, 1991). They concluded that the FFM has the potential to be a
functional theory for personality assessment.
Following the identification of the Big Five in early lexical studies, it formed the basis for a
number of personality instruments, including the Five-Factor Personality Inventory (FFPI)
(Hendricks, Hofstee & de Raad, 1999, 2002), the Big Five Questionnaire (BFQ) (Caprara,
Barbaranelli & Borgogni, 1993) the original NEO Personality Inventory (NEO PI) (Costa &
McCrae, 1985) and the Revised NEO Personality Inventory (NEO PI-R) (Costa & McCrae,
1992b). Designed specifically by Costa and McCrae (1992b) to measure personality in
terms of the five-factor model and provide an integrative framework, the NEO PI is the
most widely validated and widely used instrument (internationally and locally) to assess
the five personality factors identified as the Big Five (Rolland, 2002).
The NEO PI was initially developed to measure three broad personality dimensions,
namely Extraversion, Neuroticism and Openness to Experience. The three dimensions
were selected based on cluster analysis of the 16PF (Costa & McCrae, 1976). Costa and
McCrae (1985) realised that the scales of their NEO instrument closely resembled three of
the Big Five factors, but that it did not include the other two (Agreeableness and
Conscientiousness). Thus, they extended their instrument with two additional preliminary
scales measuring Agreeableness and Conscientiousness. The 1985 inventory (NEO PI) was
revised in 1992 and was renamed the NEO Personality Inventory Revised (NEO PI-R).

46
The revised inventory (Costa & McCrae, 1992b) measures each of the Big Five factors on
the basis of six facets.
The NEO PI-R consists of 240 items that assess personality across the five broad factors
(super traits) that include six facet scales for each factor. The facet scales allow for a
detailed distinction between persons with the same broad personality profile, but differ
in terms of how each factor is expressed (Costa & McCrae, 1992b).
Five robust factors emerged from various studies, and hence the Big Five (Goldberg,
1990) and the FFM (Costa & McCrae, 1992a) are often used interchangeably. In fact,
some references refer to the FFM as the Big Five in personality instruments (John &
Srivastava, 1999).
2.4.2 Further development of the Big Five and Five-Factor Model (FFM)
Various research studies on Big Five instruments (the Big Five Inventory (BFI) (Benet-
Martinez & John, 1998); the Big Five Questionnaire (BFQ) (Caprara et al., 1993; Goldberg,
1990); the NEO Personality Inventory Revised (NEO PI-R)(Costa & McCrae, 1992b); and
the Five-Factor Nonverbal Personality Questionnaire (FF-NPQ) (Paunonen, Ashton &
Jackson, 2001)) indicated that the Big Five factors are stable and valid. The fact that the
same five factors have consistently been identified through exploratory factor analyses
(EFAs) as comprehensive measures of personality indicates that the Big Five can be used
as a reliable theory for personality assessment (Paunonen & Ashton, 2002). However,
further development of and research (especially Confirmatory Factor Analysis (CFA)) on
the five factors is necessary to substantiate the use of the Big Five factors to assess and
describe personality in different contexts and with different samples (Venter, 2006).
The development process of the Big Five factors included
• defining the Big Five factors across different studies;
• establishing convergence between the Big Five and other structural models; and
• conducting cross-language and cross-cultural studies (Venter, 2006).

47
2.4.2.1 Defining the factors
According to Venter (2006), personality psychologists still did not fully accept the Big Five
by Goldberg (1990) (who based his research on the lexical approach) and Costa and
McCrae (1992a) (whose research was based on factor analysis) as a taxonomic
superstructure. The labelling of the factors caused many debates (John & Srivastava,
1999). For example, the factor Agreeableness has also been labelled as social adaptability,
likeability, friendly compliance, agreeableness and love (Venter, 2006).
John (1989) addressed this problem by conducting a study where the five definitions were
labelled in ordinary language. In his study, he used 300 terms included in the Adjective
Check List (ACL) and asked ten judges (psychologists) to independently sort the 300 terms
into the Big Five categories or additionally into a sixth category if the adjective did not fit.
He tested the degree to which the Big Five could capture the personality judgements
formulated by each psychologist and found that the inter-rater agreement was
substantial (between .90 and .94), showing that psychologists were able to use a common
structure in classifying the 300 terms into the Big Five traits. The only exception was
factor five (Openness to Experience), where a debate ensued in the literature about its
best interpretation (John, 1989).
2.4.2.2 Comparing the Big Five and the FFM
John and Srivastava (1999) investigated the similarities and differences between the Big
Five (from the lexical tradition) and the FFM (instrument-based). Three different tests
were given to a sample of students to complete. A shortcoming of this sample was that
university students were used, thus limiting the generalisability of findings as they do not
represent the general population or the average working population (Taylor, 2008). The
three different personality instruments that were administered to the sample were the
Trait Descriptive Adjective (TDA) developed by Goldberg (1992), the NEO Personality
Inventory Revised (NEO PI-R) developed by Costa and McCrae (1992a, 1992b), and the Big
Five Inventory (BFI) based on the trait adjectives related to the Big Five and developed by

48
John, Donahue and Kentle (1991). Loehlin, McCrae, Costa and John (1998) then correlated
the self-report scores of the three tests and came to the following conclusions:
• Similar results to previous factor analysis from McCrae and Costa (1985a, 1985b,
1985c, 1987) were reported with regard to the similarity of the Big Five personality
factors and the FFM.
• The five factors replicated well in both types of theories, namely the dictionary-based
(Big Five - Lexical approach) and the instrument-based (FFM) studies.
• All five factors seemed to remain stable over a period of time (life span), whether
they were measured with instruments or with adjective scales (Lexical approach).
One of the strengths of the Big Five taxonomy is that it can capture the commonalities
among most of the existing systems of personality traits, thus providing an integrative
descriptive model for personality research (Venter, 2006).
2.4.3 Limitations of the Big Five and FFM
Block (1995) published a critique of the FFM, which was followed by a second publication
and further critique six years later (Block, 2001). He addressed the point that was also
debated by McCrae and Costa (2008) regarding the number of factors. They questioned
why five factors are regarded as representative of personality as a whole, particularly
when other studies (Thalmayer, Saucier & Eigenhuis, 2011) have argued for more factors.
Block (1995; 2001) presents the history of the development of the FFM to demonstrate
why the notion of personality consisting of five factors might be insufficient. According to
Block (1995; 2001), Cattell (1943), Fiske (1949), later Tupes and Christal (1961) and then
Norman (1963) all used their own, subjective rules for choosing adjectives from the
English language datasets. Block (1995; 2001) criticised the samples used in each case and
pointed out that the initial lists of adjectives were obtained from two specific English
dictionaries. Even though Block (1995; 2001) did not give alternative solutions for
personality assessment, his critique motivated the scientific community to research the
FFM (Costa & McCrae, 1992a) more extensively before defining it as a structural model of
traits and a usable basis of personality assessment (McCrae, 2010).

49
Below follows a summary of the critique on the Big Five and Five-Factor theory.
2.4.3.1 Theoretical limitations of the Big Five theory
Some criticism of the Big Five was that it does not provide a complete theory of
personality (Block, 1995; 2001; Eysenck, 1997; McAdams, 1992; Pervin, 1994). Goldberg
(1993) stated that the Big Five was never intended to be a personality theory, but it was
developed to account for the structural relations among personality traits. Trait theory
from a nomothetic approach is of great value for the purpose of classifying, screening,
personnel selection and diagnosis (Epstein, 2010). Trait theorists in general and Big Five
theorists in particular did not pay attention to the organisation of traits and the
interaction between traits within a person (ideographic approach); therefore the trait
theory is considered irrelevant for the ideographic approach (Epstein, 2010).
2.4.3.2 Factor analysis limitations
According to Briggs (1989), the Big Five was empirically derived and therefore not
theoretical. Block (1995; 2001) expressed his concerns regarding the method and practice
of factor analysis and suggested that factor analysis by itself cannot be used as the basis
for making principal and dominant decisions regarding the concepts to be used in the
field of personality assessment (Block, 1995). However, he did not give any alternative
methods or solutions to not using factor analysis. Meehl (1992) remarked that no
statistical procedure should be treated as a mechanical truth generator. Eysenck (1992)
stated that subjectivity and misinterpretations due to a lack of conceptualisation could
only be resolved by having a solid theoretical framework.
Markon, Krueger and Watson (2005) used meta-analysis to assemble a correlation matrix
from the three-factor model of Eysenck (Eysenck & Eysenck, 1975); the seven-factor
model of Cloninger (Cloninger, Przybeck, Svrakic & Wetzel, 1994) Tellegen’s (1982) normal
personality traits and the FFM (Costa & McCrae, 1992a). Markon et al. (2005) found that a
model consisting of five factors emerged through parallel analyses that clearly

50
corresponded with the FFM and was strongly marked by the five domain scales of the
NEO Inventories (McCrae, 2010).
Although consensus has been reached on the five broad trait domains, and the Big Five
factors serve as a common language in personality psychology, problems are still
experienced for specific samples with Confirmatory Factor Analysis (CFA) and Exploratory
Factor Analysis (EFA) in terms of poor fit (McCrae, Zonderman, Costa, Bond & Paumonen,
1996). Church and Burke (1994) came to the same conclusion from their empirical
research, namely that the poor fit not only highlights the limitations of the personality
structure theory, but also the limitations of CFA to test personality structure models.
While CFA requires items to load clearly on one particular factor, this is too restrictive for
personality research as most indicators are likely to have secondary loadings (Block,
1995).
Marsh et al. (2010) suggested new methods to assess the Big Five Factor structure
through Exploratory Structural Equation Modelling (ESEM) using the NEO PI-R. The ESEM
framework was used by Marsh et al. (2010) to test factorial and measurement invariance
of the NEO-FFI. They found that the failure of Big Five CFAs (based on item-level
responses for NEO instruments to achieve acceptable levels of fit) can be overcome
through application of the ESEM approach. Marsh et al. (2010) nevertheless stressed that
the ESEM approach should not replace the CFA approach, but the best fitting model
should be used by applied personality researchers.
2.4.3.3 The number of factors
The number of factors required to adequately describe personality is another one of the
debated topics, and some theories in this regard will be discussed in this paragraph.
Eysenck (1970) proposed a three-factor model named the Giant Three and acknowledged
that various models of personality differ on the number of factors that would be optimal
to describe personality adequately and accurately (Eysenck, 1990). The 16-factor model
of Cattell et al. (1970) is widely accepted and used. Goldberg (1990) as well as Costa and
McCrae (1992) strongly believed that the Big Five factors describe personalities

51
accurately, while Simms (2007) suggested that the seven-factor model of Cloninger
(Cloninger et al., 1994) captures the uniqueness of individuals more correctly.
Hampson et al. (1986), on the other hand, argued that personality could be
conceptualised at different levels of abstraction or breadth and that many trait domains
are hierarchically structured. The Big Five dimensions represent a rather broad level in
the hierarchy of personality descriptors. In any hierarchical representation one would lose
information as one moves up the hierarchical levels. Although this is very useful for some
initial rough distinctions, it is less valuable for predicting specific behaviours (Hampson et
al., 1986).
The focus in the current study was on the Big Five factors despite sceptics’ arguments
that the five dimensions could not capture all of the variation in human personality and
that they factors were too broad (Block, 1995; 2001; Briggs, 1989, McAdams, 1992;
Mershon & Gorsuch, 1988).
2.4.3.4 Completeness of the Big Five as trait taxonomy
According to John et al. (1991), a complete trait taxonomy must include middle-level
categories such as assertiveness, orderliness and creativity, and even narrower
descriptors such as talkative and punctual. McCrae (1992) provided another side of the
argument by stating that the Big Five does not provide descriptions of peoples’ lives. He
described the Big Five as a “psychology of the stranger” (p. 353) that offers a description
that one might wish to make when one knows very little about a person.
This point of criticism was addressed when Costa and McCrae (1992b) developed the NEO
PI-R with 30 facets (six facets for each of the five factors). This represented the most
elaborate and empirically validated model of the Big Five (McCrae & Costa, 1987; Ramsay,
Taylor, de Bruin & Meiring, 2008).
McCrae (2010, p. 59) stated that the FFM “does not purport to be a comprehensive
taxonomy of individual differences, but only of dispositions, that is, personality traits”.

52
He further explained that the hierarchical FFM (defined by factors and facets) should be
distinguished from the Big Five, which represents five broad constructs. McCrae (2010)
agreed with Block (2001) and Lanning (1994) that the Big Five constructs themselves do
not exhaust valid personality trait variance. McCrae (2010) therefore identified additional
factors as trait isolates, which comprise specific dispositions unrelated to either of the
five constructs or any other trait.
2.4.3.5 Limitations in predicting life outcomes
The usefulness of a structural model depends on its success to predict important life
outcomes (John & Srivastava, 1999). McAdams (1992) argued that the Big Five does not
sufficiently predict important life outcomes – there is more to personality than just traits.
McCrae and Costa (1996, 2008) offered the broader perspective of the Five-Factor Theory
(FFT) to put the FFM into the context of a functioning model of trait structure. According
to the FFT, “personality is a system situated between biological and social-cultural inputs
and its major components are basic tendencies (especially the FFM) and characteristic
adaptations (habits, attitudes, roles, etc.)” (McCrae, 2010, p. 60).
Shortly after this point of criticism was raised, a large study of adolescents that tested the
validity of the Big Five against three criteria (juvenile delinquency, childhood
psychopathology and academic performance) showed that the Big Five can be used to
understand and predict significant life outcomes (Venter, 2006). For example, the study
found that low Agreeableness and low Conscientiousness were associated with high
manifestations of juvenile delinquency. Regarding psychopathology, high Neuroticism and
low Conscientiousness were associated with high manifestation of internalising disorders.
Results also indicated that Conscientiousness and Openness significantly predicted school
performance (John, Caspi, Robins, Moffitt & Stouthamer-Loeber, 1994). In studies of job
performance, the Big Five related to important outcomes in the workplace. Extraversion
was found to statistically significantly predict performance in sales and management jobs,
while Conscientiousness proved to be a general predictor of job performance (Barrick &
Mount, 1991; Mount, Barrick & Stewart, 1998).

53
2.4.3.6 The Big Five derived from a natural language perspective
Block (1995) argued that the lexical approach (using a dictionary to obtain a universe of
single-word descriptors) did not assure a complete set of personality-descriptive terms. It
was his opinion that these single-word descriptors could not represent the complexities
and uniqueness of personality (Block, 1995). He argued that the Big Five merely captured
the personality conceptions of laypersons and that a language suitable for personality
experts (such as psychologists) was required. McCrae (1990) pointed out that many
theorists were sceptical of the ability of laypersons to understand the true basis of
personality and that scientific theory often needed to transcend implicit knowledge of the
culture.
Even though Block (1995) criticised the methods that McCrae and Costa (1985) used to
link their research to the lexical approach, he did not provide alternatives. The NEO scales
were initially developed through cluster analysis of the 16PF to measure three of the five
broad personality dimensions (McCrae & Costa, 1976). The elements connecting the
lexical five factors and the three factors motivated them to include the other two factors.
McCrae and Costa (1985a) used methodological strategies to seek their desired factor
structure, and used items that had decent internal consistency reliabilities and that
loaded onto factors that were clearly distinguishable from one another. These items had
to correspond with adjective-based measures. Once the items had been selected to
measure those two factors, they were added to the NEO scales to form the NEO PI (Costa
& McCrae, 1985) which measures the lexical five factors. Instrument scales were
standardised in both self-report and peer-rating forms to represent the A (Agreeableness)
and C (Conscientiousness) dimensions. According to Block (1995, p. 203), “this sequence
of interlocking analyses for assuring correspondence between A and C instruments and
the previous A and C adjectival measures is unusual and astute”.
John (1989) addressed this criticism in his research by testing the degree to which the Big
Five could capture the personality judgements formulated by psychologists. John (1989)
reported that there was a substantial similarity between the five factors as defined by the
panel of judges (all psychologists) and Costa and McCrae’s (1992) five factors.

54
Block (1995, p. 207) admitted that the Big Five represents a “clarifying and advancing
framework that can be used for integration in the chaotic field of personality
assessment”. McCrae (2010) commented that one of the things Block (1995; 2001) found
most disturbing about the FFM was the notion that it was ‘the answer’ to all the
questions of personality psychology. McCrae (2010) admitted that it was not, but
confirmed what Norman (1963) had hoped for, namely that the FFM would be an
adequate taxonomy of personality traits.
2.5 RESEARCH ON PERSONALITY INSTRUMENTS
In this section research done on the most popular personality instruments will be
discussed – firstly research done on the general personality instruments (non-Big Five and
non-FFM) and secondly research done on the Big Five and FFM instruments will be
discussed.
2.5.1 General personality instruments (non-Big Five and non-FFM)
2.5.1.1 The 16PF
The original 16PF was designed as a multidimensional set of 16 scales that were identified
by Cattell in 1947 (Cattell et al., 1970). The 16 primary source traits can be factored into
five secondary (higher-order) factors, namely Introversion/Extraversion, Low Anxiety/
High Anxiety, Tough-Mindedness/Receptivity, Independence/Accommodation, and Low
Self-Control/High Self-Control (Cattell et al., 1970).
Internationally the 16PF has been researched in different culture groups, for example the
study done by Burger and Kabacoff (1982) who published the results on the different
personality types as they were measured with the 16PF. Recently Yu, Zhang, Li, Wang and
Tan (2012) used the 16PF to identify the personality profiles needed for Chinese military
medical peacekeepers in Lebanon.

55
The importance of cross-cultural research were acknowledges by Golden in 1978 when he
investigated the second order factor structure of the 16PF across cultures from Europe
and Japan. He reported that the Japanese second order factors were significantly
different from the European profiles. Whitworth and Perry (1990) compared the Anglo-
Americans personality profiles with those of Mexican-Americans when the 16PF was
administered in Spanish or English. Language impacted on these profiles and significant
differences were reported between the groups (Whitworth & Perry, 1990).
Literature available in the South African context on the 16PF (Cattell et al., 1970) are for
example the study done by Prinsloo (1992) who adapted the 16PF for the South African
population and named it the 16PF, Form SA92. The adaptation of the 16PF (SA92)
followed the etic approach, in order to render it appropriate for all population groups in
South Africa (Prinsloo, 1992). The 16PF (SA92) is a 160-item instrument that consists of
statements that require a choice between three options. The instrument is normative,
and the norms were based on 6 922 participants from different academic and industrial
organisations (Prinsloo, 1992).
Furthermore Van Eeden and Prinsloo (1997) conducted a study on the second-order
factors of the 16PF (SA92) by screening 637 applicants for posts at a multi-cultural
business institution. A distinction was made using home language as a basis, and the
sample comprised 317 subjects with an African language as a home language and 320
English- or Afrikaans-speaking subjects.
Van Eeden and Prinsloo (1997) performed an exploratory factor analysis and extracted
five second-order factors. These factors were identified as Extraversion (QI), Anxiety (QII),
Independence (QIV), Compulsivity (QVIII) and Emotional Sensitivity (QIII). The factors
were found for the English/Afrikaans group, and all but the fifth one (Emotional
Sensitivity) was found for the African language group. Van Eeden and Prinsloo (1997)
concluded that the 16PF (SA92) can be used cross-culturally in that specific occupational
context, but cultural and gender-specific trends had to be taken into account in the
interpretation of results.
56
A study by Abrahams and Mauer (1999a) yielded results that did not support the
comparability of constructs of the 16PF (SA92) across four race groups in South Africa.
Using 983 Industrial Psychology students from a number of South African universities,
Abrahams and Mauer (1999a) drew up four sub-samples on the basis of race, namely
Black (N=253), Coloured (N=252), Indian (N=229), and White (N=249). Alpha coefficients
were extremely low for the Black sample, ranging from .02 to .63. Internal consistency
alphas were also relatively low for the other three groups, and ranged from .32 to .80.
Abrahams and Mauer (1999a) furthermore performed a factor analysis using target
rotation. The results indicated that Cattell’s 16-factor structure could not be replicated
with the data, the white group fitted the structure best, and the black group showed the
poorest fit (Taylor, 2004).
In a related study by Abrahams and Mauer (1999b) they researched the extent to which
participants understand the meaning of words used in the 16PF (SA92). The first study
consisted of 71 second-year Industrial Psychology students who spoke English as a second
or third language. The students had to provide acceptable synonyms for 136 words found
in the items of the 16PF (SA92). These synonyms were marked correct or incorrect based
on definitions provided by three different dictionaries. It was found that most
respondents could not provide acceptable synonyms. However, it must be noted that the
words were not placed in any context, and the meaning of a word can often be derived
from the structure or context of the sentence. The second study required 10 black
Industrial Psychology honours students to provide a description of what was meant or
asked by each item in the 16PF (SA92) and they also had to comment on the usefulness of
the item. Numerous interpretation problems arose, revealing both cultural and language
discrepancies in the interpretation of the items (Abrahams & Mauer, 1999b).
Prinsloo and Ebersöhn (2002) responded to Abrahams and Mauer’s (1999a, 1999b)
studies on the 16PF (SA92) and highlighted methodological issues and the need for
differential interpretation of scores across cultures. Prinsloo and Ebersöhn (2002)
stressed that ‘high’ or ‘low’ scores obtained on the 16PF (SA92) did not mean ‘good’ or
‘bad’, but rather that, in certain situations, more or less of a given personality construct
could be desirable.

57
A replication of Abrahams and Mauer’s (1999b) study on the impact of home language on
responses to items on the 16PF (SA92) was carried out by Wallis and Birt (2003). The
original study drew no comparisons between first-language English speakers (native
English speakers) and those with English as a second or third language (non-native English
speakers). Wallis and Birt (2003) investigated whether there was a discrepancy between
these two groups in their ability to understand words in the 16PF. A sample of 96 native
English-speaking and 35 non-native English-speaking students were asked to provide
synonyms for the 135 words extracted from the 16PF in Abrahams and Mauer’s (1999b)
study. One word was repeated in the original list, hence 135 items instead of the original
136 items were used (Taylor, 2004).
Wallis and Birt (2003) realised that if they scored the synonyms according to informal
language use (i.e. accepting Afrikaans translations, subtle synonyms, and everyday English
meanings that are not technically correct, but mean the same thing), both groups seemed
to understand most words in the list. They commented that this is an indication that the
results obtained by Abrahams and Mauer (1999b) were more a result of the methodology
that was used than of language-related problems. It was recommended that further
studies using different methodologies be undertaken to determine the extent of language
barriers as fundamental reasons for score differences.
McDonald (2011) conducted a study similar to that of Abrahams (1996) and Wallis and
Birt (2003) on the 16PF5, in which the understanding of the vocabulary between native
English-speaking students and non-native English-speaking students was investigated. In
McDonald’s (2011) study students had to choose synonyms from multiple-choice options
and afterwards the results of non-native English speaking students were compared with
those of native English-speaking students. Although a different form of the 16PF as well
as different methodologies (as recommended by Prinsloo and Ebersöhn (2002)) were
used, McDonald (2011) concluded that there was a significant difference in the scores
achieved (number of correct synonyms for words used in the 16PF5) by native English-
speaking and non-native English-speaking groups, as well as by a black group and a white
group.

58
McDonald (2011) also determined that there was a statistically significant relationship
between a student’s academic literacy level and his/her average score (number of correct
synonyms for words used in the 16PF5) on the 16PF5.
2.5.1.2 The 15FQ+
In 2002, the 16PF (SA92) was revised by Psytech for use in industrial and organisational
environments and named the 15 FQ+ (Psytech, 2002). The 15FQ+ measures 15 of the core
personality factors identified by Cattell in 1947. Originally, Factor B (Intellectance) was a
measure of ability that did not perform reliably because the personality instrument was
untimed (Psytech, 2002). Hence it was left out of the first edition of the 15FQ and later
reintroduced in the 15FQ+ as a meta-cognitive personality variable and not as an ability
variable (Psytech, 2002). Five global factor scores could also be calculated from the scale
scores in the 15FQ+, and these have been shown to correlate highly with the NEO PI-R
(Taylor, 2004).
Meiring et al. (2005) conducted an extensive study on test bias in South Africa utilising
the 15FQ+ and two cognitive instruments – an instrument that measured reading and
comprehension, and an instrument that measured spelling ability. The sample consisted
of 13 681 applicants who had applied for entry-level positions in a government
organisation. The black group made up 85% of the sample, and was representative of
nine South African language groups. All applicants had a minimum of a Grade 12
educational qualification. Although the 15FQ+ demonstrated low item bias, the internal
consistency reliability coefficients were unacceptably low (Cronbach alpha values ranging
from α = .231 for the Conventional-Radical scale for Xhosa-speaking respondents to α =
.652 for the Affected by feelings-Emotionally stable scale for Setswana-speaking
respondents). Evidence of construct bias was found for two of the five factors:
Conventional-Radical where a stronger political association exists for the black
respondents, and Relaxed-Tense, due to the assumption that black respondents are more
relaxed people (Meiring et al., 2005). Meiring et al. (2005) concluded that the usefulness
of the 15FQ+ was limited, and that certain semantic revisions of items needed to take
place in order for the items to be better understood (e.g. the use of difficult words such
59
as ‘gullible’, ‘temperamental’ and ‘conventional’ should be avoided). This finding was in
line with recommendations from studies done on the 16PF (SA92) (Abrahams & Mauer,
1999b) and the NEO PI-R (Taylor, 2000) about problematic issues regarding the
understanding of certain words in personality instruments.
2.5.2 Big Five and FFM personality instruments
The Five-Factor Model (FFM) presents a hierarchical structure of personality traits with
five basic traits or factors (the so-called ‘Big Five’) (Taylor, 2004). Currently, the most
extensively researched and most influential formulation of individual differences in
personality is the ‘Big Five’ trait taxonomy (McCrae & Costa, 2008). As discussed earlier in
this chapter, this taxonomy builds on the early work of Fiske (1949), Norman (1963), and
Tupes and Christal (1961). Furthermore, a number of psychologists specialising in
personality assessment have proposed that the universe of trait dimensions can be
reduced to approximately five basic bipolar categories (Digman, 1990; Goldberg, 1981,
1993; John, 1990; McCrae, 1992; McCrae & Costa, 1987). McCrae and Costa (1987)
identified and labelled the Big Five traits as extraversion-introversion (E), neuroticism (N),
openness to experience (O), agreeableness-antagonism (A), and conscientiousness-un-
directedness (C).
The Big Five personality factors have received considerable support for their cross-
cultural applicability worldwide (Benet-Martínez & John, 1998; De Young, 2010; McCrae,
2001; Meiring et al., 2006; Taylor & De Bruin, 2006; Taylor, 2000). The methodologies
used in studies on the Big Five personality factors often involve a comparison of the
personality factor structure of the instrument in one culture to that of another culture.
This is done to determine the structural equivalence of the instrument across cultures
(Van de Vijver & Rothmann, 2004).
De Raad (2000) suggested that considerably more research was needed to enhance the
precise meaning of the factors and to improve the validity and cross-cultural applicability
of specifically the Big Five model as a personality measurement theory. McCrae (2001)
stated that the FFM had been studied widely from a cross-cultural perspective.

60
Some pertinent literature is discussed next to highlight research done on cross-cultural
assessment with the Big Five and FFM personality instruments.
Heaven, Connors and Stone (1994) investigated the structure set of 112 English language
descriptors for a sample of 230 black South African undergraduate university students.
The data was subjected to a principal components analysis with oblimin rotation and both
three- and five-factor solutions were extracted. Unfortunately neither Eysenck’s Giant
Three nor the Big Five factors could be identified in this study. However, it must be noted
that although English was the medium of instruction at the specific university, it was not
the first language of many of the participants. The meaning of the adjectives was
probably not clear to the bulk of the sample and the alone-standing adjectives could well
have been interpreted differently by various respondents, since they were not presented
in the context of a sentence. Heaven et al. (1994) suggested that dimensions beyond
Extraversion and Neuroticism were culturally determined, and that the Big Five could
possibly have been extracted from a list of African natural language terms.
In another study conducted in South Africa, Heaven and Pretorius (1998) found support
for the FFM among white participants, but not among African participants. In the same
study they also failed to find support for Eysenck’s Giant Three dimensions.
Van der Walt et al. (2002) identified 19 studies with 3 478 cases to include in a meta-
analysis study of the relationship between the Big Five personality constructs and job
performance criteria in South Africa. They found that Extraversion, Neuroticism and
Conscientiousness were all valid predictors for job performance in South Africa. They also
found that for a sample with an education level higher than Grade 12 (moderating factor),
the FFM constructs had a higher predictive value for job performance.
Visser and Du Toit (2004) intended to determine if the FFM was relevant in South Africa
by using the Occupational Personality Questionnaire (OPQ) among telecommunication
job applicants. After analysing the data by means of exploratory factor analysis, they
concluded that all five constructs of the FFM were obtained, with an additional sixth

61
construct, labelled Interpersonal Relationship Harmony. The cross-cultural equivalence of
the findings, however, was not discussed (Nel, 2008).
Meiring et al. (2005) reported that only a few studies had addressed the suitability of the
FFM in South Africa. One such a study was conducted by Zhang and Akande (2002) who
used the NEO PI-R (Costa & McCrae, 1992) to investigate the applicability of the FFM
personality dimensions for South Africans. They did not only find a different personality
structure than the personality structure from other studies conducted elsewhere, but also
reported that some items that measure Openness to Experience had low item-total
correlations and reliability.
Investigation into the possible presence of a five-factor structure for personality in South
Africans has only recently become a topic of interest (Nel, 2008).
2.5.2.1 Comrey Personality Scales (CPS)
The CPS, a personality trait inventory of 180 multiple-choice items that measure eight
major factors of personality, was developed through factor analytic methodology
(Comrey, 1970).
The CPS was used in various studies to assess the personality structure, for example
Zamudio, Padilla and Comrey (1983) assessed the personality structure of Mexican
Americans and found that a majority of the eight factors maintained substantial loadings
and corresponded closely with Comrey’s normative sample. Two factors, namely
Conformity and Orderliness, showed the weakest fit. Overall they reported adequate
measurement properties and identified the CPS as the most preferable personality
instrument for Mexican Americans. Furthermore Weis and Comrey (1987) used the CPS to
assess the personality characteristics of the Hare Krishna and Brief and Comrey (1993)
used the CPS to assess the personality characteristics of a Russian sample.

62
In South Africa the purpose of research on the instrument was to compensate for the
discrepancies between the personality models of Cattell, Eysenck and Guilford (De Bruin,
2000).
When De Bruin (1997) investigated the psychometric properties of the CPS for Afrikaans-
speaking respondents by administering a back-translated version to 804 Afrikaans-
speaking first-year students, he found that six of the eight CPS scales had congruence
coefficients of above .90. He concluded that the CPS was cross-culturally feasible for
Afrikaans-speaking respondents in South Africa.
Next, De Bruin (2000) conducted an inter-battery factor analysis of the CPS and the 16PF
on 700 Afrikaans-speaking university students and revealed three of the Big Five
personality factors, namely Extraversion, Neuroticism and Conscientiousness. Thus the
importance of these factors was highlighted for the Afrikaans-speaking sample in South
Africa (De Bruin, 2000).
Although good results were obtained for the CPS, it was only researched for Afrikaans-
speakers and merely confirmed the presence of three of the Big Five personality factors in
South Africa (Taylor, 2004). This reconfirmed the need for the development of a South
African measure of the Big Five that contains more cultural-specific language and terms
specific to South Africa (Taylor & De Bruin, 2006).
2.5.2.2 The NEO Personality Inventory – revised (NEO PI-R)
The NEO PI-R (Costa & McCrae, 1992a) is the best-researched personality instrument
internationally for assessing the Five-Factor Model across cultures (Boyle, 2008). It has
been published in Dutch, French, German, Korean, Spanish, Polish and Portuguese, and
validated translations are available in a number of other languages such as Italian and
Norwegian. McCrae and Terracciano (2005) conducted a meta study across 50 cultures to
identify the universal features of personality traits measured with the NEO PI-R. Very high
internal consistency reliability coefficients were reported for the NEO PI-R across these 50

63
cultures, the coefficients were reported as follows: Neuroticism α=.90, Extraversion
α=.90, Openness to Experience α=.88, Agreeableness α=.92 and Conscientiousness α=.94.
In the South African context, translations are available in Afrikaans, Southern Sotho and
Xhosa (Costa & McCrae, 2003). The majority of studies done on the FFM in South Africa
used the NEO PI-R (Costa & McCrae, 1992b) as the key personality instrument.
The structure of the FFM in South Africa was also researched by Heuchert et al. (2000)
with a sample of 408 undergraduate student volunteers (268 white, 92 black, 43 Indian,
and 5 coloured). The respondents completed the NEO PI-R, but the coloured group (too
small a sample to include in further analyses) and students older than 22 (since US college
student norms were employed) were dropped from the factor structure analysis, leaving
the sample size at 363 students. When Heuchert et al. (2000) compared the South African
group with the American normative sample, five factors were extracted from the South
African data. A target rotation to the American sample yielded good fit, with all facets
loading very high on their hypothesised domains. Only Angry Hostility (N2) and Warmth
(E1) had secondary loadings at or above .40 on another domain (Agreeableness) in
addition to the hypothesised domain.
Heuchert et al. (2000) found similar results in a varimax-rotated solution for the white
group. Again all facets had loadings of above .40 on their posited factor, and the same
two secondary loadings were present. Assertiveness (E3) also had a negative secondary
loading on Neuroticism. However, a comparison with the American normative groups
yielded congruence coefficients at or above .90 for all five factors (Taylor, 2004). A target
rotation of the black and white South African sample yielded closer fit of the factors than
that of the American sample, with congruence coefficients ranging from .85 to .90 for the
black and white samples (Heuchert et al., 2000).
Heuchert et al. (2000) concluded that there is a clear five-factor solution on the NEO PI-R
for both white and black South African students and that the five-factor solutions were
similar to the FFM results obtained by US college students.

64
Taylor (2004) mentioned that research results for use of the NEO PI-R in a South African
context are contradictory, providing both optimistic and pessimistic recommendations.
However, she concluded that most researchers agree that the NEO PI-R needs item
revision in order to be better understood by South African respondents (Taylor, 2004).
The Neo PI-R (Costa & McCrae, 1992b), as stated above, provided the best structure for
measuring the Big Five in South Africa. The BTI was developed on the basis of the factor
structure of the Neo PI-R to measure the Big Five personality traits for South Africans in
terms of five factors and their facets (Taylor, 2004).
2.6 PERSONALITY INSTRUMENTS DEVELOPED IN SOUTH AFRICA
Personality instruments are mainly imported from Europe and the USA (etic approach)
and adapted for South African use due to the high demands in terms of time, research
and responsibilities accompanying the development of a new personality instrument
(Meiring, 2007). However, two personality instruments are in the process of being
developed in South Africa (Taylor, 2008) (emic approach) and will be discussed next. They
are the South African Personality Questionnaire (SAPQ) (Steyn, 1974) and the Basic Traits
Inventory (BTI) (Taylor & De Bruin, 2006).
It is evident from these studies that the applicability of the Five-Factor Model in the South
African population yields promising results. However, in trying to discover the actual
personality structure for South Africa, it will be more valuable to search for the traits that
are familiar, inherent and observable in all the language groups (Taylor, 2008). South
Africans’ description and observation of personality traits may fluctuate within language
groups and therefore this phenomenon needs to be investigated.
2.6.1 The South African Personality Questionnaire (SAPQ)
Steyn (1974) developed the South African Personality Questionnaire (SAPQ) specifically
for use in a South African context. The SAPQ is a 150-item instrument, available in English
and Afrikaans, and only applicable to white South Africans with 12 or more years of

65
formal education (Steyn, 1974). Steyn (1974) derived five bipolar scales from literature
and claimed that these measures would provide sufficient reliability and descriptive
relevance to the white section of the South African population.
These five bipolar scales are as follows:
• Social unresponsiveness vs. Social responsiveness
• Tranquillity vs. Anxiety
• Amity vs. Hostility
• Flexibility vs. Rigidity
• Submissiveness vs. Dominance
In a series of studies by Steyn (1974), the lowest Cronbach alpha value for the internal
consistency reliability coefficient of the scales of the SAPQ was .79. In a joint factor
analysis with the 16PF (N=268), Steyn (1974) concluded that most of the 16PF factors
loaded on at least one SAPQ factor.
Taylor and Boeyens (1991) investigated the SAPQ’s construct comparability across culture
groups. They reported that the instrument was “unsuitable – and unalterable – as an
instrument for making deductions on personality that are comparable across Black and
White cultures” (Taylor & Boeyens, 1991, p. 9). Four samples of male students from
various South African universities (two black samples – 136 and 123 students respectively,
and two white samples – 193 and 188 students respectively) were used, and the data
fitted the SAPQ structure for three of the four groups (two white and one black group)
when an exploratory factor analysis was performed (Taylor & Boeyens, 1991). They
further investigated the differential item functioning (or item bias) of the SAPQ and found
that 53% of the items in the scale showed some type of item bias for both of the black
samples. This prompted them to suggest that “a new South African personality
assessment instrument be constructed, for there is no instrument that one can
confidently recommend for general use at this stage” (Taylor & Boeyens, 1991, p. 9).
In response to the research by Taylor and Boeyens (1991), Retief (1992) agreed with the
SAPQ’s lack of utility and emphasised that analysing different responses across cultures

66
may reveal important information on differences in the interpretation of social contexts
and cultural values. The distribution of the SAPQ has since been discontinued. Yet, until
recently, this was the only personality instrument that had been developed in South
Africa.
Another ‘imposed’ (etic approach) personality instrument that was used and researched
in South Africa during this same period was the Comrey Personality Scales (CPS, 1970).
Even though the CPS had not been developed in South Africa, research on it provided
valuable information with regard to the Big Five factors and their usability in South Africa
(Taylor, 2004).
2.6.2 The Basic Traits Inventory (BTI)
The BTI (Taylor & De Bruin, 2006) was developed in an attempt to address the scarcity of
locally developed (emic approach) and validated personality instruments that can address
the specific and unique challenges of the South African population. It is a 193-item
inventory that uses a Likert-type response (5-point) scale with response options ranging
from strongly disagree to strongly agree.
Likert scales allow for greater variance than a dichotomous scale, but still permit
respondents to answer relatively quickly and easily, without the confusion brought about
by too many options (Clark & Watson, 1995). Each item was carefully evaluated in terms
of its content for appropriateness to the relevant factor; social desirability; simplicity and
clarity; and grammar.
The items were keyed in both positive and negative directions so as to keep the scales
balanced and as a strategy to control for compliance to all items (Taylor, 2008). This
method however caused methodological concerns about whether the items keyed in
negatively have the same meaning as those keyed in positively. Wong, Rindfleisch and
Burroughs (2003) found in a study of the Material Values Scale (MVS) (Richins & Dawson,
1992) involving 800 respondents a lack of measurement equivalence across cultures, even

67
when the items were changed into non-directional questions. Barnette (2000) stated that
negative-worded items reduce reliability and create artificial factors in factor analysis.
The strong point of the BTI (Taylor & De Bruin, 2006) is that it uses everyday language and
not complicated psychological terms. It can be used in almost any context where
personality assessment is done, such as psychological diagnosis, recruitment and
selection, personal development, educational settings, counselling and research (Taylor &
De Bruin, 2006).
The BTI (Taylor & De Bruin, 2006) is a personality inventory that has been developed in
South Africa to assess the Big Five factors of personality. These factors are Openness to
Experience, Conscientiousness, Extraversion, Agreeableness and Neuroticism. The BTI
also includes a measure of social desirability (Taylor & De Bruin, 2006). Each of the first
four factors consists of five facets, while Neuroticism has only four facets (Taylor & De
Bruin, 2006). Each facet is captured through responses to multiple-choice items (Taylor &
De Bruin, 2006).
Although the BTI is a fairly new personality instrument, very promising results were
obtained by Taylor (2004); Taylor and De Bruin (2006); Taylor (2008), as well as Ramsay et
al. (2008).
Taylor (2008) reported alpha coefficients of above .80 for all of the race groups, for
gender groups higher than .85 and for the different language groups above .83 (Taylor,
2004). The five-factor structure corresponded with the five factors expected from the
FFM theory (Taylor, 2004).
Tucker’s phi was used as the coefficient of agreement or congruence to investigate the
factorial agreement between the different groups and to make meaningful comparisons
between groups. A value of .95 or above was taken to indicate factorial similarity, and values
below .90 indicated incongruities in the factor structures of the two groups (Van de Vijver &
Leung, 1997).
68
Taylor and de Bruin (2004) reported Tucker’s phi coefficients for the BTI as ranging
between .95 and .98, which indicated factorial similarity across the different ethnic
groups in South Africa.
Further evidence for construct validity was found by De Bruin et al. (2005) when they
compared the BTI with the 16PF 5th edition. The first five factors of the 16PF 5th edition
corresponded closely with the factors of the FFM and provided strong support for the
construct validity of the BTI scales. Each of the BTI facets had its highest loading on the
appropriate factor and all of these loadings were indicative of the stability of the factor
structure (De Bruin et al., 2005).
The five factors of the BTI have demonstrated good reliability in various studies with
different samples (Taylor, 2004; De Bruin et al., 2005; Taylor & De Bruin, 2006). De Bruin
and Taylor (2005b) concluded that adequate confirmation was provided of the construct
validity of BTI across cultures, and that some evidence indicated predictive validity and
measurement invariance across language groups. The most recently reported Cronbach
alpha coefficients are for Extraversion (36 items, α=.87), Neuroticism (34 items, α=.93),
Conscientiousness (41 items, α=.93), Openness to Experience (32 items, α=.87), and
Agreeableness (37 items, α=.89) (De Bruin & Taylor, 2005b).
According to Taylor (2008), the BTI statistically performs very well in terms of little or no
construct, item and response bias for a number of different culture groups. She used Rasch
techniques to investigate bias for gender groups (men versus women), ethnic groups (black
versus white students) and language groups (English, Afrikaans and indigenous African
languages), and concluded that the BTI reported significant statistics for construct, item, and
response bias across a number of different groups.
Ramsay et al. (2008) found a good fit between the postulated five-factor model (McCrae
et al., 1998) and the BTI for three groups of South African participants. The BTI displayed
an acceptable level of measurement invariance across Nguni, Sotho and Pedi language
groups for a sample of clerical position applicants (Ramsay et al., 2008).

69
Van der Walt et al. (2002) found that Extraversion, Neuroticism and Conscientiousness
are valid predictors for job performance. They also suggested that education acted as a
moderating factor and that the FFM constructs had better predictive value for a sample
with an educational level higher than Grade 12. (The educational level required from
applicants by the government organisation used in the current study was Grade 12.)
To conclude, the BTI is an easy to use, easy to understand personality inventory (Taylor &
De Bruin, 2006). It is available in Afrikaans and English, but only the English version was
used in the current study.
2.7 SUMMARY
The history of personality psychology was discussed in terms of theory and the research
that had led to the identification of the Big Five factors. The structuring of personality
based on the Big Five factors and the FFM has been researched extensively internationally
(Digman, 1990; Goldberg, 1981, 1993; John, 1990; McCrae, 1992; McCrae & Costa, 1987),
but its applicability for personality assessment in South Africa has not yet been proved
sufficiently (Meiring et al., 2005).
Research conducted on the suitability of the various imported (etic approach) personality
measures currently used in South Africa demonstrates significant differences for the
diverse local population – specifically as far as bias and the adverse impact of South
Africa’s eleven official languages are concerned (Meiring et al., 2005).
However, studies investigating the presence of the Big Five in South Africa showed
promising results (Taylor, 2004). Therefore Taylor and De Bruin (2006) developed the BTI
as a South African personality instrument measuring the Big Five by using more simpified
language and local South African terms.
In the following chapter the various methodological challenges confronting test
developers and researchers in South Africa will be discussed, with a special focus on the
challenges related to the country’s multilingual population.

70
CHAPTER 3: IMPACT OF LANGUAGE ON PERSONALITY ASSESSMENT
3.1 INTRODUCTION
Despite the origin of different languages having been a widely studied topic over many
years, linguists have still not reached a final consensus on the origin of different
languages (Herbert, 1992). Linguists also debate whether having different languages in a
country is a gift or a curse (Herbert, 1992). In 1866, the Linguistic Society of Paris went so
far as to ban debates on the subject of the origin of different languages (Tallerman &
Gibson, 2011). Since the early 1990s, however, a growing number of professional
linguists, archaeologists, psychologists, anthropologists and others have attempted to
address with new methods what they are beginning to consider ‘the hardest problem in
science’, namely – where did different languages originate from (Tallerman & Gibson,
2011)?
Psychologists are nonetheless more concerned about the consequences of having
different languages, than the origin thereof, especially in terms of the impact these
different languages have on fair assessments (Meiring et al., 2005). This concern is even
more prominent in the South African context where eleven official languages have an
impact on psychometric assessments (Meiring et al., 2005).
A number of research studies that have been conducted in South Africa as a multicultural
and multilingual environment will be discussed in this chapter.
3.2 RESEARCH ON THE IMPACT OF LANGUAGE ON PERSONALITY ASSESSMENT
Differences in the meaning attached to constructs and the way they manifest in different
cultures and/or languages are bound to surface during personality assessments
(Kamwangamalu, 2007). It is important to acknowledge the social history and challenges
when psychometric assessment is done in a language other than the repondent’s home
language (Kamwangamalu, 2007).

71
Zhou, Saucier, Gao and Liu (2009) used the lexical approach to explore the factor
structure of Chinese personality descriptors. Firstly they examined the between-language
replicability of the Chinese personality structure and secondly they tested the universality
across language of the Big Five model in comparison with alternative models (Zhou,
Saucier, Gao & Liu, 2009). They highlighted the importance of studies on the language of
personality as that will provide important indicators of what the personality test should
measure (Zhou, Saucier, Gao & Liu, 2009).
As stated before, the five-factor model has been extensively researched internationally
for cross-cultural personality assessment and is at the forefront of trait perspective
research (Heuchert et al., 2000).
However, research on the influence of language on personality assessment in South Africa
was highlighted when Abrahams (1996; 2002), as well as Abrahams and Mauer (1999a;
1999b) criticised the fairness of administering the 16PF (SA92) in English in a multicultural
and multilingual environment. Even though Prinsloo and Ebersöhn (2002) responded in
terms of the research methodology used by Abrahams and Mauer (1999), the focus of
personality assessment research shifted to the effect of eleven different languages in
South Africa. Meiring et al. (2005) looked at the construct, item and method bias of cognitive
and personality tests in South Africa and specifically the adapted version of the 16PF (SA92),
namely the 15FQ+. They concluded that the 15FQ+ should be used with caution for black
South Africans because of the low item bias and the unacceptably low internal consistency
reliability coefficients (i.e. Cronbach alpha values ranging from α=.23 for the
Conventional-Radical scale for Xhosa-speaking respondents to the highest Cronbach alpha
value α=.65 for the Effected by feelings-Emotionally stable scale for Setswana-speaking
respondents). Evidence of construct bias was also found for two of the five factors,
namely the factor Conventional-Radical and the factor Relaxed-Tense (Meiring et al.,
2005). This finding is in line with recommendations from studies done on the 16PF (SA92)
(Abrahams & Mauer, 1999b) and the NEO PI-R (Taylor, 2000) about problematic issues
regarding the understanding of certain words in personality instruments.

72
Van Eeden and Mantsha (2007) conducted research on the theoretical and
methodological considerations that need to be taken into account when translating a
personality instrument. They specifically focused on the translation of the 16PF5 into an
African language and administering it to the language group. They found that many items
did not improve the reliability of the instrument and, should the aim be to achieve
acceptable reliability, these items would have to be excluded. However, the reliability
would still be low. The absence of equivalent concepts in the target language causes the
meaning of an item to change and Van Eeden and Mantsha (2007) indicated that trends
manifested differently for the different cultures, specifically in relation to cultural norms.
They concluded that these challenges proved that the literal translation of the 16PF5 was
not recommended.
Foxcroft (1997) investigated the different perspectives on the subject of ethical and fair
practices with regard to psychological testing in South Africa and in 2004 summarised the
processes to be followed when planning a psychological test in the multicultural South
African context.
Foxcroft (1997) also summarised some perspectives on the ethical considerations and fair
practices of psychological testing in terms of the administration language. She proposed that
a code of fair testing practice and a national test development agenda should be developed
to enhance the ethical use of psychometric tests in South Africa. She argued that language
proficiency tests should be done to establish the level of understanding of the language in
which the tests are administered before further testing is done, as this would ensure fairer
testing practices. She also highlighted the importance of appropriate norms and ethical and
fair practices with regard to psychological testing (Foxcroft, 1997). To eliminate the effects of
past apartheid political policies, she proposed that ethical test development be enhanced by
developing a Code of Fair Testing Practice and a national test development agenda for South
Africa.
Foxcroft (2004) identified two very important issues that test developers have to consider
when psychometric tests are to be used in a multicultural environment.

73
These were the cultural relevance (and potential bias) of the test right from the planning and
design phase (not only during the item-writing phase), and the appropriateness of the
methods of test administration for a specific culture group. Foxcroft (2004) emphasised that
more test developers should spend more time on design issues during the planning phase.
Foxcroft (2004) recommended that a multicultural test development team and a reference
panel of cultural experts, anthropologists, psychologists, linguists, etc., work together to
ensure that a rich mix of cultural and language inputs are given during the development of
psychometric tests. She also elaborated on the following aspects that according to McIntire
and Miller (2000) had to be made more appropriate for test development for a multicultural
population:
• Identifying the purpose and rationale for the test as well as the intended target
population
• Defining the construct (content domain) and creating a set of test specifications to guide
item writing
• Choosing the test format
• Choosing the item format
• Specifying the administration and scoring methods
John (1990b) found that items of an imported Big Five personality instrument, which are
normally associated with Agreeablenees (A), Conscientiousness (C) and Openness to
experience (O), loaded significantly onto a single dimension. Contrary to expectation,
Introversion (E-) and Extraversion (E+) items loaded onto separate dimensions. He suggested
that the administration language, English, might have an impact, as it was not the home
language of the African respondents. Heaven and Pretorius (1998) decided to re-investigate
the underlying structure of language descriptors used by John (1990) among non-English-
speaking South Africans. A principal components analysis was done, followed by rotation
to oblimin solution, while a five-component extraction was done for both data sets.
Factor loadings greater than .50 were regarded as significant (Heaven & Pretorius, 1998).

74
For the Afrikaans-speaking respondent group, five clearly interpretable components
explained 37,7% of the variance (Heaven & Pretorius, 1998), while the same components
did not load clearly on the five factors for the Sotho-speaking group. Labels were given to
the components as was previously done by Heaven et al. (1994) and John (1990b).
Heaven and Pretorius (1998) concluded that the Big Five taxonomy is inadequate for
describing personality dimensions, especially among Sotho-speaking respondents, and
they recommended that locally constructed measures be developed. According to
Verhoeven and De Jong (1992), language definitely influences the responses to
psychometric instruments and should always be included as a research objective.
This statement was supported by research done by Bedell et al. (1999), who highlighted
culture as a moderator variable in psychological test performance in South Africa. They
discussed the cultural variation and the relevant moderator variables in test performance
from a historical viewpoint to present issues and trends for cognitive and personality tests.
Bedell et al. (1999) concluded that there was a growing need among psychologists for more
relevant and better researched tests to be used in the multicultural and multilingual
environment of South Africa.
Van de Vijver and Rothmann (2004) further investigated the process of assessment in
multicultural groups in South Africa. They summarised four procedures that needed attention
when dealing with multicultural assessments, namely the investigation of equivalence of
existing instruments, defining new norms, developing new instruments, and studying and
eliminating validity-threatening factors (Van de Vijver & Rothmann, 2004).
Research on the FFM and the Big Five constructs yielded similar results. Heuchert et al. (2000)
conducted research on the NEO PI-R by administering it to 408 South African college students
and found that the five-factor model was well reproduced for the entire sample, which
consisted of black and white respondents. Significant differences were found in the factor
Openness to experience, where the white group scored relatively higher, the black group
relatively low and the Indian group intermediately; however they concluded that the
personality structure was highly similar across the races.

75
Heuchert et al. (2000) indicated that the differences between the responses to the five
factors might be due to social, economic or cultural differences, rather than the product of
race itself.
Taylor (2000) accepted the FFM as a personality model and looked at an imported personality
instrument, namely the NEO PI-R in terms of the construct comparability for black and white
employees and found that there is a clear five-factor solution on the NEO PI-R for both white
and black South Africans. The possibility of the FFM as a model to describe and assess
personality in South Africa has become evident from previous multicultural and
multilingual research.
The influence of language on personality assessment was further emphasised by McDonald
(2011) who compared a native English-speaking group and non-native English-speaking
group’s understanding of the vocabulary used in the 16PF5. She also found that the impact of
language cannot be ignored, and subsequently Nel (2008) attempted to uncover the
personality dimensions in the eleven different language groups in South Africa. The
objective of the latter study was to identify the shared and unique dimensions of the
different language groups to develop a South African personality instrument that would
meet the requirements of the Employment Equity Act (Government Gazette, 1998).
Based on the personality dimensions found by Nel (2008), Valchev, Van de Vijver, Nel,
Rothmann, Meiring and De Bruin (2011) explored the personality structure in the eleven
languages of South Africa to initiate the development of a personality instrument
specifically for South African use (etic approach), namely the South African Personality
Instrument (SAPI).
Seeing that the etic approach (importing instruments) caused so many frustrations for
South African psychologists, Taylor (2004) investigated the development of the BTI as a
five-factor personality inventory based on the FFM specifically for South Africa’s unique
environment.

76
The above research studies have highlighted the consequences of administering the same
personality instrument to different language groups. Each of South Africa’s eleven
languages is linked to a relatively distinct cultural group, depending on the first language
of members in that group (Valchev et al., 2011). Even though South African historians
warned against equating language with ethnic groups or culture in a historical context
(Nurse, 1997; Van Warmelo, 1974), this was a contemporary study and the cultural
groups were clearly identifiable by language (as illustrated by Slabbert and Finlayson
(1998)). Herbert (1992) promoted the recognition of language as a central mark of ethnic
identity, as language has often been used as the primary criterion for assignment to an
ethnic group. Slabbert and Finlayson (1998) furthermore linked language and identity by
noting that language does not only have an instrumental value, but also a symbolic value
in terms of being the means through which the values of the individual and particularly
the group are expressed.
Ntshangase, Kaschula and Anthonissen (1999) concluded that language is part of culture
and that there seems to be no question that languages are as much based on culture as
they are intrinsic; language not only expresses cultural values, but to some extent also
determines the culture. The current study will follow an ethno linguistic approach where
language is seen as part of the culture of a community. The discussion of culture will also
serve as an amplification of the language that forms part of that specific culture, for
example, the Zulu culture will be discussed as an explanation of people in that culture
who use the Zulu language as their first or home language. Fasold (1990) argues that the
ethno linguistic approach accepts that language is intimately human and that it will be a
mistake not to consider cultural values and beliefs associated with the language. For the
purpose of the current study, language will be used as the only identifier of culture –
based on the research of Valchev et al. (2011) who confirmed that culture groups are
clearly identifiable by the language they indicate as their home language.
The impact of eleven home languages on personality assessment, specifically with the
BTI, in South Africa, will be elaborated upon in this chapter, as well as challenges with
regard to psychometric assessment in English and the influence that English language
proficiency may have on the assessment of personality with the BTI.

77
3.3 OFFICIAL LANGUAGES IN SOUTH AFRICA
According to Slabbert and Finlayson (2008, p. 13) “South Africa is a unique playground
where the complexities of globalisation, colonialism and racism continue to be played out
in the rich diversity of languages and cultures”. South Africa, with its eleven official
languages, are often referred to as the Rainbow Nation. The multicultural and multilingual
setting in South Africa is set out Table 3.1.
Table 3.1
The Official Languages of South Africa
Language Total in Population % of Population
Afrikaans 6 855 082 13.45%
English 4 892 623 9.60%
Sepedi 4 618 576 9.06%
Sotho 3 849 563 7.55%
Swati 1 297 046 2.55%
Tsonga 2 277 148 4.47%
Tswana 4 067 248 7.98%
Venda 1 209 388 2.37%
Xhosa 8 154 258 16.00%
Zulu 11 587 374 22.74%
Sign language 234 655 .46%
Other languages 828 258 1.63%
TOTAL 50 961 443
(Statistics South Africa, 2012)
Table 3.1 shows that Zulu is the most commonly spoken language (22.74%) in South
Africa, while Ndebele is the least commonly spoken language (2.14%). Afrikaans is spoken
by 13.45% of South Africans, while only 9.6% of the population has English as a first
language.
Due to the large variety of languages in South Africa, the languages are often grouped
together as some languages have many similarities in syntax and grammar, for example
isiZulu, isiXhosa, siSwati and isiNdebele are collectively referred to as the Nguni

78
languages. The Sotho languages – Setswana, Sepedi and Sesotho – also have much in
common and are often grouped together, especially to increase sample sizes for research
purposes (Taylor, 2008). This can however have a confounding effect on the reliability and
validity results for the specific psychometric instruments evaluated and might not give a
clear picture of real response patterns for each language separately. This problem was
specifically addressed in the current study with large enough samples available for all
eleven official languages.
Since the BTI was administered only in English, the history and social characteristics of
English are discussed in the following paragraphs.
Kamwangamalu (2007) distinguished between three eras in the social characteristics of
English in South Africa, namely the pre-apartheid era (from 1795 to 1947), the apartheid
era (from 1948 to 1994) and the post-apartheid era (after 1994).
English was viewed in the pre-apartheid era as the language of the enemy (Brandford,
1996). It was seen as a threat to the Afrikaner identity and an instrument of domination,
because it was the language of the British troops who had invaded what was then the
Cape of Good Hope, now Cape Town (Kamwangamalu, 2007).
In the apartheid era that followed the whites-only election in 1948, English became the
language through which the black community could inform the outside world of their
struggle against the apartheid regime (Brandford, 1996). During apartheid only the
‘white’ languages, Afrikaans and English, were recognised as official languages in South
Africa (Kamwangamalu, 2007). This changed the social view of English favourably
(Kamwangamalu, 2007) and English was adopted by the Black community not necessarily
due to a great love of the language, but rather in protest against Afrikaans (Brandford,
1996).
After the first democratic elections in 1994, the picture changed dramatically and the new
South Africa now has eleven official languages (Kamwangamalu, 2007). The Constitution
of the Republic of South Africa was approved by the Constitutional Court on 4 December

79
1996 and took effect on 4 February 1997. This placed a huge responsibility on the South
African Government to implement positive measures to elevate the status and advance
the use of all the official languages. English came to be seen as the language of
advancement, education, access, democracy, black unity and liberation (Nomvete, 1994).
In the post-apartheid era, English was seen as a language that bonds the formerly divided
communities together (Kamwangamalu, 2007).
Phaswana (2003) investigated the implementation of the constitutional eleven-languages
clause in Parliament and found that English is commonly used and other official languages
are sidelined. Phaswana (2003, p. 124) explained that “the eleven-language policy is an
ideal policy which practically cannot work … It was a matter of political correctness to say
that eleven official languages are equal.” Similarly, the perception exists that
psychometric assessments in the eleven official languages practically cannot work, but
the development and standardisation process should still take all languages into account.
3.4 LANGUAGE PROFICIENCY AND PERSONALITY ASSESSMENT
In the early years, Thurstone (1938) suggested a model for language performance that
contained seven primary mental abilities of which at least two were explicitly verbal,
namely verbal comprehension and verbal fluency. Other researchers proposed several
variables within the domain of language behaviour alone (Davis, 1944; Guilford, 1982;
Spearitt, 1972; Thorndike, 1973).
According to Meyer and Foster (2008), multinational organisations all over the world
should strive to ensure that personality instruments are language independent. They
explain that organisations should be able to compare personality scores across different
languages, using the same ‘metric’. More relevant to South Africa’s multilingual
environment, administering a psychometric instrument in English can have its own
challenges, as a lack of English proficiency may have an adverse impact on the individual’s
performance on the test (Meiring et al., 2006). Even though English is generally
understood across the country (being the language of business, politics and the media),
administering a psychometric instrument in English may lead to incorrect responses.

80
Using instruments in English obviously standardises the process and makes the
administration more practical, especially in large groups, as was the case of the
government organisation in the current study where up to 200 applicants were assessed
per test session. However, the possible adverse impact that completing an English
personality test may have on the performance of an individual who does not have English
as his/her home language must be taken into account, investigated and as far as possible
minimised (Meiring, 2007).
Personality instruments are highly language dependent (Meyer & Foster, 2008). This is
even more of a challenge in South Africa with its eleven official languages. It results in a
situation where psychometric instruments are administered in English, which is not the
home language of most of the respondents and for this reason research on the cross-
cultural measurement invariance and/or the impact of language on the responses, is of
extreme importance. South African researchers have consistently demonstrated how
taking a test in a language that is not one’s first language can impact on test results
(Abrahams, 1996; 2002; Abrahams & Mauer, 1999a; 1999b; Bedell et al., 1999; Foxcroft,
2004; Heaven & Pretorius, 1998; Heuchert et al., 2000; Meiring et al., 2006; Nel, 2008;
Taylor, 2000; 2004; Van de Vijver & Rothmann, 2004; Van Eeden & Mantsha, 2007; Vogt
& Laher, 2009).
Regarding personality assessment, it is essential to recognise that personality is a social
aspect of a person’s life and that language proficiency is intimately linked to an
individual’s social uniqueness (Kamwangamalu, 2007). Thus it is extremely important to
remove any language barriers and to be aware of the different levels of understanding of
the assessment language and the impact that this might have on the results (Terzoli,
Dalvit, Murray, Mini & Zhao, 2005).
Since language has a significant effect on students’ understanding of learning material
and consequently on their education results, Dlamini (2001) argued that the ideal would
be for students to be educated in their home language. Likewise, the ideal would be for
individuals to be psychometrically assessed in their home language (Terzoli et al., 2005).

81
However, the use of African indigenous languages in an educational system has proved to
be difficult and in an assessment scenario it has also led to more challenges than
solutions (Abrahams, 1996; 2002; Abrahams & Mauer, 1999a; 1999b; Bedell et al., 1999;
Foxcroft, 2004; Heaven & Pretorius, 1998; Heuchert et al., 2000; Meiring et al., 2006; Nel,
2008; Taylor, 2000; 2004; Van de Vijver & Rothmann, 2004; Van Eeden & Mantsha, 2007;
Vogt & Laher, 2009). Terzoli et al. (2005) reported that the absence of technical terms in
some languages, the cost of developing new educational material and the retraining of
young students to become more competent in English are problems that greatly hamper
Dlamini’s (2001) ideal, namely for students to be educated in their home language.
Likewise, the absence of technical terms in some languages, the cost of developing new
psychometric instruments and the retraining of individuals to become more competent in
English, result in individuals not being assessed in their home language, even though this
is considered to be the ideal (Terzoli et al., 2005).
Slabbert and Finlayson (1998) illustrated that there is a positive relationship between
language proficiency and the personality structure of a culture group. Language
proficiency plays a very important role in describing personality and should therefore also
be investigated as a factor that influences the response patterns in psychometric
assessments (Slabbert & Finlayson, 1998). The impact that having multiple languages has
on personality assessment responses was explored by Meyer and Foster (2008), who
maintained that personality assessment results should be language-independent and the
same ‘metric’ should be used to compare personality scores across different sub-groups.
For this they recommended multiple language norms, which will be discussed more
thoroughly later in this chapter.
Verhoeven and De Jong (1992) indicated that the construct of language proficiency is very
important for all classification studies in a multicultural and multilingual environment.
Language proficiency is frequently labelled in research as a potential source of bias,
especially in relation to personality assessment (Maree, 2002; Meiring, 2007; Owen,
1991; Prinsloo, 1998; Van de Vijver & Rothmann, 2004; Van Eeden et al., 1996). Hence,
language proficiency assessments are widely recommended for cross-cultural
assessments to enhance fair assessment practices (Claassen & Hugo, 1993; Foxcroft,

82
1997; Grieve & Van Eeden, 1997; Maree, 2002; Meiring et al., 2005; Meiring et al., 2006;
Owen, 1991; Prinsloo, 1998; Prinsloo & Ebersöhn, 2002; Van Eeden, 1993; Van Eeden &
Van Tonder, 1995; Van Eeden et al., 1996).
When respondents are psychometrically assessed, they could be disadvantaged when the
language used in the instrument’s instructions differs from the respondent’s home
language (Meyer & Foster, 2008). South Africa, with its multicultural and multilingual
environment, especially needs to combine personality assessment with language
proficiency assessment in order to ensure fair assessment practices (Meiring et al., 2005).
The fairness of the personality instrument can only be justified if the level of
understanding of English of all the respondents assessed is adequate (Meiring et al., 2005).
The role of language and the respondent’s proficiency in the test language was described
by Meiring et al. (2005) as the level of understanding of the words being used, the
understanding of the context and the interrelationships of the words, the understanding
of phrases and idiomatic expressions, double meanings and qualifying words. These are
all aspects that may influence the respondent’s performance on the personality
instrument (Meyer & Foster, 2008). Abrahams and Mauer (1999b), Maree (2002),
McDonald (2011), Prinsloo (1998) and Van Eeden et al. (1996) observed that language
proficiency certainly plays a role when testing non-native speakers of the test language.
Language proficiency, which is a complex construct, has elements of intellectual ability
connected to it and care should be taken to measure it without bias (Van de Vijver &
Rothmann, 2004). According to Verhoeven and De Jong (1992), the first requirement for a
structurally modelled language proficiency test is simplicity. They furthermore warned
researchers not to make language proficiency a multifaceted profile in a multidimensional
space, but rather to test language proficiency on the individuals’ everyday language level.
The emphasis in modern psychometric research is on the impact of race and language as
important moderators of test performance, especially within the South African context
(Abrahams, 1996; Foxcroft, 1997; Heaven & Pretorius, 1998; Van de Vijver & Rothmann,
2004; Foxcroft & Roodt, 2005).

83
Beddell, Van Eeden and Van Staden (1999) recommended that a more rigorous and
unbiased approach should be followed for psychometric assessments in South Africa.
Cross-cultural measurement (in this case cross-language measurement) invariance is
especially important in the South African context, yet it is too often ignored (Burgess,
2002). As South Africa’s language groups are characterised by cultural differences
(Trompenaars & Hampden-Turner, 1998), such validation is critical, particularly if these
measures are to be used in a screening/selection context.
In a study conducted by Foxcroft, Paterson, Le Roux and Herbst (2004) on the needs of
psychological assessment practitioners and test utilisation patterns in South Africa,
practitioners identified the need to address language issues in testing and to adapt tests
for South Africa’s diverse society.
Very little research on equivalence and bias was conducted in South Africa between 1960
and 1984, because of the prevailing apartheid policy (Claassen, 1997; Owen, 1992).
In the current study, language proficiency was measured with two tests, namely a
Reading Comprehension test and a Verbal Reasoning test that were specifically designed
for the government organisation concerned (De Beer, 2004).
3.5 PROPOSED SOLUTIONS FOR MULTICULTURAL AND MULTILINGUAL CHALLENGES
IN PERSONALITY ASSESSMENT
The influence and challenges of working within a multicultural and multilingual
environment are not only a South African problem and have been researched
internationally (Matsumoto, Grissom & Dinnel, 2001; McCrae, 2001; Rolland, 2002;
Triandis & Suh, 2002; Van de Vijver & Leung, 1997; 2001). Measurement invariance across
language groups is possible in any multicultural and multilingual society (Ramsay et al.,
2008). One way to overcome measurement invariance is to develop a personality
instrument in the specific environment where it will be administered. Research results on
the BTI (Taylor & De Bruin, 2006), which was developed in South Africa, confirmed that

84
there is merit in developing psychometric assessment products for specific groups and
making comparisons across groups (emic: within-culture approach), and this also lends
support to the universality of the FFM of personality (Ramsay et al., 2008). A solution
proposed by Meyer and Foster (2008) to attempt to overcome the challenges of doing
personality assessments in a multicultural and multilingual environment is to use multi-
language norms.
3.5.1 Multi-language personality norms
Different language norms can allow a psychologist the freedom to compare individuals to
different sub-groups (language groups) in a target population (Meyer & Foster, 2008).
Generating norms on a single version, form or translation is not a complicated process;
however, to generate norms across multiple forms or translations is much more difficult,;
as scores from different translations should be combined appropriately (Meyer & Foster,
2008). Schmitt, Allik, McCrae and Benet-Martinez (2007) highlighted that observed
differences in mean scores of different cultures may exist not only because of a real
cultural disparity on the trait, but the mean score differences could also be the result of
either inappropriate translations, biased sampling or non-identical response styles of
people from the different cultures.
Meyer and Foster (2008) built their research on the findings of Van de Vijver and
Poortinga (1997), which indicated multiple sources of error and bias inherent to cross-
cultural personality assessment. Meyer and Foster (2008) collapsed the sources of error
in multiple-language assessment into three categories, namely sample differences
(research methodology), translation differences (instrument) and cultural differences
(real differences in latent construct and other cultural influences).
3.5.1.1 Sample differences
Meyer and Foster (2008) found that the sample size can affect observed statistics, and
concluded that statistics tend to ‘stabilise’ at around 600 cases as illustrated in their
research with the Hogan Personality Inventory (HPI) (Hogan & Hogan, 2007).

85
Sample size must be considered in any analysis, especially when integrating samples to
form a single norm across cultures or languages (making true differences notable from
statistical artefacts) and to have a representative workforce norm (Van de Vijver &
Poortinga, 1997).
Secondly, the sample compositions should be focused on having similar language-specific
samples that are representative of the population (Meyer & Foster, 2008).
3.5.1.2 Cultural differences
Cultural differences do not only cause problems with the sampling and translations, but
also influence the distributions of scores (Schmitt et al., 2007). Even though various
studies have focused on examining mean differences in personality assessment (Schmitt
et al., 2007), differences other than latent trait differences should also be considered, for
example the way different cultures or language groups endorse items.
Meyer and Foster (2008) concluded that assessment in multiple language environments
are common and that global norms may be the only practical method of comparing
scores across individuals.
3.5.1.3 Translation differences
Meyer and Foster (2008) noted that many difficulties result from the need to combine
and compare data collected on multiple forms that represent different languages. They
concluded that translations could fundamentally change the form of the original
instrument because of the quality of translation, inconsistencies across languages and
inconsistencies in the cultural relevance of items (Meyer & Foster, 2008).
Van de Vijver and Leung (1997) highlighted strategies for conducting translation as
application (literal translation of items), adaptation (translation with cultural relevance
taken into account) and assembly (entirely new assessment of the same construct in the
target language).

86
3.6 TRANSLATION
In trying to overcome language challenges in assessments, the translation of personality
instruments has been investigated (Brislin, 1986; Geisinger, 1994; Rolland et al., 1998; Van
Eeden & Mantsha, 2007). Various practical problems are experienced especially with
translations in the South African context, due to the large number of official languages
and the paucity of test administrators who speak these languages (Van de Vijver &
Hambleton, 1996). To complicate matters even more, practitioners reported different
dialects and a lack of language standardisation in African languages (Van Eeden &
Mantsha, 2007). Grieve (2005) and Van den Berg (1996) expressed a concern about the
lack of concepts and expressions available to translate personality instruments in a
uniform manner.
Brand (2004) also commented that languages are culturally and epistemologically loaded,
making it difficult to translate indigenous African (collective) terms into Eurocentric
(individualistic) terms. Furthermore, many African languages have a limited lexicon to
describe psychological terms such as emotions, as well as limited descriptive terms to
portray behaviours, traits and social interactions (Nel, 2008).
To highlight the difficulty of correctly translating personality tests, the research of
Heuchert et al. (2000) indicated that the translation of the NEO PI-R into Xhosa was very
difficult, as some items could not be translated due to limited vocabulary. This problem is
found in most indigenous languages that do not have much exposure to certain Western
types of mindset and English informal terminology (Nel, 2008).
From the above discussion, it can be concluded that the translation of psychometric
instruments causes more problems than solutions. Test constructors are faced with the
challenge of developing and/or changing psychometric instruments to be suitable for all
eleven languages in South Africa (Nel et al., 2012). Bedell et al. (1999) highlighted the fact
that the cultures and races are highly diversified in South Africa. Although these linguistic
and cultural differences are well known, there is a lack of understanding of their impact
on psychometric assessment (Nel, 2008).

87
It is widely acknowledged that the translation of psychological instruments involves more
than the mere rewriting of text in another language (Bracken & Barona, 1991; Brislin,
1980; 1986; Geisinger, 1994; Hambleton, 1994). A suitable translation requires a balanced
consideration of psychological, linguistic and cultural influences (Hambleton, 1994; Van
de Vijver & Hambleton, 1996).
Even though guidelines have been developed by the International Test Commission (ITC,
2000) for adapting educational and psychological tests, many problems experienced are
intrinsic to translating tests and solutions for maximising construct equivalence across
languages are still considered necessary (Hambleton, 1994). Practical problems with
regard to the translation of personality instruments in South Africa include the large
number of official languages, the different dialects and a lack of language standardisation,
especially with African languages, which simply intensify over time (Wallis & Birt, 2003).
African languages often lack the concepts and idiomatic expressions required for direct
translations (Grieve, 2005; Van den Berg, 1996).
The translation of specific instruments will be discussed with emphasis on the well-known
16PF, followed by the Big Five and FFM-related instruments.
3.6.1 Translation of the 16PF (5th edition)
A Tshivenda version of the 16PF (5th edition), translated through back-translation design,
was administered to 85 students at the University of Venda for Science and Technology,
Of this group, 92% had Tshivenda as a first language. Van Eeden et al. (1996) found
reasonable differential item-functioning results and acceptable item-total correlations for
the 16PF (5th edition). However, the item analysis resulted in very low reliabilities and
many of the items would have to be excluded to slightly increase already low reliabilities.
The meaning of the items changed when they were translated because of the absence of
similar concepts in the target language, difficulty to translate idiomatic terminology,
confusion or misinterpretation of negative items, and general translation errors (Van
Eeden & Mantsha, 2007).

88
A literal translation proved to be insufficient and the translation of the 16PF (5th edition)
instrument into other African languages seemed not to be a viable solution as the validity
analysis of the translated version proved to be not practical (Van Eeden & Mantsha,
2007).
3.6.2 Translation of the NEO PI-R
As discussed in 2.5.2.2, the NEO PI-R (Costa & McCrae, 1992a) is the most popular and
best-researched measure for assessing the Five-Factor Model across cultures (Boyle,
2008; Heuchert et al., 2000; Hull et al., 2010; McCrae et al., 1996; McCrae et al., 1998;
Rolland et al., 1998; Taylor, 2000; 2004; Zhang & Akande, 2002). The NEO PI-R has been
published in Dutch, French, German, Korean, Spanish, Polish and Portuguese, and
validated translations are available in a number of other languages such as Italian,
Norwegian and even Afrikaans, Southern Sotho and Xhosa (Costa & McCrae, 2003).
Borkenau and Ostendorf (1990) successfully replicated the five-factor model across
gender, instruments and observers. Using the NEO PI (Costa & McCrae, 1985) and
Norman’s (1963) adjective scales, Borkenau and Ostendorf (1990) obtained self-report
and peer-rating data for a set of 256 German adults (128 males and 128 females). A
number of analyses were conducted (factor comparabilities, multitrait-multimethod
analyses using structural equation modelling and confirmatory factor analysis) and these
all provided strong support for the replicability of the five factors across language,
gender, instruments and observers (Borkenau & Ostendorf, 1990).
Taylor (2004) recommended among other that the BTI be translated into Afrikaans and
other indigenous African languages, and that the translatability of the test should be
investigated. To date, no such studies have been found in literature. From the discussions
that follow, it will become clear that the translation of personality instruments measuring
the Big Five does not seem to be a workable solution for the multicultural and
multilingual dilemma.

89
3.6.3 Translation of the Big Five and FFM personality instruments
Considerable disagreement exists in the literature between researchers whose studies
either continue to support the universality of the FFM (Costa & McCrae, 1992) and those
who raise questions on the validity of cross-cultural applications, particularly with regard
to language issues (Allik & McCrae, 2004b; Ashton & Lee, 2005; McCrae & Terracciano,
2005). Even though Allik and McCrae (2004b) were very sceptical about McCrae and
Costa’s (1996) suggestion that personality structure is largely independent from culture,
they concluded that cultural unity was based on the psychic unity of all people and that
the quality of translation, conditions of administration and sampling had little effect on
the results of a personality instrument.
In a study using the emic (within-culture) approach towards the structure of personality
across cultures, Hofstee, Kiers, De Raad, Goldberg and Ostendorf (1997) compared the
Big Five factor structures obtained from Dutch, German and English adjective measures.
By identifying adjectives that were the same in the three measures through back-
translation, Hofstee et al. (1997) conducted a number of analyses to determine the cross-
cultural applicability of the Big Five. There was some evidence for the recurrence of the
Big Five across the three cultures, although it appeared that adjectives do not necessarily
translate well across the three languages (Dutch, German and English). Aditionally, many
of the original adjectives fell out of the joint solution due to the lack of translatability,
which may have limited the range of comparison (Hofstee et al., 1997).
The most definite results in research on the FFM were obtained with translations of the
NEO PI-R (McCrae & Allik, 2002). It was translated into more than 40 languages or dialects
and factorial studies were conducted in more than 30 cultures (McCrae & Allik, 2002). In
every case a reasonable approximtion of the intended structure was found, provided that
adequate samples and appropriate statistical methods were used (McCrae & Allik, 2002).
Even though previous research on the NEO PI-R by McCrae et al. (1998) (which used
translation and back translation) identified poor psychometric properties in some items,
they collected extensive evidence of the universality of FFM personality traits and the

90
effective functioning of the five-factor structure. McCrae et al. (1998) concluded that the
FFM can be seen as a universal structure and should be useful in cross-cultural research.
Translation of personality instruments into indigenous African languages is almost
impossible, as many personality descriptives cannot be translated due to the restricted
vocabularies especially of African languages (Van Eeden & Mantsha, 2007). Attempts
resulted in inaccurate translations and changes in the meaning of the items which
rendered the items difficult to understand and to respond to accurately (Van Eeden &
Mantsha, 2007).
3.7 CROSS-CULTURAL PERSONALITY RESEARCH
Various cross-cultural studies emphasised the need to research the influence of
multicultural environments on psychometric assessments internationally (Matsumoto et
al., 2001; McCrae, 2001; Roland, 2002; Triandis & Suh, 2002; Van de Vijver & Leung, 1997;
2001).
Multicultural assessment was put on the agenda by the promulgation of the Employment
Equity Act, Act 55 of 1998, Chapter 2, and Section 8 (Government Gazette, 1998) in South
Africa. Van de Vijver and Rothman (2004) speculated that the Employment Equity Act was
ahead of everyday practice in South Africa and that psychologists might not be able to live
up to these expectations and requirements. However, they agreed that one of the main
goals of the assessment profession in South Africa is (and should be) to bring current
practice into line with legal requirements, for example by developing new instruments
and by validating existing instruments for use in multicultural groups (Van de Vijver &
Rothman, 2004).
Studies in the South African context have consistently demonstrated the problematic and
negative effects that taking tests in a second language have on test item responses
(Bedell et al., 1999; Foxcroft, 1997; Van de Vijver & Leung, 2001; Van de Vijver &
Rothmann, 2004). Linguistic prejudice must therefore be accepted in the interpreting of
response patterns on any psychometric instrument (Meyer & Foster, 2008).

91
The lexical approach acknowledges the influence of language when new personality
instruments are developed, emphasising that differences in personality should be
represented by a large number of similar but distinct words (generally adjectives) (Saucier
et al., 2000). These words should be used by lay people in everyday descriptions of their
own and others’ personalities (Saucier et al., 2000).
Cross-cultural measurement invariance is especially important in the South African
context, yet it is too often ignored (Burgess, 2002). South Africa’s language groups are
characterised by cultural differences (Trompenaars & Hampden-Turner, 1998), therefore
validation is critical if psychometric measures are to be used in a selection context. Van
de Vijver and Poortinga (1992) suggested that there is an intricate relationship between
culture and test performance, and Van de Vijver and Rothman (2004) emphasised that
any multicultural assessments have to focus on the key concepts of bias and equivalence.
According to the lexical approach, characteristics that are important for understanding
human behaviour can become encoded in language as single terms (Goldberg, 1981).
Thus, extensive research on the influence of language and culture should be done to
ensure that the assessment results are reliable and non-biased. The purpose of many
initial broad lexical studies was to find a classification system (taxonomy) for personality
assessment that was generalisable across languages and cultures (John & Srivastava,
1999).
The differences between self-reported personality traits and national character
stereotypes were later investigated by Terracciano et al. (2005), resulting in the
conclusion that national character does not reflect mean personality trait levels in 49
cultures. This highlighted the fact that the challenges in studying the influence of culture
on personality assessment are far from being resolved.
3.7.1 Trends in language research of general (non-Big Five and non-FFM) personality
instruments

92
Studies on the equivalence of different language and population groups of the 16PF
(SA92) English version showed mixed results. Prinsloo (1992) reported favourable
difficulty and discrimination values for the items, and found that primary and secondary
factor loadings were acceptable and that there were no significant differences in
reliabilities. Van Eeden and Prinsloo (1997) found some culture-specific trends in another
study and reported that this had to be taken into account when results on these factors
are interpreted. For example, the reliability coefficients of all the factors were in most
cases slightly lower for the African language group than for the total group. Van Eeden
and Prinsloo (1997) further concluded that although some differences in the factor
structure were evident, these findings were interpretable in terms of the descriptions by
Cattell (1947).
Prinsloo (1998) found that when researchers controlled for language proficiency, the
differential item functioning and factor analysis was more acceptable. However, De Bruin
et al. (2005) still reported factorial similarity in the second-order factors for Afrikaans,
English and the African language groups (Nguni and Sotho) for the 16PF (SA92).
As mentioned in the previous chapter on personality assessment, Abrahams and Mauer
(1999a, 1999b) reported less favourable results in terms of item-total correlations for the
16PF (SA92). In fact, they found significant differences on item level in respect of how
different cultures responded and unacceptably low internal consistency coefficients on
the primary factors for the black sample. Prinsloo and Ebersöhn (2002) highlighted the
methodological mistakes made by Abrahams and Mauer (1999a, 1999b), which might
have contributed to the negative results.
Nonetheless, Abrahams and Mauer (1999a, 1999b) made valuable contributions to
consider when assessing members of historically disadvantaged groups in South Africa.
These considerations can be summarised as follows:
• Disadvantaged groups tend to be unfamiliar with psychological tests.
• Psychological tests may measure different constructs than those for which they have
been designed and standardised.

93
• All groups in a multicultural society may not have been adequately represented in
the standardisation samples (Abrahams & Mauer, 1999b).
3.7.2 Trends in language research of Big Five and FFM personality instruments
Heaven and Pretorius (1998) conducted a study to investigate whether the language
descriptors of the FFM were adequate when used by a group that did not have English as
their first language. They found that a different pattern of components with significant
loadings emerged for the Sotho-speaking group. Seeing that different cultures and
languages have different rules for using language in different situations, linguistic
prejudice can occur within the same language groups as well as across languages and
cultures (Ntshangase, Kaschula & Anthonissen, 1999).
Heuchert et al. (2000) compared a South African group of students with the American
normative sample for the NEO PI-R as laid out in its manual (Costa & McCrae, 1992). They
extracted the five factors for the South African data and all five factors demonstrated
congruence scores at or above .90. A comparison of the white group with the American
normative groups yielded congruence coefficients at or above .90 for all five factors. The
sample size for the white group was 268 students (Heuchert et al., 2000). However, since
only 92 black students participated in this study – which was not a big enough sample size
for factor analysis – Heuchert et al. (2000) agreed that the weaker fit results for the black
students should be interpreted with caution.
McCrae and John (1992) concluded that the FFM (Costa & McCrae, 1992) and the Big Five
(John et al., 1991) can be used as integrative descriptive models and various research
studies found that the FFM (or the Big Five for that matter) can be generalised across
languages and cultures (Church & Katigbak, 1989; Church, Reyes, Katigbak & Grimm,
1997, John & Srivastava, 1999).
Investigation into the applicability of the Big Five model in the South African population
was done by Heuchert et al. (2000) who administered the NEO PI-R to both black and
white college students.
94
They found evidence for construct equivalence and a clear five-factor solution for both
groups. Taylor (2000) administered the NEO PI-R to employees of a large company and
only had difficulty finding equivalence for one factor, namely Openness, for the African
sample.
The FFM of personality performed very well in various local cross-cultural studies (De
Bruin et al., 2005; Heuchert et al., 2000). De Bruin et al. (2005) reported high levels of
congruence between the second-order factors of the 16PF5 for Afrikaans, English and
indigenous African languages, while the second-order factors of the 16PF5 also correlated
significantly with those of the FFM (Costa & McCrae, 1992). De Bruin et al. (2005) found
this to be very relevant for the diverse South African population and further investigated
the construct comparability of the Big Five in South Africa. The results of their study
corroborated the construct validity of the BTI.
Various lexical studies (Cheung et al., 2001; McCrae & Allik, 2002; McCrae & Costa, 1997;
Paunonen, Zeidner, Enggvik, Oosterveld & Maliphant, 2000) extensively researched the
applicability of the FFM for different cultures and identified it as an effective method to
measure personality across different cultures.
Despite somewhat mixed results, these studies agreed that factors E, A and C almost
always emerge, whereas factors N and O of the Big Five model sometimes do not feature
(Saucier & Goldberg, 2001). Saucier and Goldberg (2001) explained that no clear
conclusion had been reached on the reasons for factors N and O not featuring in all
cultures, and suggested that it may be that these factors are missing in the language
group or merely from the set of adjectives studied. Further research in this regard was
recommended.
De Raad and Peabody (2005) contested the stability of the FFM across cultures and
claimed that while the Big Three are universal (Extraversion, Agreeableness and
Conscientiousness), the Big Five may be restricted to American English and German
speakers. Nevertheless, the Big Five and FFM currently constitute the most reliable way
of identifying and describing personality factors across different cultures (Boyle, 2008;

95
Heuchert et al., 2000; Hull et al., 2010; McCrae et al., 1998; McCrae et al., 1996; Rolland et
al., 1998; Taylor, 2000; 2004; Zhang & Akande, 2002) and was used as basis for the
development of the BTI.
According to Hofstede and McCrae (2004), the evidence supporting the universality of the
factor structure as collected by McCrae et al. (1998) allowed researchers to further
investigate empirically the long-standing questions with regard to personality and cultural
values. They investigated the link between personality traits and dimensions of culture
based on their own previous research. Hofstede’s (1980) earlier studies on the
dimensions of culture at IBM in over 71 countries identified four dimensions of national
culture, namely power distance, uncertainty avoidance, individualism and masculinity:
• Power distance can be defined as the extent to which the less powerful members of
an organisation accept and expect that the power is distributed unequally.
• Uncertainty avoidance indicates a society’s tolerance for ambiguity, in other words a
society’s comfort with unstructured situations.
• Individualism refers to the degree to which individuals are integrated into groups.
• Masculinity can be defined as the distribution of emotional roles between sexes,
especially in terms of values.
The link between personality traits and dimensions of culture was defined from previous
research by McCrae that was included in the studies by Hofstede and McCrae (2004),
McCrae and Costa (1997, 1999, 2003), as well as Costa, Terracciano and McCrae (2001).
They concluded that the same personality factor structure was found in a wide variety of
cultures, that the factors were stable and appeared to be universal throughout most of
the adult life span, and that similar gender differences were found among cultures.
McCrae (2001) explained his view on personality and culture not as a matter of
documenting how culture shapes personality, but rather as how personality traits and
culture interact to shape the behaviour of individuals and social groups.
Hofstede and McCrae (2004) mentioned that personality studies compare individuals,
while cultural studies compare societies, and that any combination of these studies

96
causes its own challenges. Some of these challenges are clear in Oyserman, Coon and
Kemmelmeier’s (2002) study, where they researched the cultural dimensions in
individuals and found notably inconsistent results. A study by Peabody (1985) highlighted
the challenges involved in cross-cultural personality studies long before Hofstede and
McCrae (2004). Peabody (1985) tried to rate national character as reflected by shared
perceptions of the personality traits of the typical member of that culture. Peabody
(1985) also tried to get expert ratings of the ethos itself described in the language of
personality. He found that it was not that easy to assess personality across cultures and
concluded (as McCrae (2001) later reported) that the meaningfulness of mean trait scores
depends on the viability of a series of reasonable assumptions.
Valchev et al. (2011) argued that the language groups of South Africa are very diverse and
cannot be simplified to a dichotomous distinction between ‘black’ and ‘white’.
Meiring et al. (2005) conducted a study on South Africa’s cultural diversity in which they
investigated the construct, item and method bias of certain cognitive and personality
measures used in South Africa. Even though they found low levels of construct bias in
both cognitive measures and both revealed factorial invariance in all the language groups,
less favourable results were reported for the personality measure (15FQ+). Meiring et al.
(2005) concluded that low structural equivalence (for whites, coloureds, Indians and
Ndebeles) and unacceptably low internal consistencies (for the black groups) were
particularly problematic and that the 15FQ+ should be used with caution for selection
purposes.
Even though McCrae and Costa (1997) concluded that the NEO-PI R factor structure has
cross-cultural invariance, methodologists argued that for comparisons among cultures,
more variables should be included – for instance the equivalence of the scales (Van de
Vijver & Leung, 1997).
Many of the existing personality instruments are not appropriate for screening and
selection purposes as they are either imported, not standardised for the South African
population, or standardised mainly for the white segment of the South African population

97
(Taylor, 2004). Ethically and legally the use of personality instruments is problematic in
South Africa because they are generally imported and used without adaptation (Nel,
2008). Research indicates that personality instruments in South Africa are not cross-
culturally applicable, because previously disadvantaged groups were not adequately
represented in the adaptation of imported inventories (Meiring et al., 2006). The current
study will therefore attempt to address this shortage of cross-language research in terms
of the Big Five factors as they are measured with the BTI personality instrument.
The BTI, used in the current study to determine the FFM of personality, was developed in
South Africa and is based on the extensively researched Big Five factors of personality. De
Bruin and Taylor (2005b) provided evidence of good construct validity across South
African cultures and concluded that the BTI has good measurement invariance across the
different language groups in South Africa.
3.8 PERSONALITY RELATED PERSPECTIVES WITHIN CULTURES
Different perspectives on personality within different cultures lead to different
manifestations of personality dimensions (Berry, 2000). Individualism and collectivism are
currently among the most widely researched perspectives in respect of cultural
differences (Hofstede, 2001).
3.8.1 Collectivism versus individualism
Individualism and collectivism have become extremely popular as a way of distinguishing
cultural behaviour (Arce-Ferrer, 2006; Church & Lonner, 1998; Eaton & Louw, 2000;
Triandis & Suh, 2002). These dimensions concern the relationship between the individual
and the group (or collective) in a given society (Hofstede, 2001). Triandis and Suh (2002)
maintained that in collectivist cultures individuals tend to give priority to the goals of the
group rather than to their own goals.
Vogt and Laher (2009) investigated the relationship between the FFM of personality and
individualism and collectivism, as evidence indicated the presence of other factors not
98
addressed in the FFM. Their study consisted of a sample of 176 students from the
University of the Witwatersrand and used the BTI and the Individualism/Collectivism
scale. Vogt and Laher (2009) explored whether the five factors and
individualism/collectivism manifested differently across cultures and whether differences
would be found across race and language groups in South Africa. Results however
indicated that there were no significant differences between the five factors and
individualism/collectivism. In addition, no significant differences were found between
race or language groups for the five factors and individualism/collectivism. Vogt and
Laher (2009) recommended that the same study be repeated with a more representative
sample, as their sample was too small and the grouping together of black, indian and
coloured groups to create comparative samples in terms of magnitude might have
influenced the results. Furthermore, they suggested that a broadly inclusive approach
should be followed to investigate individualism and collectivism, since each of the
approaches to these constructs has its own limitations.
Studies on the NEO PI-R in cross-cultural situations found significant differences in the
FFM between Western and Asian cultures (Church, 2000; Cheung et al, 2001; Cheung,
2004; McCrae & Terraccianno, 2005). McCrae (2004) attributed this finding to the
differences between the individualistic societies of the Western and the collectivist
societies of Asia (McCrae, 2004; Rolland et al., 1998).
A study by Van Dyk and De Kock (2004) hypothesised that white and coloured officers in
the South African National Defence Force (SANDF) would be more individualistic, while
black officers would be more collectivistic. However, no significant differences were
found in attitude towards individualism and collectivism between the black, coloured or
white groups. Van Dyk and De Kock (2004) argued that these findings were due to the fact
that student populations had been found to be more individualistic in nature, due in part
to their shared exposure to similar education (Eaton & Louw, 2000; Van Dyk & De Kock,
2004). In support of this view, Oyserman et al. (2002) argued that the demands of an
academic environment foster individualism, since the focus is on individual striving,
competition and the realisation of one’s own potential.

99
3.9 LANGUAGE AND THE DEVELOPMENT OF THE BTI
Van Eeden and Mantsha (2007) commented that the content of items is culture bound,
regardless of the language in which the instrument is presented. Language gives
expression to the behaviour related to the personality concept that is measured,
therefore the contents of the items are directly linked to the culture in which the test was
developed (McCrae, 2001).
Foxcroft, Paterson, Le Roux and Herbst (2004) researched test utilisation patterns and the
needs of psychological assessment practitioners in South Africa. The practitioners clearly
indicated two needs, firstly to adapt tests for South Africa’s diverse environment and
secondly to address language issues in testing. Foxcroft (2004) attributed the problem of
a shortage of locally developed tests to a significant shortage of experienced test
developers in South Africa.
Taylor (2004) identified the need to establish an instrument for personality assessment in
South Africa that would be suitable for cross-cultural use. She reported that the variety of
cultures and languages present in South Africa influenced this task to an enormous
extent; therefore the similarities and differences between different language and culture
groups had to be understood to identify meaningful personality constructs and to develop
appropriate items for a personality instrument. The integrity of the BTI was strictly
controlled to ensure all moderator variables, as possible sources of bias, were eliminated
(Taylor & De Bruin, 2006).
Taylor and De Bruin (2006) developed the BTI as a culturally valid personality inventory
based on the FFM (Costa & McCrae, 1992) for use in South Africa. Similar factor
structures and acceptable reliabilities were found across samples from African and
European descent (Taylor & De Bruin, 2006). Further analysis indicated that the BTI
demonstrated a practical level of measurement invariance across the Nguni, Sotho and
Pedi language groups (Ramsay et al., 2008). The current study further explores the
influence of language on personality assessment by adding the levels of English
proficiency and investigating the impact that both these independant variables may have

100
when the English version of the BTI is administered to South Africans with diverse home
languages.
3.10 SUMMARY
In this chapter the awareness and understanding of issues related to language and
cultural differences were emphasised, as well as the importance of creating a society that
is tolerant of different languages and cultures in a multicultural and multilingual society
such as South Africa. The country is known for its diversity and therefore South African
psychologists need to be sensitive to all the different aspects that affect responses to
personality instruments.
According to Van de Vijver and Rothman (2004, p. 2), research regarding equivalence and
bias in South Africa is still in a stage of infancy. Various studies have been conducted since
then (De Bruin et al., 2005; Meiring et al., 2005; Ramsay et al., 2008; Taylor, 2004; 2008),
but still not enough evidence is available about the impact of language on personality
assessment with the BTI to live up to the demands set by the Employment Equity Act
(Government Gazette, 1998).
Different solutions to the multicultural and multilingual challenges have been
investigated, but still the best solution seems to be the development of a unique South
African personality instrument, as the translation of imported instruments regularly
results in more challenges than solutions (Grieve, 2005; Hambleton, 1994; Van de Vijver &
Hambleton, 1996; Van den Berg, 1996; Van Eeden et al., 1996; Van Eeden & Mantsha,
2007). Since various cross-language and cross-cultural studies have indicated that the Big
Five and FFM personality factors are very relevant to personality measurement in South
Africa, Taylor and De Bruin (2006) decided to use them as a basis for the development of
the BTI.
To limit any adverse impact on personality assessments, it is advisable to include English
proficiency tests so as to ensure the respondents’ correct understanding of the
personality-related questions (Meyer & Foster, 2008).
101
CHAPTER 4: METHODOLOGY
4.1 INTRODUCTION
Finding the same Five-Factor Model (FFM) across cultures does not necessarily mean that
a raw score has the same interpretation across cultures, in other words measurement
equivalence. The NEO PI-R researched by Costa and McCrae (1976, 1985, 1988a, 1988b,
1992a, 1992b) demonstrated that the same personality traits can be reliably captured
across cultures. Still, when evidence is found that the same traits are being measured
across cultures, it does not necessarily mean that the interpretations of the scores across
cultures are the same.
In addition to response styles such as extreme response style and acquiescence, there
seems to be true personality characteristic differences between cultures. Allik and
McCrae (2004b) found that respondents from European and North American cultures
were more Extroverted, Open to new experience and less Agreeable than were people
from Asian or African cultures. McCrae and Terracciano (2005) partially replicated these
findings by showing higher levels of Extroversion and Openness to experience among
European and Americans (North and South) as compared to Asians and Africans.
Furthermore, they reported that scale variances differed by culture, with Western
cultures showing greater variability. The results were not attributable to acquiescence
and possibly not to extreme responding. By using observer ratings, it was hoped that the
tendency in some cultures toward modesty in self-presentation would be minimised
(McCrae & Terracciano, 2005).
Locally, different methods have been used to evaluate the impact of language on the
measurement of personality and personality instruments. Abrahams (1996), for example,
took words from items in the 16PF, asked respondents to write synonyms for these
words, and subsequently scored their responses by using a dictionary. Wallis and Birt
(2003) used the same words as Abrahams (1996), but scored the responses according to
informal language and everyday English meanings, thereby allowing credit for words that
were not technically correct.

102
However, the methodology in these studies was criticised by Prinsloo and Ebersöhn
(2002). McDonald (2011) conducted similar research using the latest version of the 16PF,
namely the 16PF5, and in her study students had to choose synonyms from multiple-
choice options. Although different methodologies as recommended by Prinsloo and
Ebersöhn (2002) were used by McDonald (2011), she reported that there was still a
significant difference in the 16PF5 results – when the native English-speaking and non-
native English-speaking groups were compared, and also when a black group and a white
group were compared. She reported a statistically significant relationship between
students’ academic literacy levels and their scores achieved on the 16PF5. Based on these
results, McDonald (2011) reported a significant relationship between students’ academic
literacy levels and their scores on the 16PF5. She concluded that English language
proficiency certainly plays a role when testing non-native speakers of the test language.
The purpose of the current study was to expand on research by Taylor (2008) and to
further investigate the impact that different languages may have on response patterns on
the BTI and to enhance the accurate measurement of personality in a multicultural and
multilingual environment such as South Africa. The current study differs from that of
Abrahams (1996), Wallis and Birt (2003) and McDonald (2011) in terms of the
methodology used. Words were not taken from the personality instrument to check
respondents’ level of understanding, and a different personality instrument was used,
namely the BTI instead of the 16PF. In addition, two English proficiency tests were
administered and the combined score for these two tests was added as another
independent variable that could influence response patterns on the BTI.
English proficiency was measured by means of two tests – a Reading Comprehension test
and a Verbal Reasoning test – to measure the level of respondents’ understanding of
English as administration language of the BTI. The sample was divided into two groups, a
low English proficiency group and a high English proficiency group, based on their
performance in these two tests combined and reflecting their understanding of English.
The two groups were constituted by taking those scoring in the upper quartile (25%) and
in the lower quartile (25%) of the combined raw scores. The high performers in the
English proficiency tests (upper 25%) were compared to the low performers (bottom

103
25%) for each South African home language group. The influence of these two extreme
English proficiency groupings on the dependent variable (responses on the BTI personality
instrument) was analysed in the current study.
The methodology and data analysis procedures are discussed next. The instruments used
and the composition of the sample, as well as the procedures that were followed in the
data collection and analyses are described. Some basic CTT procedures and some
advanced MTT methods, specifically Rasch analysis methods, were used and are also
explained in this chapter.
4.2 PSYCHOMETRIC INSTRUMENTS
4.2.1 Instruments for measuring English proficiency
There is no general, universally accepted definition of language proficiency; therefore
Chomsky’s (1965) description of ‘linguistic competence’ as ‘the knowledge of the
grammar of a resident speaker’s language’ will be used. The knowledge of English
grammar, as well as the respondents’ ability to read and write English was assessed with
a reading comprehension test and a verbal reasoning test (De Beer, 2004). Both were
specifically developed for the government organisation to use during the screening and
selection of potential applicants.
Posel and Zeller (2010) report that the National Income Dynamics Study (NIDS), a new
household survey done in 2008, focused more on linguistic ability in the individual’s home
language and English than did the census of 2001. This is particularly important in South
Africa where many citizens are able to speak, read and write more than one language,
although at different proficiency levels. This NIDS collected not only socio-economic
information, but also information on how well individuals are able to read and write both
their home language and English. Posel and Zeller (2010) summarised the findings from
the NIDS and concluded that self-assessed reading and writing ability are highly
correlated and that individuals typically report significantly higher ability in their home
language. Furthermore, they remarked that those individuals who reported good reading

104
and writing ability in their home language also reported good reading and writing ability
in English (Posel & Zeller, 2010).
Carroll (1968) tried to conceptualise the domain of language proficiency by reporting that
various different aspects should be measured in respect of linguistic competence and
performance, specifically modularity of mind, underlying cognitive operations, the
process of reading and the process of writing. Although various different opinions exist
about the dimensions that influence language proficiency (Carroll, 1968; Perfetti, 1985),
Verbal reasoning and reading comprehension always feature as important dimensions.
For the purposes of the current study, it was therefore decided to assess these two
dimensions as an indication of a respondents’ general level of English proficiency.
4.2.1.1 Reading comprehension
Job-specific psychometric assessments are enforced by the Employment Equity Act
(Government Gazette, 1998), stating that any psychometric assessments should be based
on the inherent requirements of the job. Sandoval, Frisby, Geisinger, Scheuneman and
Grenier (1998) elaborated on the standards of employment testing in saying that the level
of English proficiency required should not exceed the level of English required for the
relevant occupation or profession. Since test distributors were not able to provide a
psychometric instrument to measure the level of English proficiency in the government
organisation from which the sample was taken, a tender process was followed to attract
test developers to develop instruments for measuring reading comprehension and verbal
reasoning on the language level of the training material in this government organisation.
Olson (1977) stated that a reading comprehension instrument must measure the reader’s
linguistic abilities and not depend on any other cues or represent any dimensions other
than reading and comprehension ability. He stressed the importance of identifying
whether respondents can make inferences from a paragraph that they read. The reading
comprehension test used in the current study was developed for the government
organisation by taking three paragraphs from the basic training modules and asking
multiple-choice questions based on the content of these paragraphs.

105
The reading comprehension test required of the applicant to read the paragraphs and
comprehend the material in order to answer 30 multiple-choice questions (De Beer,
2004). A time limit of 20 minutes was given for the completion of these questions (De
Beer, 2004).
4.2.1.2 Verbal reasoning
Verhoeven and De Jong (1992) stated that verbal ability is crucial for measuring language
proficiency as it is an indication of human intelligence. The model of Thurstone (1938) on
language performance has seven primary mental abilities of which at least two are
explicitly verbal, namely ‘verbal comprehension’ and ‘verbal fluency’. The use of a verbal
reasoning test as part of a selection battery not only gives an indication of language
proficiency, but also of the mental abilities of the candidate (Verhoeven & De Jong, 1992).
For this reason, a verbal reasoning instrument was included in the selection battery to
measure applicants’ level of English proficiency.
General reasoning ability based on verbally formulated material formed the basis of the
verbal reasoning test, while numerical reasoning and the ability to read graphs were
included to measure respondents’ ability to do verbal reasoning in different domains to
find a solution to problems (De Beer, 2004). The verbal reasoning test consisted of 45
multiple-choice questions to be completed within a time limit of 35 minutes. In this test it
was assumed that the respondents have the ability to interpret verbally constructed
questions and problems in a logical manner and to draw appropriate conclusions as an
indication of their verbal reasoning ability (De Beer, 2004).
De Beer (2004) conducted research on the validity and reliability of both English
proficiency instruments (i.e. Reading Comprehension and Verbal Reasoning). Coefficient
alphas for these instruments were reported as follows: Reading Comprehension had a
mean alpha of .80 and Verbal Reasoning had a mean alpha of .83, for a sample size of
1 972 trainees in the government institution’s training college (De Beer, 2004).
106
4.2.2 Basic Traits Inventory (BTI) for measuring personality
Organisational productivity and competitiveness are directly related to the performance
of its employees (Sutherland, De Bruin & Crous, 2007). To outperform competitors,
organisations need to identify situational and dispositional factors that influence the
employees’ performance (Rothman & Coetzer, 2003). Dispositional factors include
personality characteristics, needs, attitudes, preferences, etc. (Douglas, Frink & Ferris,
2004; Mount et al., 1999). Identifying important personality characteristics and measuring
them before enlistment can improve employee satisfaction and job performance by
matching individual personality characteristics with the demands of the particular job
(Barrick & Mount, 1991; Rothmann & Coetzer, 2003). Employees of the government
organisation used in the current study may well be exposed to many traumatic incidents
during a working day and therefore psychologists identified the BTI as an appropriate
personality instrument to measure the required personality characteristics for
employment. One of these is low Neuroticism scores, which includes the facets Affective
instability, Anxiety, Self-consciousness and Depression. The BTI measures the Big Five
personality factors identified by Costa and McCrae (1988).
As indicated repeatedly, the personality instrument used in the current study is the BTI
(Taylor & De Bruin, 2006). It is a self-report instrument consisting of 193 items, without a
time limit, but generally it requires approximately 30-45 minutes to complete (Taylor &
De Bruin, 2006). The statements are answered on a five-point scale ranging from strongly
disagree (1) to strongly agree (5). The BTI measures the Big Five personality factors in
terms of Extraversion, Neuroticism, Openness to experience, Conscientiousness and
Agreeableness, and each of the five factors has five facets, except for Neuroticism, which
has four (Taylor & De Bruin, 2006). The factor analysis for determining the construct
validity of the BTI demonstrated a satisfactory fit with the FFM of personality (Taylor,
2004). Cronbach alpha coefficients reported by Taylor (2004) were αE=.89, αN=.95, αC=.92,
αO=.87 and αA=.90.
In another study by Taylor and De Bruin (2006), the BTI also demonstrated good
reliabilities, and Cronbach alpha coefficients were reported for Extraversion (36 items,

107
αE=.87), Neuroticism (34 items, αN=.93), Conscientiousness (41 items, αC=.93), Openness
to experience (32 items, αO=.87), and Agreeableness (37 items, αA=.89). Various studies
provided evidence of the construct validity of the BTI across different cultures, as well as
some evidence of predictive validity and measurement invariance across different
language groups in South Africa (De Bruin & Taylor, 2005b; Taylor, 2008).
When Taylor (2008) conducted research on the influence of home language on the
assessment of personality with the BTI, the BTI was administered only in English, and no
test for English proficiency was administered, as was the case in the current study. Taylor
(2008) divided the home languages into the following three groups for comparison:
English, Afrikaans, and indigenous African languages. Although there are eleven official
languages in South Africa, many of the indigenous South African languages have a similar
origin and grammatical structure and such similar languages were combined to enlarge
the sample size per language group. Taylor (2008) reported very high internal
consistency reliabilities, indicated by the Cronbach alpha coefficient and the person-
separation index (PSI) calculated through Rasch analysis. The PSI describes the number of
levels that could be created for people with different abilities, thus it indicates how
efficiently a set of items can separate persons measured in terms of their abilities. This
results in a linear comparison of ‘Hard’ and ‘Easy’ tests (Wright & Stone, 1999). The
reliability estimates were very similar across the CTT (Cronbach alpha) and MTT
methods, and the Rasch analysis (Person Separation Index) for the Big Five factors of
the BTI, as well as for the different Big Five factors (Extraversion (α=.90; PSI=.89),
Neuroticism (α=.94; PSI=.93), Conscientiousness (α=.94; PSI=.92), Openness to
experience (α=.88; PSI=.85), and Agreeableness (α=.88; PSI=.86)) (Taylor, 2008).
However, some problems were encountered when internal consistency reliabilities were
calculated for the different facet scales across the gender, race and language groups in
Taylor’s (2008) study. In terms of bias, she reported very slight statistically significant
differences and suggested that further studies be conducted before decisions are made
on excluding factors and/or items from the BTI, especially for South African use.
Taylor (2008) identified several items with possible bias between Afrikaans, English and
indigenous African languages: 15 of the 36 items from the factor Extraversion, 13 of the

108
34 Neuroticism items, 18 of the 41 items for Conscientiousness, 14 of the 32 Openness
to experience items and 11 of the 37 items from the Agreeableness factor had significant
differential item functioning (DIF) contrast values. The current study investigated the
item bias of the BTI items for much larger samples of respondents for all of the eleven
official home languages and also considered the different levels of English proficiency.
Ramsay et al. (2008) conducted a measurement invariance test on the BTI for three
indigenous African language groups and concluded that the BTI was invariant across
these three groups. This suggested that combining indigenous African language groups
would not introduce too much error variance when doing cross-cultural comparisons
(Ramsay et al., 2008). Nevertheless, in the current study the sample sizes for the eleven
language groups were large enough to perform bias and equivalence analysis for each
language and to investigate the impact that these different home languages might have
on response patterns to the BTI items.
4.3 THE SAMPLE
The sample for the current study was derived from a database that has accumulated over
a period of two years (2008 and 2009). The sample consisted of 105 342 persons who
applied to be employed by the particular government organisation. All applications were
for similar entry-level functional positions within this government organisation.
One requirement for applicants was that they should have passed at least Grade 12. It has
been shown that education has a discernible effect on responses to paper-and-pencil
personality instruments (Meiring et al., 2005). Informed consent was another prerequisite
for participating in the assessment session.
Barrett (2007) suggests that relatively large sample sizes (numbers of N>200) be used in
each culture group, especially for Confirmatory Factor Analysis (CFA) in cross-cultural
research, so as to prevent technical problems (violation of normality, missing data, etc.).
It is paramount for cross-cultural researchers to work with adequately large samples to
obtain stable factor structures that can then be examined for equivalence (Fischer, 2004).
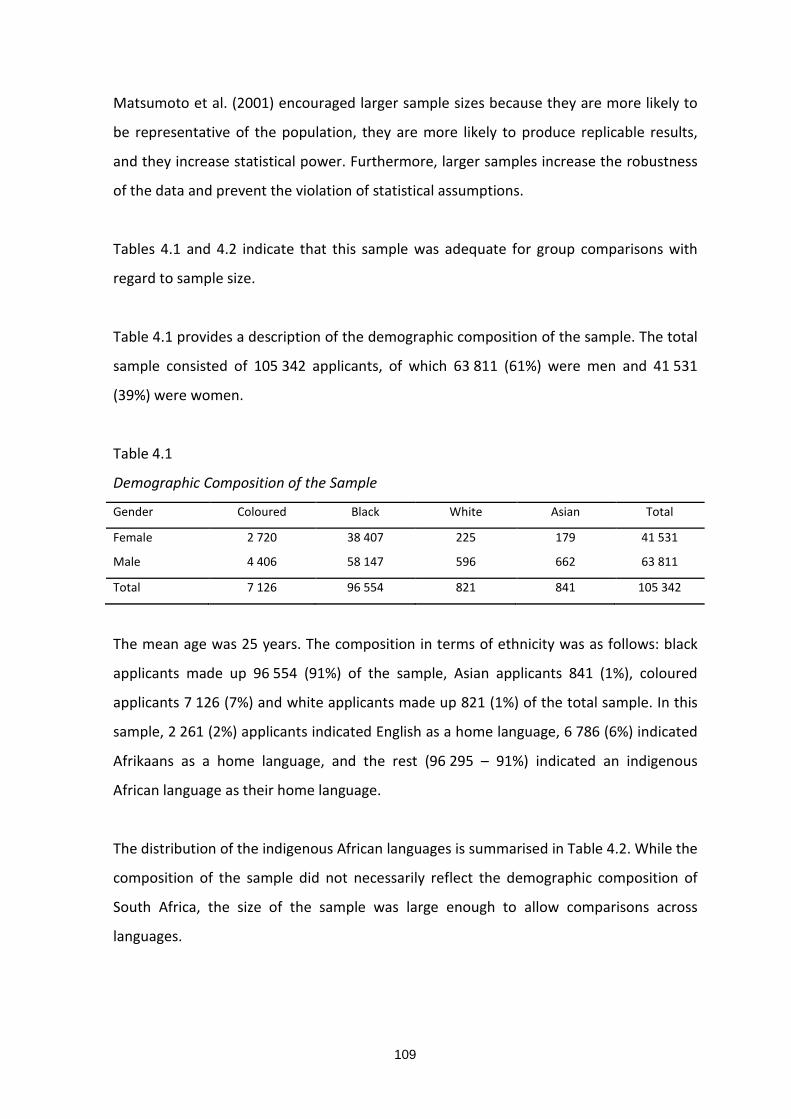
109
Matsumoto et al. (2001) encouraged larger sample sizes because they are more likely to
be representative of the population, they are more likely to produce replicable results,
and they increase statistical power. Furthermore, larger samples increase the robustness
of the data and prevent the violation of statistical assumptions.
Tables 4.1 and 4.2 indicate that this sample was adequate for group comparisons with
regard to sample size.
Table 4.1 provides a description of the demographic composition of the sample. The total
sample consisted of 105 342 applicants, of which 63 811 (61%) were men and 41 531
(39%) were women.
Table 4.1
Demographic Composition of the Sample
Gender Coloured Black White Asian Total
Female 2 720 38 407 225 179 41 531
Male 4 406 58 147 596 662 63 811
Total 7 126 96 554 821 841 105 342
The mean age was 25 years. The composition in terms of ethnicity was as follows: black
applicants made up 96 554 (91%) of the sample, Asian applicants 841 (1%), coloured
applicants 7 126 (7%) and white applicants made up 821 (1%) of the total sample. In this
sample, 2 261 (2%) applicants indicated English as a home language, 6 786 (6%) indicated
Afrikaans as a home language, and the rest (96 295 – 91%) indicated an indigenous
African language as their home language.
The distribution of the indigenous African languages is summarised in Table 4.2. While the
composition of the sample did not necessarily reflect the demographic composition of
South Africa, the size of the sample was large enough to allow comparisons across
languages.
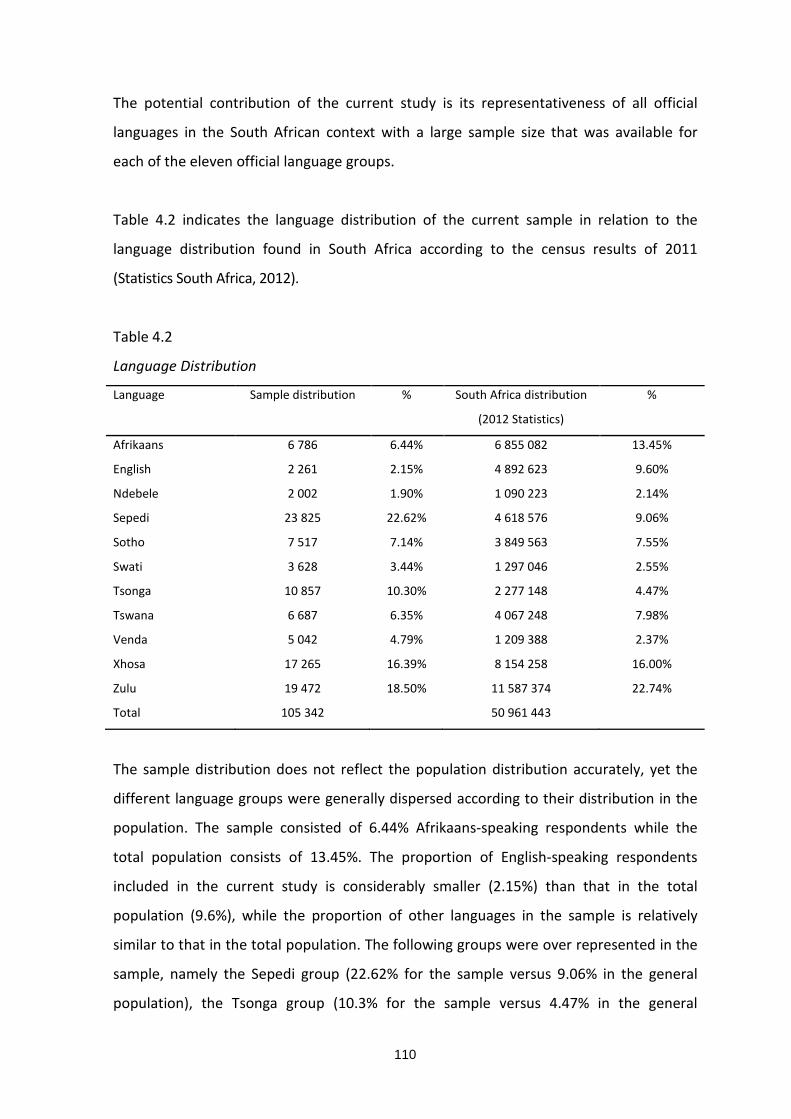
110
The potential contribution of the current study is its representativeness of all official
languages in the South African context with a large sample size that was available for
each of the eleven official language groups.
Table 4.2 indicates the language distribution of the current sample in relation to the
language distribution found in South Africa according to the census results of 2011
(Statistics South Africa, 2012).
Table 4.2
Language Distribution
Language Sample distribution % South Africa distribution
(2012 Statistics)
%
Afrikaans 6 786 6.44% 6 855 082 13.45%
English 2 261 2.15% 4 892 623 9.60%
Ndebele 2 002 1.90% 1 090 223 2.14%
Sepedi 23 825 22.62% 4 618 576 9.06%
Sotho 7 517 7.14% 3 849 563 7.55%
Swati 3 628 3.44% 1 297 046 2.55%
Tsonga 10 857 10.30% 2 277 148 4.47%
Tswana 6 687 6.35% 4 067 248 7.98%
Venda 5 042 4.79% 1 209 388 2.37%
Xhosa 17 265 16.39% 8 154 258 16.00%
Zulu 19 472 18.50% 11 587 374 22.74%
Total 105 342 50 961 443
The sample distribution does not reflect the population distribution accurately, yet the
different language groups were generally dispersed according to their distribution in the
population. The sample consisted of 6.44% Afrikaans-speaking respondents while the
total population consists of 13.45%. The proportion of English-speaking respondents
included in the current study is considerably smaller (2.15%) than that in the total
population (9.6%), while the proportion of other languages in the sample is relatively
similar to that in the total population. The following groups were over represented in the
sample, namely the Sepedi group (22.62% for the sample versus 9.06% in the general
population), the Tsonga group (10.3% for the sample versus 4.47% in the general

111
population) and the Venda group (4.79% for the sample versus 2.37% in the general
population). Convenience sampling techniques were used and even though the different
language groups were large enough for further analysis, they cannot necessarily be
considered representative of the total population. Random selection was not used and
the particular group of applicants is not necessarily representative of the total South
African population.
4.4 RESEARCH DESIGN
There is a multitude of possibilities regarding the independent variables to be compared
when investigating measurement bias (Taylor, 2008). One of these is a differential
research design which is used when the independent variable cannot be manipulated
experimentally, in other words it occurs naturally (Taylor, 2008). The independent
variable for the present study represents the grouping that is of most concern to South
African psychologists in assessment scenarios, namely sub-groups based on the eleven
official languages of this country. Additionally, English proficiency was added as an
independent variable based on a combination of the reading comprehension and verbal
reasoning raw scores.
4.5 THEORETICAL BASIS FOR MEASUREMENT
There are two major measurement theories regarding the analysis of assessment
measures, namely CTT and MTT. Standardised assessment measures are increasingly
developed using MTT methods due to the more theoretically justifiable measurement
principles and the greater potential to solve practical measurement problems (Embretson
& Reise, 2000). MTT is more item oriented and an individual’s performance on an item
can be predicted by his/her ability or standing on the latent trait in relation to the
endorsability of the item (Henard, 2000). The current study neither focused on the
comparison of the theories nor tried to render a theory redundant, but the focus was
more on the MTT methods – specifically Rasch analysis – as an extension of CTT findings
about evaluating the impact of language on BTI responses and ultimately the fair use of
112
the BTI in South Africa. The CTT and MTT will be discussed shortly to provide a basis for
understanding these analysis methods, especially those used in the current study.
4.5.1 Classical test theory (CTT)
CTT is often referred to as the traditional theoretical basis for measurement (Urbina,
2004). The basic assumption in CTT is that the score that an individual obtains on a test
(observed score) reflects his/her true standing on the latent construct or trait measured
(true score) plus measurement error (Urbina, 2004).
According to Embretson and Reise (2000), the following assumptions are made about
error in the CTT:
• Error is assumed to be random.
• Error is not related to other variables.
• Standard error of measurement is assumed to be normally distributed within persons
and homogeneously distributed across persons. It means that if an individual were to
take a test an infinite number of times, the distribution of his/her observed scores
would likely be bell-shaped, the mean would indicate the individual’s true score, and
the dispersion would indicate the distribution of random error.
CTT methods are fairly clear-cut and easy to perform, but have a number of limitations
(Henard, 2000; Urbina, 2004). The most noticeable limitation is that the characteristics of
the test cannot be separated from the characteristics of the respondent (Taylor, 2008).
Henard (2000) and Fan (1998) explain that the person statistics are item dependent while
the item statistics are sample dependent. They refer to it as circular dependency – if a
instrument is labelled as ‘difficult’, test-takers may appear to have lower ability, and if a
group of respondents all have high levels of ability, the instrument may wrongly be
labelled as ‘easy’. The second limitation is that the CTT tends to be measure oriented,
rather than item oriented (Henard, 2000). Using only CTT methods cannot provide test
distributors with the significant information to predict how an individual would respond
to a single item of the instrument.
113
Test developers would not be able to target particular levels of ability or compare
performance of individuals on different items, as would be the case when MTT is used
(Henard, 2000).
4.5.2 Modern test theory (MTT)
MTT was developed mainly as a result of limitations and assumptions associated with CTT
(Henard, 2000), especially the limitation that the characteristics of the test cannot be
separated from the characteristics of the respondent (Taylor, 2008). In addition, MTT
provides information for decision making that is not available through CTT (Henard,
2000).
Item Response Theory (IRT), as a MTT method, is a model-based measurement theory in
which trait level estimates depend on person responses and the psychological properties
of the items, in other words a more inclusive description of the assessment situation in
terms of respondents and items (Embretson & Reise, 2000). This provides instrument
score interpretation that can be associated with the underlying traits of the person tested
(Taylor, 2008).
Rasch analysis, as another MTT method, which has two basic assumptions, namely local
independence (responses to the measurement items are independent of one another)
and unidimensionality (only one latent trait is measured) (Embretson & Reise, 2000).
According to Rasch, the performance of an individual on an item can be predicted by
his/her ability (or standing on a latent trait) and the relationship between the difficulty (or
endorsability) of the item (Henard, 2000).
4.6 COMPARISON OF MEASUREMENT THEORIES
A major difference between CTT and MTT, is that CTT tends to focus on the total score of
the instrument, while MTT tends to focus on the individual items and the person the test
is being administered to (Urbina, 2004).
114
Hambleton et al. (1991) identify the following limitations of CTT:
• Ability scores of respondents are item dependent (i.e. they depend on the item
difficulties).
• The item statistics (difficulty, discrimination, reliability) are respondent dependent.
• Discrimination indices as well as reliability estimates tend to be higher in
heterogeneous respondent groups than in homogeneous ones.
• No information is available about how respondents with specific abilities might
perform on a certain test item.
• Equal measurement error is assumed for all respondents (this measurement error is
item dependent).
• Classical item indices are not invariant across subpopulations (i.e. different subgroups
of the sample of respondents give different item statistics).
MacDonald and Paunonen (2002) demonstrated similarities in results obtained through
CTT and MTT. These similarities were identical to those found by Lawson (1991) and Fan
(1998), which seems to discredit the assumption that CTT methods are inferior to MTT in
producing person-invariant item statistics. CTT set the principles for measurement
development, therefore many MTT supporters refer to CTT as the old rules of
measurement (Embretson & Reise, 2000).
Since MTT principles were developed by mathematicians (Fischer, 1973; Lord, 1968; 1975;
1980; Rasch, 1960; Wright & Stone, 1979), their applicability to psychology have not
always been recognised. Rene Dawis and David Weiss, professors at the University of
Minnesota, first investigated the applicability of MTT on applied psychological
measurement in the late 1960s and early 1970s (Embretson & Reise, 2000) and
highlighted the potential of these methods to improve psychological measurement. Lord
and Novick (1968) tried to provide continuity between the ‘new’ and the ‘old’ test theory
(CTT); however Embretson and Reise (2000) stated that some well-known rules of
measurement can no longer be applied as they are fundamentally different from the ‘old
rules’.

115
Table 4.3
‘Rules’ of Measurement
CTT (Old Rules) MTT (New Rules) i. Standard error of measurement applies to all
scores in population. i. Standard error of measurement differs across
scores (response patterns) but generalises across populations.
ii. Longer tests are more reliable. ii. Length of test does not influence reliability. iii. Comparing test scores across multiple forms is
optimal when forms are parallel. iii. Comparing test scores across multiple forms is
optimal when test difficulty levels vary between persons.
iv. Unbiased estimates of item properties depend on having representative samples.
iv. Unbiased estimates of item properties may be obtained from unrepresentative samples.
v. Test scores obtain meaning by comparing their position in a norm group.
v. Test scores have meaning when they are compared for distance from items.
vi. Interval scale properties are achieved by obtaining normal distributions.
vi. Interval scale properties are achieved by applying justifiable measurement models.
vii. Mixed-item formats lead to unbalanced impact on test total scores.
vii. Mixed-item formats can yield optimal test scores.
viii. Change scores cannot be meaningfully compared when initial score levels differ.
viii. Change scores can be meaningfully compared when initial score levels differ.
ix. Factor analysis on binary items produces artifacts rather than factors.
ix. Factor analysis on raw item data yields a full information factor analysis.
x. Item stimulus features are unimportant compared to psychometric properties.
x. Item stimulus features can be directly related to psychometric properties.
(Embretson & Reise, 2000, p. 15)
In Table 4.3 the ‘old’ and ‘new’ rules are compared to illustrate the similarities and
differences between CTT and MTT, and to highlight the advantages of using both.
In the current study both theories were used to investigate the impact of language on the
response patterns of the BTI. From the CTT, MANOVA analysis with Scheffe post-hoc
analysis were administered to determine whether language and English proficiency
impacted on the BTI factors.
Wright and Mok (2004) stated that only Rasch measurement models can produce linear
measures, overcome missing data, give estimates of precision and have devices of
detecting misfit. Therefore Rasch analysis methods, from the MTT, were applied to
investigate the impact of language and English proficiency on the responses to each item
of the BTI.

116
4.7 DATA ANALYSIS TECHNIQUES
Paper-and-pencil psychometric instruments were administered to all repondents, and
responses were marked on optical reader forms and captured with an optical reader. The
optical reader helps to minimise human error and improves the speed at which the data
is captured. The captured data was processed in Statistica (version 6, 2003) and basic
descriptive statistics were obtained. The data was saved in Excel (Microsoft Office
Professional Plus, 2007) and transferred into Winsteps (version 3.74, 2011) for the Rasch
analysis techniques. All MTT procedures were performed in Winsteps (version 3.74,
2011).
4.8 STATISTICAL ANALYSIS
A number of different statistical techniques were used in the present study, especially
from the MTT genre. MTT provides the best justifiable measurement scale properties that
have a significant influence on inferential statistics (Embretson & Reise, 2000). The main
objective of the current study was to identify the impact that different languages have on
the endorsement of items and to indicate differential item functioning or item bias of
items of the BTI for the eleven official language groups in South Africa.
4.8.1 Descriptive statistics
The minimum, maximum, mean and standard deviation values are given to describe the
data set that was used during the analysis. The mean value is an indication of the central
tendency of the measure (Forshaw, 2007), in other words it is an indication of the value
after summing all the values and dividing the total by the number of cases in the
distribution (Urbina, 2004). The standard deviation or square root of the variance gives an
indication of the spread of the responses in relation to the mean value (Forshaw, 2007). A
low standard deviation will indicate tightly packed scores around the mean (leptokurtic)
while a high standard deviation indicates widely distributed responses (platykurtic)
(Forshaw, 2007).

117
Many statistical tests assume that the data distribution is normal; therefore the
dispersion of the responses per factor needs to be investigated (Miles & Banyard, 2007).
The Kolmogorov-Smirnov statistic assesses the normality of the distribution of scores. A
non-significant result (p>.05) indicates normality and significant values (p<.05) suggest
violation of the assumption of normality, which is quite common in larger samples
(Pallant, 2010). Hill and Lewicki (2006) however stipulate that normal distribution-based
tests can still be used if the samples are large enough (n>100), which is the case in the
current study.
The emphasis of the current study was on MTT, specifically Rasch analysis, to identify if
there are different response patterns on the BTI for the different languages and the
different levels of understanding of the administration language, namely English
proficiency. A short summary of the descriptive statistics is given to assist in
understanding of the data used in the analysis.
4.8.2 Multivariate analysis – MANOVA
MANOVA is a multivariate analysis of one or more continuous or categorical independent
variables (home language - categorical and English proficiency - continuous) and their
impact on related continuous dependent variables (BTI factors) in terms of the
significance of the difference between the mean scores that are compared (Pallant,
2010). MANOVA measures whether group membership produces significant differences
in responses and when it does, that combination of variables can be used to differentiate
among groups (Tabachnick & Fidell, 1983).
According to Tabachnick and Fidell (1983, p. 292) three F-ratios are obtained in a two-way
ANOVA (MANOVA):
• The first F ratio indicates whether the first independent variable (home language) has
a significant main effect on the dependent variable (BTI factors).
• The second F ratio indicates whether the second independent variable (English
proficiency) has a significant main effect on the dependent variable (BTI factors).

118
• The third F ratio indicates the interaction between the two independent variables and
whether they have a significant effect on the dependent variable, in other words, if
the impact of one independent variable depends on the level of the other.
Various post-hoc comparisons are available to conduct a whole set of comparisons and
explore the differences between each of the groups (Pallant, 2010). Scheffe test was used
in the current study to identify the exact location of differences between the language
groups.
4.8.3 MTT methods
MTT allows users to create an interval scale of scores for both the difficulty of items and
the ability (or standing on the latent trait) of the persons tested (Wright & Stone, 1979).
These scores are reported in units called logits and are typically placed on a vertical ruler
called a logistic ruler (Bond & Fox, 2007).
The rating scales of assessment instruments are assumed to have equal intervals, but
particularly with personality instruments this is often not the case (Green & Frantom,
2002). Test developers therefore prefer the Rasch analysis model to assist with the
construction of instruments with equal interval rating scales (Green & Frantom, 2002).
The Rasch model places respondents and instrument items on the same scale, based
respectively on their ability or (in the case of personality assessment) the person’s
standing on the latent trait being measured and the difficulty or endorsability of the item.
This makes it easier to identify items that clearly distinguish between persons who are
high or low on the latent trait and can be used to identify biased items. Rasch analysis
also highlights different response patterns, which is an indication of differential item
functioning (DIF) in the instrument. Since the BTI is a widely used and standardised
personality instrument, items will not be removed during the current research. Thus the
instrument will remain intact in its standard validated format, which will also allow for the
comparison of results with previous findings. The intention of the current study is to
make psychologists aware of problematic items that may cause different interpretations

119
or responses and to compare problem items with items that were identified as
problematic in previous research by Taylor (2008).
As indicated in 4.5.2, Rasch analysis methods have two basic assumptions, namely local
independence and unidimensionality (Embretson & Reise, 2000). Local independence
indicates that the responses are independent of one another, while unidimensionality
indicates that only one latent trait (dimension/factor) is measured per item. The logical
pattern of responses is investigated next to determine the fit of the items and individuals
that responded to these specific items.
4.8.3.1 Fit indices
Residual mean square summary statistics, named INFIT and OUTFIT mean square values,
are determined in Rasch analysis to indicate the degree to which items and people
responses have a logical pattern (Green & Frantom, 2002).
Items as well as people can ‘over fit’ (be too predictable) or ‘under fit’ (be too
unpredictable) the logical anticipated pattern of responses and they may then be
removed from the analysis to allow better fit to the model (Bond & Fox, 2001). As the BTI
is a widely used and standardised personality instrument, the current study will identify
probematic items and make users of the BTI aware of items that may cause different
interpretations to item responses. The test distributors may decide to change, remove or
replace some of the identified problem items in future versions/editions/revisions of the
BTI.
The INFIT mean square is sensitive to irregular responses to on-target items and the
OUTFIT mean square is sensitive to irregular responses to off-target items (Wright &
Linacre, 1994). The focus in the current study was on the INFIT mean square (MNSQ)
values, which focuses on the on-target items. The current study reports only the INFIT
MNSQ statistics for the items that are considered to show misfit by having values below
.60 (overfit) or above 1.40 (underfit) (as set by Wright and Linacre (1994)).

120
4.8.3.2 Internal consistency reliability
According to Guilford (1965), the reliability of any set of measurements is logically
defined as the proportion of their variance that is true variance. Internal consistency
reliability is an objective procedure determined by Cronbach’s alpha or Kuder-
Richardson’s coefficients (Moerdyk, 2009; Murphy & Davidshofer, 2005). The true
measure variance is assumed to be the genuine value of whatever is being measured
(Guilford, 1965). Reliability is an indication of how homogeneous the items are.
Rasch measurement also produces reliability measures, one in terms of the items and the
other in terms of each person's ability. A person’s ability index is given on a linear scale
calculated from a logistic transformation of the respondents’ raw score (Wright & Stone,
1999). The person separation index (PSI) describes the number of levels that could be
created for people with different abilities. It indicates how efficiently a set of items can
separate persons measured in terms of their abilities. This results in a linear comparison
of ‘hard’ and ‘easy’ tests (Wright & Stone, 1999, p.159).
A better reliability coefficient is obtained through Rasch analysis than through CTT –
firstly because the numerical arguments are now linear rather than curvilinear, and
secondly because the actual average error variance of the sample is used instead of the
error variance of an ‘average’ person (Wright & Stone, 1999).
The item separation index (ISI) is generated to determine the item reliability in Rasch
terms. This is an indication of the replicability of item difficulty, should the analysis be
repeated with another sample of participants. It would be expected that the difficulty
order of the items should remain the same and that the items are well separated in terms
of their difficulty parameters (Bond & Fox, 2007). The ISI is an indication of how well the
items separate people with different levels of ability and can be seen as similar to the
scale’s internal consistency reliability (Bond & Fox, 2007).
The item separation index (ISI) and person separation index (PSI) are expressed as
reliabilities and range from .0 to 1.0 (Wright & Stone, 1999).

121
Higher separation values indicate better separation between items or persons and
therefore allow more precise measurement with the instrument (Wright & Stone, 1999).
The item separation index (ISI) as well as the person separation index (PSI) will be
reported for each of the BTI factors.
4.8.3.3 Differential item functioning (DIF)
Differential item functioning is identified by giving a DIF contrast value when comparing
the item locations of different groups. According to Lai, Teresi and Gershon (2005), the
DIF contrast value indicates a meaningful difference if this value is larger than .5 logits.
The DIF contrast values will be calculated for all the items of the BTI, firstly for the entire
sample and secondly for the higher English proficiency group (top 25%) and the lower
English proficiency group (bottom 25%), across all eleven official languages. The items
that show bias when the BTI is administered to different language groups will be
identified, and also the effect that English proficiency might have on responses to the BTI
items.
4.9 POSTULATES
The main research questions asked in the current study are
• whether the eleven official home languages of South Africa have an effect on the
responses made on the BTI; and
• whether English proficiency influences the response patterns.
These questions form the basis of the postulates given for the present study. Different
statistical analysis techniques (as described above) will be used in various combinations to
provide evidence that supports the postulates formulated in this section.
The postulates for the present study are focused on the identification of item bias in the
BTI.

122
4.9.1 Item bias
Item bias is also known as differential item functioning. This type of bias occurs when
there are inconsistencies in the instrument at item level, perhaps caused by poor
translation or inappropriate items in a particular context, which could lead to items
having a different psychological meaning across cultures (Van de Vijver & Tanzer, 1997;
Van de Vijver & Leung, 1997).
Null hypothesis 1
There are no statistically significant differences between the responses to the BTI items of
respondents with different home languages.
Alternative/Research hypothesis 1
There are statistically significant differences between the responses to the BTI items of
respondents with different home languages.
Null hypothesis 2
There are no statistically significant differences between the responses to the BTI items of
respondents with different English proficiency levels.
Alternative/Research hypothesis 2
There are statistically significant differences between the responses to the BTI items of
respondents with different English proficiency levels.
Null hypothesis 3
There are no statistically significant differences between the responses to the BTI items of
respondents with different home languages and different English proficiency levels.
Alternative/Research hypothesis 3
There are statistically significant differences between the responses to the BTI items of
respondents with different home languages and different English proficiency levels.

123
4.10 SUMMARY
In this chapter, the sample, the instrument and the statistical analysis methods used to
evaluate the data were described. A short summary was given of the differences between
CTT and MTT. Some limitations of basic CTT methods that led to the development of MTT
were highlighted and thereafter some advanced MTT (i.e. the Rasch analysis techniques,
such as Differential item functioning (DIF)) were described and the reasons for focusing
on these Rasch analysis techniques were stipulated. Thereafter the postulates for the
current study were presented.
The next chapter will explain the results that were obtained from the data analysis.

124
CHAPTER 5: RESULTS
5.1 INTRODUCTION
The results obtained in the present study are presented in this chapter. The basic
descriptive statistics are given in terms of the minimum, the maximum, the mean and the
standard deviation for the Big Five personality factors of the BTI. The reason for initially
presenting the descriptive results is that the data set needs to be understood before any
further statistical analyses can be presented. After reporting the descriptive statistics of
the data used, the test for normality for each of the variables used is given.
Multivariate analyses of variance (MANOVA) were used to identify whether there are any
statistically significant differences between the mean scores of sub-groups based on the
independent variables (i.e. home languages and English proficiency) on the dependent
variables (i.e. the BTI Big Five personality factors).
The power of any statistical analysis procedure is dependent on the size of the sample
and therefore the effect sizes were also reported.
When using the MTT, the assumptions of unidimensionality and local independence
(Bond & Fox, 2007) are tested. The items that do not fit the model are reported in terms
of the INFIT mean square values. The internal consistency reliabilities with regard to the
item separation index (ISI) and person separation index (PSI) are outlined, after which the
dimensionalities of each of the five factors are discussed. The differential item functioning
(DIF) for the items is summarised both for the different language groups and for the
groups based on the level of English proficiency.
5.2 DESCRIPTIVE STATISTICS
The descriptive statistics for the total sample are given in Table 5.1. The mean value is an
indication of the central tendency of the measure in terms of the ‘average’ value for the
responses (Forshaw, 2007). A low standard deviation will indicate tightly packed scores
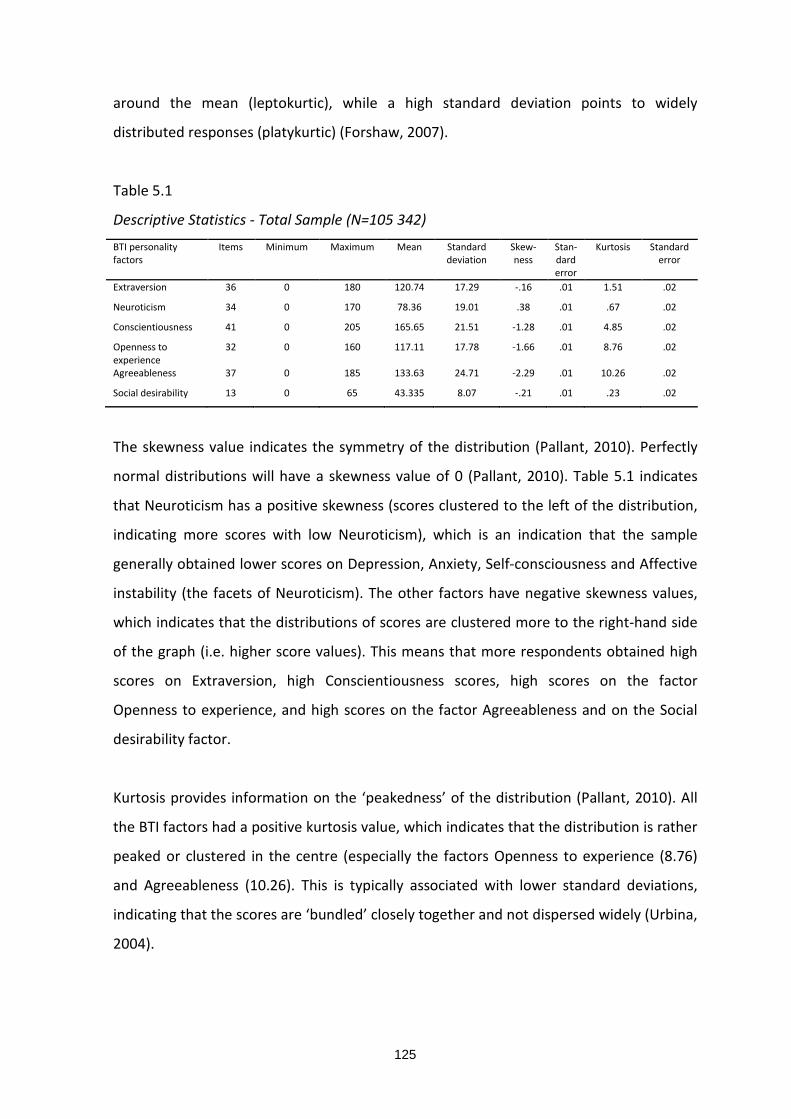
125
around the mean (leptokurtic), while a high standard deviation points to widely
distributed responses (platykurtic) (Forshaw, 2007).
Table 5.1
Descriptive Statistics - Total Sample (N=105 342)
BTI personality factors
Items Minimum Maximum Mean Standard deviation
Skew-ness
Stan-dard error
Kurtosis Standard error
Extraversion 36 0 180 120.74 17.29 -.16 .01 1.51 .02
Neuroticism 34 0 170 78.36 19.01 .38 .01 .67 .02
Conscientiousness 41 0 205 165.65 21.51 -1.28 .01 4.85 .02
Openness to experience
32 0 160 117.11 17.78 -1.66 .01 8.76 .02
Agreeableness 37 0 185 133.63 24.71 -2.29 .01 10.26 .02
Social desirability 13 0 65 43.335 8.07 -.21 .01 .23 .02
The skewness value indicates the symmetry of the distribution (Pallant, 2010). Perfectly
normal distributions will have a skewness value of 0 (Pallant, 2010). Table 5.1 indicates
that Neuroticism has a positive skewness (scores clustered to the left of the distribution,
indicating more scores with low Neuroticism), which is an indication that the sample
generally obtained lower scores on Depression, Anxiety, Self-consciousness and Affective
instability (the facets of Neuroticism). The other factors have negative skewness values,
which indicates that the distributions of scores are clustered more to the right-hand side
of the graph (i.e. higher score values). This means that more respondents obtained high
scores on Extraversion, high Conscientiousness scores, high scores on the factor
Openness to experience, and high scores on the factor Agreeableness and on the Social
desirability factor.
Kurtosis provides information on the ‘peakedness’ of the distribution (Pallant, 2010). All
the BTI factors had a positive kurtosis value, which indicates that the distribution is rather
peaked or clustered in the centre (especially the factors Openness to experience (8.76)
and Agreeableness (10.26). This is typically associated with lower standard deviations,
indicating that the scores are ‘bundled’ closely together and not dispersed widely (Urbina,
2004).

126
According to Tabachnick and Fidell (2007), larger samples tend to cause problems with
the interpretation of skewness and kurtosis values. They found that skewness will not
make a substantive difference in the analysis and that positive kurtosis can result in an
underestimation of the variance when larger samples are used. Tabachnick and Fidell
(2007) recommend that other tests for normality be used to inspect the shape of the
distribution, as the skewness and kurtosis values are too sensitive with larger samples.
5.3 TEST FOR NORMALITY
Score distributions vary systematically across cultures; therefore multivariate normality
can be problematic in cross-cultural research (Au, 1997). The Komogorov-Smirnov test
was used to test for normality with the large sample used in the current study and
determine the normality of the distribution of scores. The results are presented in Table
5.2.
The Komogorov-Smirnov test is based on a statistic that indicates how much a sample
cumulative distribution function deviates from a specific population cumulative
distribution function (Hawkins & Weber, 1980). The test was performed for each of the
variables concerned in the current study. Since it indicates the deviation of a sample
distribution from a specific population distribution, it is a general test of goodness of fit
(Hawkins & Weber, 1980). Significance values smaller than .05 indicate a violation of the
assumption of normality, which is quite common in larger samples (Pallant, 2010).
Table 5.2
Distribution - Normality
Factor Mean Standard deviation Significance Komogorov-Smirnov result English proficiency* 40.39 9.33 .00 Not normally distributed Extraversion 120.74 17.29 .00 Not normally distributed Neuroticism 78.37 19.01 .00 Not normally distributed Conscientiousness 165.65 21.51 .00 Not normally distributed Openness to experience 117.11 17.79 .00 Not normally distributed Agreeableness 133.63 24.71 .00 Not normally distributed Social desirability 43.34 8.07 .00 Not normally distributed *English proficiency is a combined score of verbal reasoning and reading comprehension total scores

127
Neither English proficiency responses nor responses on all the Big Five personality factors
measured by the BTI were normally distributed according to the Komogorov-Smirnov
test. Since the scores of this sample are not normally distributed for all the variables
involved in the current study, non-parametric statistical analysis methods would typically
be recommended, depending on the sample size. According to Hill and Lewicki (2006),
parametric statistics may be used when the sample is larger than 100. Therefore, because
the sample in this study was so large, parametric statistics were used, even though all the
factors were found to be not normally distributed. According to them it often makes little
sense to use non-parametric statistics when the data set is large, due to the central limit
theorem. The central limit theorem states that when the sample becomes very large, the
sample means will follow the normal distribution even if the particular variable is not
normally distributed in the population, or is not measured very well (Hill & Lewicki, 2006).
They conclude that parametric methods are usually much more sensitive or have more
statistical power, and are therefore more appropriate for larger samples.
5.4 INTERNAL CONSISTENCY RELIABILITY
Internal consistency reliability, which is an indication of the amount of measurement
error present in a test, is measured in CTT with the Cronbach alpha coefficients. Tests that
are relatively free of measurement error are considered to be reliable (Kaplan &
Saccuzzo, 2001). An acceptable level of reliability, although very low, is regarded to be
above .60 (Clark & Watson, 1995).
The Cronbach alpha coefficients (Cronbach, 1951) for the factors of the BTI are presented
in Table 5.3, together with the person separation index (PSI) as determined by Rasch
analysis, to determine the degree of random measurement error present in the test. The
PSI is an indication of the reliability of the test through MTT (Bond & Fox, 2001). It
indicates how well the items separate the different levels of ability of the respondents
(Bond & Fox, 2001). A PSI above .60, although very low, is regarded as an acceptable level
of reliability (Bond & Fox, 2001).

128
Table 5.3 Cronbach Alpha Coefficients and PSI for Psychometric Instruments (N=105 342)
Items (n) α PSI ISI
English proficiency Verbal reasoning 45 .83 .82 1.00 English proficiency Reading comprehension 30 .80 .78 1.00 BTI Extraversion 36 .86 .85 1.00
BTI Neuroticism 34 .89 .86 1.00 BTI Conscientiousness 41 .93 .88 1.00 BTI Openness to experience 32 .90 .84 1.00 BTI Agreeableness 37 .94 .86 1.00
BTI Social desirability 13 .72 .70 1.00 BTI Total items 193
Clark and Watson (1995) regarded Cronbach alpha coefficients above .60 as acceptable,
and Bond and Fox (2001) recommended the same with regard to the PSI. As is evident
from the table above, the reliability estimates for the BTI in the current study indicated
very good internal consistency reliabilities. The PSI values, which indicate the ability of the
items to efficiently separate persons in terms of their abilities (Bond & Fox, 2001), are still
acceptable even though they are lower than the Cronbach alpha coefficients for all the
factors.
The reliability in terms of Cronbach alpha coefficients (α) and the PSI are reported as
follows: Extraversion (α=.86; PSI=.85), Neuroticism (α=.89; PSI=.86), Conscientiousness
(α=.93; PSI=.88), Openness to experience (α=.90; PSI=.84), Agreeableness (α=.94; PSI=.86)
and Social desirability (α=.72; PSI=.70).
The item separation index (ISI) indicates that if the analyses were repeated with another
sample of participants, the difficulty order of the items can be expected to remain the
same and the items should be well separated in terms of their difficulty parameters (Bond
& Fox, 2001). The ISI calculated for the different Big Five personality factors measured by
the BTI was 1.00 for each of the factors, even for the faking scale (Social desirability). This
indicates that the items were well separated in terms of their location parameters and
would remain in the same order, should the analysis be repeated with another sample.

129
The high Cronbach alpha coefficients and high separation values indicated that the BTI is
a very reliable instrument that separates very well between ‘easy to respond’ and
‘difficult to respond’ items, or persons ‘high’ or ‘low’ on that specific latent trait. Thus it
can be concluded that the BTI rendered a very precise measurement of the Big Five
personality factors for this sample.
To further investigate the reliability of the BTI for the different South African language
groups, Cronbach alpha coefficients are given for each factor in respect of the eleven
official language groups. These values are presented in Table 5.4.
Table 5.4
Cronbach Alpha Coefficients of BTI Factors for South African Languages
Language Extraversion (36 items)
Neuroticism (34 items)
Conscientiousness (41 items)
Openness to Experience (32 items)
Agreeableness (37 items)
Social Desirability (13 items)
α α α α α α
Afrikaans (N=6786) .88 .93 .95 .88 .91 .70
English (N=2261) .87 .92 .95 .88 .92 .73
Ndebele (N=2002) .87 .89 .93 .90 .93 .73
Sepedi (N=23825) .84 .89 .93 .91 .95 .71
Sotho (N=7517) .87 .90 .93 .88 .92 .73
Swati (N=3628) .86 .89 .92 .89 .93 .72
Tsonga (N=10857) .85 .88 .93 .90 .94 .70
Tswana (N=6687) .87 .90 .93 .88 .92 .74
Venda (N=5042) .85 .88 .93 .90 .93 .71
Xhosa (N=17265) .88 .90 .93 .90 .95 .73
Zulu (N=19472) .86 .89 .93 .89 .92 .71
AVERAGE .86 .89 .93 .89 .93 .72
Each of the Big Five personality factors was measured very reliably across the eleven
official languages of South Africa with the help of the BTI personality instrument.
Cronbach alpha coefficients above .84 were reported for the five factors and above .70
for the faking scale (Social desirability) for all the groups. This is very good evidence that
the BTI shows good internal consistency reliability for all eleven languages in South Africa.

130
The current study contributes to the evidence that attests to the BTI being a very reliable
South African personality instrument that can be administered to all eleven language
groups.
5.5 EFFECT SIZES IN CROSS-CULTURAL RESEARCH
Before MTT techniques were administered, effect sizes were determined as the sample
was very large and the practical significance of the results needs to be considered. For
large samples, the percentage of variance of the dependent variable is explained by the
independent variables through the eta-squared (Eta2) value (Pallant, 2010).
Effect size is an indication of the importance of the findings in research (Pallant, 2010).
Tabachnick and Fidell (2007, p.54) described effect size as ‘the set of statistics that
indicates the relative magnitude of the difference between means, or the amount of the
total variance in the dependent variable that is predictable from knowledge of the levels
of the independent variable’.
The Eta2 value for the BTI responses with language as independent variable was .01,
which is a small effect (i.e. 1% of the variance in the BTI response is explained by the
language variable) (Cohen, 1988). For English proficiency, Eta2=.14, which is a larger effect
(Cohen, 1988) and means that 14% of the variance in the BTI response was explained by
the level of English proficiency.
The effect of English proficiency was the highest; therefore the decision was made to
divide the sample into two sub-groups for further analyses.
Cohen’s d presents the mean difference between groups in terms of standard deviation
units. Cohen (1988) presented the following guidelines to interpret the value of d when
comparing different groups:
• < 0.1 = trivial effect
• 0.1 - 0.3 = small effect

131
• 0.3 - 0.5 = moderate effect
• > 0.5 = large difference effect
(Cohen, 1988).
The effect size (practical significance) in terms of Cohen’s d (Cohen, 1988) is presented in
the following tables to compare the relevant groups together with the statistical
significant (p<.05) results.
5.6 MULTIVARIATE ANALYSIS (MANOVA)
MANOVA renders F-ratios to indicate the influence that more than one independent
variable has on the dependent variable (Pallant, 2010). The significant differences are
summarised in Table 5.5 with language and English proficiency as independent variables
and the BTI factors as dependent variables.
Table 5.5
Multivariate Analysis – MANOVA (Wilks’ Lambda)
Wilks’ Lambda value F Hypothesis
df
Error df Sig p Eta2
Home language .95 83.36 60 631980.0 .00 .01 English proficiency .87 2736.01 6 105325.00 .00 .15
The MANOVA analysis revealed significant differences in the BTI factors by respondents
with different home languages (Wilks’ Lambda = .917, p<.001, Eta2=.014, d=.11) and
different levels of English proficiency (Wilks’ Lambda =.865, p<.001, Eta2=.135, d=.81).
Post-hoc comparisons are used when a set of comparisons needs to be made to explore
the differences between each of the groups (Pallant, 2010). The Scheffe test, as a post-
hoc method, was done to further explore the differences between each of the language
groups. Only the mean differences that were significant at the p<.05 (95%) level are
presented. The complete list of mean differences for all the BTI factors is attached in
Appendix A for the different language groups and in Appendix B for the two different
English proficiency levels.

132
The mean differences (at a significance level of p<.05) between the language groups are
given in Table 5.6 for the Extraversion factor of the BTI.
Table 5.6
Extraversion – Statistically Significant Mean Differences between Languages
95% Confidence Interval
Language n Language n Mean difference
(p<.05)
Standard Error
Effect size (d)
Lower Bound
Upper Bound
English 2 261 Afrikaans 6 786 3.72 .42 .21 5.51 1.93 Sepedi 23 825 3.21 .38 .19 1.58 4.83 Sotho 7 517 1.86 .41 .11 .08 3.63 Swati 3 628 3.21 .46 .19 1.23 5.19 Tsonga 10 857 2.10 .40 .12 .39 3.81 Tswana 6 687 2.77 .42 .16 .97 4.56 Xhosa 17 265 3.73 .39 .21 2.08 5.38 Zulu 19 472 2.45 .38 .14 .81 4.09 Afrikaans 6 786 Sotho 7 517 -1.86 .29 -.10 -3.10 -.63 Tsonga 10 857 -1.62 .27 -.01 -2.76 -.48 Venda 5 042 -3.79 .32 -.22 -5.17 -2.42 Zulu 19 472 -1.27 .24 -.07 -2.31 -.23 Ndebele 2 002 Venda 5 042 -2.32 .46 -.14 -4.27 -.37 Sepedi 23 825 Sotho 7 517 -1.35 .23 -.08 -2.33 -.38 Tsonga 10 857 -1.11 .20 -.07 -1.96 -.25 Venda 5 042 -3.28 .27 -.20 -4.43 -2.13 Zulu 19 472 -.76 .17 -.05 -1.47 -.05 Sotho 7 517 Venda 5 042 -1.93 .31 -.11 -3.27 -.58 Xhosa 17 265 1.88 .24 .11 .86 2.90 Swati 3 628 Venda 5 042 -3.29 .38 -.19 -4.89 -1.68 Tsonga 10 857 Venda 5 042 -2.17 .29 -.13 -3.43 -.91 Xhosa 17 265 1.63 .21 .09 .73 2.54 Tswana 6 687 Venda 5 042 -2.84 .32 -.16 -4.22 -1.46 Venda 5 042 Xhosa 17 265 3.80 .28 .22 2.62 4.99 Zulu 19 472 2.52 .27 .15 1.35 3.69 Xhosa 17 265 Zulu 19 472 -1.28 .18 -.07 -2.06 -.51
The highest statistically significant mean differences were identified between Venda and
Xhosa (3.80, d=.22 small effect). This implies that the Venda-speaking respondents were
more inclined to endorse items measuring Extraversion than the Xhosa-speaking
respondents did. The statistically significant mean differences between English and
Afrikaans (3.72, d=.21 small effect), English and Xhosa (3.73, d=.21 small effect) and
Afrikaans and Venda (-3.79, d=-.22 small effect) were also high for Extraversion.

133
The statistically significant (p<.05) mean differences between languages are given in Table
5.7 for the Neuroticism factor of the BTI.
Table 5.7
Neuroticism – Statistically Significant Mean Differences between Languages
95% Confidence Interval
Language n Language n Mean difference
(p<.05)
Standard Error
Effect size (d)
Lower Bound
Upper Bound
English 2 261 Afrikaans 6 786 -5.96 .46 -.29 -3.99 -7.93 Ndebele 2 002 -7.20 .58 -.39 -9.69 -4.71 Sepedi 23 825 -7.60 .42 -.41 -9.39 -5.82 Sotho 7 517 -5.92 .46 -.30 -7.86 -3.97 Swati 3 628 -6.99 .51 -.38 -9.16 -4.82 Tsonga 10 857 -4.97 .44 -.27 -6.84 -3.09 Tswana 6 687 -6.29 .46 -.32 -8.27 -4.32 Venda 5 042 -6.86 .48 -.36 -8.92 -4.81 Xhosa 17 265 -8.58 .42 -.46 -10.40 -6.77 Zulu 19 472 -7.65 .42 -.41 -9.45 -5.85 Afrikaans 6 786 Sepedi 23 825 -1.64 .26 -.09 -2.76 -.52 Xhosa 17 265 -2.62 .27 -.14 -3.78 -1.46 Zulu 19 472 -1.69 .27 -.09 -2.83 -.54 Ndebele 2 002 Tsonga 10 857 2.23 .46 .12 .26 4.21 Sepedi Sotho 7 517 1.68 .25 .09 .61 2.76 Tsonga 10 857 2.63 .22 .14 1.69 3.57 Tswana 6 687 1.31 .26 .07 .19 2.43 Xhosa 17 265 -.98 .19 -.05 -1.79 -.17 Sotho 7 517 Xhosa 17 265 -2.66 .26 -.14 -3.79 -1.54 Zulu 19 472 -1.73 .26 -.09 -2.83 -.63 Swati 3 628 Tsonga 10 857 2.02 .36 .11 .47 3.58 Xhosa 17 265 -1.59 .35 -.09 -3.07 -.11 Tsonga 10 857 Tswana 6 687 -1.33 .30 -.07 -2.59 -.06 Venda 5 042 -1.89 .32 -.10 -3.28 -.51 Xhosa 17 265 -3.61 .23 -.19 -4.61 -2.62 Zulu 19 472 -2.68 .23 -.14 -3.65 -1.71 Tswana 6 687 Xhosa 17 265 -2.29 .27 -.12 -3.46 -1.12 Zulu 19 472 -1.36 .27 -.07 -2.51 -.21 Venda 5 042 Xhosa 17 265 -1.72 .30 -.09 -3.02 -.42 Xhosa 17 265 Zulu 19 472 .93 .20 .05 .09 1.78
The mean differences presented are statistically significant at the p<.05 level. The highest
mean difference was identified between English and Xhosa (-8.58, d=-.46 moderate
effect), which implies that Xhosa respondents were more inclined to endorse items
measuring Neuroticism than did the English respondents. The other high statistically
significant (p<.05) mean differences for Neuroticism were between English and Ndebele (-
7.2, d=-.39 moderate effect), English and Sepedi (-7.6, d=-.41 moderate effect) and
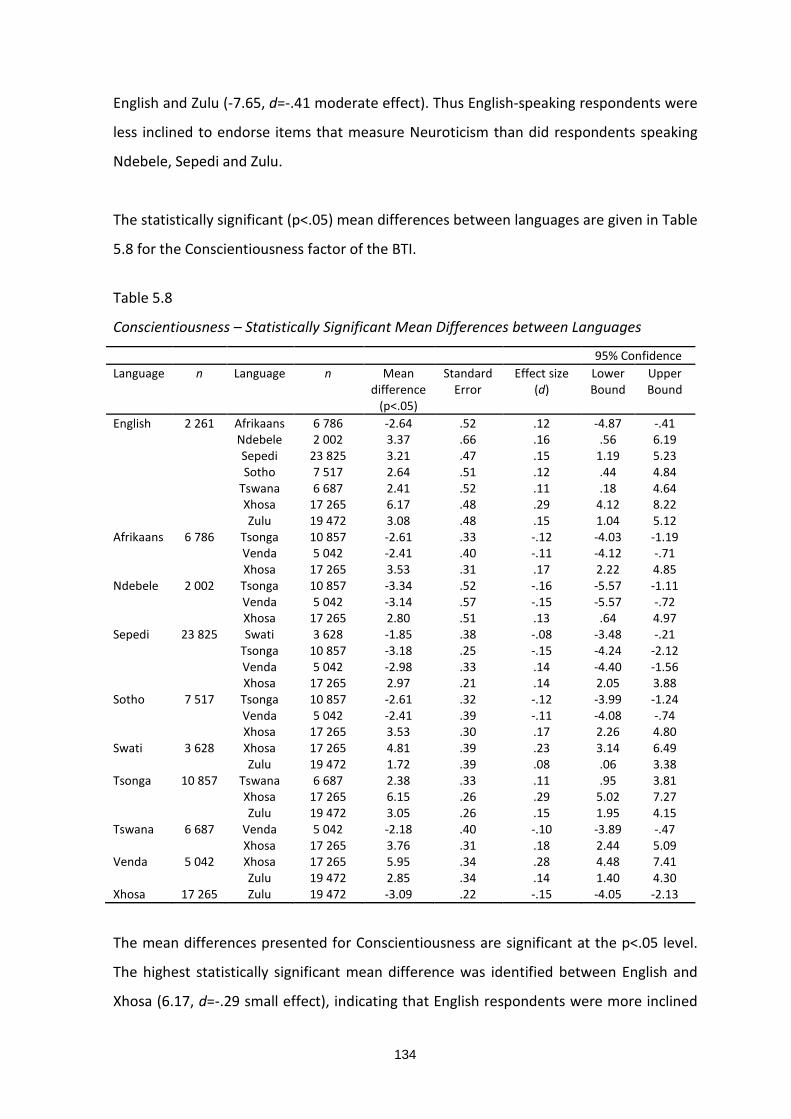
134
English and Zulu (-7.65, d=-.41 moderate effect). Thus English-speaking respondents were
less inclined to endorse items that measure Neuroticism than did respondents speaking
Ndebele, Sepedi and Zulu.
The statistically significant (p<.05) mean differences between languages are given in Table
5.8 for the Conscientiousness factor of the BTI.
Table 5.8
Conscientiousness – Statistically Significant Mean Differences between Languages
95% Confidence Language n Language n Mean
difference (p<.05)
Standard Error
Effect size (d)
Lower Bound
Upper Bound
English 2 261 Afrikaans 6 786 -2.64 .52 .12 -4.87 -.41 Ndebele 2 002 3.37 .66 .16 .56 6.19 Sepedi 23 825 3.21 .47 .15 1.19 5.23 Sotho 7 517 2.64 .51 .12 .44 4.84 Tswana 6 687 2.41 .52 .11 .18 4.64 Xhosa 17 265 6.17 .48 .29 4.12 8.22 Zulu 19 472 3.08 .48 .15 1.04 5.12 Afrikaans 6 786 Tsonga 10 857 -2.61 .33 -.12 -4.03 -1.19 Venda 5 042 -2.41 .40 -.11 -4.12 -.71 Xhosa 17 265 3.53 .31 .17 2.22 4.85 Ndebele 2 002 Tsonga 10 857 -3.34 .52 -.16 -5.57 -1.11 Venda 5 042 -3.14 .57 -.15 -5.57 -.72 Xhosa 17 265 2.80 .51 .13 .64 4.97 Sepedi 23 825 Swati 3 628 -1.85 .38 -.08 -3.48 -.21 Tsonga 10 857 -3.18 .25 -.15 -4.24 -2.12 Venda 5 042 -2.98 .33 .14 -4.40 -1.56 Xhosa 17 265 2.97 .21 .14 2.05 3.88 Sotho 7 517 Tsonga 10 857 -2.61 .32 -.12 -3.99 -1.24 Venda 5 042 -2.41 .39 -.11 -4.08 -.74 Xhosa 17 265 3.53 .30 .17 2.26 4.80 Swati 3 628 Xhosa 17 265 4.81 .39 .23 3.14 6.49 Zulu 19 472 1.72 .39 .08 .06 3.38 Tsonga 10 857 Tswana 6 687 2.38 .33 .11 .95 3.81 Xhosa 17 265 6.15 .26 .29 5.02 7.27 Zulu 19 472 3.05 .26 .15 1.95 4.15 Tswana 6 687 Venda 5 042 -2.18 .40 -.10 -3.89 -.47 Xhosa 17 265 3.76 .31 .18 2.44 5.09 Venda 5 042 Xhosa 17 265 5.95 .34 .28 4.48 7.41 Zulu 19 472 2.85 .34 .14 1.40 4.30 Xhosa 17 265 Zulu 19 472 -3.09 .22 -.15 -4.05 -2.13
The mean differences presented for Conscientiousness are significant at the p<.05 level.
The highest statistically significant mean difference was identified between English and
Xhosa (6.17, d=-.29 small effect), indicating that English respondents were more inclined

135
to endorse items measuring Conscientiousness than did Xhosa-speaking respondents.
High mean differences for the Conscientiousness factor were also reported between
respondents speaking Tsonga and Xhosa (6.15, d=.29 small effect) and Venda and Xhosa
(5.95, d=.28 small effect).
The statistically significant (95% level) mean differences between languages are
presented in Table 5.9 for the Openness to experience factor of the BTI.
Table 5.9 Openness to Experience – Statistically Significant Mean Differences between Languages 95% Confidence Language n Language n Mean
difference (p<.05)
Standard Error
Effect size (d)
Lower Bound
Upper Bound
English 2 261 Afrikaans 6 786 2.79 .43 .18 4.64 .95 Xhosa 17 265 2.99 .40 .17 1.30 4.69 Afrikaans 6 786 Sepedi 23 825 -1.41 .24 -.08 -2.45 -.36 Sotho 7 517 -2.90 .30 -.18 -4.17 -1.63 Swati 3 628 -1.66 .37 -.11 -3.23 -.10 Tsonga 10 857 -2.18 .28 -.13 -3.36 -1.01 Tswana 6 687 -3.22 .31 -.21 -4.53 -1.91 Venda 5 042 -3.20 .33 -.19 -4.61 -1.79 Zulu 19 472 -1.40 .25 -.08 -2.47 -.33 Ndebele 2 002 Tswana 6 687 -2.17 .45 -.13 -4.11 -.24 Venda 5 042 -2.15 .47 -.12 -4.16 -.14 Sepedi 23 825 Sotho 7 517 -1.49 .24 -.08 -2.50 -.49 Tswana 6 687 -1.82 .25 -.10 -2.87 -.77 Venda 5 042 -1.80 .28 -.10 -2.97 -.62 Xhosa 17 265 1.61 .18 .09 .85 2.37 Sotho 7 517 Xhosa 17 265 3.10 .25 .18 2.05 4.15 Zulu 19 472 1.50 .24 .09 .47 2.53 Swati 3 628 Xhosa 17 265 1.87 .32 .11 .48 3.26 Tsonga 10 857 Xhosa 17 265 2.39 .22 .13 1.46 3.32 Tswana 6 687 Xhosa 17 265 3.43 .26 .20 2.33 4.52 Zulu 19 472 1.82 .25 .11 .74 2.90 Venda 5 042 Xhosa 17 265 3.41 .28 .19 2.19 4.62 Zulu 19 472 1.80 .28 .10 .60 3.00 Xhosa 17 265 Zulu 19 472 -1.61 .19 -.09 -2.40 -.81
The mean differences presented are significant at the p<.05 level. The highest statistically
significant mean difference was identified between Tswana and Xhosa (3.43, d=.20 small
effect), with another high mean difference between Venda and Xhosa (3.41, d=.19 small
effect) for the factor Openness to experience. Thus the conclusion can be made that
Xhosa-speaking respondents found it more difficult to endorse items measuring
Openness to experience than did Tswana- and Venda-speaking respondents.

136
The statistically significant mean differences (p<.05) between the official languages are
given in Table 5.10 for Agreeableness.
Table 5.10
Agreeableness – Statistically Significant Mean Differences between Languages
95% Confidence Language n Language n Mean
difference (p<.05)
Standard Error
Effect size (d)
Lower Bound
Upper Bound
English 2 261 Afrikaans 6 786 3.58 .60 .18 6.14 1.02 Sepedi 23 825 3.52 .54 .13 1.20 5.84 Xhosa 17 265 4.79 .55 .18 2.43 7.15 Afrikaans 6 786 Swati 3 628 -3.01 .51 -.15 -5.18 -.84 Tsonga 10 857 -3.72 .38 -.16 -5.35 -2.09 Venda 5 042 -5.09 .46 -.24 -7.05 -3.13 Ndebele 2 002 Tsonga 10 857 -2.99 .60 -.12 -5.55 -.42 Venda 5 042 -4.36 .65 -.18 -7.15 -1.57 Sepedi 23 825 Sotho 7 517 -1.71 .33 -.01 -3.10 -.31 Swati 3 628 -2.95 .44 -.11 -4.83 -1.07 Tsonga 10 857 -3.66 .29 -.14 -4.88 -2.44 Tswana 6 687 -1.76 .34 -.07 -3.22 -.30 Venda 5 042 -5.03 .38 -.19 -6.67 -3.40 Xhosa 17 265 1.27 .25 .05 .21 2.32 Zulu 19 472 -1.26 .24 -.05 -2.28 -.24 Sotho 7 517 Tsonga 10 857 -1.95 .37 -.08 -3.54 -.37 Venda 5 042 -3.33 .45 -.14 -5.25 -1.41 Xhosa 17 265 2.97 .34 .12 1.52 4.43 Swati 3 628 Xhosa 17 265 4.22 .45 .16 2.29 6.15 Tsonga 10 857 Tswana 6 687 1.90 .38 .08 .26 3.54 Xhosa 17 265 4.93 .30 .19 3.64 6.22 Zulu 19 472 2.40 .30 .10 1.14 3.67 Tswana 6 687 Venda 5 042 -3.28 .46 -.14 -5.24 -1.31 Xhosa 17 265 3.02 .36 .12 1.50 4.54 Venda 5 042 Xhosa 17 265 6.30 .40 .24 4.61 7.99 Zulu 19 472 3.78 .39 .17 2.11 5.44 Xhosa 17 265 Zulu 19 472 -2.52 .26 -.10 -3.63 -1.42
The highest significant mean difference was identified between Venda and Xhosa (6.30,
d=.24 small effect); which means that Venda-speaking respondents were more inclined to
endorse items measuring Agreeableness than did Xhosa-speaking respondents. Other
highly significant differences were found between Afrikaans and Venda (-5.09, d=-.24
small effect) and between Sepedi and Venda (-5.03, d=-.19 small effect) for the factor
Agreeableness. Venda-speaking respondents were more inclined to endorse
Agreeableness items than did respondents speaking Afrikaans and Sepedi.

137
Table 5.11
Social Desirability – Statistically Significant Mean Differences between Languages
95% Confidence Language n Language n Mean
difference (p<.05)
Effect size (d)
Lower Bound
Upper Bound
English 2 261 Ndebele 2 002 -4.83 -.63 -5.86 -3.79 Sepedi 23 825 -5.24 -.68 -5.99 -4.50 Sotho 7 517 -3.31 -.42 -4.12 -2.50 Swati 3 628 -5.35 -.70 -6.25 -4.44 Tsonga 10 857 -6.26 -.79 -7.04 -5.48 Tswana 6 687 -2.98 -.37 -3.80 -2.15 Venda 5 042 -6.35 -.74 -7.20 -5.49 Xhosa 17 265 -3.49 -.44 -4.25 -2.74 Zulu 19 472 -4.41 -.57 -5.16 -3.66 Afrikaans 6 786 Ndebele 2 002 -4.98 -.68 -5.84 -4.13 Sepedi 23 825 -5.40 -.70 -5.86 -4.93 Sotho 7 517 -3.47 -.45 -4.03 -2.90 Swati 3 628 -5.50 -.75 -6.20 -4.81 Tsonga 10 857 -6.42 -.83 -6.94 -5.90 Tswana 6 687 -3.13 -.41 -.371 -2.55 Venda 5 042 -6.50 -.86 -7.13 -5.88 Xhosa 17 265 -3.65 -.47 -5.04 -4.09 Zulu 19 472 -4.56 -.60 -5.04 -4.09 Ndebele 2 002 Sotho 7 517 1.52 .19 .67 2.37 Tsonga 10 857 -1.43 -.18 -2.26 -.61 Tswana 6 687 1.85 .23 .99 2.71 Venda 5 042 -1.52 -.19 -2.41 -.63 Xhosa 17 265 1.34 .17 .54 2.13 Sepedi 23 825 Sotho 7 517 1.93 .24 1.49 2.38 Tsonga 10 857 -1.02 -.13 -1.41 -.63 Tswana 6 687 2.27 .28 1.80 2.73 Venda 5 042 -1.10 -.14 -1.63 -.58 Xhosa 17 265 1.75 .22 1.41 2.09 Zulu 19 472 .84 .11 .51 1.16 Sotho 7 517 Swati 3 628 -2.04 -.26 -2.72 -1.35 Tsonga 10 857 -2.95 -.37 -3.46 -2.45 Venda 5 042 -3.04 -.38 -3.65 -2.42 Zulu 19 472 -1.10 -.14 -1.56 -.64 Swati 3 628 Tsonga 10 857 -.92 -.12 -1.56 -.27 Tswana 6 687 2.37 .30 1.67 3.07 Venda 5 042 -1.00 -.13 -1.74 -.27 Xhosa 17 265 1.85 .24 1.24 2.47 Zulu 19 472 .94 .12 .33 1.55 Tsonga 10 857 Tswana 6 687 3.29 .41 2.76 3.81 Xhosa 17 265 2.77 .35 2.36 3.18 Zulu 19 472 1.85 .24 1.45 2.26 Tswana 6 687 Venda 5 042 -3.37 -.41 -4.00 -2.74 Xhosa 17 265 -.52 -.06 -1.00 -.03 Zulu 19 472 -1.43 -.18 -1.91 -.95 Venda 5 042 Xhosa 17 265 2.86 .36 2.31 3.40 Zulu 19 472 1.94 .25 1.41 2.47 Xhosa 17 265 Zulu 19 472 -.92 -.12 -1.27 -.56

138
The Social desirability factor’s statistically significant mean differences (p<.05) are given in
Table 5.11 for the Social desirability factor of the BTI.
The mean differences presented are significant at the p<.05 level. The highest significant
mean difference was identified between respondents who spoke Afrikaans and Venda (-
6.50, d=-.86 large effect), while other high mean differences for the Social desirability
factor of the BTI were identified between Afrikaans and Tsonga (-6.42, d=-.83 large
effect), English and Venda (-6.35, d=-.86 large effect) and between English and Tsonga (-
6.26, d=-.79 large effect). This is an indication that Tsonga- and Venda-speaking
respondents were more inclined to endorse items measuring the Social desirability of the
BTI, than did Afrikaans- and English-speaking respondents.
Since the highest mean differences identified were most often for Xhosa- and Venda-
speaking respondents, it was concluded that these respondents might have had the most
difficulty to respond to the items measuring the respective BTI factors.
From a CTT perspective, MANOVA indicated broadly that the language groups differed
significantly in terms of the mean scores on the dependant variable (BTI factors). A ‘post-
hoc’ test (the Sheffe test) was administered afterwards to determine the mean
differences between the English proficiency levels for the different language groups.
MTT analysis techniques, specifically Rasch analysis, were administered next to
investigate at item level where the exact differences lay that was responsible for the
identified mean differences on factor level.
5.7 PROFILE PLOTS
Profile plots summarise the estimated marginal means of BTI factors as respondents with
different languages responded to the items in this instrument. From previous discussions
it is clear that English proficiency has the highest effect size; therefore this was
incorporated into all further analyses. The sample was divided into two subgroups,

139
namely the higher English proficiency group (top 25%) and the lower English proficiency
group (bottom 25%).
In the current study, the response patterns with language as independent variable were
compared (per BTI factor) for the total language group (blue/solid graph) to the response
pattern of the sub-group ‘higher English proficiency’ (red/dotted graph) and to the
response pattern of the sub-group ‘lower English proficiency’ (orange/dashed graph).
Comparisons per BTI factor were done for the total group and for the two different
English proficiency groups (higher and lower English proficiency) for each language.
Figures 5.1 to 5.6 show the statistically significant (p<.05) differences in the mean values
of the BTI factors for the total group (language), as well as for the sub-groups (according
to their English proficiency scores) per language group. The scales on the graphs differ
according to the number of items per factor and the total scores to be achieved per BTI
factor.
Tables 5.12 to 5.17 present only the mean differences that have a statistically significance
level of p<.05 (95%) for the higher and lower English proficiency groups for each of the
BTI factors.
5.7.1 Extraversion
The mean differences for Extraversion for the total group (language), as well as for the
sub-groups (according to English proficiency scores) per language group are presented in
Figure 5.1.

140
Figure 5.1. Estimated Marginal Means: EXTRAVERSION
From the profile plots illustrated in Figure 5.1 (blue/solid graph) and Table 5.6 earlier in
this chapter, the largest mean difference (at a p<.05 significance level) was identified
between Venda and Xhosa (3.80). The mean differences (at a p<.05 significance level)
between English and Afrikaans (3.72), English and Xhosa (3.73) and between Afrikaans
and Venda (-3.79) were also large for Extraversion.
When the group was split and the mean values of the language groups were compared
for the higher English proficiency group (red/dotted graph) and the lower English
proficiency group (orange/dash graph), the English-speaking respondents with a higher
English proficiency score were identified as those who were significantly more inclined to
endorse the items measuring Extraversion.
The mean differences between the two English proficiency groups (higher and lower) at a
significance level of p<.05 for the factor Extraversion are presented in Table 5.12.
117
118
119
120
121
122
123
124
125
Language High English proficiency Low English proficiency

141
Table 5.12
Extraversion (36 items) – Statistically Significant Mean Differences between Languages
per English Proficiency Groups
95% Confidence interval
Language n Mean (Lower EP*)
Mean (Higher
EP*)
Mean Difference
(p<.05)
Standard Error
Effect size (d)
Lower Bound
Upper Bound
English 2 261 117.44 124.16 -6.73 1.58 -.39 -9.83 -3.62 Afrikaans 6 786 118.31 120.12 -1.81 .84 -.10 -3.46 -.15 Sotho 7 517 120.25 121.87 -1.62 .53 -.01 -2.67 -.57 Tsonga 10 857 120.73 121.68 -.95 .44 -.06 -1.82 -.09 Zulu 19 472 120.33 121.37 -1.04 .33 -.06 -1.68 -.41 *EP = English proficiency
The largest mean difference for Extraversion (at a significance level of p<.05) was
identified for the English group between the lower and higher English proficiency groups
(-6.73, d=-.39 moderate effect). Hence, the higher English proficiency group with a home
language of English were significantly more inclined to endorse items measuring the
factor Extraversion of the BTI.
5.7.2 Neuroticism
Figure 5.2 illustrates the differences in the mean values of the factor Neuroticism for the
total language group (blue/solid graph), as well as for the sub-groups (according to
English proficiency scores) per language group.
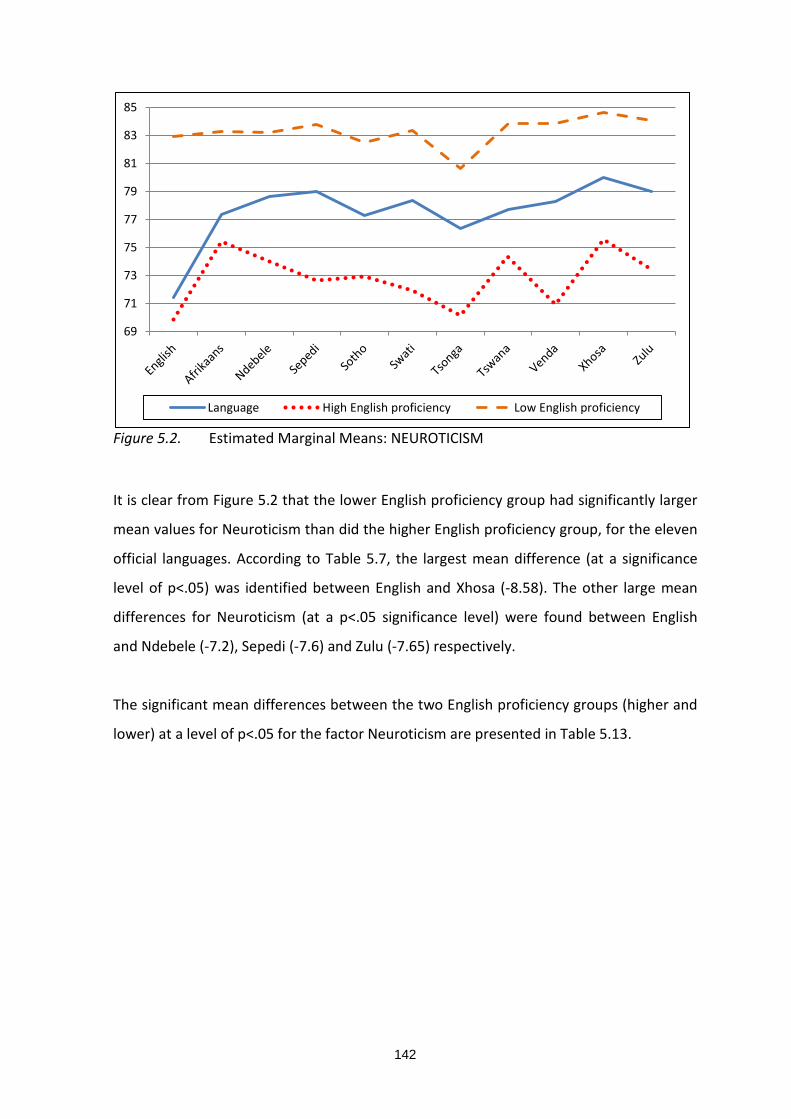
142
Figure 5.2. Estimated Marginal Means: NEUROTICISM
It is clear from Figure 5.2 that the lower English proficiency group had significantly larger
mean values for Neuroticism than did the higher English proficiency group, for the eleven
official languages. According to Table 5.7, the largest mean difference (at a significance
level of p<.05) was identified between English and Xhosa (-8.58). The other large mean
differences for Neuroticism (at a p<.05 significance level) were found between English
and Ndebele (-7.2), Sepedi (-7.6) and Zulu (-7.65) respectively.
The significant mean differences between the two English proficiency groups (higher and
lower) at a level of p<.05 for the factor Neuroticism are presented in Table 5.13.
69
71
73
75
77
79
81
83
85
Language High English proficiency Low English proficiency

143
Table 5.13
Neuroticism (34 items) – Statistically Significant Mean Differences between Languages per
English Proficiency Groups
95% Confidence
interval Language n Mean
(Lower EP*)
Mean (Higher
EP*)
Mean Difference
(p<.05)
Standard Error
Effect size (d)
Lower Bound
Upper Bound
English 2 261 82.90 69.87 13.04 1.77 .68 9.56 16.51 Afrikaans 6 786 83.27 75.46 7.81 .95 .39 5.96 9.66 Ndebele 2 002 83.24 74.03 9.21 1.06 .51 7.13 11.28 Sepedi 23 825 83.76 72.65 11.12 .32 .61 10.49 11.74 Sotho 7 517 82.53 72.91 9.62 .57 .49 8.50 10.74 Swati 3 628 83.33 71.95 11.39 .84 .61 9.74 13.04 Tsonga 10 857 80.68 70.16 10.52 .48 .57 9.58 11.45 Tswana 6 687 83.85 74.39 9.47 .63 .49 8.24 10.69 Venda 5 042 83.84 70.94 12.90 .70 .69 11.53 14.27 Xhosa 17 265 84.67 75.55 9.13 .37 .49 8.41 9.85 Zulu 19 472 84.11 73.41 10.70 .34 .59 10.03 11.37 *EP = English proficiency
The largest significant mean difference for the factor Neuroticism was identified for the
English group between the lower and higher English proficiency groups (13.04, d=.68
large effect). This implies that the lower English proficiency group with a home language
of English were more inclined to endorse items measuring the factor Neuroticism of the
BTI. For all the language groups, those with lower English proficiency scores were
significantly and practically (large effect sizes) more inclined than the higher English
proficiency group to endorse items measuring Neuroticism.
5.7.3 Conscientiousness
Figure 5.3 shows the differences in the mean values (at a significance level of p<.05) of
the factor Conscientiousness for the total language group (blue/solid graph), as well as for
the sub-groups (according to English proficiency scores) per language group.

144
Figure 5.3. Estimated Marginal Means: CONSCIENTIOUSNESS
From Figure 5.3 it is evident that the mean values for the factor Conscientiousness are
significantly larger for the respondents with high English proficiency scores from all of the
eleven official language groups. The mean difference (at 95% significance level) for the
languages in Table 5.8 indicates that the largest mean difference was between English
and Xhosa (6.17). Large mean differences for the Conscientiousness factor were also
reported between respondents speaking Tsonga and Xhosa (6.15), and Venda and Xhosa
(5.95) respectively.
Table 5.14 presents the mean differences (at a significance level of p<.05) for the factor
Conscientiousness between the two English proficiency groups (higher and lower).
159
161
163
165
167
169
171
173
Language High English proficiency Low English proficiency

145
Table 5.14
Conscientiousness (41 items) – Statistically Significant Mean Differences between
Languages per English Proficiency Groups
95% Confidence
interval Language n Mean
(Lower EP*)
Mean (Higher
EP*)
Mean Difference
(p<.05)
Standard Error
Effect size (d)
Lower Bound
Upper Bound
English 2 261 161.45 169.16 -7.70 2.01 -.36 -11.65 -3.76 Ndebele 2 002 162.79 166.95 -4.16 1.24 -.19 -6.59 -1.72 Sepedi 23 825 161.29 169.42 -8.13 .39 -.36 -8.90 -7.37 Sotho 7 517 162.05 168.24 -6.20 .65 -.28 -7.47 -4.92 Swati 3 628 164.92 168.20 -3.28 .93 -.17 -5.11 -1.46 Tsonga 10 857 164.86 172.48 -7.62 .57 -.35 -8.74 -6.50 Tswana 6 687 162.51 167.87 -5.36 .70 -.25 -6.73 -3.99 Venda 5 042 163.83 172.46 -8.64 .84 -.39 -10.27 -7.00 Xhosa 17 265 159.49 163.90 -4.42 .44 -.20 -5.27 -3.56 Zulu 19 472 162.34 168.12 -5.78 .40 -.27 -6.56 -5.01 *EP = English proficiency
In the case of the Conscientiousness factor, the largest mean difference (at a significance
level of p<.05) between the lower and higher English proficiency groups (-8.64, d=-.39
moderate effect) was identified for the Venda group. Thus, the higher English proficiency
group with Venda as home language were significantly more inclined (than the lower
English proficiency group) to endorse items measuring the factor Conscientiousness. For
all the language groups, those with higher English proficiency scores were significantly
more inclined than those with lower English proficiency scores to endorse items
measuring Conscientiousness.
5.7.4 Openness to experience
Figure 5.4 illustrates the differences in the mean values (at a 95% significance level) of the
factor Openness to experience for the total language group (blue/solid graph), as well as
for the sub-groups (according to English proficiency scores) per language group.

146
Figure 5.4. Estimated Marginal Means: OPENNESS TO EXPERIENCE
The mean values for the factor Openness to experience are significantly larger for the
respondents with higher English proficiency scores. The mean difference (at a significance
level of p<.05) for the factor Openness to experience identified between the languages in
Table 5.9 indicates that the largest mean difference was between Tswana and Xhosa
(3.43), with another large mean difference between Venda and Xhosa (3.41).
The mean differences (at a significance level of p<.05) for the factor Openness to
experience between the two English proficiency groups (higher and lower) are presented
in Table 5.15.
112
113
114
115
116
117
118
119
120
121
122
Language High English proficiency Low English proficiency

147
Table 5.15
Openness to Experience (32 items) – Statistically Significant Mean Differences between
Languages per English Proficiency Groups
95% Confidence
interval Language n Mean
(Lower EP*)
Mean (Higher
EP*)
Mean Difference
(p<.05)
Standard Error
Effect size (d)
Lower Bound
Upper Bound
English 2 261 112.52 118.89 -6.36 1.45 -.41 -9.20 -3.52 Ndebele 2 002 114.59 119.11 -4.53 1.08 -.24 -6.64 -2.41 Sepedi 23 825 114.52 119.74 -5.22 .35 -.28 -5.90 -4.54 Sotho 7 517 116.12 120.37 -4.24 .50 -.25 -5.23 -3.26 Swati 3 628 115.87 117.93 -2.06 .79 -.12 -3.61 -.50 Tsonga 10 857 115.34 120.72 -5.38 .50 -.28 -6.37 -4.40 Tswana 6 687 117.19 120.21 -3.01 .53 -.19 -4.05 -1.98 Venda 5 042 116.28 121.65 -5.38 .69 -.29 -6.74 -4.02 Xhosa 17 265 113.68 116.38 -2.70 .37 -.13 -3.43 -1.97 Zulu 19 472 115.60 118.31 -2.72 .32 -.16 -3.35 -2.09 *EP = English proficiency
The largest significant mean difference for the Openness to experience factor was
identified for the English group between the lower and higher English proficiency groups
(-6.36, d=-.41 moderate effect). This is an indication that the higher English proficiency
group with a home language of English were more inclined to endorse items measuring
the factor Openness to experience. For all the language groups, those with higher English
proficiency scores were significantly more inclined than those with lower English
proficiency scores to endorse items measuring the factor Openness to experience.
5.7.5 Agreeableness
Figure 5.5 shows the differences in the mean values (at a significance level of p<.05) for
the factor Agreeableness for the total language group (blue/solid graph), as well as for
the sub-groups (according to English proficiency scores) per language group.

148
Figure 5.5. Estimated Marginal Means: AGREEABLENESS
The mean values (at a significance level of p<.05) for the factor Agreeableness are
significantly larger for all respondents with high English proficiency scores, except for
Swati-speaking respondents. The mean difference identified between the languages in
Table 5.10 indicates that the largest mean difference (6.30) was between Venda- and
Xhosa-speaking respondents. Other large mean differences for the BTI factor
Agreeableness were identified between respondents speaking Afrikaans and Venda (-
5.09) and between those speaking Sepedi and Venda (-5.03). The conclusion was reached
that Venda-speaking respondents were more inclined to endorse Agreeableness items
than Afrikaans- and Sepedi-speaking respondents.
The mean differences (at a significance level of p<.05) for the factor Agreeableness
between the two English proficiency groups (higher and lower) are presented in Table
5.16.
128
130
132
134
136
138
140
Language High English proficiency Low English proficiency

149
Table 5.16
Agreeableness (37 items) – Statistically Significant Mean Differences between Languages
per English Proficiency Groups
95% Confidence
interval Language n Mean
(Lower EP*)
Mean (Higher EP*)
Mean Difference
(p<.05)
Standard Error
Effect size (d)
Lower Bound
Upper Bound
English 2 261 129.75 136.65 -6.90 1.84 -.35 -10.51 -3.28 Ndebele 2 002 130.67 135.15 -4.475 1.42 -.18 -7.25 -1.70 Sepedi 23 825 129.21 134.91 -5.70 .51 -.19 -6.71 -4.70 Sotho 7 517 132.82 134.77 -1.95 .66 -.09 -3.25 -.65 Tsonga 10 857 133.46 138.16 -4.70 .69 -.18 -6.05 -3.35 Venda 5 042 134.30 139.66 -5.36 .93 -.29 -7.19 -3.53 Xhosa 17 265 129.09 131.81 -2.73 .55 -.10 -3.80 -1.66 Zulu 19 472 132.04 134.67 -2.63 .43 -.11 -3.48 -1.79 *EP = English proficiency
The largest mean difference (at a significance level of p<.05) for the Agreeableness factor
was identified for the English group between the lower and higher English proficiency
groups (-6.90, d=-.35 moderate effect). This means that the higher English proficiency
group with a home language of English were more inclined to endorse items measuring
Agreeableness. For all the language groups, those with higher English proficiency scores
were significantly more inclined than those with lower English proficiency scores to
endorse items measuring the factor Agreeableness.
5.7.6 Social desirability
Figure 5.6 illustrates the differences in the mean values (at a significance level of p<.05)
for the faking scale, Social desirability, for the total language group (blue/solid graph), as
well as for the sub-groups (according to English proficiency scores) per language group.

150
Figure 5.6. Estimated Marginal Means: SOCIAL DESIRABILITY
The mean values for the factor Social desirability are significantly larger for the
respondents with lower English proficiency scores. The mean difference (at a significance
level of p<.05) identified for the official language groups in Table 5.11 indicated that the
largest statistically significant mean difference was between Afrikaans- and Venda-
speaking respondents (-6.50, d=-.86 large effect). Other large mean differences for the
Social desirability factor of the BTI were identified between Afrikaans and Tsonga (-6.42,
d=-.83 large effect), English and Venda (-6.35, d=-.86 large effect) and English and Tsonga
(-6.26, d=-.79 large effect) respectively.
The mean differences (at a significance level of p<.05) for the faking scale, Social
desirability factor, between the two English proficiency groups (higher and lower) are
presented in Table 5.17.
37
38
39
40
41
42
43
44
45
46
47
Language High English proficiency Low English proficiency
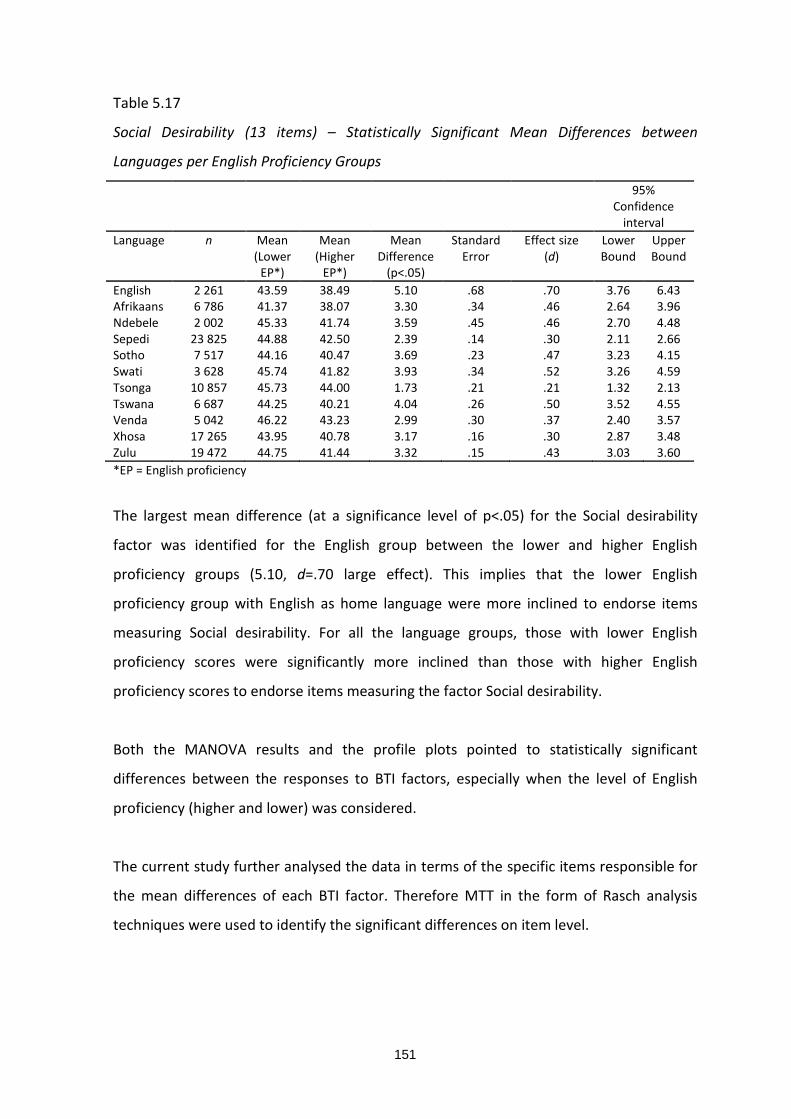
151
Table 5.17
Social Desirability (13 items) – Statistically Significant Mean Differences between
Languages per English Proficiency Groups
95% Confidence
interval Language n Mean
(Lower EP*)
Mean (Higher
EP*)
Mean Difference
(p<.05)
Standard Error
Effect size (d)
Lower Bound
Upper Bound
English 2 261 43.59 38.49 5.10 .68 .70 3.76 6.43 Afrikaans 6 786 41.37 38.07 3.30 .34 .46 2.64 3.96 Ndebele 2 002 45.33 41.74 3.59 .45 .46 2.70 4.48 Sepedi 23 825 44.88 42.50 2.39 .14 .30 2.11 2.66 Sotho 7 517 44.16 40.47 3.69 .23 .47 3.23 4.15 Swati 3 628 45.74 41.82 3.93 .34 .52 3.26 4.59 Tsonga 10 857 45.73 44.00 1.73 .21 .21 1.32 2.13 Tswana 6 687 44.25 40.21 4.04 .26 .50 3.52 4.55 Venda 5 042 46.22 43.23 2.99 .30 .37 2.40 3.57 Xhosa 17 265 43.95 40.78 3.17 .16 .30 2.87 3.48 Zulu 19 472 44.75 41.44 3.32 .15 .43 3.03 3.60 *EP = English proficiency
The largest mean difference (at a significance level of p<.05) for the Social desirability
factor was identified for the English group between the lower and higher English
proficiency groups (5.10, d=.70 large effect). This implies that the lower English
proficiency group with English as home language were more inclined to endorse items
measuring Social desirability. For all the language groups, those with lower English
proficiency scores were significantly more inclined than those with higher English
proficiency scores to endorse items measuring the factor Social desirability.
Both the MANOVA results and the profile plots pointed to statistically significant
differences between the responses to BTI factors, especially when the level of English
proficiency (higher and lower) was considered.
The current study further analysed the data in terms of the specific items responsible for
the mean differences of each BTI factor. Therefore MTT in the form of Rasch analysis
techniques were used to identify the significant differences on item level.

152
5.8 RASCH ANALYSIS
Rasch analysis allows for the investigation of item properties, not only factor properties.
Such analysis can be done independent of the characteristics of the sample, and the
investigation of individuals can also be done independent of the item properties (Henard,
2000). Rasch methods were used to further analyse the effect of language and English
proficiency on the BTI responses and to identify the exact difference and the exact items
that may be responsible for the differences seen in the MANOVA analysis.
5.8.1 Local independence (variance)
One of the assumptions of Rasch analysis requires the responses to the test items to be
independent of one another and to be restricted to the latent trait. The variance between
responses was therefore analysed (Bond & Fox, 2001).
Table 5.18 provides a summary of the items with a correlation higher than .5, which
identifies those items that share more than half their ‘random’ variance with another
item and suggests that only one of the two items is needed for measurement.
Due to the extensive length of the variance table per item, it was not included in an
appendix. The complete variance table for each item is available from the researcher on
request.
This analysis may indicate these as the ‘best’ items, due to them having the highest point-
biserial correlations according to CTT terms.
Table 5.18
Correlations of Residuals (Local Independence)
Correlation Item Item
.51 24 E Gregarious 26 25 E Gregarious 27
.51 29 E Excitement seeking 31 30 Excitement seeking 32
153
5.8.2 Unidimensionality
A second assumption of Rasch analysis is unidimensionality, which indicates that only one
latent trait is measured by the items grouped within it (Wright, 1966). The variance of all
items was tested and acceptable results were obtained for the unidimensionality of the
items that measure the five different personality factors of the BTI.
Due to the extensive length of the dimensionality table, it was not included in an
appendix. The complete dimensionality table is available from the researcher on request.
5.8.3 Item location parameters
5.8.3.1 Rasch person-item map
The Rasch person-item map displays the logit scale down the middle of the map – in
equal intervals – with the respondents located on the map according to their standing on
the latent trait and the items located on the map according to their level of measurement
of the latent trait (Bond & Fox, 2007).
The relationship between the item difficulty (measurement level of latent trait) and the
person ability (standing on latent trait) reported in the Rasch person-item map, the fit of
respondents, reliabilities and item estimates is reported in other output tables (Bond &
Fox, 2001), and will be discussed later in this chapter.
The person-item map is presented in Figure 5.7 for each item per BTI factor.

154
EXTRAVERSION
NEUROTICISM
CONSCIENTIOUSNESS
OPENESS TO EXPERIENCE
AGREEABLENESS
SOCIAL DESIRABILITY
Figure 5.7. Person-Item Map for BTI Items per Factor

155
From Figure 5.7 it is evident that the items are distributed for each factor as follows:
• Extraversion – most items measure at a logit level of 1.5 to -1.5 which covers the
levels on which the respondents are standing on the latent trait (logit 1 to -.8)
sufficiently.
• Neuroticism – most items measure at a logit level of .9 to -.8, except item 59 which
measures the Self-consciousness facet at a logit level of -1.4, while the respondents’
standing on the latent trait measures at a logit level of .5 to -1.5. The measurement is
mostly on a higher logit level than the respondent’s standing on the latent trait.
• Conscientiousness – most items measure at a logit level of 1.1 to -1 which is mostly
lower than the logit level of the respondent’s standing on the latent trait (logit 3 to -
.3).
• Openness to Experience – most items measure at a logit level of 1 to -.8 which is
mostly lower than the logit level of the respondent’s standing on the latent trait (logit
1.8 to -.4).
• Agreeableness – most items measure at a logit level of 1 to -.8 which is mostly lower
than the logit level of the respondent’s standing on the latent trait (logit 2 to -.5).
• Social desirability – most items measure at a logit level of .8 to -.8 which is acceptable
as the respondent’s standing on the latent trait measures at a logit level of 1.2 to -.8.
The conclusion can be reached that the respondents found it relatively easy to endorse all
the items of the BTI, except the items measuring the factor Neuroticism, which were
more difficult to endorse.
5.8.3.2 Fit indices
Rasch analysis techniques require the data to fit the model to ensure that person
response to items is indeed as expected by determining the fit statistics. In Rasch analysis,
two fit statistics are reported, namely infit and outfit statistics (Bond & Fox, 2001).
Through the use of these fit statistics, the Rasch model helps to identify items that do not
fit the model (thereby decreasing both the validity and reliability of the instrument).

156
It also identifies any respondents whose scores do not appear to be consistent with the
model (Taylor, 2008). Wright and Linacre (1994) recommend that rating scale items with
fit values above 1.40 (underfit) or below .60 (overfit) should be excluded from analyses.
Only results of under-or overfit BTI items are summarised in Table 5.19.
Table 5.19
INFIT MNSQ – Item Location Parameters (MNSQ>1.4 and/or MNSQ<.6)
Factor Facet Item Total score
Total count
Measure Model S.E.
Infit MNSQ
Infit ZSTD
Neuroticism Self-consciousness 59 401 889 104 928 -1.28 .00 1.76 9.9
For the total sample of 105 342, only item 59, which measures the facet Self-
consciousness under the factor Neuroticism, indicated underfit with a MNSQ >1.4. This is
an indication of unexpected, unrelated irregularities or too unpredictable responses to
this item (Wright & Linacre, 1994).
However, the MANOVA results indicated clearly that proficiency in English influenced the
responses on the BTI, therefore the sample was divided into two groups – top performers
(top 25%) and low performers (bottom 25%) – based on their English proficiency results.
The item location parameters were tested again for each of these groups and the results
indicating over- or underfit items are displayed in Tables 5.20 and 5.21 respectively.
The INFIT results of over-or underfit items are displayed for lower performers on English
proficiency (bottom 25%) are displayed in Table 5.20, and that of the higher performers
on English proficiency (top 25%) in Table 5.21. Items with INFIT MNSQ values above 1.4
indicate underfit (too unpredictable), which means that there is an unwanted source of
variance or the item does not measure the trait as well as is expected. Items with INFIT
MNSQ values below .6 indicate overfit, which means that these items are too predictable.
In the group with a lower English proficiency score, no items had an INFIT MNSQ below
.6. Furthermore, only two items were found to be a bit too unpredictable, namely item 59
(Self-consciousness from the Neuroticism factor) and item 85 (Social desirability factor).

157
Table 5.20
INFIT MNSQ – Lower Performers (Bottom 25%) on English Proficiency
Factor Facet Item Total score
Total count
Measure Model S.E.
Infit MNSQ
Infit ZSTD
Neuroticism Self-consciousness 59 61 984 16 383 .33 .01 1.53 9.9 Social desirability 85 61 330 16 383 .36 .01 1.43 9.9
The results for the top performers on English proficiency (top 25%) are presented in Table
5.21.
Table 5.21
INFIT MNSQ – Higher Performers (Top 25%) on English Proficiency (MNSQ>1.4 and/or
MNSQ<.6)
BTI Factor Facet Item Total score Total count Measure Model S.E. Infit MNSQ Infit ZSTD
Extraversion Liveliness 11 73 689 16 383 -.48 .01 .54 -7.2
Neuroticism Self-Consciousness 59 61 983 16 383 .32 .01 1.46 9.9
Conscientiousness Effort 79 73 696 16 383 -.48 .01 .54 -7.1
Conscientiousness Effort 80 73 545 16 383 -.47 .01 .51 -7.5
Conscientiousness Order 90 73 826 16 383 -.48 .01 .57 -6.6
Conscientiousness Order 91 74 620 16 383 -.51 .01 .54 -8.3
Conscientiousness Dutiful 99 72 256 16 383 -.41 .01 .52 -6.5
Conscientiousness Dutiful 100 72 844 16 383 -.44 .01 .59 -5.5
Conscientiousness Prudence 106 72 541 16 383 -.43 .01 .51 -6.7
Conscientiousness Prudence 107 65 897 16 383 .08 .01 1.56 9.9 Openness to experience Values 144 62 546 16 383 .29 .01 1.52 9.9
Social desirability 142 56 317 16 383 .61 .01 1.56 9.9
Table 5.21 clearly indicates that eight items were found to be too predictable (INFIT
MNSQ<.6), and four items were too unpredictable (INFIT MNSQ>1.4) in the group with a
higher English proficiency level. The items that were too predictable (items 11, 79, 80, 90,
91, 99, 100 and 106) are not necessarily problematic, but they add little new or additional
information about the underlying trait. The items that are too unpredictable (items 59,
107, 142 and 144) render unexpected and unrelated irregularities when respondents with
a good understanding of English (high English proficiency) endorse these items.

158
Most of the BTI items show good fit to the Rasch model, and since they meet the basic
assumptions of Rasch measurement, further analysis can be done.
Due to the extensive length of the fit tables, it was not included in an appendix. The
complete fit tables are available from the researcher on request.
5.8.4 Differential item functioning (DIF)
Differential item functioning gives a DIF contrast value when comparing the item
locations of different groups. According to Lai, Teresi and Gershon (2005), the DIF
contrast value is seen to indicate a meaningful difference if this value is larger than .5
logits.
A comparison is drawn between the biased items identified by Taylor (2008) and those
identified in the current study. In her study, Taylor (2008) numbered the items according
to the factors to which they contribute, while the current study kept the item numbers of
the instrument. The results for the DIF contrast values for the different languages are
presented in alphabetical order.
The significant DIF contrast values are presented in Tables 5.22 to 5.27 for English as a
contrast language.

159
Table 5.22 EXTRAVERSION – DIF Contrast Values for ENGLISH (N=2 261) Facet Item number Contrast Language DIF contrast value Ascendance 3 Ndebele .69 Sepedi .68 Sotho .66 Swati .56 Tsonga .65 Tswana .72 Venda .56 Xhosa .64 Zulu .69 Ascendance 4 Ndebele .65 Sepedi .72 Sotho .59 Swati .70 Tsonga .79 Tswana .54 Venda .81 Xhosa .54 Zulu .63 Ascendance 5 Swati .59 Tsonga .64 Venda .60 Xhosa .52 Zulu .58 Gregariousness 24 Venda .57 Excitement seeking 33 Xhosa .60 Zulu .65 Excitement seeking 37 Sepedi .60 Tsonga .59 Venda .58
The high contrast values for items 3 and 4 indicate item bias between English
respondents and almost all the African language respondents. Items 5, 24, 33 and 37
showed significant contrast values between English and some of the African languages.
The current study identified only six of the 36 items for Extraversion with significant DIF
between English and the other languages, namely items 3, 4, 5, 24, 33 and 37.
In Taylor’s (2008) study, 15 of the 36 items for Extraversion had significant DIF contrast
values in each of the comparison groups, namely items E1, E3, E4, E7, E12, E16, E17, E18,
E19, E20, E22, E23, E28, E30, and E34.

160
Only items 3 and 4 were identified both by Taylor (2008) and in the current study as items
that indicate DIF when the results of English-speaking respondents were compared with
those of Afrikaans and African language respondents.
Table 5.23 NEUROTICISM – DIF Contrast Values for ENGLISH (N=2 261) Facet Item number Contrast Language DIF contrast value Affective instability 47 Ndebele .67 Sepedi .56 Sotho .61 Swati .64 Tsonga .63 Tswana .54 Venda .60 Xhosa .67 Zulu .56 Depression 55 Ndebele .55 Sepedi .61 Swati .54 Tsonga .62 Venda .60 Zulu .53 Self-consciousness 64 Ndebele .84 Sepedi .83 Sotho .74 Swati .98 Tsonga .77 Tswana .72 Venda .83 Xhosa .90 Zulu .75 Anxiety 71 Swati .67 Tsonga .58 Venda .56 The differences in responses to items 47, 55, 64 and 71 are clearly visible when the BTI is
administered to English respondents and African language respondents. Item 64 resulted
in very high DIF contrast values between English respondents and Ndebele, Sepedi, Sotho,
Swati, Tsonga, Tswana, Venda, Xhosa and Zulu respondents.
The current study identified only 4 of the 34 items for Neuroticism with significant DIF
between English and the other languages, namely items 47, 55, 64 and 71.
In the study by Taylor (2008), she found that 13 of the 34 Neuroticism items showed
significant differences in each of the comparison groups, namely items N6 (item 45), N7

161
(item 46), N9 (item 49), N10 (item 50), N11 (item 51), N12 (item 52), N16 (item 56), N18
(item 59), N22 (item 62), N27 (item 68), N30 (item 71), N32 (item 73) and N33 (item 74).
The only item identified by Taylor (2008) and found in the current study as indicating
significant DIF contrast values for English and Swati, Tsonga and Venda was N30 (item 71).
The results of Conscientiousness DIF contrast values with English as a comparison
language are presented in Table 5.24.
Table 5.24 CONSCIENTIOUSNESS – DIF Contrast Values for ENGLISH (N=2 261) Facet Item number Contrast Language DIF contrast value Order 89 Swati .52 Tsonga .55 Venda .52 Order 90 Sepedi .71 Tsonga .68 Venda .87 Order 92 Sepedi .54 Tsonga .53 Prudence 107 Tsonga .54 Venda .54 Prudence 110 Sepedi .51 Venda .53 Self-discipline 120 Xhosa .55 Zulu .62 Aesthetics 123 Ndebele .52 Sepedi .53 Swati .51 Tsonga .55 Venda .53 The differences in responses to items 89, 90, 92, 107, 110, 120 and 123 are clearly visible
when the BTI is administered to English and African languages. Item 90 resulted in very
high DIF contrast values between English respondents and Sepedi (.71) and Venda (.87)
respondents.
The current study identified only 7 of the 41 items for Conscientiousness with significant
DIF between English and the other languages, namely items 89, 90, 92, 107, 110, 120 and
123.
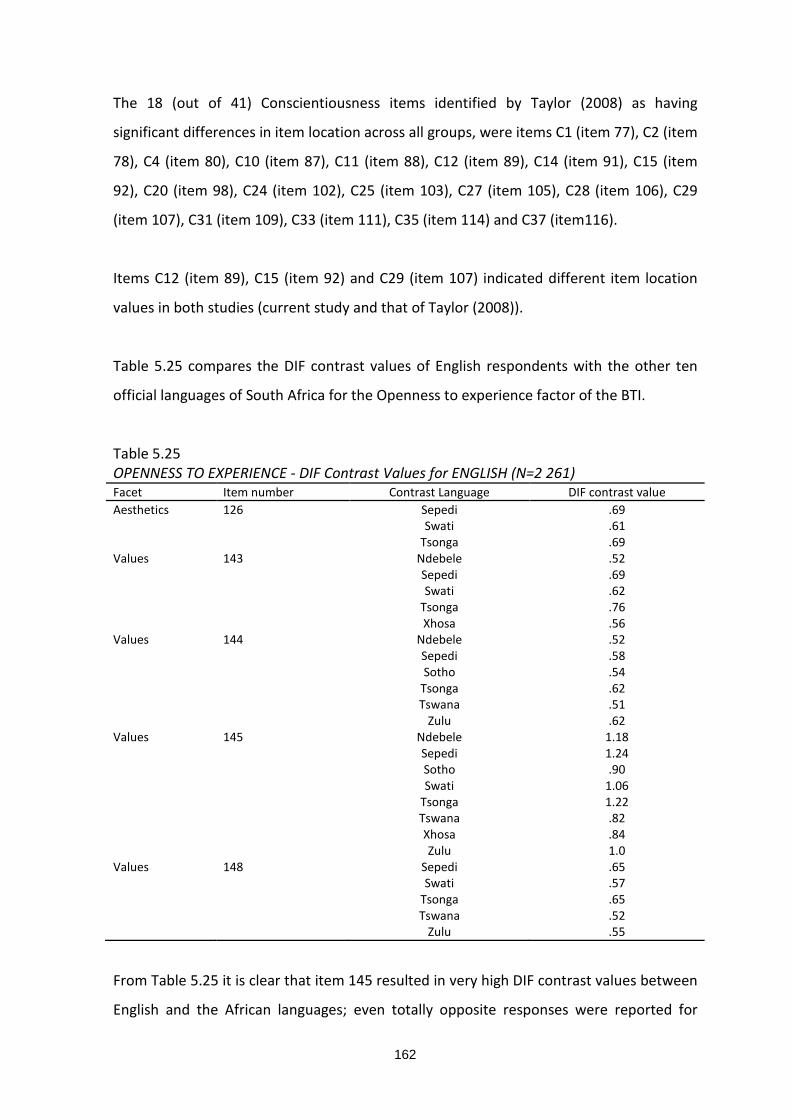
162
The 18 (out of 41) Conscientiousness items identified by Taylor (2008) as having
significant differences in item location across all groups, were items C1 (item 77), C2 (item
78), C4 (item 80), C10 (item 87), C11 (item 88), C12 (item 89), C14 (item 91), C15 (item
92), C20 (item 98), C24 (item 102), C25 (item 103), C27 (item 105), C28 (item 106), C29
(item 107), C31 (item 109), C33 (item 111), C35 (item 114) and C37 (item116).
Items C12 (item 89), C15 (item 92) and C29 (item 107) indicated different item location
values in both studies (current study and that of Taylor (2008)).
Table 5.25 compares the DIF contrast values of English respondents with the other ten
official languages of South Africa for the Openness to experience factor of the BTI.
Table 5.25 OPENNESS TO EXPERIENCE - DIF Contrast Values for ENGLISH (N=2 261) Facet Item number Contrast Language DIF contrast value Aesthetics 126 Sepedi .69 Swati .61 Tsonga .69 Values 143 Ndebele .52 Sepedi .69 Swati .62 Tsonga .76 Xhosa .56 Values 144 Ndebele .52 Sepedi .58 Sotho .54 Tsonga .62 Tswana .51 Zulu .62 Values 145 Ndebele 1.18 Sepedi 1.24 Sotho .90 Swati 1.06 Tsonga 1.22 Tswana .82 Xhosa .84 Zulu 1.0 Values 148 Sepedi .65 Swati .57 Tsonga .65 Tswana .52 Zulu .55
From Table 5.25 it is clear that item 145 resulted in very high DIF contrast values between
English and the African languages; even totally opposite responses were reported for

163
respondents that speak English and those speaking Ndebele, Sepedi, Swati, Tsonga and
Zulu.
The current study identified five of the 32 items of the factor Openness to experience
that had significant DIF when the results of English respondents were compared with
those of the other official language groups, namely items 126, 143, 144, 145 and 148.
Taylor (2008) identified 14 of the 32 items that had significant differences in item
locations across all the comparison groups, namely items O2 (item 122), O3 (item 123),
O4 (item 124), O6 (item 126), O10 (item 131), O12 (133), O14 (item 135), O21 (item 143),
O23 (item 145), O24 (item 146), O26 (item 148), O28 (item 150), O29 (item 151) and O30
(item 152).
Items O6 (item 126), O21 (item 143), O23 (item 145) and O26 (item 148) were identified
in both studies as problematic items with regard to differences in item locations for the
different language groups when compared to English-speaking respondents.
DIF contrast values for the BTI factor Agreeableness are presented in Table 5.26 for all the
official language groups when compared with English respondents.

164
Table 5.26 AGREEABLENESS - DIF Contrast Values for ENGLISH (N=2 261) Facet Item number Contrast Language DIF contrast value Straightforwardness 160 Ndebele .77 Sepedi .68 Sotho .54 Swati .77 Tsonga .79 Xhosa .66 Compliance 168 Ndebele .51 Sepedi .55 Swati .56 Tsonga .61 Prosocial tendencies 177 Ndebele .60 Sepedi .70 Sotho .51 Swati .58 Tsonga .58 Modesty 181 Venda .55 Tendermindedness 192 Ndebele .68 Sepedi .76 Swati .73 Tsonga .86
Items 160, 168, 177, 181 and 192 resulted in DIF contrast values above .5 between
English and African languages.
The current study identified five of the 37 items of the factor Agreeableness with
significant DIF when the results of English respondents were compared with those of the
other official language groups. These five items were 160, 168, 177, 181 and 192.
Previous results reported by Taylor (2008) for the factor Agreeableness revealed that 11
out of the 37 items had significant DIF contrast values in all three comparison groups,
namely items A1 (item 156), A5 (item 160), A8 (item 163), A13 (item 168), A14 (item 169),
A18 (item 173), A19 (item 174), A25 (item 181), A27 (item 183), A30 (186) and A33 (item
189).
Three of these items, namely A5 (item 160), A13 (item 168) and A25 (item 181) were
identified both in the current study and in Taylor’s (2008) study as problematic items with
regard to item locations for English and the other official languages.

165
Table 5.27 SOCIAL DESIRABILITY – DIF Contrast Values for ENGLISH (N=2 261) Item number Contrast Language DIF contrast value 96 Sepedi .51 Xhosa .55 Zulu .51 112 Sepedi .55 Tsonga .54 Venda .64 Zulu .54 128 Ndebele .54 Sepedi .52 Swati .55 Venda .59 Zulu .51
From Table 5.27 it is evident that items 96, 112 and 128 resulted in significant differences
in DIF contrast values between English and some African language respondents.
The significant DIF contrast values for Afrikaans as a contrast language are presented in
Tables 5.28 to 5.33.
Table 5.28 EXTRAVERSION – DIF Contrast Values for AFRIKAANS (N= 6 786) Facet Item number Contrast Language DIF contrast value Ascendance 3 Ndebele .60 Sepedi .59 Sotho .56 Tsonga .55 Tswana .63 Xhosa .54 Zulu .59 Ascendance 4 Ndebele .59 Sepedi .66 Sotho .54 Swati .64 Tsonga .73 Venda .76 Zulu .57 Liveliness 13 Sepedi .51 Tsonga .60 Excitement seeking 37 Sepedi .60 Tsonga .59 Venda .88
Items 3 and 4 showed significant DIF contrast values between Afrikaans and almost all the
African languages.

166
Item 13 was interpreted differently by Afrikaans-speaking respondents and by Sepedi-
and Tsonga-speaking respondents. Item 37 showed significant contrast values for
Afrikaans and Sepedi, Tsonga and Venda.
Only four of the 36 items for Extraversion were identified with significant DIF contrast
values when Afrikaans was used as the contrast language. These were items 3, 4, 13 and
37. Items 3 and 4 were also identified with significant DIF contrast values when English
was used as the contrast language.
In Taylor’s (2008) study, 15 of the 36 items for Extraversion had significant DIF contrast
values in each of the comparison groups, namely items E1, E3, E4, E7, E12, E16, E17, E18,
E19, E20, E22, E23, E28, E30, and E34.
Of these items, only E3 and E4 indicated DIF in the current study and in Taylor’s (2008)
study. Items E13 and E37 were not indicated as DIF items by Taylor (2008).
In Table 5.29, the DIF contrast values above .5 for the Neuroticism factor of the BTI are
presented for the eleven official language groups, when compared with Afrikaans-
speaking respondents.
Table 5.29 NEUROTICISM – DIF Contrast Values for AFRIKAANS (N= 6 786) Facet Item number Contrast Language DIF contrast value Affective instability 47 Ndebele .70 Sepedi .59 Sotho .64 Swati .66 Tsonga .65 Tswana .57 Venda .63 Xhosa .70 Zulu .59 Self-consciousness 64 Swati .54 Anxiety 71 Swati .61 Tsonga .52
Item 47 showed significant contrast values when the BTI was administered to Afrikaans
and all the African languages, while responses to item 64 differed only between Afrikaans

167
and Swati respondents. Item 71 showed significant differences between Afrikaans and
Swati, as well as between Afrikaans and Tsonga responses.
Only three of the 34 items for Neuroticism were identified with significant DIF contrast
values when Afrikaans was used as the contrast language, namely items 3, 4, 13 and 37.
Items 3 and 4 were also identified with significant DIF contrast values when English was
used as the contrast language.
In the study by Taylor (2008), 13 of the 34 Neuroticism items showed significant
differences in each of the comparison groups, namely items N6 (item 45), N7 (item 46),
N9 (item 49), N10 (item 50), N11 (item 51), N12 (item 52), N16 (item 56), N18 (item 59),
N22 (item 62), N27 (item 68), N30 (item 71), N32 (item 73) and N33 (item 74).
N30 (item 71) was the only item identified both by Taylor (2008) and in the current study
as indicating significant contrast values for Afrikaans, and Swati and Tsonga.
The significant DIF contrast values for the factor Conscientiousness with Afrikaans as
contrast language are presented in Table 5.30.

168
Table 5.30 CONSCIENTIOUSNESS – DIF Contrast Values for AFRIKAANS (N= 6 786) Facet Item number Contrast Language DIF contrast value Effort 79 Sepedi .51 Swati .53 Tsonga .56 Order 89 Ndebele .59 Sepedi .63 Sotho .53 Swati .65 Tsonga .68 Venda .65 Zulu .59 Order 90 Sepedi .62 Tsonga .58 Venda .77 Order 95 Tsonga .54 Prudence 107 Tsonga .61 Venda .60 Prudence 110 Sepedi .63 Sotho .51 Venda .65 Self-discipline 120 Swati .52 Xhosa .58 Zulu .66 Seven of the 41 items of the factor Conscientiousness indicated item bias in the current
study, namely items 79, 89, 90, 95, 107, 110 and 120. Item 89 had the most significant
difference in the contrast value between Afrikaans and most of the African languages.
Eighteen of the 41 Conscientiousness items were identified by Taylor (2008) as having
significant differences in item location across all groups. They were items C1 (item 77), C2
(item 78), C4 (item 80), C10 (item 87), C11 (item 88), C12 (item 89), C14 (item 91), C15
(item 92), C20 (item 98), C24 (item 102), C25 (item 103), C27 (item105), C28 (item 106),
C29 (item 107), C31 (item 109), C33 (item 111), C35 (item 114) and C37 (item 116).
Item C12 (item 89) indicated different item location values in both studies. For the
current study, DIF was identified for respondents speaking Ndebele, Sepedi, Sotho, Swati,
Tsonga, Venda and Zulu when compared to Afrikaans-speaking respondents. The same
was found for item C29 (item 107) for Tsonga- and Venda-speaking respondents in
relation to Afrikaans-speaking respondents. Items 89 and 107 were also identified as
problematic items when English was used as the contrast language.

169
Table 5.31 presents the results of the current study for the BTI factor Openness to
experience in terms of the significant DIF contrast values of the official language groups
compared with Afrikaans respondents.
Table 5.31 OPENNESS TO EXPERIENCE - DIF Contrast Values for AFRIKAANS (N= 6 786) Facet Item number Contrast Language DIF contrast value Aesthetics 126 Sepedi .66 Swati .60 Tsonga .69 Values 143 Sepedi .53 Tsonga .59 Venda .63 Values 144 Ndebele .53 Sepedi .59 Sotho .55 Tsonga .63 Tswana .52 Venda .71 Values 145 Ndebele .88 Sepedi .94 Sotho .61 Swati .76 Tsonga .92 Tswana .53 Venda .88 Xhosa .55 Zulu .70 Values 148 Sepedi .64 Swati .56 Tsonga .65 Venda .68 Xhosa .52 Zulu .54
The current study identified five of the 32 items of the factor Openness to experience as
items that have significant DIF contrast values when the results of Afrikaans-speaking
respondents are compared with those of the other official language groups. The items
concerned were 126, 143, 144, 145 and 148.
Items 144, 145 and 148 resulted in very high DIF contrast values between Afrikaans and
the African languages. Item 145 had a very high DIF contrast value for Afrikaans and three
African languages (.88 for Afrikaans and Ndebele, .94 for Afrikaans and Sepedi, and .88 for
Afrikaans and Venda).

170
Taylor (2008) found that 14 of the 32 items had significant differences in item locations
across all comparison groups, namely items O2 (item 122), O3 (item 123), O4 (item 124),
O6 (item 126), O10 (item 131), O12 (item 133), O14 (item 135), O21 (item 143), O23 (item
145), O24 (item 146), O26 (item 148), O28 (item 150), O29 (item 151) and O30 (item 152).
Items 126, 143, 145 and 148 were identified as having significant DIF contrast values in
both studies (i.e. current and Taylor’s (2008)). These four items also indicated DIF when
English was used as the contrast language.
Table 5.32 gives the results of the current study for the BTI factor Agreeableness in terms
of the significant DIF contrast values of the official language groups compared with
Afrikaans respondents.
Table 5.32 AGREEABLENESS – DIF Contrast Values for AFRIKAANS (N= 6 786) Facet Item number Contrast Language DIF contrast value Straightforwardness 160 Ndebele .75 Sepedi .66 Sotho .52 Swati .75 Tsonga .77 Venda .67 Xhosa .65 Zulu .57 Compliance 168 Ndebele .60 Sepedi .64 Sotho .52 Swati .65 Tsonga .70 Venda .61 Prosocial tendencies 173 Tsonga .52 Prosocial tendencies 177 Ndebele .60 Sepedi .65 Swati .54 Tsonga .54 Venda .58 Xhosa .54 Zulu .51 Tendermindedness 192 Sepedi .66 Swati .53 Tsonga .65 Venda .68

171
Only five of the 37 items measuring the factor Agreeableness showed significant DIF
contrast values above .5 between Afrikaans and the African languages. The items
concerned are 160, 168, 173, 177 and 192.
For the BTI factor Agreeableness, 11 out of the 37 items showed significant DIF contrast
values in all three comparison groups, namely items A1, A5, A8, A13, A14, A18, A19, A25,
A27, A30, and A33 (Taylor, 2008).
Based on the DIF contrast values indicated in Table 5.32 for the current study and the
results presented by Taylor (2008), it can be concluded that three only items, A5 (item
160), A13 (item 168) and A18 (item 173) were identified in both studies as problematic
items with regard to item locations for different languages. Items 160 and 168 were also
problematic when English was the contrast language.
Table 5.33 SOCIAL DESIRABILITY - DIF Contrast Values for AFRIKAANS (N= 6 786) Item number Contrast Language DIF contrast value 96 Sepedi .54 Tsonga .52 Xhosa .58 Zulu .54
Significant contrast values were reported for responses to item 96 between Afrikaans and
Sepedi (.54), Afrikaans and Tsonga (.52), Afrikaans and Xhosa (.58) and for Afrikaans and
Zulu (.54). Item 96 also had significant DIF contrast values when English was used as the
contrast language.
Taylor (2008) did not investigate the DIF contrast values for the factor Social desirability.
The significant DIF contrast values for African languages as contrast languages are
presented in Table 5.34.

172
Table 5.34 DIF Contrast Values for AFRICAN LANGUAGES (N=96 295) BTI factor Facet Item number Contrast Languages DIF contrast value Conscientiousness Order 90 Sepedi – Tswana .61 Sepedi - Xhosa .66 Sepedi - Zulu .61 Tsonga - Tswana .58 Tsonga - Xhosa .62 Tsonga – Zulu .58 Venda - Sotho .55 Venda - Swati .58 Venda - Tswana .76 Venda - Xhosa .81 Venda – Zulu .77 Agreeableness Modesty 181 Venda - Tswana .55
Item 90 showed significant DIF contrast values between the African languages with the
contrast value being up to .81 between Venda and Xhosa respondents. This item did not
indicate different item locations in Taylor’s (2008) study.
Item 181 showed a significant difference of .55 between the results of Venda and Tswana
respondents for the factor Agreeableness. Taylor (2008) also identified A25 (item 181) as
a problematic item when the BTI was administered to different language groups.
Across all the Big Five personality factors measured with the BTI, relatively fewer items
indicated DIF among the African languages, than for the English and Afrikaans groups.
Due to the extensive length of the DIF contrast value table for the entire sample, it was
not included in an appendix. The complete DIF contrast value table for the entire sample
is available from the researcher on request.
The impact of home language and English proficiency was very clear from the MANOVA
results, therefore the sample was divided into two groups based on their English
proficiency results, namely a high-performing (top 25%) and low-performing (bottom
25%) group. The DIF analyses were repeated for both these groups.

173
5.8.4.1 DIF – Low performers on English proficiency (bottom 25%)
Table 5.35 presents the high DIF contrast values for the different BTI factors for all the
official language groups compared to Afrikaans respondents, for those respondents who
performed lower on the English proficiency tests.
Table 5.35 DIF Contrast Values for AFRIKAANS – Low Performers (Bottom 25%) on English Proficiency BTI factor Facet Item number Contrast Language DIF contrast value Extraversion Liveliness 13 Sepedi .53 Tsonga .54 Conscientiousness Self-discipline 120 Xhosa .51 Social desirability 85 Ndebele .53 128 Venda .55 Zulu .51
Only a few items (13, 120, 85 and 128) indicated DIF between Afrikaans and some African
languages for the lower English proficiency group. The DIF contrast values are just above
.5, which is significant but not very high.
None of these items were indicated by Taylor (2008) as having different item locations.
No significant differences were reported between English and the African languages or
among the African languages for the lower performers on English proficiency.
Due to the extensive length of the DIF contrast value table for the lower English
proficiency group, it was not included in an appendix. The complete DIF contrast value
table for the lower English proficiency group is available from the researcher on request.
5.8.4.2 DIF – High performers on English proficiency (top 25%)
Mostly the same items as identified for Afrikaans again indicated DIF between English and
African languages for the higher performers on English proficiency. Items 3, 4, 6, 24, 31,
32, 37, 47, 64, 107, 126, 139, 168, 192 and 128 showed significant DIF contrast values, as
indicated in Table 5.36.

174
Table 5.36 DIF Contrast Values for ENGLISH – High Performers (Top 25%) on English Proficiency BTI factor Facet Item number Contrast Language DIF contrast value Extraversion Ascendance 3 Ndebele .74 Sepedi .76 Sotho .61 Swati .51 Tsonga .75 Tswana .64 Venda .74 Xhosa .58 Zulu .65 Ascendance 4 Ndebele .57 Sepedi .57 Swati .59 Tsonga .68 Venda .72 Zulu .51 Ascendance 6 Venda .57 Gregariousness 24 Venda .54 Excitement seeking 31 Tsonga .51 Venda .54 Excitement seeking 32 Venda .54 Excitement seeking 37 Sepedi .61 Tsonga .64 Venda .69 Neuroticism Affective instability 47 Ndebele .53 Xhosa .63 Self-consciousness 64 Swati .58 Venda .66 Conscientiousness Prudence 107 Venda .53 Openness to experience Aesthetics 126 Sepedi .54 Swati .52 Tsonga .58 Venda .63 Actions 139 Xhosa .51 Agreeableness Compliance 168 Ndebele .58 Sepedi .65 Swati .61 Tsonga .67 Venda .56 Tendermindedness 192 Sepedi .52 Tsonga .57 Venda .59 Social desirability 128 Ndebele .51 Sepedi .54 Swati .56 Tsonga .51 Venda .63 Zulu .52 Several of these items were also identified by Taylor (2008) as problematic with regard to
bias, namely E3 (item 3), E4 (item 4), E22 (item 24), E34 (item 37), C29 (item 107), O6
(item 126) and A13 (item 168).

175
Item 128 that measures Social desirability was identified as a biased item when the
Afrikaans and English language groups were compared. The item was particularly biased
for the Venda-speaking respondents in the higher English proficiency group.
The significant DIF contrast values for the BTI factors for the official language groups
compared with Afrikaans respondents are presented in Table 5.37 for the respondents
who performed well on the English proficiency tests.
Various items indicated DIF for the higher performers on English proficiency, namely
items 3, 4, 6, 32, 34, 37, 42, 51, 66, 93, 108, 110, 114, 126, 151, 160, 168 and 128, which
showed significant DIF contrast values between Afrikaans and some African languages.
Several of these items were also identified by Taylor (2008) as problematic with regard to
bias, namely E3 (item 3), E4 (item 4), E34 (item 37), N11 (item 51), C35 (item 114), O6
(item 126), O29 (item 151), A5 (item 160) and A13 (item 168).

176
Table 5.37 DIF Contrast Values for AFRIKAANS – High Performers (Top 25%) on English Proficiency BTI factor Facet Item number Contrast Language DIF contrast value Extraversion Ascendance 3 Ndebele .72 Sepedi .74 Sotho .59 Tsonga .73 Tswana .62 Venda .71 Xhosa .56 Zulu .62 Ascendance 4 Tsonga .55 Venda .59 Ascendance 6 Tsonga .52 Venda .61 Excitement seeking 32 Venda .55 Excitement seeking 34 Venda .54 Excitement seeking 37 Sepedi .57 Tsonga .60 Venda .65 Neuroticism Affective instability 42 Venda .55 Depression 51 Venda .56 Self-consciousness 66 Tsonga .52 Venda .59 Conscientiousness Order 93 Tsonga .53 Venda .51 Prudence 108 Tsonga .53 Venda .52 Prudence 110 Sepedi .52 Venda .57 Self-discipline 114 Swati .55 Openness to experience Aesthetics 126 Sepedi .53 Swati .51 Tsonga .57 Venda .62 Imagination 151 Venda .53 Agreeableness Straightforwardness 160 Ndebele .53 Swati .57 Tsonga .6 Venda .58 Xhosa .55 Compliance 168 Ndebele .57 Sepedi .63 Swati .59 Tsonga .66 Venda .55 Social desirability 128 Venda .55
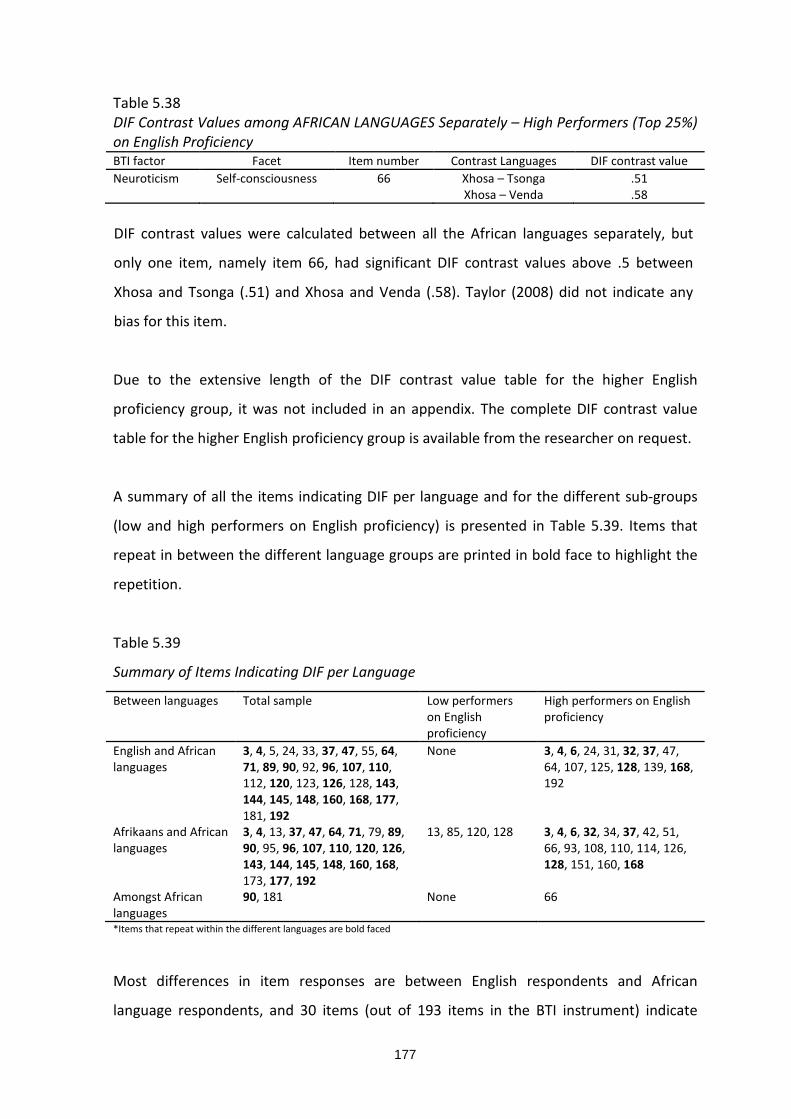
177
Table 5.38 DIF Contrast Values among AFRICAN LANGUAGES Separately – High Performers (Top 25%) on English Proficiency BTI factor Facet Item number Contrast Languages DIF contrast value Neuroticism Self-consciousness 66 Xhosa – Tsonga .51 Xhosa – Venda .58 DIF contrast values were calculated between all the African languages separately, but
only one item, namely item 66, had significant DIF contrast values above .5 between
Xhosa and Tsonga (.51) and Xhosa and Venda (.58). Taylor (2008) did not indicate any
bias for this item.
Due to the extensive length of the DIF contrast value table for the higher English
proficiency group, it was not included in an appendix. The complete DIF contrast value
table for the higher English proficiency group is available from the researcher on request.
A summary of all the items indicating DIF per language and for the different sub-groups
(low and high performers on English proficiency) is presented in Table 5.39. Items that
repeat in between the different language groups are printed in bold face to highlight the
repetition.
Table 5.39
Summary of Items Indicating DIF per Language
Between languages Total sample Low performers on English proficiency
High performers on English proficiency
English and African languages
3, 4, 5, 24, 33, 37, 47, 55, 64, 71, 89, 90, 92, 96, 107, 110, 112, 120, 123, 126, 128, 143, 144, 145, 148, 160, 168, 177, 181, 192
None 3, 4, 6, 24, 31, 32, 37, 47, 64, 107, 125, 128, 139, 168, 192
Afrikaans and African languages
3, 4, 13, 37, 47, 64, 71, 79, 89, 90, 95, 96, 107, 110, 120, 126, 143, 144, 145, 148, 160, 168, 173, 177, 192
13, 85, 120, 128 3, 4, 6, 32, 34, 37, 42, 51, 66, 93, 108, 110, 114, 126, 128, 151, 160, 168
Amongst African languages
90, 181 None 66
*Items that repeat within the different languages are bold faced
Most differences in item responses are between English respondents and African
language respondents, and 30 items (out of 193 items in the BTI instrument) indicate

178
significant DIF contrast values. Differences in responses for 25 items were recorded
between Afrikaans and African languages, while only 2 items had significant DIF contrast
values among the African languages.
Only 4 items indicated significant DIF contrast values and these were only between
Afrikaans and African languages for the lower English proficiency group.
For the higher English proficiency group, more items with significant DIF contrast values
between Afrikaans and the African languages (18 items) were identified than for the
lower English proficiency group, while only 15 items showed item bias between English
and the African languages, and only one (item 66) was biased among the African
languages.
The items that indicate DIF per BTI factor are summarised in Table 5.40 to highlight the
number of DIF items per BTI factor, as well as the difference between the low performers
on English proficiency and the number of DIF items identified for the high performers on
English proficiency.
Table 5.40 Summary of Items Indicating DIF per BTI Factor BTI factor Total sample
Low performers on English proficiency
High performers on English proficiency
Items indicating DIF in both studies (Taylor (2008) and current study)
Extraversion 3, 4, 5, 13, 24, 33, 37
13 3, 4, 6, 24, 31, 32, 34, 37
3, 4
Neuroticism 47, 55, 64, 71 42, 47, 51, 64, 66 71 Conscientiousness 79, 89, 90, 92, 95,
107, 110, 120, 123 120 93, 107, 108, 110,
114 89, 107
Openness to experience
126, 143, 144, 145, 148
126, 139, 151 126, 143, 145, 148
Agreeableness 160, 168, 173, 177, 181, 192
160, 168, 192 160, 168
Social desirability 96, 112, 128 85, 128 128 96
The number of items with bias differs substantially between the higher and lower
performers on English proficiency.

179
The sub-sample with higher English proficiency scores indicated more items with
significant differences between languages than did the lower English proficiency group.
Contrary to expectation, more biased (DIF) items were identified for the higher English
proficiency group than for the lower English proficiency group. The conclusion can be
drawn that the differences between the home language groups are due to intrinsic
personality characteristics and therefore the respondents with higher English proficiency
scores understand the items better and are more inclined to endorse these items. If
respondents understand the item better, they should only be more inclined to endorse
the item if they have more of the underlying construct being measured with that specific
item. The intrinsic characteristics of the respondents, rather than measurement
errors/item bias of the BTI instrument, lead to different response patterns for the
different home language groups.
Differences in response levels on the factors measured should be evidence of ‘real’
differences on the constructs being measured. Thus it is recommended that characteristic
differences between the response patterns of the different home language groups should
be investigated in future research.
The following items indicated significant DIF in both studies (the current study and
Taylor’s (2008)) for all the different languages, namely items E3 (item 3), E4 (item 4), N29
(item 71), C12 (item 89), C29 (item 107), O6 (item 126), O21 (item 143), O23 (item 145),
O26 (item 148), A5 (item 160), A13 (item 168) and item 96 that measures Social
desirability.
5.9 SUMMARY
Internationally, various studies (Boyle, 2008; Heuchert et al., 2000; Hull et al., 2010;
McCrae, Costa, Del Pilar, Rolland & Parker, 1998; McCrae et al., 1996; Rolland, Parker &
Stumpf, 1998; Taylor, 2000, 2004; Zhang & Akande, 2002) have been conducted on the
cross-cultural applicability of personality instruments, focusing on the effect of culture,
race and gender on the response patterns. Rasch analysis techniques are known to
identify the differences between response patterns as they are not sample dependent

180
and can give an indication of the persons’ standing on the latent trait, as well as the level
on which the items measure the different factors of the personality instrument.
Differential item functioning (DIF), or the presence of item bias, is perhaps the main cause
of frustration for the test developer (Taylor, 2008). Therefore test developers and
researchers need to make sure that the differences in responding to personality items are
due to real differences in personality, and not differences in the understanding of the
meaning of the items for different (language) groups (Meiring et al., 2005).
When interpreting personality tests for diverse ethnic groups (or in this case different
language groups), the test user must be certain that any difference in item responses is
due to actual group differences and not the result of biased test items (Taylor, 2008).
Item bias in personality assessment occurs when different groups of equal standing on a
trait or personality factor respond differently to the items measuring that trait or factor.
Different item responses suggest that the item interacts with the group characteristic,
rather than being a pure indicator of the trait (Taylor, 2008). The analysis of differential
item functioning (DIF) in psychological instruments is a valuable technique for
understanding the differences and similarities in how certain psychological constructs
manifest in different cultural groups (Meiring et al., 2005).
Although recent studies have been conducted regarding the investigation of item bias in
psychological instruments in South Africa (Meiring et al., 2005), there is little evidence of
any investigation into the impact of all of South Africa’s eleven official languages on
personality instruments. The current study is at present the only available one with sub-
sample sizes large enough for bias analysis in all eleven official languages separately and
hence will contribute towards the better understanding and measurement of personality
in South Africa. The current study further contributes in terms of the analysis done for
two different English proficiency levels for each of the official languages of South Africa.
The BTI responses were analysed for the different language groups and for two different
English proficiency levels with the dependent variable, the BTI factors.

181
The results were reported in this chapter according to the CTT methods, Manova with
post-hoc Sheffe test, as well as MTT methods, focusing on Rasch analysis.
The implications of the results, limitations, conclusions and recommendations will be presented in Chapter 6.

182
CHAPTER 6: DISCUSSION AND CONCLUSION
6.1 INTRODUCTION
Personality characteristics refer to important, relatively stable and long-lasting aspects that
have a strong influence on human behaviour (Ewen, 2010). Patel (2006) indicated that each
of the many personality theories and instruments available to measure personality, come
with its own set of strengths and weaknesses and that none of them should be classified as
being better than another. The best way to capture the uniqueness of personality
characteristics more accurately is to integrate the best qualities of each theory with the best
personality instrument (Johnson, 1997).
The language diversity of South Africa is not always accommodated in the development of
personality instruments, since these instruments are mostly imported and adapted for local
use (Van de Vijver & Rothman, 2004). South Africa has eleven official languages in terms of
Section 6 of the Constitution (Government Gazette, 1996). Meiring (2007) highlighted that
the language in which the psychometric instrument is administered impacts on the
responses, as it is mostly not done in the respondent’s home language. Therefore the
possiblity of bias needs to be included in any research studies on the psychological properties
of instruments.
Taylor and De Bruin (2006) identified the FFM as the most applicable personality theory for
the South African context and integrated it with previous research by De Bruin (1997) on the
way items are presented and the factor descriptions of the NEO PI-R (Costa & McCrae,
1992b), to develop a personality instrument for South Africa, namely the BTI. The BTI is based
on the Big Five personality factors. This instrument had to meet the personality
assessment needs within the unique multicultural and multilingual environment of South
Africa. The BTI (Taylor & De Bruin, 2006) was developed in an attempt to contribute to
the availability of locally developed and validated personality instruments. Research by
Taylor (2004; 2008), and Taylor and De Bruin (2006) indicated that the BTI can be
administered with some success within the multicultural and multilingual environment of
South Africa.

183
Taylor (2008) however identified some problematic items when she analysed the
construct, item and response bias of the BTI across cultures for three language groups,
namely Afrikaans, English and indigenous African languages, and consequently
acknowledged a need for further research in this regard. In her study limited language
group comparisons were done for the student sample group used. Taylor (2008)
recommended that working samples should be used and that more language groups
should be compared. These recommendations were addressed in the current study.
Throughout the current study, previous research results as well as the description of the
personality instrument was made in terms of two broad categories of personality
instruments, namely a general category (16PF, 16PF (SA92), 16PF5, 15FQ, 15FQ+ and SAPQ)
and a category for personality instruments based on the Big Five theory and Five-Factor
Model (FFM) (Comrey, NEO PI-R, BTI).
The purpose of the current study was to extend the research done on the BTI and to
investigate the impact that each of the eleven official languages of South Africa and the
understanding of the administration language (i.e. English proficiency) has on the
responses to the BTI items for a working adult group. The researcher identified the need
in South Africa for a comprehensive study on the impact of each of the eleven official
languages on the responses of the BTI and the need for a large enough sample group.
Internationally the current study contributes towards the understanding of the impact
that home language and language proficiency have on personality assessment, since it
explored the impact of each of the eleven official South African languages in terms of the
response patterns on the BTI. The sample per official language group was large enough to
analyse each language’s impact individually on each item of the BTI. The current study
addressed shortcomings of previous literature and sensitised researchers and test developers
to further refine and improve the BTI. Research methods used in the current study set an
example for the development of other new personality instruments for use in South Africa in
adherence to the prescriptions of the Employment Equity Act (Government Gazette, 1998).

184
The current study enhanced the declaration made by Matsumoto et al. (2001) which was
to continue the development and refinement of analysis methods in cross-cultural
research in order to further enhance the contribution to psychological practice
throughout the world.
6.2 RELIABILITY
In the current study the Cronbach alpha reliability estimates indicated very good internal
consistency reliabilities for the BTI factors for all eleven official languages of South Africa.
Cronbach alpha coefficients above .84 were reported for the Big Five factors measured
with the BTI and above .70 for the faking scale (Social desirability) for all the languages.
The fact that the BTI showed good internal consistency reliability for all eleven languages
in South Africa was considered very significant evidence, and this fact provided
supportive evidence for future use of the BTI in the South African context.
With regard to the MTT, Rasch analysis produces reliability measures in terms of the item
separation index (ISI) and each person's responses or the person separation index (PSI).
The PSI describes the number of levels that could be created for people with different
abilities or standings on the latent trait (Wright & Stone, 1999). It determines how well
the items differentiate between persons with different ability levels or different standings
on the particular personality factor being measured (Bond & Fox, 2001). The ISI is
generated to determine the item reliability in Rasch terms, which is an indication of the
replicability of item difficulty/level of measurement. Should the analyses be repeated
with another sample of participants, it could be expected that the difficulty order or level
of measurement of each item would remain the same and that the items will be well
separated in terms of their difficulty or level of measurement parameters (Bond & Fox,
2007).
ISI and PSI values are expressed as reliabilities and range from .0 to 1.0 (Wright & Stone,
1999). Higher separation values indicate better separation between items or persons and
therefore show more precise measurement of the instrument (Wright & Stone, 1999).

185
The ISI calculated for the different Big Five personality factors measured by the BTI was
1.00 for each of the factors, as well as for the faking scale (Social desirability). This is an
indication that the items were well separated in terms of their location parameters and
that the order of the items should remain the same, should the analysis be repeated with
another sample.
Very high reliability coefficients were reported in the most recently study on the BTI
factors, reported Cronbach alpha coefficients and PSI values were Extraversion (α=.90;
PSI=.89), Neuroticism (α=.94; PSI=.93), Conscientiousness (α=.94; PSI=.92), Openness to
experience (α=.88; PSI=.85), and Agreeableness (α=.88; PSI=.86) (Taylor, 2008).
Eventhough the reliability in terms of Cronbach alpha coefficients (α) and the PSI were
reported a bit lower in the current study; it is still acceptable and can be considered as
high values. The Cronbach alpha coefficients and PSI values reported in the current study
were as follows: Extraversion (α=.86; PSI=.85), Neuroticism (α=.89; PSI=.86),
Conscientiousness (α=.93; PSI=.88), Openness to experience (α=.90; PSI=.84),
Agreeableness (α=.94; PSI=.86) and Social desirability (α=.72; PSI=.70).
These high reliability values indicated that the BTI items effectively separated
respondents (any language) in terms of their standing on the different traits/factors
measured. It was concluded that the BTI is a very reliable instrument that measures the
Big Five personality factors very accurately for all of the eleven official languages in South
Africa.
6.3 MULTIVARIATE ANALYSIS (MANOVA)
To further investigate if there was a difference between the response patterns of the
different language groups in South Africa on the BTI items, CTT methods were used. The
Komogorov-Smirnov test was first used to assess whether the distribution was normal
and whether parametrical or non-parametrical analysis methods should be used. Even
though the Komogorov-Smirnov test indicated that all the factors were not normally
distributed, the central limit theorem was applied and the decision was made –

186
considering the large sample sizes available - to continue with MANOVA analysis
techniques.
MANOVA comprises multivariate analyses where F-ratios are obtained to indicate the
influence that more than one independent variable have on the dependent variable. The
MANOVA analyses indicated that there are significant differences between the responses
to the BTI factors (dependent variable), for home language (first independent variable)
and the level of English proficiency (second independent variable).
Cohen’s d (1988) guidelines were used to interpret the practical significance of the mean
difference between groups in terms of standard deviation units, namely:
• < 0.1 = trivial effect
• 0.1 - 0.3 = small effect
• 0.3 - 0.5 = moderate effect
• > 0.5 = large difference effect
The MANOVA analysis revealed significant differences in the BTI factors by respondents
with different home languages (Wilks’ Lambda = .917, p<.001, Eta2=.01) and for the
different levels of English proficiency (Wilks’ Lambda =.865, p<.001, Eta2=.14).
Even though most languages had small effect sizes (Cohen’s d), some factors were
identified with high statistical significance and moderate to high practical significance.
Moderate practical significance were identified for Neuroticism, specifically between
English and Xhosa speaking respondents (mean difference=-8.58, d=-.46), English and
Ndebele (mean difference=-7.2, d=-.39), English and Sepedi (mean difference=-7.6, d=-
.41) and English and Zulu (mean difference=-7.65, d=-.41).
Even though some high statistical significant mean differences were found for the factor
Agreeableness, all the effect sizes were small.
All the official languages had statistically significant mean differences for the factor Social
desirability but only the following were identified as having large effect sizes (practical

187
significance): between Afrikaans- and Venda speaking respondents (mean difference=-
6.50, d=-.86), Afrikaans and Tsonga (mean difference=-6.42, d=-.83), English and Venda
(mean difference=-6.35, d=-.86) and between English and Tsonga (mean difference=-6.26,
d=-.79).
The most language groups identified with the most statistically significantly mean
differences were identified for Xhosa- and Venda-speaking respondents, therefore it was
concluded that these respondents might have had the most difficulty to endorse the
items of the BTI.
In terms of the English proficiency levels, more factors were identified with statistical and
practical significance. For the factor Extraversion the highest statistical significant mean
difference between the lower and higher English proficiency groups was reported for the
English speaking respondents (mean difference=-6.73, d=-.39), which is a moderate
practical significance. The largest statistically significant mean difference for the factor
Neuroticism was also reported for the English group, between the lower and higher
English proficiency groups, but with a large practical significance (mean difference=13.04,
d=.68). However, all the language groups with lower English proficiency scores were
significantly and practically (large effect sizes) more inclined than the higher English
proficiency group to endorse items measuring Neuroticism.
In the case of the Conscientiousness factor, the largest statistically significant mean
difference between the lower and higher English proficiency groups (-8.64, d=-.39
moderate effect) was identified for the Venda group. However, for all the language
groups, those with higher English proficiency scores were significantly more inclined than
those with lower English proficiency scores to endorse items measuring
Conscientiousness.
The largest significant mean difference for the Openness to experience factor was
identified for the English group between the lower and higher English proficiency groups
(mean difference=-6.36, d=-.41 moderate effect). However, for all the language groups,
those with higher English proficiency scores were significantly more inclined than those

188
with lower English proficiency scores to endorse items measuring the factor Openness to
experience.
The largest mean difference (at a significance level of p<.05) for the Agreeableness factor
was identified for the English group between the lower and higher English proficiency
groups (-6.90, d=-.35 moderate effect). However, for all the language groups, those with
higher English proficiency scores were significantly more inclined than those with lower
English proficiency scores to endorse items measuring the factor Agreeableness.
For all the language groups, those with lower English proficiency scores were significantly
more inclined than those with higher English proficiency scores to endorse items
measuring the factor Social desirability. The largest mean difference (at a significance
level of p<.05) for the Social desirability factor was identified for the English group
between the lower and higher English proficiency groups (5.10, d=.70 large effect).
MTT in the form of Rasch analysis was used to determine at an item level which items
within each of the Big Five factors measured with the BTI were responsible for the
significant differences indicated in the MANOVA.
The main research hypotheses for this research were the following:
H1: Home language influences the responses to BTI items.
H2: English proficiency, as an additional independent variable, influences the response
patterns on the BTI.
These hypotheses were confirmed.
6.4 RASCH ASSUMPTIONS
Rasch analysis have two basic assumptions. These two assumptions, namely local
independence and dimensionality were tested before Rasch analysis techniques were
applied.

189
6.4.1 Local independence
The local independence for all items was tested to ensure that the responses to each item
were independent of one another (Embretson & Reise, 2000). It was found that the
variance of the responses was acceptable for all the items, except for items 26 and 27
(measuring the facet Gregariousness), which might be related to each other, and also
items 31 and 32 (measuring the facet Excitement seeking), which might be related to
each other for the BTI factor Extraversion.
6.4.2 Dimensionality
The dimensionality of the BTI items was analysed and indicated that only one latent trait
(dimension/factor) was measured per item (Embretson & Reise, 2000).
6.5 FIT INDICES
The logical pattern of responses was investigated to determine the fit of the items and
individuals who responded to these specific items in terms of the Rasch model. Only item
59 indicated underfit, meaning that this item might be too unpredictable in measuring
the facet Self-consciousness within the BTI factor Neuroticism.
However, the logical pattern of responses changed dramatically when the sample was
divided into the lower performers (bottom 25%) and higher performers (top 25%) on the
English proficiency tests. Item 59 (Neuroticism factor, facet Self-consciousness) again
indicated underfit as well as item 85 (Social desirability item), which indicated underfit for
the lower English proficiency group, meaning that these items might be too
unpredictable. No overfit items were indicated for the low English proficiency group.
For the high performance group on English proficiency, four items (items 59, 107, 142 and
144) indicated underfit (too unpredictable), these four items measured low on the
person-item map – which should have been an indication that it was easy to endorse, but
these items were even more difficult to endorse for the high English proficiency group,
190
compared to the low English proficiency group. These items can be seen as not fitting the
model as the model expects them to be easier to endorse, therefore the conclusion was
made that these items are too unpredictable.
For the high performance group on English proficiency, eight items (items 11, 79, 80, 90,
91, 99, 100 and 106) indicated overfit and could therefore be considered too predictable.
All these items are from the Conscientiousness factor.
6.6 DIFFERENTIAL ITEM FUNCTIONING
A number of items showed statistically significant differences in item responses, which
according to Taylor (2008) indicates item bias. Therefore it was deemed necessary to
further investigate the DIF of each BTI item in the current study.
Based on the MANOVA results, the impact of home language and English proficiency was
very clear and therefore the sample was divided into two groups according to their
English proficiency results. DIF analysis was subsequently done for the total sample, the
lower English proficiency group and the higher English proficiency group. Contrary to
expectation, the higher English proficiency group had more items with significant DIF
contrast values, especially for Extraversion and Neuroticism, but fewer items for the other
three BTI factors. The lower English proficiency group indicated fewer items with
significant DIF contrast values for all the BTI factors.
In the total sample, seven of the 36 items (items 3, 4, 5, 13, 24, 33 and 37) had significant
DIF contrast values for the Extraversion factor, only one item (item 13) indicated bias for
the lower English proficiency group, but eight of the 36 items (items 3,4,6,24,31,32,43
and 37) had significant DIF contrast values.
Four of the 34 Neuroticism items (items 47, 55, 64 and 71) indicated item bias for the
total sample, none showed bias for the lower English proficiency group, and five of the 34
items (items 42, 47, 51, 64 and 66) showed significant differences in the DIF contrast
values for the higher English proficiency group.

191
The nine out of 41 Conscientiousness items that showed significant differences in item
bias were items 79, 89, 90, 92, 95, 107, 110, 120 and 123 for the total sample. For the
lower English proficiency group only one item had a significant difference in DIF contrast
value, namely item 120, whereas five items indicated bias for the higher English
proficiency group, namely items 93, 107, 108, 110 and 114.
For the Openness to Experience scale, five of the 32 items had significant differences in
item bias, namely items 126, 143, 144, 145 and 148 for the total sample. No items
indicated item bias for the lower English proficiency group and only three items (items
126, 139 and 151) had significant DIF contrasting values for the higher English proficiency
group.
Six out of 37 items (items 160, 168, 173, 177, 181 and 192) from the Agreeableness scale
showed significant DIF contrast values for the total sample; although none indicated bias
in the lower English proficiency group, three did for the higher English proficiency group,
namely items 160, 168 and 192.
For the Social desirability scale, three items indicated significant DIF contrast values for
the total sample, namely items 96, 112 and 128. Only two items indicated significant DIF
contrast values for the lower English proficiency group, namely items 85 and 128, and
only item 128 had a significant DIF contrast value for the higher English proficiency group.
The biased items were compared with the items identified by Taylor (2008) for all the
different languages and only 12 out of 193 items were identified that indicated significant
DIF in both studies (current and Taylor (2008)) for all the different languages. These were
items E3 (item 3), E4 (item 4), N29 (item 71), C12 (item 89), C29 (item 107), O6 (item
126), O21 (item 143), O23 (item 145), O26 (item 148), A5 (item 160), A13 (item 168) and
item 96 (measuring Social desirability). The recommendation is made that the content of
these items should be investigated as possible reasons for the DIF between the different
language groups.

192
Because of the relatively small number of biased items (34 out of 193) identified in the
current study, the conclusion was drawn that the differences between traits for the
different home language groups are due to intrinsic personality characteristics, rather
than an indication of bias on the items. The fact that more items indicated bias for the
higher English proficiency group was also an indication that the intrinsic personality
characteristics may have resulted in differences in the mean scores rather than the items
of the BTI. It was assumed that the respondents with higher English proficiency scores
understood the items better and would have been more inclined to endorse those items
measuring the trait on which they showed a higher standing. In other words, if
respondents understand an item better, they will be more inclined to endorse that item
when they have more of the underlying construct being measured with that specific item.
It is therefore the intrinsic characteristics that result in different response patterns
between the different home language groups, rather than measurement errors/item bias
of the BTI instrument. Other instruments on the traits measured are available and the
differences between the intrinsic characteristics of the different official languages should
therefore be further investigated in future studies.
6.7 IMPLICATIONS OF THE RESULTS
Psychologists need to keep in mind that multicultural and multilingual environments
influence responses to personality items. When the same personality instrument is
administered in English to respondents with other home languages, the individuals’
understanding of the items will influence their responses. The response to a personality
instrument’s items is therefore a result of many variables, among others the standing on
the trait, home language, the intrinsic characteristics related to the respondents’
language/culture and the level of understanding of the administration language.
Van de Vijver and Hambleton (1996) summarised practical guidelines for the traslation of
tests, as well as methods and methodological issues (Van de Vijver & Leung, 1997, 2001) for
cross-cultural data analyses. Multiple sources of error and bias inherent to cross-cultural
personality assessment were identified by Van de Vijver and Poortinga (1997) and Van de
Vijver and Tanzer (1997) highlighted analysis needed in terms of bias and equivalence in

193
cross-cultural assessments. Cheung et al. (2011) stated that personality instruments should
be evaluated thoroughly for comparibility across different languages and culture groups,
before any decisions or predictions can be made on the basis of the assessment results.
Meiring et al. (2005) proposed that scientifically scrutinising of personality instruments are
needed and that it is essential to use advanced research methodologies and representative
samples, specifically for cross-cultural research on personality instruments.
Within South Africa, a multilingual and multicultural environment, limited studies with
regard to personality instruments are available. Examples of research are Meiring et al.
(2006) who investigated the bias in an adapted version of the 15FQ+; Taylor and Boeyens
(1991) who researched the comparability of the scores of blacks and whites on the South
African Personality Questionnaire (SAPQ); and Taylor and De Bruin (2004) who did research
on personality (measured with the BTI) across the South African cultures. The findings of
these studies emphasised the general need for further research in South Africa with regard to
the impact of the multicultural and multilingual environment on personality assessment.
Additionally a few examples of research on the impact of language on personality
assessment are the research projects of Abrahams (1996) and Abrahams and Mauer
(1999a, 1999b) on the non-applicability of the 16PF. However Prinsloo and Ebersöhn
(2002) confirmed the applicability of the 16PF especially in terms of its fairness towards
different South African language groups, and they concluded that the research
methodologies used in the Abrahams (1996) study were responsible for the negative
results. The recommendations by Prinsloo and Ebersöhn (2002) were implemented in a
study by McDonald (2011) where different research techniques were used to investigate
the level of understanding of the vocabulary used in the 16PF5 by students (native and
non-native English speaking students).
Taylor (2008) did a comprehensive bias analysis on the BTI, but she did not have a large
enough sample to analise the data for each of South Africa’s official languages
individually. The current study was done as an extention of the research done by Taylor
(2008) but with a large enough sample for each of the official languages. The current study

194
had a large enough sample to assessed the impact of each of the eleven official South
African languages individually on the responses to the BTI items, meticulously.
Additionally the impact of two levels of English proficiency (top 25% - high performers and
bottom 25% - lower performers) were reported for responses to each item of the BTI. The
extended contribution of the current study lies in the advanced methodology used, namely
the Rasch analysis techniques.
The methodology and results of the current study can be utilised to sensitise researchers and
test developers on requirements that need to be adhered to in terms of bias analyses when
new personality instruments are developed and implemented in South Africa.
6.8 LIMITATIONS
The following limitations of the current study were identified.
Even though the sample was large, it was a sample of convenience and the results cannot
necessarily be considered entirely representative of the total population. Although the
sample was large enough to analyse all the official languages separately, it only included
respondents that applied to be employed in the government organisation. The contrast
groups (lower English proficiency and higher English proficiency) were not compared
within each language group.
The focus of this study was on personality assessment and not FFM and Big Five assessment,
which might have been too broad. It was assumed that the BTI would measure the Big Five
personality characteristics that it was supposed to measure and that the interpretation of the
data would accurately reflect the personality traits of the respondents (as concluded earlier
by Taylor (2008)). Additionally, no other personality instruments measuring the Big Five
traits were administered for comparison purposes. Other personality instruments could
be administered to confirm the presence of the Big Five factors.

195
A limitation to the current study was that many variables outside the control of the
researcher may have impacted on the response patterns on the BTI. These variables could
include human error, faking, motivation, socialisation, age, gender, race, culture, etc. Analysis
of these variables was not discussed in this thesis. The BTI was administered as part of a
selection battery which might have influenced the responses due to the anxiety of
respondents.
The intrinsic personality characteristics of each of the official languages or cultures of
South Africa were not investigated as sources of bias. No attempt was made to
investigate the reasons underlying the possible response styles.
Furthermore, structural equation modelling (SEM) methods like construct equivalence,
differential item functioning and response styles were not investigated. Comprehensive
CTT and detailed MTT analysis were not included in this study. Only the INFIT mean
squares were reported on and a recommendation is made to also analyse OUTFIT mean
squares as an indication of items that were too difficult to endorse.
Additional analysis could be done to assist with the explanation of the findings of the
current study and to stimulate other directions in personality assessment research.
6.9 PRACTICAL AND THEORETICAL CONTRIBUTION
Internationally the current study contributed in terms of the ITC criteria (International
Test Commission, 2011) for good test use practice. Test users, researchers and test
developers were sensitised on the methodology for cross-cultural and multilingual
research to promote the ethical administration of personality instruments. Furthermore
the statement made by Matsumoto et al. (2001) on the constant development and
refinement of analysis methods in cross-cultural research, was adhered to.
The current study has extended the existing body of knowledge about the impact that
home language, and specifically the eleven official languages of South Africa, have on
personality assessment. The large sample of adults from all eleven South African language
196
groups with Grade 12 education were included; this ensured that limitations of previous
studies were addressed.
The practical contribution of this study resides in the substantiation of a Big Five
personality instrument that fairly assesses the personality factors of all individuals in the
multicultural environment of South Africa. It further highlighted the need to include
English proficiency tests before personality instruments are administered.
Theoretically this study contributed to the explanation of advanced statistical methods,
specifically Modern test theory, available for assessing the psychometric properties of
instruments on item level.
The current study furthermore identified the need for research with regard to the
intrinsic personality characteristics of individuals that influence their responses to
personality instruments, especially in a multicultural environment like South Africa with
eleven different official language groups.
6.10 RECOMMENDATIONS
The reported results from the current study and identified limitations have led to the
following recommendations.
It is recommended that all personality instruments administered in South Africa be
subjected to similar research on the impact of language on each item within the
instrument. Researchers, psychologists and test developers should be aware of advanced
research methodology available to assess the cross-cultural performance of personality
instruments.
Different sampling methods should be used to ensure that the research represents the
entire population.

197
Additional independent variables could be included in a similar study to identify their impact
on the response patterns on the BTI. These variables could include motivation, socialisation,
age, gender, race, culture, etc.
Studies focussing on the impact of language on FFM and Big Five instruments might highlight
the intrinsic personality traits of different language groups in South Africa. Further studies
should be conducted to determine whether the Big Five personality factors measured by
the BTI are higher intrinsic personality characteristics for a specific language group, for
example: Are Xhosa- and Zulu-speaking people more extraverted and therefore any
personality instrument will measure their Extraversion higher? Further mean comparisons
between the contrast groups, namely lower English proficiency and higher English
proficiency, within each language group can be done to identify the exact impact of
language proficiency for each language group.
Structural equation modelling (SEM) methods, comprehensive CTT and detailed MTT
should be used in future research to investigate the internal structures of the BTI, and to
report on the factor loadings, intercepts, item loadings and factorial invariances to
determine whether the BTI measures equally for each of the eleven official languages in
South Africa.
In terms of the BTI, 12 items were identified in research by Taylor (2008) as well as the
current study indicating DIF. The content of these 12 items should be further investigated
in future studies. As the INFIT mean square reports on the inlier items - items targeted on
the person and the pattern of responses to these items, the researcher decided to only
report on the INFIT mean squares. The OUTFIT mean square indicates the responses to
items that were too difficult to endorse and these are not a true reflection of the person’s
standing on the latent trait. Future research can be done on the items with high OUTFIT
mean square values.

198
6.11 CONCLUSION
The purpose of the current study was to investigate the impact that home language has
on responses to the BTI personality instrument. The level of the respondents’
understanding of English as the administration language was also considered (English
proficiency was measured) to improve the level of understanding of the personality
instrument’s items. The conclusion was reached that home language and especially the
level of English proficiency definitely influence the way in which respondents endorse the
English version of the BTI items.
Acceptable internal consistency reliability of the BTI was reported for all eleven official
languages of South Africa. The high internal consistency reliability promotes confidence in
the use of the BTI within the multicultural and multilingual South African context.
Even though some items indicated DIF, the BTI can be confidently administered to all the
official language groups of South Africa. It is recommended that English proficiency tests
be administered together with the BTI to assess the respondents’ level of English
understanding, as this influences their responses to BTI items significantly. The BTI is a
published and commercialised personality instrument (standardised and widely used in
South Africa) and for the sake of comparison of items in previous and future studies, it
was decided that problematic items should not be removed in the current research
project. In the analysis of the results of the current study, the conclusion was reached
that the BTI can be used with confidence within the multicultural and multilingual
environment of South Africa to assess the Big Five personality factors.
Investigating item bias used to be limited to research using CTT methods, where the
results are consistently bound to the characteristics of the sample. The current study
made use of both CTT and MTT to identify the items that indicate possible bias when the
BTI is administered to respondents with different home languages and different levels of
English proficiency. From a cross-cultural perspective, the current study has shown that
methods other than the CTT can be useful to investigate the psychometric properties of
personality assessment instruments.

199
No published literature was found on item bias across all eleven official languages in
South Africa separately, particularly with regard to personality assessment. No literature
was found on the impact of different English proficiency levels when personality
instruments were administered to different language groups. The current study made a
contribution towards personality assessment in this regard, locally as well as
internationally. The current study is furthermore likely to stimulate research with regard
to the response patterns of personality instruments and the investigation of intrinsic
personality characteristics of respondents from the different official language groups in
South Africa.

200
REFERENCES
Abrahams, F. (1996). The cross-cultural comparability of the Sixteen Personality Factor
Inventory (16PF) (Unpublished doctoral thesis). University of Pretoria, Pretoria, South Africa.
Abrahams, F. (2002). Fair usage of the 16PF (SA92) in South Africa: A response to C.H. Prinsloo
& I. Ebersöhn. South African Journal of Psychology, 32, 58-61.
Abrahams, F. & Mauer, K.F. (1999a). The comparability of the constructs of the 16PF in the
South African context. Journal of Industrial Psychology, 25, 53-59.
Abrahams, F. & Mauer, K.F. (1999b). Qualitative and statistical impacts of home language on
responses to the items of the Sixteen Personality Factor Questionnaire (16PF) in South Africa.
South African Journal of Psychology, 29, 76-86.
Allik, J. & McCrae, R.R. (2004). Toward a geography of personality traits: Patterns of profiles
across 36 cultures. Journal of Cross-Cultural Psychology, 35, 13-28.
Allport, G.W. (1937). Personality: A psychological interpretation. New York: Henry Holt.
Allport, G.W. (1961). Pattern and growth in personality. New York: Holt, Rinehart & Winston.
Allport, G.W. & Odbert, H.S. (1936). Trait-names: A psycho-lexical study. Psychological
Monographs, 47, 211.
Arce-Ferrer, A.J. (2006). An investigation into the factors influencing extreme-response style.
Educational and Psychological Measurement, 66, 374-392.
Ashton, M.C. & Lee, K. (2005). The lexical approach to the study of personality structure:
Toward the identification of cross-culturally replicable dimensions of personality
variation. Journal of Personality Disorders, 19, 303–308. doi:10.1521/pedi.2005.19.3.303

201
Au, K.Y. (1997). Another consequence of culture – intra-cultural variation. International
Journal of Human Resource Management, 8, 743-755.
Barnette, J. (2000). Effects of stem and Likert response option reversals on survey internal
consistency: If you feel the need, there is a better alternative to using those negatively
worded stems. Educational and Psychological Measurement, 60, 361-370.
Barrett, P. (2007). Structural equation modeling: Adjudging model fit. Personality and
Individual Differences: Special Issue on Structural Equation Modeling, 42, 815-824.
Barrick, M.R. & Mount, M.K. (1991). The Big Five Personality dimensions and job
performance: A meta-analysis. Personnel Psychology, 44, 1-26.
Barrick, M.R., Parks, L. & Mount, M.K. (2005). Self-monitoring as a moderator of the
relationships between personality traits and performance. Personnel Psychology, 58, 71-
78.
Bedell, B., Van Eeden, R. & Van Staden, F. (1999). Culture as moderator variable in
psychological test performance: Issues & trends in South Africa. South African Journal of
Industrial Psychology, 25, 1-7.
Benet-Martínez, V. & John, O. (1998). Los Cinco Grandes across cultures and ethnic
groups: Multitrait multimethod analyses of the Big Five in Spanish and English. Journal of
Personality and Social Psychology, 75(3), 729-750.
Berry, J.W. (1969). On cross-cultural comparability. International Journal of Psychology, 4,
119-128.
Berry, J.W. (2000). Cross-cultural psychology: A symbiosis of cultural and comparative
approaches. Asian Journal of Social Psychology, 3, 197-205.

202
Berry, J.W., Poortinga, Y.H., Segall, M.H. & Dasen, P.R. (2002). Cross-cultural psychology.
Research and applications (2nd ed.). Cambridge, UK: Cambridge University Press.
Birnbaum, A. (1968). Some latent trait models and their use in inferring an examinee’s
ability. In Lord, F.M. & Novick, M.R. (Eds.). Statistical theories of mental test scores.
Reading, MA: Addison-Wesley.
Block, J. (1995). A contrarian view of the five-factor approach to personality description.
Psychological Bulletin, 117, 187-215.
Block, J. (2001). Millennial contrarianism: The five-factor approach to personality description
5 years later. Journal in Research in Personality, 35, 98-107.
Bond, T.G. & Fox, C.M. (2001). Applying the Rasch model: Fundamental measurement in the
human sciences. Mahwah, NJ: Erlbaum.
Bond, T.G. & Fox, C.M. (2007). Applying the Rasch model: Fundamental measurement in the
human sciences. Lawrence Erlbaum Associates, Routledge. United States of America.
Borkenau, P. & Ostendorf, F. (1990). Comparing exploratory and confirmatory factor
analysis: A study of the 5-factor model of personality. Personality and Individual
Differences, 11, 515-524.
Boyle, G.J. (2008). Critique of the five-factor model of personality. In Boyle, G.J.,
Matthews, G. & Saklofske, D.H. (Eds.). The SAGE Handbook of Personality Theory and
Assessment: Vol. 1. Personality theories and models (pp. 295-312). CA: Sage. Thousand
Oaks.
Bracken, B.A. & Barona, A. (1991). State of the art procedures for translating, validating
and using psycho educational tests in cross-cultural assessment. School Psychology
International, 12, 119-132.

203
Brand, G.v.d.W. (2004). ‘English only’? Creating linguistic space for African indigenous
knowledge systems in higher education. South African Journal of Higher Education, 18,
27-39.
Branford, W. (1996). English in South African society. In De Klerk, V. (Ed.). English Around
the World: Focus on South Africa (pp. 35-52). Amsterdam: Benjamins.
Brief, D.E. & Comrey, A.L. (1993). A profile of personality for a Russian sample: As
indicated by the Comrey personality scales. Journal of personality assessment, 60(2), 267-
284.
Briggs, S.R. (1989). The optimal level of measurement for personality constructs. In Buss,
D.M. & Cantor, N. (Eds.). Personality Psychology: Recent trends and emerging directions
(pp. 246-260). New York: Springer.
Briggs, S.R. (1992). Assessing the five-factor model of personality description. Journal of
Personality, 60, 253-293.
Brislin, R.W. (1980). Translation and content analysis of oral and written material. In Triandis,
H.C. & Berry, J.W. (Eds.). Handbook of Cross-cultural Psychology (pp. 389-444). Boston. Allyn
& Bacon.
Brislin, R.W. (1986). The wording and translation of research instruments. In Lonner, W.J. &
Berry, J.W. (Eds.). Field Methods in Cross-cultural Research (pp. 137-164). CA. Sage, Newbury
Park.
Burger, G.K. & Kabacoff, R.I. (1982). Personality types as measured by the 16PF. Journal of
personality assessment, 46(2), 175-180.
Burgess, S.M. (2002). S.A. tribes: Who we are, how we live, what we want from life.
Claremont, South Africa: David Philip Publishers.
204
Buss, D.M. (1984). Toward a psychology of person-environment (PE) correlation: The role
of spouse selection. Journal of Personality and Social Psychology, 47, 361-377.
Caprara, G.V., Barbaranelli, C. & Borgogni, L. (1993). BFQ: Big Five questionnaire: Manual
[BFQ: Big Five questionnaire: Manual]. Firenze, Italy: Organizzazioni Speciali.
Carroll, J.B. (1968). Psychometric theory and language testing. In J.W. Oller (Ed.). Issues in
language testing research. Rowley: Newbury House.
Cattell, R.B. (1943). The description of personality. II. Basic traits resolved into clusters.
Journal of Abnormal and Social Psychology, 37, 475-507.
Cattell, R.B. (1945). The description of personality: Principles and findings in a factor
analysis. American Journal of Psychology, 58, 69-90.
Cattell, R.B. (1946). The description and measurement of personality. New York, NY:
Harcourt, Brace & World.
Cattell, R.B. (1947). Confirmation and classification of primary personality factors.
Psychometrika, 12, 197-220.
Cattell, R.B., Eber, H.W. & Tatsuoka, M.M. (1970). Handbook for the Sixteen Personality
Factor Questionnaire (16PF). Champaign, IL: IPAT.
Chamorro-Premuzic, T. (2007). Personality and individual differences. Malden, MA:
Blackwell Publishing.
Cheung, F.M. (2004). Use of Western and indigenously developed tests in Asia. Applied
psychology: An international review, 53, 173-191.

205
Cheung, F.M., Cheung, S.F., Wada, S. & Zhang, J. (2003). Indigenous measures of
personality assessment in Asian countries: A review. Psychological Assessment, 15, 280-
289.
Cheung, F.M., Leung, K., Zhang, J.X., Sun, H.F., Gun, Y.G., Song, W.Z. & Xie, D. (2001).
Indigenous Chinese personality constructs: Is the five-factor model complete? Journal of
Cross-Cultural Psychology, 32, 407-433.
Cheung, F.M., Van de Vijver, F.J.R. & Leong, F.T.L. (2011). Toward a new approach to the
study of personality in culture. American Psychologist. Advance online publication. doi:
0.1037/a0022389.
Chomsky, N. (1965). Aspects of the theory of syntax. Cambridge: MIT Press.
Church, A.T. (2000). Culture and personality: Toward an integrated cultural trait psychology.
Journal of Personality, 68, 651-704.
Church, A.T. & Burke, P.J. (1994). Exploratory and confirmatory tests of the Big Five and
Tellegen’s three- and four-dimensional models. Journal of Personality and Social Psychology,
66, 93-114.
Church, A.T. & Katigbak, M.S. (2000). Trait psychology in the Philippines. American Behavioral
Scientist, 44, 73-94.
Church, A.T. & Lonner, W.J. (1998). The cross-cultural perspective in the study of personality:
Rationale and current research. Journal of Cross-Cultural Psychology, 29, 32-62.
Church, A.T., Reyes, J.A.S., Katigbak, M.S., & Grimm, S.D. (1997). Filipino personality
structure and the Big Five model: A lexical approach. Journal of Personality, 65, 477-528.
Claassen, N.C.W. (1997). Cultural differences, politics and test bias in South Africa.
European Review of Applied Psychology, 47, 297-307.

206
Claassen, N.C.W. & Hugo, H.L.E. (1993). The relevance of the general Scholastic Aptitude
Test (GSAT) for pupils who do not have English as their mother tongue (Report ED-21).
Pretoria: Human Sciences Research Council.
Clark, L.A. & Watson, D. (1995). Constructing validity: Basic issues in objective scale
development. Psychological Assessment, 7, 309-319.
Clarke, S. & Robertson, I. (2008). An examination of the role of personality in work accidents
using meta-analysis. Applied Psychology: An International Review, 57, 94-108.
Cloninger, C.R., Przybeck, T.R., Svrakic, D.M. & Wetzel, R.D. (1994). The Temperament and
Character Inventory (TCI): A guide to its development and use. St. Louis, MO: Author.
Cohen, J.W. (1988). Statistical power analysis for the behavioural sciences (2nd edition).
Hillsdale, NJ: Lawrence Erlbaum Associates.
Comrey, A.L. (1970). The Comrey Personality Scales. San Diego, CA: Educational and
Industrial Testing Service.
Comrey, A.L. (1995). Revised manual and handbook of interpretation for the Comrey
Personality Scales. San Diego, CA: EdITS.
Connor-Smith, J.K. & Flachsbart, C. (2007). Relations between personality and coping: A meta-
analysis. Journal of Personality and Social Psychology, 93, 1080-1107.
Costa, P.T. (Jr) & McCrae, R.R. (1976). Age differences in personality structure: A cluster
analytical approach. Journal of Gerontology, 31, 564-570.
Costa, P.T. (Jr) & McCrae, R.R. (1985). The NEO Personality Inventory Manual. Odessa, FL:
Psychological Assessment Resources.

207
Costa, P.T. (Jr) & McCrae, R.R. (1988a). Personality in adulthood: A six-year longitudinal
study of self-reports and spouse ratings on the NEO Personality Inventory. Journal of
Personality and Social Psychology, 54, 853-863.
Costa, P.T. (Jr) & McCrae, R.R. (1988b). From catalogue to classification: Murray’s needs
and the five-factor model. Journal of Personality and Social Psychology, 55, 258-265.
Costa, P.T. (Jr) & McCrae, R.R. (1992a). Four ways five factors are basic. Personality and
Individual Differences, 13, 653-665.
Costa, P.T. (Jr) & McCrae, R.R. (1992b). Revised NEO Personality Inventory (NEO PI-R) and
NEO Five-Factor Inventory (NEO-FFI): Professional Manual. Odessa, FL: Psychological
Assessment Resources.
Costa, P.T. (Jr), Terracciano, A. & McCrae, R.R. (2001). Gender differences in personality
traits across cultures: Robust and surprising findings. Journal of Personality and Social
Psychology, 81, 322-331.
Cronbach, L.J. (1951). Coefficient alpha and the internal structure of tests. Psychometrika,
16, 297-334.
Davis, F.B. (1944). Fundamental factors of comprehension in reading. Psychometrika, 9, 185-
197.
De Beer, M. (2004). Manual for SAPS selection tests for entry level constable positions. M&M
Initiatives and Associates. Pretoria.
De Bruin, G.P. (1997). Die psigometriese eienskappe van die Comrey Personality Scales vir
Afrikaanssprekendes. [The psychometric properties of the Comrey Personality Scales for
Afrikaans-speakers] (Unpublished doctoral thesis). Rand Afrikaans University,
Johannesburg, South Africa.
208
De Bruin, G.P. (2000). An inter-battery factor analysis of the Comrey Personality Scale and
the 16 Personality Factor Questionnaire. Journal of Industrial Psychology, 26(3), 4-7.
De Bruin, G.P., Schepers, J.M. & Taylor, N. (2005). Construct validity of the 16PF (5th Edition)
and the Basic Traits Inventory. Paper presented at the 8th Annual Industrial Psychology
Conference, Pretoria.
De Bruin, G.P. & Taylor, N. (2005b). The cross-cultural validity of the five-factor model of
personality in South Africa: the case of the Basic Traits Inventory. Paper presented at the
11th South African Psychology Congress, Cape Town International Conference Centre,
Cape Town.
De Raad, B. (2000). The Big Five personality factors: The psycholexical approach to
personality. Seattle, WA: Hogrefe & Huber.
De Young, C.G. (2010). Toward a theory of the Big Five. Psychological Inquiry, 21(1), 26-
33.
Digman, J.M. (1990). Personality structure: Emergence of the five-factor model. Annual
Review of Psychology, 41, 417-440.
Dlamini, C.R.M. (2001). The attainability of multilingualism at University. Aambeeld/Anvil,
29, 33-36.
Douglas, C., Frink, D.D. & Ferris, G.R. (2004). Emotional intelligence as moderator of the
relationship between conscientiousness and performance. Journal of Leadership and
Organisational Studies, 10(3), 1-13.
Dumont, F. (2010). A history of personality psychology: Theory, science and research from
Hellenism to the twenty-first century. New York: Cambridge University Press.
209
Du Toit, J.B.H. (1987). The Jung Personality Questionnaire. Pretoria: Human Sciences
Research Council.
Eaton, L. & Louw, L. (2000). Culture and self in South Africa: Individualism/ Collectivism
predictions. Journal of Social Psychology, 140, 210-218.
Embretson, S.E. & Reise, S.T. (2000). Item response theory for psychologists. USA: New
Jersey. Lawrence Erlbaum Associates.
Epstein, S. (2010). The Big Five model: Grandiose ideas about surface traits as the
foundation of a general theory of personality. Psychological Inquiry, 21, 34-39.
Ewen, R.B. (2010). An introduction to theories of personality (7th ed.). New Jersey:
Lawrence Erlbaum Associates.
Extra, G. & Maartens, J. (1998). Multiculturalism in a multicultural context. Case studies
on South Africa and Western Europe. Tilburg: Tilburg University.
Eysenck, H.J. (1990). Genetic and environmental contributions to individual differences:
Three major dimensions of personality. Journal of Personality, 85, 245-261.
Eysenck, H.J. (1992). Four ways five factors are not basic. Personality and Individual
Differences, 13, 667-673.
Eysenck, H.J. (1997). Personality and experimental psychology: The unification of
psychology and the possibility of a paradigm. Journal of Psychology and Social Psychology,
73, 1224-1237.
Eysenck, H.J. & Eysenck, S.B.G. (1965). Manual of the Eysenck Personality Inventory.
London: Hodder & Stoughton.

210
Eysenck, H.J. & Eysenck, S.B.G. (1975). Manual of the Eysenck Personality Questionnaire. San
Diego, CA: EdITS.
Eysenck, S.B.G., Eysenck, H.J. & Barrett, P. (1985). A revised version of the psychoticism
scale. Personality and Individual Differences, 6, 21-29.
Fan, X. (1998). Item response theory and classical test theory: An empirical comparison of
their item/person statistics. Educational and Psychological Measurement, 58, 357-381.
Fasold, R. (1990). The sociolinguistics of language. Oxford: Basil Blackwell.
Fiske, D.W. (1949). Consistency of the factorial structures of personality ratings from
different sources. Journal of Abnormal and Social Psychology, 44, 329-344.
Fischer, G.H. (1973). Linear logistic test model as an instrument in educational research. Acta
Psychologica, 37, 359-374.
Fischer, R. (2004). Organisational reward allocation principles: Testing organisational and
cross-cultural differences. International Journal for Intercultural Relations, 28, 151-164.
Forshaw, M. (2007). Easy statistics in psychology. Oxford: Blackwell Publishing.
Foxcroft, C.D. (1997). Psychological testing in South Africa: Perspectives regarding ethical and
fair practices. European Journal of Psychological Assessment, 13, 229-235.
Foxcroft, C.D. (2004). Planning a psychological test in the multicultural South African context.
South African Journal of Industrial Psychology, 30, 8-15.
Foxcroft, C., Patterson, H., Le Roux, N. & Herbst, D. (2004). Psychological assessment in South
Africa: a needs analysis. The test use patterns and needs of psychological assessment
practitioners. Pretoria: The Health Professions Council of South Africa.

211
Foxcroft, C. & Roodt, G. (2005). An introduction to psychological assessment in the South
African context. (2nd ed.). Cape Town: Oxford University Press.
Geisinger, K.F. (1994). Cross-cultural normative assessment: translation and adaptation issues
influencing the normative interpretation of assessment instruments. Psychological
Assessment, 6, 304-312.
Golden, C.J. (1978). Cross-cultural second order factor structures of the 16PF. Journal of
personality assessment, 42(2), 167-170.
Goldberg, L.R. (1981). Language and individual differences: The search for universals in
personality lexicons. In L. Wheeler (Ed.). Review of personality and social psychology, 2
(pp. 141-165). Beverly Hills, CA: Sage.
Goldberg, L.R. (1990). An alternative ‘description of personality’: The Big-Five factor
structure. Journal of Personality and Social Psychology, 59, 1216-1229.
Goldberg, L.R. (1992). The development of markers for the Big-Five factor structure.
Psychological Assessment, 4, 26-42.
Goldberg, L.R. (1993). The structure of phenotypic Personality Traits: Authors’ reactions
to the six comments. American Psychologists, 48, 26-34 and 1303-1304.
Goldberg, L.R. & Kilkowski, J.M. (1985). The prediction of semantic consistency in self-
descriptions: Characteristics of persons and of terms that affect the consistency of
response to synonym and antonym pairs. Journal of Personality and Social Psychology, 48,
82-98.
Government Gazette. (1974). Health Professions Act 56 of 1974. Cape Town: South African
Government.

212
Government Gazette. (1995). Labour Relations Act 66 of 1995. Cape Town: South African
Government.
Government Gazette. (1996). Constitution of the Republic of South Africa approved by the
Constitutional Court (CC) on 4 December 1996. Act 108 of 1996. Cape Town: South African
Government.
Government Gazette. (1998). Employment Equity Act 55 of 1998. Cape Town: South African
Government.
Green, K.E. & Frantom, C.G. (2002). Survey development and validation with the Rasch model.
Paper presented at the International Conference on Questionnaire Development, Evaluation
and Testing, Charleston, SC.
Grieve, K. (2005). Factors affecting assessment results. In Foxcroft, C. & Roodt, G. (Eds.).
An introduction to psychological assessment in the South African context (2nd ed.)
(pp. 224-241). Cape Town: Oxford University Press.
Grieve, K. & Van Eeden, R. (1997). The use of the Wechsler Intelligence Scales for adults
and the implications for research and practical application in South Africa. Paper
presented at a national symposium on intelligence testing in South Africa, Pretoria.
Guilford, J.P. (1965) Fundamental Statistics in Psychology and Education. New York:
McGraw-Hill.
Guilford, J.P. (1982). Cognitive psychology’s ambiguities: Some suggested remedies.
Psychological Review, 89, 48-59.
Gulliksen, H. (1950). Theory of mental tests. New York: Wiley.
Hambleton, R.K. (1994). Guidelines for adapting educational and psychological tests: a
progress report. European Journal of Psychological Assessment, 10, 229-244.

213
Hambleton, R.K. (2004). Theory, methods, and practices in testing for the 21st century.
Psicothema, 16(4), 696-701.
Hambleton, R.K., Swaminathan, H. & Rogers, H.J. (1991). Fundamentals of Item Response
Theory. Thousand Oaks, CA: Sage.
Hampson, S.E., John, O.P. & Goldberg, L.R. (1986). Category breadth and hierarchical
structure in personality: Studies of asymmetries in judgments of trait implications. Journal
of Personality and Social Psychology, 51, 37-54.
Hawkins, C.A. & Weber, J.E. (1980). Statistical analysis. Applications to business and
economics. New York: Harper & Row.
Heaven, P.C.L., Connors, J. & Stone, C.R. (1994). Three or five personality dimensions? An
analysis of natural language terms in two cultures. Personality and Individual Differences, 17,
181-189.
Heaven, P.C.L. & Pretorius, A. (1998). Personality structure among black and white South
Africans. The Journal of Social Psychology, 138, 664-667.
Henard, D.H. (2000). Item response theory. In Grimm, L.G. & Yarnold, P.R. (Eds.). Reading
and understanding more multivariate statistics (pp. 67-97). Washington, DC: American
Psychological Association.
Hendriks, A.A.J., Hofstee, K.B.W. & De Raad, B. (1999). The Five-Factor Personality Inventory
(FFPI). Personality and Individual Differences, 27, 307-325.
Hendriks, A.A.J., Hofstee, K.B.W. & De Raad, B. (2002). The Five Factor Personality Inventory:
Assessing the Big Five by means of brief and concrete statements. In De Raad, B. & Perugini,
M. (Eds.). Big Five assessment (pp. 79-108). Göttingen: Hogrefe & Huber.

214
Herbert, R.K. (1992) Language and Society in Africa. The theory and practice of
sociolinguistics. Johannesburg. Witwatersrand University Press.
Heuchert, J.W.P. (1998). The applicability of the five factor model of personality in a South
African sample. In Schlebusch, L. (Ed.). South Africa Beyond Transition: Psychological Well-
Being. Pretoria: The Psychological Society of South Africa.
Heuchert, J.W.P., Parker, W.D., Stumpf, H. & Myburgh, C.P.H. (2000). The five-factor model of
personality in South African college students. American Behavioral Scientist, 44, 112-125.
Hill, T. & Lewicki, P. (2006). Statistics – methods and applications. A comprehensive reference
for science, industry and data mining. Statsoft Inc., United States of America.
Ho, D.Y.F. (1998). Indigenous psychologies: Asian perspectives. Journal of Cross-Cultural
Psychology, 29, 88-103.
Hofstede, G. (1980). Culture’s consequences: International differences in work-related
values. Beverly Hills, CA: Sage.
Hofstede, G. (2001). Culture’s consequences: Comparing values, behaviours, institutions
and organisations across nations (2nd ed.). CA: Sage, Thousand Oaks.
Hofstede, G. & McCrae, R.R. (2004). Personality and culture revisited: Linking traits and
dimensions of culture. Cross-Cultural Research, 38, 52-88. doi:10.1177/1069397103259443
Hofstee, W.K.B., Kiers, H.A.L., De Raad, B., Goldberg, L.R. & Ostenberg, F. (1997). A
comparison of Big-Five personality traits in Dutch, English and German. European Journal of
Personality, 11, 15-31.
Hogan, R. (1986). Hogan Personality Inventory Technical Manual. Tulsa, OK: Hogan
Assessment Systems.

215
Hogan, R. (2005). In defense of personality measurement: New wine for old whiners.
Human Performance, 18, 331-341.
Hogan, R. & Hogan, J. (2007). Hogan Personality Inventory manual (3rd ed.). Tulsa, OK: Hogan
Assessment Systems.
Hogan, J.D. & Sussner, B.D. (2001). Cross-cultural psychology in historical perspective. In
Adler, L.L. & Gielen, U.P. (Eds.). Cross-cultural topics in psychology (2nd ed.) (pp. 15-28).
Westport, CT: Praeger.
Hull, D.M., Beaujean, A.A., Worrell, F.C. & Verdisco, A.E. (2010). An item-level
examination of the factorial validity of NEO five-factor inventory scores. Educational and
Psychological Measurement, 70(6), 1021-1041.
Huysamen, G.K. (2002). The relevance of the new APA standards for educational and
psychological testing for employment testing in South Africa. South African Journal of
Psychology, 32, 26-33.
International Test Commission (ITC). (2011). Constitution of the International Test
Commission. Accessed electronically on 2013-02-27 from
www.intestcom.org/upload/sitefiles/ITC%20Constitution%20and%20Bylaws%17-9-
2011.pdf
John, O.P. (1989). Towards a taxonomy of personality descriptors. In Buss, D.M. & Cantor, N.
(Eds.). Personality psychology: Recent trends and emerging directions (pp. 261-271). New
York: Springer.
John, O.P. (1990). The ‘Big Five’ factor taxonomy: Dimensions of personality in the natural
language and in questionnaires. In Pervin, L.A. (Ed.). Handbook of personality: Theory and
research (pp. 66-100). New York: Guilford Press.
216
John, O.P. & Benet-Martinez, V. (2000). Measurement: Reliability, construct validation,
and scale construction. In Reis, H.T. & Judd, C.M. (Eds.). Handbook of research methods in
social and personality psychology. New York: Guilford Press.
John, O.P., Caspi, O.P., Robins, R.W., Moffitt, T.E. & Stouthamer-Loeber, M. (1994). The
Little Five: Exploring the nomological network of the five-factor model of personality in
adolescent boys. Child development, 65, 160-178.
John, O.P., Donahue, E.M. & Kentle, R.L. (1991). The ‘Five-Factor Model’ inventory –
versions 4a and 5a. Technical Report. IPAR: University of California, Berkeley.
John, O.P., Hampson, S.E. & Goldberg, L.R. (1991). The basic level in personality-trait
hierarchies: Studies of trait use and accessibility in different contexts. Journal of
Personality and Social Psychology, 60, 348-361.
John, O.P. & Srivastava, S. (1999). The Big Five Trait Taxonomy: History, Measurements,
and Theoretical Perspectives. In Pervin, L.A. & John, O.P. (Eds.). Handbook of Personality:
Theory and Research. 2nd edition (pp. 102-133). New York: Guilford Press.
Johnson, J.A. (1997). Handbook of Personality Psychology. (pp. 41-64). San Diego: Academic
Press.
Judge, T.A., Heller, D. & Mount, M.K. (2002). Five-factor model of personality and job
satisfaction: A meta-analysis. Journal of Applied Psychology, 87, 530-541.
Kamwangamalu, N.M. (2007). One language, multi-layered identities: English in a society
in transition, South Africa. World Englishes, 26.3, 263-275.
Kaplan, R.M. & Saccuzzo, D.P. (2001). Psychological Testing: Principles, Application, and
Issues (5thed.). Belmont, CA: Wadsworth.
217
Laher, S. (2008). Structural equivalence and the NEO PI-R: Implications for the
applicability of the Five Factor Model of personality in an African context. South African
Journal of Industrial Psychology, 34, 76-80.
Lai, J-S., Teresi, J. & Gershon, R. (2005). Procedures for the analysis of differential item
functioning (DIF) for small sample sizes. Evaluation and the Health Professions, 28,
283-294.
Lamiel, J.T. (1997). Individuals and differences between them. In Hogan, R., Johnson, J.
and Briggs, S. (Eds.). Handbook of Personality Psychology (pp. 117-141). San Diego:
Academic Press.
Lanning, K. (1994). Dimensionality of observer ratings on the California Adult Q-Set.
Journal of Personality and Social Psychology, 67, 151-160.
Lawson, S. (1991). One parameter latent trait measurement: Do the results justify the
effort? In Thompson, B. (Ed.). Advances in educational research: Substantive findings,
methodological developments (Vol. 1, pp. 159-168). Greenwich, CT: JAI.
Lee, K. & Ashton, M.C. (2005). Psychopathy, Machiavellianism, and Narcissism in the Five
Factor Model and the HEXACO model of personality structure. Personality and Individual
Differences, 38, 1571-1582.
Linacre, J.M. (2011). Winsteps (Version 3.74.0) [Computer Software]. Chicago
Winsteps.com.
Loehlin, J.C., McCrae, R.R., Costa, P.T. (Jr) & John, O.P. (1998). Heritability of common and
measure-specific components of the Big Five personality factors. Journal of Research in
Personality, 32, 431-453.

218
Lord, F.M. (1968). An analysis of the Verbal Scholastic Aptitude Test using Birnbaum's
three-parameter logistic model. Educational and Psychological Measurement, 28, 989-
1020.
Lord, F.M. (1975). Evaluation with artificial data of a procedure for estimating ability and
item characteristic curve parameters. Research Bulletin, 75-33. Princeton, N.J.:
Educational Testing Service.
Lord, F.M. (1980). Applications of item response theory to practical testing problems.
Hillsdale, NJ: Erlbaum.
Lord, F.M. & Novick, M.R. (1968). Statistical theories of mental test scores. Reading, MA:
Addison-Wesley.
MacDonald, P. & Paunonen, S.V. (2002). A Monte Carlo comparison of item and person
statistics based on item response theory versus classical test theory. Educational and
Psychological Measurement, 62, 921-943.
Maree, D.J.F. (2002). Properties of and South African norms for the 16PF Fifth Edition
(Technical Report). Johannesburg: Jopie van Rooyen and Partners.
Markon, K.E., Krueger, R.F. & Watson, D. (2005). Delineating the structure of normal and
abnormal personality: An integrative hierarchical approach. Journal of Personality and Social
Psychology, 88, 139-157.
Marsh, H.W., Lϋdtke, O., Muthén, B., Asparouhov, T., Morin, A.J.S., Trautwein, U. &
Nagengast, B. (2010). A new look at the Big Five Factor structure through Exploratory
Structural Equation Modeling. Psychological Assessment, 22(3), 471-491.
Marshall, M.B., De Fruyt, F., Rolland, J.P. & Bagby, R.M. (2005). Socially desirable
responding and the factorial stability of the NEO PI-R. Psychological Assessment, 17, 379-
384.

219
Matsumoto, D., Grissom, R. & Dinnel, D. (2001). Do between-culture differences really
mean that people are different? A look at some measures of cultural effect size. Journal
of Cross-Cultural Psychology, 32, 478-490.
McAdams, D.P. (1992). The five-factor model in Personality: A critical appraisal. Journal of
Personality, 60(2), 329-361.
McAdams, D.P. (1997). Conceptual history of Personality psychology. In Hogan, R., Johnson,
J. and Briggs, S. (Eds.). Handbook of Personality Psychology (pp. 3-29). San Diego: Academic
Press.
McCrae, R.R. (1990). Traits and trait names: How well is Openness represented in natural
languages? European Journal of Personality, 4, 119-129.
McCrae, R.R. (1992). The Five-Factor Model: Issues and applications. Journal of
Personality (Special issue), 60(2).
McCrae, R.R. (2001). Trait psychology and culture: Exploring intercultural comparisons.
Journal of Personality, 69, 819-846.
McCrae, R.R. (2004). Human nature and culture: A trait perspective. Journal of Research
in Personality, 38, 3-14.
McCrae, R.R. (2010). The place of the FFM in Personality Psychology. Psychological Inquiry,
21, 57-64.
McCrae, R.R. & Allik, J. (2002). The five-factor model of personality across cultures. New
York: Plenum.

220
McCrae, R.R. & Costa, P.T. (1985a). Comparison of EPI and psychoticism scales with
measures of the five-factor model of personality. Personality and Individual Differences, 6,
587-597.
McCrae, R.R. & Costa, P.T. (1985b). Openness to experience. In Hogan, R. & Jones, W.H.
(Ed.). Perspectives in personality (pp. 145-172). Greenwich, CT: JAI Press.
McCrae, R.R. & Costa, P.T. (1985c). Updating Norman’s adequate taxonomy: Intelligence
and personality dimensions in natural language and in questionnaires. Journal of Social
Psychology, 49, 710-721.
McCrae, R.R. & Costa, P.T. (Jr). (1987). Validation of the five-factor model of personality
across instruments and observers. Journal of Personality and Social Psychology, 52(1), 81-90.
McCrae, R.R. & Costa, P.T. (Jr). (1996). Toward a new generation of personality theories:
Theoretical contexts for the Five Factor Model. In Wiggins, J.S. (Ed.). The Five Factor Model of
personality: Theoretical perspectives (pp. 51-87). New York: Guilford Press.
McCrae, R.R. & Costa, P.T. (Jr). (1999). A five-factor theory of personality. In Pervin, L.A. &
John, O.P. (Eds.). Handbook of Personality: Theory and Research (2nd ed.) (pp. 139-153). New
York: Guilford Press.
McCrae, R.R. & Costa, P.T. (Jr). (2004). A contemplated revision of the NEO Five-Factor
Inventory. Personality and Individual Differences, 36, 587-596.
McCrae, R.R. & Costa, P.T. (Jr). (2008). The Five-Factor Theory of personality. In John, O.P.,
Robins, R.W. & Pervin, L.A. (Eds.). Handbook of personality: Theory and research (3rded.)
(pp. 159-181). New York: Guilford Press.
McCrae, R.R., Costa, P.T. (Jr), del Pilar, G.H., Rolland, J.P. & Parker, W.D. (1998). Cross-cultural
assessment of the five-factor model: The Revised NEO Personality Inventory. Journal of Cross-
cultural Psychology, 29, 171-188.

221
McCrae, R.R., Costa, P.T. (Jr) & Piedmont, R.L. (1993). Folk concepts, natural language and
psychological constructs: The California Personality Inventory and the five-factor model.
Journal of Personality, 61(1), 1-26.
McCrae, R.R. & John, O.P. (1992). An introduction to the five-factor model and its
applications. Journal of Personality, 60(2), 175-215.
McCrae, R. R. & Terracciano, A. (2005). Universal features of personality traits from the
observer’s perspective: Data from 50 cultures. Journal of Personality and Social Psychology,
88, 547-561. doi:10.1037/0022-3514.88.3.547
McCrae, R.R., Zonderman, A.B., Costa, P.T. (Jr), Bond, M.H. & Paunonen, S. (1996). Evaluating
the replicability of factors in the Revised NEO Personality Inventory: Confirmatory factor
analysis versus procrustes rotation. Journal of Personality and Social Psychology, 70, 552-566.
McDonald, E. (2011). Comparing a native English-speaking group’s and non-native English-
speaking group’s understanding of the vocabulary used in the 16PF5 (Unpublished Master of
Arts thesis). University of South Africa, Pretoria.
McIntire, S.A. & Miller, L.A. (2000). Foundations of psychological testing. Boston:
McGraw-Hill Companies.
Meehl, P.E. (1992). Factors and taxa, traits and types, differences of degree and
differences of kind. Journal of Personality, 60, 117-174.
Meiring, D. (2007). Bias and Equivalence of Psychological Measures in South Africa. University
of Tilburg. The Netherlands. Ridderkerk: Labyrint.
Meiring, D., Van de Vijver, F.J.R. & Rothmann, S. (2006). Bias in an adapted version of the
15FQ+ in South Africa. South African Journal of Psychology, 36, 340-356.

222
Meiring, D., Van de Vijver, F.J.R., Rothmann, S. & Barrick, M.R. (2005). Construct, item, and
method bias of cognitive and personality tests in South Africa. South African Journal of
Industrial Psychology, 31, 1-8.
Mershon, B. & Gorsuch, R.L. (1988). Number of factors in the personality sphere: Does
increase in factors increase predictability of real-life criteria? Journal of Personality and
Social Psychology, 55, 675-680.
Meyer, K.D. & Foster, J.L. (2008). Considerations for creating multi-language personality
norms: A three-component model of error. International Journal of Testing, 8, 384-399.
Moerdyk, A. (2009). The principles and practice of psychological assessment. Pretoria: Van
Schaik.
Mount, M.K., Barrick, M.R. & Stewart, G.L. (1998). Five-factor model of personality and
performance in jobs involving interpersonal interactions. Human Performance, 11, 145-
165.
Mount, M.K., Barrick, M.B. & Strauss, J.P. (1999). The joint relationship of
conscientiousness and ability with performance: test of the interaction hypothesis.
Journal of Management, 25(5), 707-721.
Moyo, S. & Theron, C. (2011). A preliminary factor analytic investigation into the first-
order factor structure of the Fifteen Factor Plus (15FQ+) on a sample of black South
African managers. SA Journal of Industrial Psychology/SA tydskrif vir Bedryfsielkunde,
37(1), Art. #934, 22 pages.doi:10.4102/sajip.v37i1.934.
Murphy, K.R. & Davidshofer, C.O. (2005). Psychological testing: Principles and
applications. New Jersey: Prentice Hall.
Myers, I.B. & McCaulley, M.H. (1985). Manual: A guide to the development and used of
the Myers-Briggs Type Indicator. Palo Alto, CA: Consulting Psychologists Press.

223
Nel, J.A. (2008). Uncovering personality dimensions in eleven different language groups in
South Africa: an exploratory study (Unpublished doctoral thesis). North West University,
South Africa.
Nel, J.A., Valchev, V.H., Rothmann, S., Van de Vijver, F.J.R., Meiring, D. & De Bruin, G.P.
(2012). Exploring the personality structure in the 11 languages of South Africa. Journal of
Personality, 80(4), 915-948.
Nomvete, S. (1994). From oppression to opportunity: multilingual policies for schools.
ELTIC Reporter, 18, 1-2 and 11-17.
Norman, W.T. (1963). Toward an adequate taxonomy of personality attributes: Replicated
factor structure in peer nomination personality ratings. Journal of Abnormal and Social
Psychology, 66, 574-583.
Norman, W.T. (1967). 2800 personality trait descriptors: Normative operating
characteristics for a university population. Ann Arbor: Department of Psychology,
University of Michigan.
Ntshangase, D., Kaschula, R. & Anthonissen, C. (1999). Communicating across cultures in
South Africa: Towards critical language awareness. International Journal of the Sociology
of Language, 136, 132-134.
Nurse, D. (1997). The contributions of linguistics to the study of history in Africa. Journal
of African History, 38, 359-391. doi:10.1017/S0021853797007044
Olson, D.R. (1977). From utterance to text: the bias of language in speech and writing.
Harvard Educational Review, 47(3), 257-281.
Osborne, T. (2008). The structure of modern cultural theory. Manchester: Manchester
University Press.

224
Owen, K. (1991). Test bias: The validity of the Junior Aptitude Test (JAT) for various
population groups in South Africa regarding the constructs measured. South African
Journal of Psychology, 21, 112-118.
Owen, K. (1992). Test-item bias: methods, findings and recommendations. Pretoria:
Human Sciences Research Council, Group: Education.
Oyserman, D., Coon, H.M. & Kemmelmeier, M. (2002). Rethinking Individualism and
Collectivism: Evaluation of theoretical assumptions and meta-analyses. Psychological
Bulletin, 128, 3-72.
Pace, V.L. & Brannick, M.T. (2010). How similar are personality scales of the ‘same’
construct? A meta-analytic investigation. Personality and Individual Differences, 49(7),
669-676.
Pallant, J. (2010). SPSS Survival manual. A step-by-step guide to data analysis using SPSS
program (4th ed.). Australia, Allen & Unwin.
Patel, T. (2006). Comparing the usefulness of conventional and recent Personality
Assessment tools: Playing the right music with the wrong instrument? New
Delhi/Thousand Oaks/London, Sage Publications. DOI: 10.1177/097215090600700202
Paunonen, S.V. & Ashton, M.C. (2002). The nonverbal assessment of personality: The NPQ
and the FF-NPQ. In De Raad, B. & Perugini, M. (Eds.). Big Five Assessment (pp.171-194).
Gottingen, Germany: Hogrefe & Huber.
Paunonen, S.V., Ashton, M.C. & Jackson, D.N. (2001). Nonverbal assessment of the Big
Five personality factors. European Journal of Personality, 15, 3-18.

225
Paunonen, S.V., Zeidner, M., Enggvik, H., Oosterveld, P. & Maliphant, R. (2000). The
nonverbal assessment of personality in five cultures. Journal of Cross-Cultural Psychology,
31, 220-239.
Peabody, D. (1985). National Characteristics, Cambridge, England: Cambridge University
Press.
Peabody, D. & Goldberg, L.R. (1989). Some determinants of factor structures from
personality-trait descriptors. Journal of Personality and Social Psychology, 57, 552-567.
Perfetti, C.A. (1985). Reading Ability. New York: Oxford University Press.
Pervin, L.A. (1994). A critical analysis of current trait theory. Psychological Inquiry, 5, 103-
113.
Pervin, L.A. & John, O.P. (1997). Personality: Theory and Research (7th ed.). New York:
John Wiley & Sons.
Phaswana, N. (2003). Contradiction or affirmation? The South African language policy and
the South African national government. In Makoni, S., Smitherman, G., Ball, A. & Spears,
A. (Eds.). Black Linguistics: Language, Society, and Politics in Africa and the Americas
(pp. 117-131). London: Routledge.
Pike, K.L. (1954). Language in relation to a unified theory of the structure of human
behaviour. Glendale: Summer Institute of Linguistics.
Posel, D. & Zeller, J. (2010). Home language and English ability in South Africa: Insights
from new data. University of KwaZulu-Natal.
Prinzie, P., Stams, G.J.J.M., Dekovic, M., Reijntjes, A.H.A. & Belsky, J. (2009). The relations
between parents’ Big Five personality factors and parenting: A meta-analytic review.
Journal of Personality and Social Psychology, 97, 351-362.

226
Prinsloo, C.H. (1992). Manual for the use of the Sixteen Personality Factor Questionnaire,
South African 1992 version. Pretoria: Human Sciences Research Council.
Prinsloo, C. H. (1998). The factor structure and readability of the South African English
version of the Fifth Edition of the American 16PF (Report to the External Advisory
Committee). Pretoria: Human Sciences Research Council.
Prinsloo, C.H. & Ebersöhn, I. (2002). Fair usage of the 16PF in personality assessment in
South Africa: A response to Abrahams and Mauer with special reference to issues of
research methodology. South African Journal of Psychology, 32(3), 48-57.
Psytech. (2002). The 15FQ+ technical manual. Psychometrics.
Ramsay, L.J., Taylor, N., de Bruin, G.P. & Meiring, D. (2008). The Big Five personality
factors at work: A South African validation study. In Deller, J. (Ed.). Research contributions
to personality at work. Munich, Germany: Rainer Hampp Verlag.
Rasch, G. (1960). Probabilistic models for some intelligence and attainment tests. Chicago:
University of Chicago Press.
Retief, A. (1992). The cross-cultural utility of the SAPQ – bias or fruitful differences? South
African Journal of Psychology, 22(4), 202-207.
Richins, M. & Dawson, S. (1992). A consumer values orientation for materialism and its
measurement: Scale development and validation. Journal of Consumer Research, 19, 303-
316.
Rolland, J. (2002). The cross-cultural generalisability of the five-factor model of
personality. In R.R. McCrae & J. Allik (Eds.). The five-factor model of personality across
cultures (pp. 7-28). New York, NY: Plenum.

227
Rolland, J.P., Parker, W.D. & Stumpf, H. (1998). A psychometric examination of the French
translation of the NEO PI-R and NEO-FFI. Journal of Personality Assessment, 71, 269-291.
Rothmann, S. & Coetzer, E.P. (2003). The Big Five personality dimensions and job
performance. South African Journal of Industrial Psychology, 29(1), 68-74.
Runyan, W.N. (1997). Studying Lives: Psychobiography and the Conceptual Structure of
Personality Psychology. In Hogan, R., Johnson, J. and Briggs, S. (Eds.). Handbook of
Personality Psychology (pp. 41-69). San Diego: Academic Press.
Ryckman, R.M. (1993). Theories of personality (5th ed.). Pacific Grove, California: Brooks/Cole.
Salgado, J.F. (1997). The five factor model of personality and job performance in the
European community. Journal of Applied Psychology, 82, 30-43.
Sandoval, J., Frisby, C.L., Geisinger, K.F., Scheuneman, J.D. & Grenier, J.R. (1998). Test
interpretation and diversity. Achieving equity in assessment. American Psychological
Association. Washington, DC.
Saucier, G. & Goldberg, L.R. (2001). Lexical studies of indigenous personality factors:
Premises, products, and prospects. Journal of Personality, 69, 847-879.
Saucier, G., Hampson, S.E. & Goldberg, I.R. (2000). Cross-language studies of lexical
personality factors. In Hampson, S.E. (Ed.). Advances in personality psychology (pp. 1-36).
East Sussex, England: Psychology Press.
Saville, P. & Holdsworth, R. (1993). OPQ concept model manual and users’ guide. Thames
Ditton: Saville & Holdsworth.
Schmitt, D.P., Allik, J., McCrae, R.R. & Benet-Martinez, V. (2007). The geographic distribution
of Big Five personality traits: Patterns and profiles of human self-description across 56
nations. Journal of Cross-Cultural Psychology, 38 (2), 173-212.
228
Simms, L.J. (2007). The Big Seven Model of personality and its relevance to personality
pathology. Journal of Personality, 75, 65-94.
Slabbert, S. & Finlayson, R. (1998). Comparing Nguni and Sotho: A Sociolinguistic
Classification. In Maddieson, I. & Hinnebusch, T.J. (Eds.). Language History and Linguistic
Description in Africa (pp. 289-306). Trenton, NJ: Africa World Press.
Spearitt, D. (1972). Identification of subskills of reading comprehension by maximum
likelihood factor analysis. Reading Research Quarterly, 8, 92-111.
Spence, B.A. (1982). Psychological investigation into the characteristics of black guidance
teachers (Unpublished Master’s thesis). University of South Africa, Pretoria.
Stagner, R. (1977). On the reality and relevance of traits. Journal of General Psychology,
96, 185-207.
Statistics South Africa. (2012). Census 2011: Census in Brief. (Report No. 03-01-41 (2011)).
Pretoria, South Africa.
Steyn, D.W. (1974). Test Administrator’s Manual for the South African Personality
Questionnaire. Johannesburg: National Institute for Personnel Research, HSRC.
Sutherland, R., De Bruin, G.P. & Crous, F. (2007). The relationship between conscientiousness,
empowerment and performance. SA Journal of Human Resource Management, 5(2), 60-67.
Tabachnick, B.G. & Fidell, L.S. (1983). Using multivariate statistics. New York: Harper & Row.
Tabachnick, B.G. & Fidell, L.S. (2007). Using multivariate statistics (5th ed.). Boston, USA.
Pearson Education, Inc.

229
Tallerman, M. & Gibson, K. (2011). The Oxford Handbook of Language Evolution. Oxford:
Oxford University Press. ISBN 0199541116. 9780199541119.
Taylor, I.A. (2000). The construct comparability of the NEO-PI-R questionnaire for Black and
White employees (Unpublished doctoral thesis). University of the Orange Free State, South
Africa.
Taylor, N. (2004). The construction of a South African five-factor personality inventory
(Unpublished Master’s dissertation). Rand Afrikaans University, South Africa.
Taylor, N. (2008). Construct, item and response bias across cultures in personality
measurement (Unpublished doctoral thesis). Rand Afrikaans University, South Africa.
Taylor, N. & De Bruin, G.P. (2004). Personality across cultures: the case of the Basic Traits
Inventory. Paper presented at the 7th Annual Industrial Psychology Conference, Pretoria.
Taylor, N. & De Bruin, G.P. (2006). Basic Traits Inventory: Technical manual. Johannesburg:
Jopie van Rooyen and Partners.
Taylor, T.R. & Boeyens, J.C.A. (1991). The comparability of the scores of blacks and whites on
the South African Personality Questionnaire: an exploratory study. South African Journal of
Psychology, 21(1), 1-11.
Tellegen, A. (1982). Brief manual for the Multidimensional Personality Questionnaire
(Unpublished manuscript). Minneapolis, MD:University of Minnesota.
Terracciano, A., Abdel-Khalak, A.M., Adam, N., Adamovova, L., Ahn, C.K., Ahn, H.N. &
McCrae, R.R. (2005). National character does not reflect mean personality trait levels in
49 cultures. Science, 310, 96-100. doi:10.1126/science.1117199

230
Terzoli, A., Dalvit, L., Murray, S., Mini, B. & Zhao, X. (2005). Producing and sharing ICT-
based knowledge through English and African languages at a South African university.
South African Journal of Higher Education, 19, 1486-1498.
Tett, R.P., Jackson, D.N. & Rothstein, M. (1991). Personality measures as predictors of job
performance. A meta-analytic review. Personnel Psychology, 44, 703-742.
Thalmayer, A.G., Saucier, G. & Eigenhuis, A. (2011). Comparative validity of brief to
medium-length Big Five and Big Six personality questionnaires. American Psychological
Association (APA journal), 23(4), 995-1009.
Theron, C. (2007). Confessions, scapegoats and flying pigs: Psychometric testing and the
Law. SA Journal of Industrial Psychology, 33(1), 102-117.
Thorndike, R.L. (1973). Reading as reasoning. Reading Research Quarterly, 9, 135-147.
Thurstone, L.L. (1938). Primary mental abilities. Chicago: University of Chicago Press.
Triandis, H.C. & Suh, E.M. (2002). Cultural influences on personality. Annual Review of
Psychology, 53, 133-160.
Trompenaars, F. & Hampden-Turner, C. (1998). Riding the waves of culture:
Understanding diversity in global business (2nd ed.). New York, NY: McGraw-Hill.
Tupes, E.C. & Christal, R.C. (1961). Recurrent personality factors based on trait ratings
(Tech. Rep.). Lackland Air Force Base, TX: USAF.
Urbina, S. (2004). Essentials of psychological testing. Hoboken, NJ: John Wiley & Sons.
Valchev, V.H., Van de Vijver, F.J.R., Nel, J.A., Rothmann, S., Meiring, D. & De Bruin G.P.
(2011). Implicit Personality Conceptions of the Nguni Cultural-Linguistic Groups of South
Africa. Cross-Cultural Research. Sage Publications.

231
Van den Berg, A.R. (1996). Intelligence tests. In Owen K. & Taljaard, J.J. (Eds.). Handbook
for the use of psychological and scholastic tests of the HSRC (Revised edition) (pp. 157-
190). Pretoria: Human Sciences Research Council.
Van de Vijver, F.J.R. & Hambleton, R.K. (1996). Translating tests: some practical
guidelines. European Psychologist, 1, 89-99.
Van de Vijver, F.J.R. & Leung, K. (1997). Methods and data analysis for cross-cultural research.
Thousand Oaks, CA: Sage Publications.
Van de Vijver, F.J.R. & Leung, K. (2001). Personality in cultural context: Methodological
issues. Journal of Personality, 60, 1007-1031.
Van de Vijver, F. & Poortinga, Y.H. (1997). Towards an integrated analysis of bias in cross-
cultural assessment. European Journal of Psychological Assessment, 13(1), 29-37.
Van de Vijver, F.J.R. & Rothmann, S. (2004). Assessment in multicultural groups: The South
African case. South Africa Journal of Industrial Psychology, 30, 1-7.
Van de Vijver, F.J.R., & Tanzer, N.H. (1997). Bias and equivalence in cross-cultural
assessment: An overview. European Review of Applied Psychology, 47(4), 263-279.
Van der Merwe, L. & Maritz, J.S. (2002). Estimating the conditional false-positive rate for
semi-latent data. Epidemiology, 13, 424-430.
Van der Walt, H.S., Meiring, D., Rothmann, S. & Barrick, M.R. (2002). A meta-analysis of
the relationship between personality measurements and job performance in South Africa.
Paper presented at the 5th Annual Industrial Psychology Conference, Pretoria.

232
Van Dyk, G.A.J. & De Kock, F.S. (2004). The relevance of the Individualism-Collectivism (IC)
factor for the management of diversity in the South African National Defence Force.
South African Journal of Industrial Psychology, 30, 90-95.
Van Eeden, R. (1993). The validity of the Senior South African Individual Scale — Revised
(SSAIS-R) for children whose mother tongue is an African language: Private schools.
Pretoria: Human Sciences Research Council.
Van Eeden, R. & Mantsha, T.R. (2007). Theoretical and methodological considerations in
the translation of the 16PF5 into an African language. South African Journal of Psychology,
37(1), 62-81.
Van Eeden, R. & Prinsloo, C.H. (1997). Using the South African version of the 16PF in a
multicultural context. South African Journal of Psychology, 27(3), 151-159.
Van Eeden, R., Taylor, T.R. & Du Toit, R. (1996). Adaptation and standardisation of the
Sixteen Personality Factor Questionnaire Fifth Edition (16PF5) in South Africa: A feasibility
study (client report). Pretoria: Human Sciences Research Council.
Van Eeden, R. & Van Tonder, M. (1995). The validity of the Senior South African Individual
Scale — Revised (SSAIS-R) for children whose mother tongue is an African language:
Model C schools. Pretoria: Human Sciences Research Council.
Van Warmelo, N.J. (1974). The classification of cultural groups. In Hammond-Tooke, W.D.
(Ed.). The Bantu-speaking peoples of Southern Africa (pp. 56-84). London, UK: Routledge
& Kegan Paul.
Venter, A. (2006). The relationship between the Big Five personality traits and emotional
intelligence competencies among employees in a Durban-based medical aid
administrator. (Unpublished Master’s dissertation). University of KwaZulu-Natal (Westville
Campus).

233
Verhoeven, L. & De Jong, J.H.A.L. (1992). The construct of language proficiency. Applications
of psychological models to language assessment. Amsterdam, Netherlands. John Benjamins.
Visser, D. & Du Toit, J.M. (2004). Using the Occupational Personality Questionnaire (OPQ) for
measuring broad traits. South African Journal of Industrial Psychology, 30(4), 65-77.
Vogt, L. & Laher, S. (2009). The five factor model of personality and individualism/collectivism
in South Africa: an exploratory study. PINS, 37, 39-54.
Wallis, T. & Birt, M. (2003). A comparison of native and non-native English-speaking groups’
understanding of the vocabulary contained in the 16PF (SA92). South African Journal of
Psychology, 33(3), 182-190.
Weiss, A.S. & Comrey, A.L. (1987). Personality characteristics of Hare Krishnas. Journal of
personality assessment, 51(3), 399-413.
Whitworth, R.H. & Perry, S.M. (1990). Comparison of Anglo- and Mexican-Americans on the
16PF administered in Spanish or English. Journal of clinical psychology, 46(6), 857-863.
Wong, N., Rindfleisch, A. & Burroughs, J.E. (2003). Do reverse-worded items confound
measures in cross-cultural research? The case of the material values scale. Journal of
Consumer Research, 30, 72-91.
Wright, B.D. (1966). Local dependency, correlations and principal components. Rasch
Measurement Transactions, 10(3), 509-511.
Wright, B.D. & Linacre, J.M. (1994). Reasonable mean-square fit values. Rasch
Measurement Transactions, 8(3), 370.
Wright, B.D. & Mok, M.M.C. (2004). An overview of the family of Rasch measurement
models, in E.V. Smith Jr & R.M. Smith (Eds). Introduction to Rasch measurement. Maple
Grove, MN: JAM Press.
234
Wright, B.D. & Stone, M.H. (1979). Rating scale analysis. Rasch measurement. Chicago:
Mesa Press.
Wright, B.D. & Stone, M.H. (1999). Measurement essentials (2nd ed.). Wilmington,
Delaware, Wide Range.
Yik, M.S. & Bond, M.H. (1993). Exploring the dimensions of Chinese person perception
with indigenous and imported constructs: Creating a culturally balanced scale.
International Journal of Psychology, 28, 75-95.
Yu, K., Zhang, Y., Li, C., Wang, Q. & Tan, Y. (2012). An Analysis of personality traits of
Chinese military medical peacekeepers in Lebanon. Social behaviour and personality,
40(1), 169-174.
Zamudio, A., Padilla, A.M. & Comrey, A.L. (1983). Personality structure of Mexican
Americans using the Comrey personality scales. Journal of personality assessment, 47(1),
100-106.
Zhang, L. & Akande, A. (2002). What relates to the Five-Factor Model among South African
university students? Life Psychological – An International Journal, 10, 49-74.
Zhou, X., Saucier, G., Gao, D. & Liu, J. (2009). The factor structure of Chinese personality
terms. Journal of personality, 77(2), 363-400.

235
Appendix A: Mean Differences between the Official Language Groups General Linear Model Between-Subjects Factors Value Label N
Language
1.00 Afrikaans 6786 2.00 English 2261 3.00 Ndebele 2002 4.00 Sepedi 23825 5.00 Sotho 7517 6.00 Swati 3628 7.00 Tsonga 10857 8.00 Tswana 6687 9.00 Venda 5042 10.00 Xhosa 17265 11.00 Zulu 19472
Multivariate Testsa Effect Value F Hypothesis df Error df Sig.
Intercept
Pillai's Trace .98 1017566.18b 6.00 105326.00 .00 Wilks' Lambda .01 1017566.18b 6.00 105326.00 .00 Hotelling's Trace 57.96 1017566.18b 6.00 105326.00 .00 Roy's Largest Root 57.96 1017566.18b 6.00 105326.00 .00
NLanguage
Pillai's Trace .08 150.23 60.00 631986.00 .00 Wilks' Lambda .91 153.63 60.00 551840.74 .00 Hotelling's Trace .08 156.81 60.00 631946.00 .00 Roy's Largest Root .07 758.38c 10.00 105331.00 .00
a. Design: Intercept + NLanguage b. Exact statistic c. The statistic is an upper bound on F that yields a lower bound on the significance level

236
Tests of Between-Subjects Effects Source Dependent Variable Type III
Sum of Squares df Mean Square F Sig.
Corrected Model
EXTRAVERSION 98740.70a 10 9874.07 33.11 .00 NEUROTICISM 235129.33b 10 23512.93 65.43 .00 CONSCIENTIOUSNESS 343839.02c 10 34383.90 74.83 .00 OPENTOEXPERIENCE 124221.83d 10 12422.18 39.39 .00 AGREEABLENESS 315918.43e 10 31591.84 51.98 .00 SOCIALDESIRABILITY 295051.69f 10 29505.17 473.54 .00
Intercept
EXTRAVERSION 850197736.45 1 850197736.45 2851345.51 .0 NEUROTICISM 348686123.86 1 348686123.86 970416.14 .00 CONSCIENTIOUSNESS 1602007940.91 1 1602007940.91 3486887.87 .00 OPENTOEXPERIENCE 798627015.00 1 798627015.00 2532794.93 .00 AGREEABLENESS 1044997698.66 1 1044997698.66 1719643.06 .00 SOCIALDESIRABILITY 106826441.66 1 106826441.66 1714514.84 .00
NLanguage
EXTRAVERSION 98740.70 10 9874.07 33.11 .00 NEUROTICISM 235129.33 10 23512.93 65.43 .00 CONSCIENTIOUSNESS 343839.02 10 34383.90 74.83 .00 OPENTOEXPERIENCE 124221.83 10 12422.18 39.39 .00 AGREEABLENESS 315918.43 10 31591.84 51.98 .00 SOCIALDESIRABILITY 295051.69 10 29505.17 473.54 .00
Error EXTRAVERSION 31406989.20 105331 298.17 NEUROTICISM 37847121.81 105331 359.31 CONSCIENTIOUSNESS 48393038.31 105331 459.43
OPENTOEXPERIENCE 33212393.48a 105331 315.31 AGREEABLENESS 64007848.47b 105331 607.68 SOCIALDESIRABILITY 6562868.76c 105331 62.30 Total EXTRAVERSION 1567285801.00d 105342
NEUROTICISM 685043017.00e 105342 CONSCIENTIOUSNESS 2939339598.00f 105342 OPENTOEXPERIENCE 1478080336.00 105342 AGREEABLENESS 1945503105.00 105342 SOCIALDESIRABILITY 204687501.00 105342 Corrected Total EXTRAVERSION 31505729.91 105341
NEUROTICISM 38082251.15 105341 CONSCIENTIOUSNESS 48736877.33 105341 OPENTOEXPERIENCE 33336615.31 105341 AGREEABLENESS 64323766.91 105341 SOCIALDESIRABILITY 6857920.45 105341 a. R Squared = .003 (Adjusted R Squared = .003) b. R Squared = .006 (Adjusted R Squared = .006) c. R Squared = .007 (Adjusted R Squared = .007) d. R Squared = .004 (Adjusted R Squared = .004) e. R Squared = .005 (Adjusted R Squared = .005) f. R Squared = .043 (Adjusted R Squared = .043)

237
Post-Hoc (Scheffe) Tests Language Multiple Comparisons: EXTRAVERSION Dependent Variable
(I) Language
(J) Language
Mean Difference (I-J)
Std. Error
Sig. 95% Confidence Interval
Lower Bound
Upper Bound
EXTRAVERSION Afr Eng -3.72* .41 .00 -5.51 -1.93
Ndebele -1.47 .43 .33 -3.35 .40 Sepedi -.51 .23 .91 -1.53 .51 Sotho -1.86* .28 .00 -3.10 -.63 Swati -.51 .35 .99 -2.03 1.01 Tsonga -1.62* .26 .00 -2.76 -.48 Tswana -.95 .29 .41 -2.23 .32 Venda -3.79* .32 .00 -5.17 -2.42 Xhosa .01 .24 1.00 -1.05 1.07 Zulu -1.27* .24 .00 -2.31 -.23
Eng Afr 3.72* .41 .00 1.93 5.51
Ndebele 2.24 .53 .05 -.02 4.51 Sepedi 3.21* .38 .00 1.58 4.83 Sotho 1.86* .41 .02 .08 3.63 Swati 3.21* .46 .00 1.23 5.19 Tsonga 2.10* .39 .00 .39 3.81 Tswana 2.77* .42 .00 .97 4.56 Venda -.07 .43 1.00 -1.94 1.80 Xhosa 3.73* .38 .00 2.08 5.38
Zulu 2.45* .38 .00 .81 4.09 Ndebele Afr 1.47 .43 .33 -.40 3.35
Eng -2.24 .53 .05 -4.51 .02 Sepedi .96* .40 .83 -.76 2.68 Sotho -.39 .43 1.00 -2.25 1.47 Swati .97* .48 .94 -1.09 3.03 Tsonga -.14 .42 1.00 -1.94 1.65 Tswana .52* .44 .99 -1.36 2.40 Venda -2.32 .45 .00 -4.27 -.37 Xhosa 1.49* .40 .20 -.26 3.23 Zulu .20* .40 1.00 -1.53 1.94 Sepedi Afr .51 .23 .91 -.51 1.53
Eng -3.21* .38 .00 -4.83 -1.58 Ndebele -.96* .40 .83 -2.68 .76 Sotho -1.35* .22 .00 -2.33 -.38 Swati .01* .30 1.00 -1.31 1.32 Tsonga -1.11* .20 .00 -1.96 -.25 Tswana -.44 .23 .96 -1.47 .58 Venda -3.28* .26 .00 -4.43 -2.13 Xhosa .52* .17 .51 -.21 1.26 Zulu -.76 .16 .02 -1.47 -.05

238
Post-Hoc (Scheffe) Tests Language Multiple Comparisons: EXTRAVERSION
Dependent Variable
(I) Language
(J) Language
Mean Difference
(I-J)
Std. Error
Sig. 95% Confidence Interval Lower Bound
Upper Bound
EXTRAVERSION Sotho Afr 1.86 .28 .00 .63 3.10 Eng -1.86* .41 .02 -3.63 -.08 Ndebele .39 .43 1.00 -1.47 2.25 Sepedi 1.35* .22 .00 .38 2.33 Swati 1.36 .34 .12 -.14 2.85 Tsonga .25* .25 1.00 -.86 1.35 Tswana .91 .29 .45 -.33 2.15 Venda -1.93* .31 .00 -3.27 -.58 Xhosa 1.88* .23 .00 .86 2.90 Zulu .59 .23 .78 -.41 1.60 Swati Afr .51* .35 .99 -1.01 2.03
Eng -3.21* .46 .00 -5.19 -1.23 Ndebele -.97* .48 .94 -3.03 1.09 Sepedi -.01* .30 1.00 -1.32 1.31 Sotho -1.36* .34 .12 -2.85 .14 Tsonga -1.11 .33 .33 -2.53 .30 Tswana -.45* .35 .99 -1.97 1.08 Venda -3.29* .37 .00 -4.89 -1.68
Xhosa .52 .31 .98 -.83 1.87 Zulu -.76 .31 .81 -2.10 .57 Tsonga Afr 1.62* .26 .00 .48 2.76 Eng -2.10 .39 .00 -3.81 -.39 Ndebele .14* .42 1.00 -1.65 1.94 Sepedi 1.11 .20 .00 .25 1.96 Sotho -.25* .25 1.00 -1.35 .86 Swati 1.11 .33 .33 -.30 2.53 Tswana .67* .26 .80 -.48 1.81 Venda -2.17* .29 .00 -3.43 -.91 Xhosa 1.63 .21 .00 .73 2.54 Zulu .35* .20 .98 -.54 1.23 Tswana Afr .95* .29 .41 -.32 2.23 Eng -2.77* .42 .00 -4.56 -.97 Ndebele -.52* .44 .99 -2.40 1.36 Sepedi .44* .23 .96 -.58 1.47 Sotho -.91 .29 .45 -2.15 .33 Swati .45* .35 .99 -1.08 1.97 Tsonga -.67* .26 .80 -1.81 .48 Venda -2.84 .32 .00 -4.22 -1.46 Xhosa .97 .24 .12 -.10 2.03 Zulu -.32* .24 .99 -1.36 .73

239
Post-Hoc (Scheffe) Tests Language Multiple Comparisons: EXTRAVERSION
Dependent Variable
(I) Language
(J) Language
Mean Difference
(I-J)
Std. Error
Sig. 95% Confidence Interval Lower Bound
Upper Bound
EXTRAVERSION Venda Afr 3.79 .32 .00 2.42 5.17 Eng .07* .43 1.00 -1.80 1.94 Ndebele 2.32 .45 .00 .37 4.27 Sepedi 3.28* .26 .00 2.13 4.43 Sotho 1.93 .31 .00 .58 3.27 Swati 3.29* .37 .00 1.68 4.89 Tsonga 2.17* .29 .00 .91 3.43 Tswana 2.84 .32 .00 1.46 4.22 Xhosa 3.80* .27 .00 2.62 4.99 Zulu 2.52* .27 .00 1.35 3.69 Xhosa Afr -.01* .24 1.00 -1.07 1.05
Eng -3.73* .38 .00 -5.38 -2.08 Ndebele -1.49* .40 .20 -3.23 .26 Sepedi -.52 .17 .51 -1.26 .21 Sotho -1.88* .23 .00 -2.90 -.86 Swati -.52* .31 .98 -1.87 .83
Tsonga -1.63 .21 .00 -2.54 -.73 Tswana -.97 .24 .12 -2.03 .10 Venda -3.80* .27 .00 -4.99 -2.62 Zulu -1.28 .18 .00 -2.06 -.51 Zulu Afr 1.27* .24 .00 .23 2.31 Eng -2.45 .38 .00 -4.09 -.81 Ndebele -.20* .40 1.00 -1.94 1.53 Sepedi .76 .16 .02 .05 1.47 Sotho -.59* .23 .78 -1.60 .41 Swati .76* .31 .81 -.57 2.10 Tsonga -.35 .20 .98 -1.23 .54 Tswana .32* .24 .99 -.73 1.36 Venda -2.52* .27 .00 -3.69 -1.35 Xhosa 1.28* .18 .00 .51 2.06

240
Post-Hoc (Scheffe) Tests Language Multiple Comparisons: NEUROTICISM
Dependent Variable
(I) Language
(J) Language
Mean Difference
(I-J)
Std. Error
Sig. 95% Confidence Interval Lower Bound
Upper Bound
NEUROTICISM Afr Eng 5.96* .46 .00 3.99 7.93 Ndebele -1.24* .48 .76 -3.30 .82 Sepedi -1.64 .26 .00 -2.76 -.52 Sotho .04* .31 1.00 -1.31 1.40 Swati -1.03* .39 .73 -2.70 .64
Tsonga .99 .29 .32 -.26 2.25 Tswana -.33 .32 1.00 -1.73 1.07 Venda -.90* .35 .76 -2.41 .61 Xhosa -2.62 .27 .00 -3.78 -1.46 Zulu -1.69* .26 .00 -2.83 -.54
Eng Afr -5.96 .46 .00 -7.93 -3.99
Ndebele -7.20* .58 .00 -9.69 -4.71 Sepedi -7.60 .41 .00 -9.39 -5.82 Sotho -5.92* .45 .00 -7.86 -3.97 Swati -6.99* .50 .00 -9.16 -4.82 Tsonga -4.97 .43 .00 -6.84 -3.09 Tswana -6.29* .46 .00 -8.27 -4.32 Venda -6.86* .48 .00 -8.92 -4.81 Xhosa -8.58* .42 .00 -10.40 -6.77 Zulu -7.65* .42 .00 -9.45 -5.85
Ndebele Afr 1.24* .48 .76 -.82 3.30
Eng 7.20 .58 .00 4.71 9.69 Sepedi -.40* .44 1.00 -2.29 1.49
Sotho 1.28* .47 .70 -.76 3.32 Swati .21 .52 1.00 -2.05 2.47 Tsonga 2.23 .46 .00 .26 4.21 Tswana .91* .48 .96 -1.16 2.97 Venda .34 .50 1.00 -1.80 2.48 Xhosa -1.38* .44 .48 -3.30 .53 Zulu -.45 .44 1.00 -2.35 1.46 Sepedi Afr 1.64* .26 .00 .52 2.76
Eng 7.60 .41 .00 5.82 9.39 Ndebele .40* .44 1.00 -1.49 2.29 Sotho 1.68* .25 .00 .61 2.76 Swati .61 .33 .97 -.83 2.06 Tsonga 2.63* .21 .00 1.69 3.57 Tswana 1.31* .26 .00 .19 2.43 Venda .74* .29 .78 -.52 2.00 Xhosa -.98* .18 .00 -1.79 -.17 Zulu -.05* .18 1.00 -.83 .74
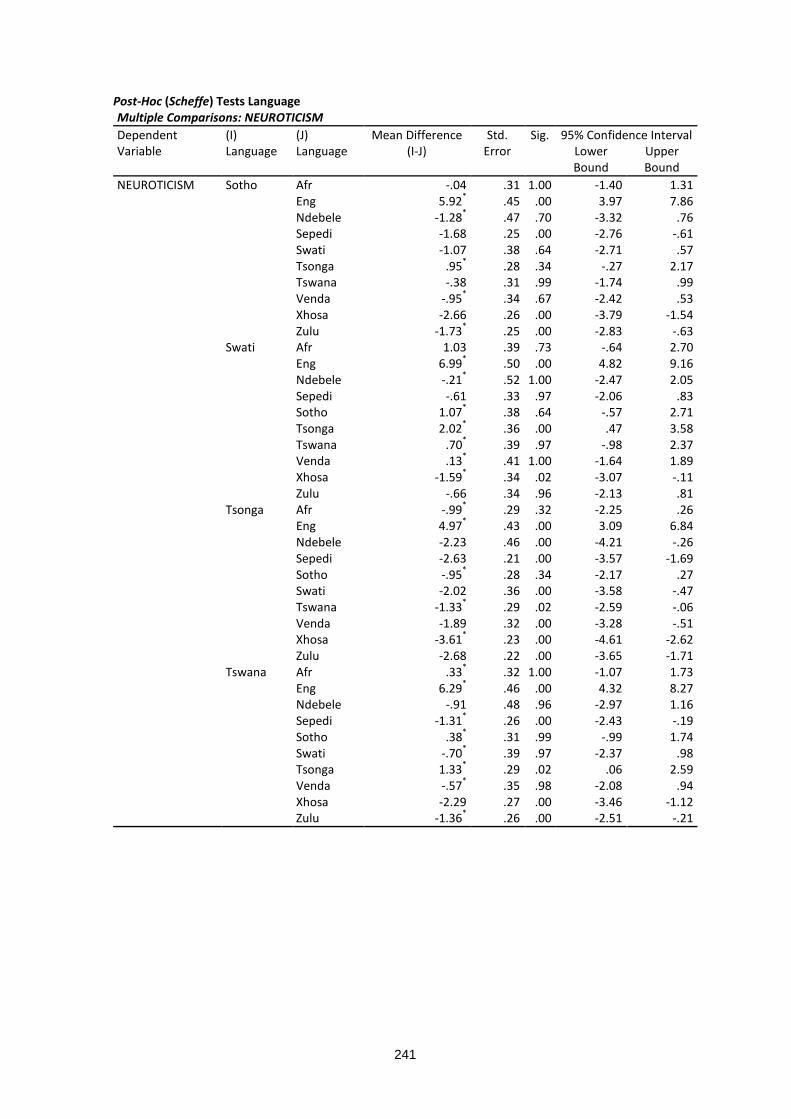
241
Post-Hoc (Scheffe) Tests Language Multiple Comparisons: NEUROTICISM
Dependent Variable
(I) Language
(J) Language
Mean Difference (I-J)
Std. Error
Sig. 95% Confidence Interval Lower Bound
Upper Bound
NEUROTICISM Sotho Afr -.04 .31 1.00 -1.40 1.31 Eng 5.92* .45 .00 3.97 7.86 Ndebele -1.28* .47 .70 -3.32 .76
Sepedi -1.68 .25 .00 -2.76 -.61 Swati -1.07 .38 .64 -2.71 .57 Tsonga .95* .28 .34 -.27 2.17 Tswana -.38 .31 .99 -1.74 .99 Venda -.95* .34 .67 -2.42 .53 Xhosa -2.66 .26 .00 -3.79 -1.54 Zulu -1.73* .25 .00 -2.83 -.63 Swati Afr 1.03 .39 .73 -.64 2.70
Eng 6.99* .50 .00 4.82 9.16 Ndebele -.21* .52 1.00 -2.47 2.05 Sepedi -.61 .33 .97 -2.06 .83 Sotho 1.07* .38 .64 -.57 2.71 Tsonga 2.02* .36 .00 .47 3.58 Tswana .70* .39 .97 -.98 2.37 Venda .13* .41 1.00 -1.64 1.89 Xhosa -1.59* .34 .02 -3.07 -.11 Zulu -.66 .34 .96 -2.13 .81
Tsonga Afr -.99* .29 .32 -2.25 .26 Eng 4.97* .43 .00 3.09 6.84
Ndebele -2.23 .46 .00 -4.21 -.26 Sepedi -2.63 .21 .00 -3.57 -1.69 Sotho -.95* .28 .34 -2.17 .27 Swati -2.02 .36 .00 -3.58 -.47 Tswana -1.33* .29 .02 -2.59 -.06 Venda -1.89 .32 .00 -3.28 -.51 Xhosa -3.61* .23 .00 -4.61 -2.62 Zulu -2.68 .22 .00 -3.65 -1.71 Tswana Afr .33* .32 1.00 -1.07 1.73
Eng 6.29* .46 .00 4.32 8.27 Ndebele -.91 .48 .96 -2.97 1.16 Sepedi -1.31* .26 .00 -2.43 -.19 Sotho .38* .31 .99 -.99 1.74 Swati -.70* .39 .97 -2.37 .98 Tsonga 1.33* .29 .02 .06 2.59 Venda -.57* .35 .98 -2.08 .94 Xhosa -2.29 .27 .00 -3.46 -1.12 Zulu -1.36* .26 .00 -2.51 -.21

242
Post-Hoc (Scheffe) Tests Language Multiple Comparisons: NEUROTICISM
Dependent Variable
(I) Language
(J) Language
Mean Difference
(I-J)
Std. Error
Sig. 95% Confidence Interval Lower Bound
Upper Bound
NEUROTICISM Venda Afr .90* .35 .76 -.61 2.41 Eng 6.86 .48 .00 4.81 8.92 Ndebele -.34 .50 1.00 -2.48 1.80 Sepedi -.74* .29 .78 -2.00 .52 Sotho .95 .34 .67 -.53 2.42 Swati -.13* .41 1.00 -1.89 1.64 Tsonga 1.89 .32 .00 .51 3.28 Tswana .57* .35 .98 -.94 2.08 Xhosa -1.72 .30 .00 -3.02 -.42 Zulu -.79* .30 .73 -2.07 .50 Xhosa Afr 2.62* .27 .00 1.46 3.78
Eng 8.58 .42 .00 6.77 10.40 Ndebele 1.38* .44 .48 -.53 3.30 Sepedi .98* .18 .00 .17 1.79 Sotho 2.66* .26 .00 1.54 3.79 Swati 1.59* .34 .02 .11 3.07 Tsonga 3.61* .23 .00 2.62 4.61 Tswana 2.29 .27 .00 1.12 3.46 Venda 1.72* .30 .00 .42 3.02 Zulu .93* .19 .01 .09 1.78 Zulu Afr 1.69 .26 .00 .54 2.83
Eng 7.65 .42 .00 5.85 9.45 Ndebele .45* .44 1.00 -1.46 2.35 Sepedi .05 .18 1.00 -.74 .83 Sotho 1.73* .25 .00 .63 2.83 Swati .66 .34 .96 -.81 2.13 Tsonga 2.68* .22 .00 1.71 3.65 Tswana 1.36 .26 .00 .21 2.51 Venda .79* .30 .73 -.50 2.07 Xhosa -.93* .19 .01 -1.78 -.09

243
Post-Hoc (Scheffe) Tests Language Multiple Comparisons: CONSCIENTIOUSNESS
Dependent Variable (I) Language
(J) Language
Mean Difference
(I-J)
Std. Error
Sig. 95% Confidence Interval Lower Bound
Upper Bound
CONSCIENTIOUSNESS Afr Eng -2.64 .52 .00 -4.87 -.41
Ndebele .73* .54 .99 -1.60 3.06 Sepedi .57* .29 .96 -.69 1.83 Sotho .00* .35 1.00 -1.53 1.54 Swati -1.28* .44 .59 -3.16 .61 Tsonga -2.61* .33 .00 -4.03 -1.19 Tswana -.23 .36 1.00 -1.81 1.35 Venda -2.41* .39 .00 -4.12 -.71
Xhosa 3.53* .30 .00 2.22 4.85 Zulu .44 .30 .99 -.85 1.73 Eng Afr 2.64 .52 .00 .41 4.87
Ndebele 3.37* .65 .00 .56 6.19 Sepedi 3.21 .47 .00 1.19 5.23 Sotho 2.64* .51 .00 .44 4.84 Swati 1.36 .57 .84 -1.09 3.82 Tsonga .03* .49 1.00 -2.09 2.15 Tswana 2.41 .52 .01 .18 4.64 Venda .23* .54 1.00 -2.09 2.55 Xhosa 6.17* .47 .00 4.12 8.22 Zulu 3.08 .47 .00 1.04 5.12 Ndebele Afr -.73* .54 .99 -3.06 1.60
Eng -3.37* .65 .00 -6.19 -.56 Sepedi -.16* .49 1.00 -2.30 1.97 Sotho -.73* .53 .99 -3.04 1.58 Swati -2.01* .59 .33 -4.56 .54 Tsonga -3.34 .52 .00 -5.57 -1.11 Tswana -.96* .54 .97 -3.30 1.37 Venda -3.14* .56 .00 -5.57 -.72
Xhosa 2.80 .50 .00 .64 4.97 Zulu -.29 .50 1.00 -2.44 1.86 Sepedi Afr -.57* .29 .96 -1.83 .69
Eng -3.21 .47 .00 -5.23 -1.19 Ndebele .16* .49 1.00 -1.97 2.30 Sotho -.57 .28 .94 -1.78 .65 Swati -1.85* .38 .01 -3.48 -.21 Tsonga -3.18 .24 .00 -4.24 -2.12 Tswana -.80* .29 .70 -2.07 .47 Venda -2.98* .33 .00 -4.40 -1.56 Xhosa 2.97 .21 .00 2.05 3.88 Zulu -.13* .20 1.00 -1.01 .76

244
Post-Hoc (Scheffe) Tests Language Multiple Comparisons: CONSCIENTIOUSNESS
Dependent Variable (I) Language
(J) Language
Mean Difference
(I-J)
Std. Error
Sig. 95% Confidence Interval Lower Bound
Upper Bound
CONSCIENTIOUSNESS Sotho Afr .00* .35 1.00 -1.54 1.53 Eng -2.64* .51 .00 -4.84 -.44 Ndebele .73* .53 .99 -1.58 3.04 Sepedi .57* .28 .94 -.65 1.78 Swati -1.28 .43 .56 -3.13 .58 Tsonga -2.61* .32 .00 -3.99 -1.24 Tswana -.23* .36 1.00 -1.78 1.31
Venda -2.41 .39 .00 -4.08 -.74 Xhosa 3.53 .29 .00 2.26 4.80 Zulu .44* .29 .99 -.81 1.68 Swati Afr 1.28 .44 .59 -.61 3.16
Eng -1.36* .57 .84 -3.82 1.09 Ndebele 2.01 .59 .33 -.54 4.56 Sepedi 1.85* .38 .01 .21 3.48 Sotho 1.28 .43 .56 -.58 3.13 Tsonga -1.33* .41 .39 -3.09 .42 Tswana 1.05* .44 .84 -.85 2.94 Venda -1.14 .46 .82 -3.13 .86 Xhosa 4.81* .39 .00 3.14 6.49 Zulu 1.72* .38 .03 .06 3.38
Tsonga Afr 2.61* .33 .00 1.19 4.03 Eng -.03* .49 1.00 -2.15 2.09 Ndebele 3.34* .52 .00 1.11 5.57 Sepedi 3.18 .24 .00 2.12 4.24 Sotho 2.61* .32 .00 1.24 3.99 Swati 1.33* .41 .39 -.42 3.09 Tswana 2.38 .33 .00 .95 3.81 Venda .20 .36 1.00 -1.36 1.76 Xhosa 6.15* .26 .00 5.02 7.27 Zulu 3.05 .25 .00 1.95 4.15
Tswana Afr .23* .36 1.00 -1.35 1.81 Eng -2.41 .52 .01 -4.64 -.18 Ndebele .96* .54 .97 -1.37 3.30 Sepedi .80 .29 .70 -.47 2.07 Sotho .23* .36 1.00 -1.31 1.78 Swati -1.05* .44 .84 -2.94 .85 Tsonga -2.38 .33 .00 -3.81 -.95 Venda -2.18* .40 .00 -3.89 -.47 Xhosa 3.76* .30 .00 2.44 5.09 Zulu .67* .30 .89 -.63 1.97

245
Post-Hoc (Scheffe) Tests Language Multiple Comparisons: CONSCIENTIOUSNESS
Dependent Variable (I) Language
(J) Language
Mean Difference
(I-J)
Std. Error
Sig. 95% Confidence Interval Lower Bound
Upper Bound
CONSCIENTIOUSNESS Venda Afr 2.41* .39 .00 .71 4.12 Eng -.23* .54 1.00 -2.55 2.09 Ndebele 3.14 .56 .00 .72 5.57 Sepedi 2.98* .33 .00 1.56 4.40 Sotho 2.41* .39 .00 .74 4.08 Swati 1.14 .46 .82 -.86 3.13 Tsonga -.20 .36 1.00 -1.76 1.36 Tswana 2.18* .40 .00 .47 3.89 Xhosa 5.95 .34 .00 4.48 7.41 Zulu 2.85* .33 .00 1.40 4.30
Xhosa Afr -3.53 .30 .00 -4.85 -2.22 Eng -6.17* .47 .00 -8.22 -4.12 Ndebele -2.80 .50 .00 -4.97 -.64 Sepedi -2.97* .21 .00 -3.88 -2.05 Sotho -3.53* .29 .00 -4.80 -2.26 Swati -4.81 .39 .00 -6.49 -3.14 Tsonga -6.15* .26 .00 -7.27 -5.02 Tswana -3.76* .30 .00 -5.09 -2.44 Venda -5.95* .34 .00 -7.41 -4.48 Zulu -3.09* .22 .00 -4.05 -2.13
Zulu Afr -.44* .30 .99 -1.73 .85 Eng -3.08 .47 .00 -5.12 -1.04 Ndebele .29* .50 1.00 -1.86 2.44 Sepedi .13* .20 1.00 -.76 1.01 Sotho -.44 .29 .99 -1.68 .81 Swati -1.72 .38 .03 -3.38 -.06 Tsonga -3.05* .25 .00 -4.15 -1.95 Tswana -.67 .30 .89 -1.97 .63 Venda -2.85* .33 .00 -4.30 -1.40 Xhosa 3.09 .22 .00 2.13 4.05

246
Post-Hoc (Scheffe) Tests Language Multiple Comparisons: OPEN TO EXPERIENCE
Dependent Variable (I) Language
(J) Language
Mean Difference
(I-J)
Std. Error
Sig. 95% Confidence Interval Lower Bound
Upper Bound
OPENTOEXPERIENCE Afr Eng -2.79* .43 .00 -4.64 -.95 Ndebele -1.05 .45 .86 -2.99 .88 Sepedi -1.41* .24 .00 -2.45 -.36 Sotho -2.90* .29 .00 -4.17 -1.63 Swati -1.66 .36 .02 -3.23 -.10 Tsonga -2.18* .27 .00 -3.36 -1.01 Tswana -3.22* .30 .00 -4.53 -1.91 Venda -3.20* .33 .00 -4.61 -1.79 Xhosa .20* .25 1.00 -.88 1.29 Zulu -1.40* .25 .00 -2.47 -.33
Eng Afr 2.79 .43 .00 .95 4.64 Ndebele 1.74* .54 .42 -.59 4.07 Sepedi 1.38* .39 .24 -.29 3.06 Sotho -.11 .42 1.00 -1.93 1.71 Swati 1.13 .47 .84 -.91 3.16 Tsonga .61* .41 .99 -1.15 2.37 Tswana -.43 .43 1.00 -2.28 1.42 Venda -.41* .44 1.00 -2.33 1.51 Xhosa 2.99 .39 .00 1.30 4.69 Zulu 1.39* .39 .26 -.30 3.08
Ndebele Afr 1.05 .45 .86 -.88 2.99 Eng -1.74* .54 .42 -4.07 .59 Sepedi -.35* .41 1.00 -2.12 1.41 Sotho -1.85 .44 .07 -3.76 .06 Swati -.61* .49 .99 -2.73 1.50 Tsonga -1.13* .43 .74 -2.98 .72 Tswana -2.17* .45 .01 -4.11 -.24 Venda -2.15* .46 .02 -4.16 -.14 Xhosa 1.26* .41 .53 -.54 3.05 Zulu -.35 .41 1.00 -2.13 1.43
Sepedi Afr 1.41* .24 .00 .36 2.45 Eng -1.38* .39 .24 -3.06 .29 Ndebele .35 .41 1.00 -1.41 2.12 Sotho -1.49 .23 .00 -2.50 -.49 Swati -.26* .31 1.00 -1.61 1.10 Tsonga -.78 .20 .16 -1.66 .10 Tswana -1.82* .24 .00 -2.87 -.77 Venda -1.80 .27 .00 -2.97 -.62 Xhosa 1.61* .17 .00 .85 2.37 Zulu .00 .17 1.00 -.73 .74

247
Post-Hoc (Scheffe) Tests Language Multiple Comparisons: OPEN TO EXPERIENCE
Dependent Variable (I) Language
(J) Language
Mean Difference
(I-J)
Std. Error
Sig. 95% Confidence Interval
Lower Bound
Upper Bound
OPENTOEXPERIENCE Sotho Afr 2.90* .29 .00 1.63 4.17 Eng .11* .42 1.00 -1.71 1.93 Ndebele 1.85 .44 .07 -.06 3.76 Sepedi 1.49* .23 .00 .49 2.50 Swati 1.24* .35 .29 -.30 2.77 Tsonga .72* .26 .69 -.42 1.86 Tswana -.32* .29 1.00 -1.60 .95 Venda -.30* .32 1.00 -1.68 1.08 Xhosa 3.10 .24 .00 2.05 4.15 Zulu 1.50* .24 .00 .47 2.53
Swati Afr 1.66* .36 .02 .10 3.23 Eng -1.13 .47 .84 -3.16 .91 Ndebele .61 .49 .99 -1.50 2.73 Sepedi .26* .31 1.00 -1.10 1.61 Sotho -1.24 .35 .29 -2.77 .30 Tsonga -.52* .34 .99 -1.97 .94 Tswana -1.56 .36 .05 -3.13 .01 Venda -1.54* .38 .10 -3.19 .12 Xhosa 1.87 .32 .00 .48 3.26 Zulu .26* .32 1.00 -1.11 1.64
Tsonga Afr 2.18* .27 .00 1.01 3.36 Eng -.61 .41 .99 -2.37 1.15 Ndebele 1.13* .43 .74 -.72 2.98 Sepedi .78* .20 .16 -.10 1.66 Sotho -.72* .26 .69 -1.86 .42 Swati .52* .34 .99 -.94 1.97 Tswana -1.04* .27 .16 -2.22 .14 Venda -1.02 .30 .33 -2.31 .28 Xhosa 2.39* .21 .00 1.46 3.32 Zulu .78* .21 .20 -.13 1.69
Tswana Afr 3.22 .30 .00 1.91 4.53 Eng .43 .43 1.00 -1.42 2.28 Ndebele 2.17* .45 .01 .24 4.11 Sepedi 1.82 .24 .00 .77 2.87 Sotho .32* .29 1.00 -.95 1.60 Swati 1.56 .36 .05 -.01 3.13 Tsonga 1.04* .27 .16 -.14 2.22 Venda .02 .33 1.00 -1.40 1.44 Xhosa 3.43* .25 .00 2.33 4.52 Zulu 1.82* .25 .00 .74 2.90

248
Post-Hoc (Scheffe) Tests Language Multiple Comparisons: OPEN TO EXPERIENCE
Dependent Variable (I) Language
(J) Language
Mean Difference
(I-J)
Std. Error
Sig. 95% Confidence Interval Lower Bound
Upper Bound
OPENTOEXPERIENCE Venda Afr 3.20 .33 .00 1.79 4.61 Eng .41* .44 1.00 -1.51 2.33 Ndebele 2.15* .46 .02 .14 4.16 Sepedi 1.80* .27 .00 .62 2.97 Sotho .30* .32 1.00 -1.08 1.68 Swati 1.54* .38 .10 -.12 3.19 Tsonga 1.02 .30 .33 -.28 2.31 Tswana -.02* .33 1.00 -1.44 1.40 Xhosa 3.41* .28 .00 2.19 4.62 Zulu 1.80 .28 .00 .60 3.00
Xhosa Afr -.20 .25 1.00 -1.29 .88 Eng -2.99* .39 .00 -4.69 -1.30 Ndebele -1.26 .41 .53 -3.05 .54 Sepedi -1.61* .17 .00 -2.37 -.85 Sotho -3.10 .24 .00 -4.15 -2.05 Swati -1.87* .32 .00 -3.26 -.48 Tsonga -2.39 .21 .00 -3.32 -1.46 Tswana -3.43* .25 .00 -4.52 -2.33 Venda -3.41* .28 .00 -4.62 -2.19 Zulu -1.61 .18 .00 -2.40 -.81
Zulu Afr 1.40* .25 .00 .33 2.47 Eng -1.39* .39 .26 -3.08 .30 Ndebele .35* .41 1.00 -1.43 2.13 Sepedi .00* .17 1.00 -.74 .73 Sotho -1.50* .24 .00 -2.53 -.47 Swati -.26 .32 1.00 -1.64 1.11 Tsonga -.78* .21 .20 -1.69 .13 Tswana -1.82* .25 .00 -2.90 -.74 Venda -1.80 .28 .00 -3.00 -.60 Xhosa 1.61 .18 .00 .81 2.40

249
Post-Hoc (Scheffe) Tests Language Multiple Comparisons: AGREEABLENESS
Dependent Variable (I) Language
(J) Language
Mean Difference
(I-J)
Std. Error
Sig. 95% Confidence Interval Lower Bound
Upper Bound
AGREEABLENESS Afr Eng -3.58* .59 .00 -6.14 -1.02 Ndebele -.73 .62 .99 -3.41 1.95 Sepedi -.06* .33 1.00 -1.51 1.39 Sotho -1.76 .41 .05 -3.53 .00 Swati -3.01* .50 .00 -5.18 -.84 Tsonga -3.72 .38 .00 -5.35 -2.09 Tswana -1.81* .42 .05 -3.63 .00 Venda -5.09* .45 .00 -7.05 -3.13 Xhosa 1.21 .35 .30 -.30 2.72 Zulu -1.31* .34 .15 -2.80 .17
Eng Afr 3.58* .59 .00 1.02 6.14 Ndebele 2.85* .75 .16 -.39 6.08 Sepedi 3.52* .54 .00 1.20 5.84 Sotho 1.81* .59 .49 -.72 4.34 Swati .57 .66 1.00 -2.26 3.39 Tsonga -.14* .57 1.00 -2.58 2.30 Tswana 1.76* .60 .56 -.80 4.33 Venda -1.51 .62 .82 -4.18 1.16 Xhosa 4.79 .55 .00 2.43 7.15 Zulu 2.26* .54 .07 -.08 4.61
Ndebele Afr .73 .62 .99 -1.95 3.41 Eng -2.85* .75 .16 -6.08 .39 Sepedi .67 .57 .99 -1.78 3.13 Sotho -1.03* .62 .98 -3.69 1.62 Swati -2.28 .68 .35 -5.22 .66 Tsonga -2.99* .60 .00 -5.55 -.42 Tswana -1.08* .62 .98 -3.77 1.60 Venda -4.36 .65 .00 -7.15 -1.57 Xhosa 1.94* .58 .34 -.55 4.43 Zulu -.58* .57 1.00 -3.06 1.89
Sepedi Afr .06* .33 1.00 -1.39 1.51 Eng -3.52* .54 .00 -5.84 -1.20 Ndebele -.67* .57 .99 -3.13 1.78 Sotho -1.71 .32 .00 -3.10 -.31 Swati -2.95* .43 .00 -4.83 -1.07 Tsonga -3.66* .28 .00 -4.88 -2.44 Tswana -1.76 .34 .00 -3.22 -.30 Venda -5.03 .38 .00 -6.67 -3.40 Xhosa 1.27* .24 .00 .21 2.32 Zulu -1.26 .23 .00 -2.28 -.24

250
Post-Hoc (Scheffe) Tests Language Multiple Comparisons: AGREEABLENESS
Dependent Variable
(I) Language
(J) Language
Mean Difference
(I-J)
Std. Error
Sig. 95% Confidence Interval Lower Bound
Upper Bound
AGREEABLENESS Sotho Afr 1.76* .41 .05 .00 3.53 Eng -1.81 .59 .49 -4.34 .72 Ndebele 1.03* .62 .98 -1.62 3.69 Sepedi 1.71 .32 .00 .31 3.10 Swati -1.25* .49 .79 -3.38 .89 Tsonga -1.95* .37 .00 -3.54 -.37 Tswana -.05 .41 1.00 -1.82 1.72 Venda -3.33* .44 .00 -5.25 -1.41 Xhosa 2.97* .34 .00 1.52 4.43 Zulu .45* .33 .99 -.98 1.88
Swati Afr 3.01* .50 .00 .84 5.18 Eng -.57* .66 1.00 -3.39 2.26 Ndebele 2.28 .68 .35 -.66 5.22 Sepedi 2.95* .43 .00 1.07 4.83 Sotho 1.25* .49 .79 -.89 3.38 Tsonga -.71 .47 .99 -2.73 1.32 Tswana 1.20 .50 .85 -.98 3.37 Venda -2.08* .53 .13 -4.38 .22 Xhosa 4.22 .45 .00 2.29 6.15 Zulu 1.70* .44 .15 -.21 3.60
Tsonga Afr 3.72 .38 .00 2.09 5.35 Eng .14* .57 1.00 -2.30 2.58 Ndebele 2.99 .60 .00 .42 5.55 Sepedi 3.66* .28 .00 2.44 4.88 Sotho 1.95* .37 .00 .37 3.54 Swati .71 .47 .99 -1.32 2.73 Tswana 1.90* .38 .00 .26 3.54 Venda -1.37* .42 .38 -3.17 .43 Xhosa 4.93* .30 .00 3.64 6.22 Zulu 2.40* .29 .00 1.14 3.67
Tswana Afr 1.81* .42 .05 .00 3.63 Eng -1.76 .60 .56 -4.33 .80 Ndebele 1.08* .62 .98 -1.60 3.77 Sepedi 1.76* .34 .00 .30 3.22 Sotho .05 .41 1.00 -1.72 1.82 Swati -1.20 .50 .85 -3.37 .98 Tsonga -1.90* .38 .00 -3.54 -.26 Venda -3.28 .46 .00 -5.24 -1.31 Xhosa 3.02* .35 .00 1.50 4.54 Zulu .50 .34 .99 -1.00 1.99

251
Post-Hoc (Scheffe) Tests Language Multiple Comparisons: AGREEABLENESS
Dependent Variable
(I) Language
(J) Language
Mean Difference
(I-J)
Std. Error
Sig. 95% Confidence Interval Lower Bound
Upper Bound
AGREEABLENESS Venda Afr 5.09* .45 .00 3.13 7.05 Eng 1.51 .62 .82 -1.16 4.18 Ndebele 4.36* .65 .00 1.57 7.15 Sepedi 5.03* .38 .00 3.40 6.67 Sotho 3.33 .44 .00 1.41 5.25 Swati 2.08* .53 .13 -.22 4.38 Tsonga 1.37* .42 .38 -.43 3.17 Tswana 3.28* .46 .00 1.31 5.24 Xhosa 6.30* .39 .00 4.61 7.99 Zulu 3.78* .39 .00 2.11 5.44
Xhosa Afr -1.21 .35 .30 -2.72 .30 Eng -4.79* .55 .00 -7.15 -2.43 Ndebele -1.94* .58 .34 -4.43 .55 Sepedi -1.27 .24 .00 -2.32 -.21 Sotho -2.97 .34 .00 -4.43 -1.52 Swati -4.22* .45 .00 -6.15 -2.29 Tsonga -4.93 .30 .00 -6.22 -3.64 Tswana -3.02* .35 .00 -4.54 -1.50 Venda -6.30 .39 .00 -7.99 -4.61 Zulu -2.52* .25 .00 -3.63 -1.42
Zulu Afr 1.31 .34 .15 -.17 2.80 Eng -2.26* .54 .07 -4.61 .08 Ndebele .58* .57 1.00 -1.89 3.06 Sepedi 1.26 .23 .00 .24 2.28 Sotho -.45* .33 .99 -1.88 .98 Swati -1.70* .44 .15 -3.60 .21 Tsonga -2.40* .29 .00 -3.67 -1.14 Tswana -.50* .34 .99 -1.99 1.00 Venda -3.78* .39 .00 -5.44 -2.11 Xhosa 2.52 .25 .00 1.42 3.63

252
Post-Hoc (Scheffe) Tests Language Multiple Comparisons: SOCIAL DESIRABILITY
Dependent Variable (I) Language
(J) Language
Mean Difference
(I-J)
Std. Error
Sig. 95% Confidence Interval Lower Bound
Upper Bound
SOCIAL DESIRABILITY
Afr Eng -.16* .19 1.00 -.98 .66 Ndebele -4.98* .20 .00 -5.84 -4.13 Sepedi -5.40 .10 .00 -5.86 -4.93 Sotho -3.47 .13 .00 -4.03 -2.90 Swati -5.50* .16 .00 -6.20 -4.81 Tsonga -6.42 .12 .00 -6.94 -5.90 Tswana -3.13* .13 .00 -3.71 -2.55 Venda -6.50 .14 .00 -7.13 -5.88 Xhosa -3.65* .11 .00 -4.13 -3.16 Zulu -4.56 .11 .00 -5.04 -4.09
Eng Afr .16* .19 1.00 -.66 .98 Ndebele -4.83* .24 .00 -5.86 -3.79 Sepedi -5.24 .17 .00 -5.99 -4.50 Sotho -3.31* .18 .00 -4.12 -2.50 Swati -5.35* .21 .00 -6.25 -4.44 Tsonga -6.26* .18 .00 -7.04 -5.48 Tswana -2.98* .19 .00 -3.80 -2.15 Venda -6.35* .20 .00 -7.20 -5.49 Xhosa -3.49 .17 .00 -4.25 -2.74 Zulu -4.41* .17 .00 -5.16 -3.66
Ndebele Afr 4.98* .20 .00 4.13 5.84 Eng 4.83 .24 .00 3.79 5.86 Sepedi -.42 .18 .88 -1.20 .37 Sotho 1.52* .19 .00 .67 2.37 Swati -.52 .22 .85 -1.46 .42 Tsonga -1.43* .19 .00 -2.26 -.61 Tswana 1.85 .20 .00 .99 2.71 Venda -1.52* .20 .00 -2.41 -.63 Xhosa 1.34 .18 .00 .54 2.13 Zulu .42* .18 .88 -.37 1.21
Sepedi Afr 5.40* .10 .00 4.93 5.86 Eng 5.24 .17 .00 4.50 5.99 Ndebele .42* .18 .88 -.37 1.20 Sotho 1.93* .10 .00 1.49 2.38 Swati -.10* .14 1.00 -.70 .50 Tsonga -1.02* .09 .00 -1.41 -.63 Tswana 2.27* .10 .00 1.80 2.73 Venda -1.10 .12 .00 -1.63 -.58 Xhosa 1.75* .07 .00 1.41 2.09 Zulu .84* .07 .00 .51 1.16

253
Post-Hoc (Scheffe) Tests Language Multiple Comparisons: SOCIAL DESIRABILITY
Dependent Variable
(I) Language
(J) Language
Mean Difference
(I-J)
Std. Error
Sig. 95% Confidence Interval Lower Bound
Upper Bound
SOCIAL DESIRABILITY
Sotho Afr 3.47 .13 .00 2.90 4.03 Eng 3.31 .18 .00 2.50 4.12 Ndebele -1.52* .19 .00 -2.37 -.67 Sepedi -1.93 .10 .00 -2.38 -1.49 Swati -2.04* .16 .00 -2.72 -1.35 Tsonga -2.95 .11 .00 -3.46 -2.45 Tswana .33* .13 .78 -.23 .90 Venda -3.04 .14 .00 -3.65 -2.42 Xhosa -.18* .10 .98 -.65 .28 Zulu -1.10* .10 .00 -1.56 -.64
Swati Afr 5.50 .16 .00 4.81 6.20 Eng 5.35* .21 .00 4.44 6.25 Ndebele .52* .22 .85 -.42 1.46 Sepedi .10* .14 1.00 -.50 .70 Sotho 2.04* .16 .00 1.35 2.72 Tsonga -.92* .15 .00 -1.56 -.27 Tswana 2.37 .16 .00 1.67 3.07 Venda -1.00* .17 .00 -1.74 -.27 Xhosa 1.85* .14 .00 1.24 2.47 Zulu .94 .14 .00 .33 1.55
Tsonga Afr 6.42 .12 .00 5.90 6.94 Eng 6.26* .18 .00 5.48 7.04 Ndebele 1.43 .19 .00 .61 2.26 Sepedi 1.02* .09 .00 .63 1.41 Sotho 2.95 .11 .00 2.45 3.46 Swati .92* .15 .00 .27 1.56 Tswana 3.29 .12 .00 2.76 3.81 Venda -.08* .13 1.00 -.66 .49 Xhosa 2.77* .09 .00 2.36 3.18 Zulu 1.85 .09 .00 1.45 2.26
Tswana Afr 3.13* .13 .00 2.55 3.71 Eng 2.98* .19 .00 2.15 3.80 Ndebele -1.85* .20 .00 -2.71 -.99 Sepedi -2.27* .10 .00 -2.73 -1.80 Sotho -.33* .13 .78 -.90 .23 Swati -2.37 .16 .00 -3.07 -1.67 Tsonga -3.29* .12 .00 -3.81 -2.76 Venda -3.37* .14 .00 -4.00 -2.74 Xhosa -.52 .11 .02 -1.00 -.03 Zulu -1.43 .11 .00 -1.91 -.95

254
Post-Hoc (Scheffe) Tests Language Multiple Comparisons: SOCIAL DESIRABILITY
Dependent Variable (I) Language
(J) Language
Mean Difference
(I-J)
Std. Error
Sig. 95% Confidence Interval Lower Bound
Upper Bound
SOCIALDESIRABILITY Venda Afr 6.50* .14 .00 5.88 7.13 Eng 6.35 .20 .00 5.49 7.20 Ndebele 1.52* .20 .00 .63 2.41 Sepedi 1.10 .12 .00 .58 1.63 Sotho 3.04* .14 .00 2.42 3.65 Swati 1.00 .17 .00 .27 1.74 Tsonga .08* .13 1.00 -.49 .66 Tswana 3.37* .14 .00 2.74 4.00 Xhosa 2.86 .12 .00 2.31 3.40 Zulu 1.94* .12 .00 1.41 2.47
Xhosa Afr 3.65* .11 .00 3.16 4.13 Eng 3.49* .17 .00 2.74 4.25 Ndebele -1.34* .18 .00 -2.13 -.54 Sepedi -1.75* .07 .00 -2.09 -1.41 Sotho .18 .10 .98 -.28 .65 Swati -1.85* .14 .00 -2.47 -1.24 Tsonga -2.77* .09 .00 -3.18 -2.36 Tswana .52 .11 .02 .03 1.00 Venda -2.86 .12 .00 -3.40 -2.31 Zulu -.92* .08 .00 -1.27 -.56
Zulu Afr 4.56 .11 .00 4.09 5.04 Eng 4.41* .17 .00 3.66 5.16 Ndebele -.42 .18 .88 -1.21 .37 Sepedi -.84* .07 .00 -1.16 -.51 Sotho 1.10 .10 .00 .64 1.56 Swati -.94* .14 .00 -1.55 -.33 Tsonga -1.85* .09 .00 -2.26 -1.45 Tswana 1.43 .11 .00 .95 1.91 Venda -1.94* .12 .00 -2.47 -1.41 Xhosa .92* .08 .00 .56 1.27
Based on observed means. The error term is Mean Square(Error) = 62.307. *. The mean difference is significant at the .05 level.

255
Homogeneous Subsets EXTRAVERSION Scheffe Language N Subset
1 2 3 Xhosa 17265 119.71 Afr 6786 119.73 Swati 3628 120.23 120.23 Sepedi 23825 120.24 120.24 Tswana 6687 120.68 120.68 Zulu 19472 121.00 121.00 Ndebele 2002 121.20 Tsonga 10857 121.35 Sotho 7517 121.59 Eng 2261 123.45 Venda 5042 123.52 Sig. .149 .092 1.000 Means for groups in homogeneous subsets are displayed. Based on observed means. The error term is Mean Square(Error) = 298.174. a. Uses Harmonic Mean Sample Size = 5265.566. b. Alpha = .05. NEUROTICISM Scheffe Language N Subset
1 2 3 4 5 Eng 2261 71.40 Tsonga 10857 76.37 Sotho 7517 77.32 77.32 Afr 6786 77.37 77.37 Tswana 6687 77.70 77.70 77.70 Venda 5042 78.27 78.27 Swati 3628 78.39 78.39 Ndebele 2002 78.61 78.61 78.61 Sepedi 23825 79.01 79.01 Zulu 19472 79.05 79.05 Xhosa 17265 79.99 Sig. 1.000 .231 .279 .199 .175 Means for groups in homogeneous subsets are displayed. Based on observed means. The error term is Mean Square(Error) = 359.316. a. Uses Harmonic Mean Sample Size = 5265.566. b. Alpha = .05.

256
CONSCIENTIOUSNESS Scheffe Language N Subset
1 2 3 4 Xhosa 17265 162.42 Ndebele 2002 165.22 Sepedi 23825 165.39 Zulu 19472 165.51 165.51 Sotho 7517 165.95 165.95 Afr 6786 165.95 165.95 Tswana 6687 166.19 166.19 Swati 3628 167.23 167.23 Venda 5042 168.37 Tsonga 10857 168.57 Eng 2261 168.59 Sig. 1.000 .869 .076 .386 Means for groups in homogeneous subsets are displayed. Based on observed means. The error term is Mean Square(Error) = 459.438. a. Uses Harmonic Mean Sample Size = 5265.566. b. Alpha = .05.
OPENTOEXPERIENCE Scheffe Language N Subset
1 2 3 4 5 6 Xhosa 17265 115.44 Afr 6786 115.64 115.64 Ndebele 2002 116.69 116.69 116.69 Zulu 19472 117.04 117.04 117.04 Sepedi 23825 117.05 117.05 117.05 Swati 3628 117.30 117.30 117.30 Tsonga 10857 117.82 117.82 117.82 117.82 Eng 2261 118.43 118.43 118.43 Sotho 7517 118.54 118.54 Venda 5042 118.84 Tswana 6687 118.86 Sig. .214 .086 .385 .097 .237 .528 Means for groups in homogeneous subsets are displayed. Based on observed means. The error term is Mean Square(Error) = 315.315. a. Uses Harmonic Mean Sample Size = 5265.566. b. Alpha = .05.

257
AGREEABLENESS Scheffe Language N Subset
1 2 3 4 5 Xhosa 17265 131.30 Afr 6786 132.51 132.51 Sepedi 23825 132.57 132.57 Ndebele 2002 133.24 133.24 Zulu 19472 133.83 133.83 Sotho 7517 134.28 134.28 134.28 Tswana 6687 134.33 134.33 134.33 Swati 3628 135.52 135.52 Eng 2261 136.09 136.09 Tsonga 10857 136.23 136.23 Venda 5042 137.60 Sig. .091 .162 .255 .085 .448 Means for groups in homogeneous subsets are displayed. Based on observed means. The error term is Mean Square(Error) = 607.683. a. Uses Harmonic Mean Sample Size = 5265.566. b. Alpha = .05.
SOCIALDESIRABILITY Scheffe Language N Subset
1 2 3 4 5 Afr 6786 38.97 Eng 2261 39.12 Tswana 6687 42.10 Sotho 7517 42.43 Xhosa 17265 42.61 Zulu 19472 43.53 Ndebele 2002 43.95 43.95 Sepedi 23825 44.37 Swati 3628 44.47 Tsonga 10857 45.39 Venda 5042 45.47 Sig. 1.000 .340 .682 .332 1.000 Means for groups in homogeneous subsets are displayed. Based on observed means. The error term is Mean Square(Error) = 62.307. a. Uses Harmonic Mean Sample Size = 5265.566. b. Alpha = .05.
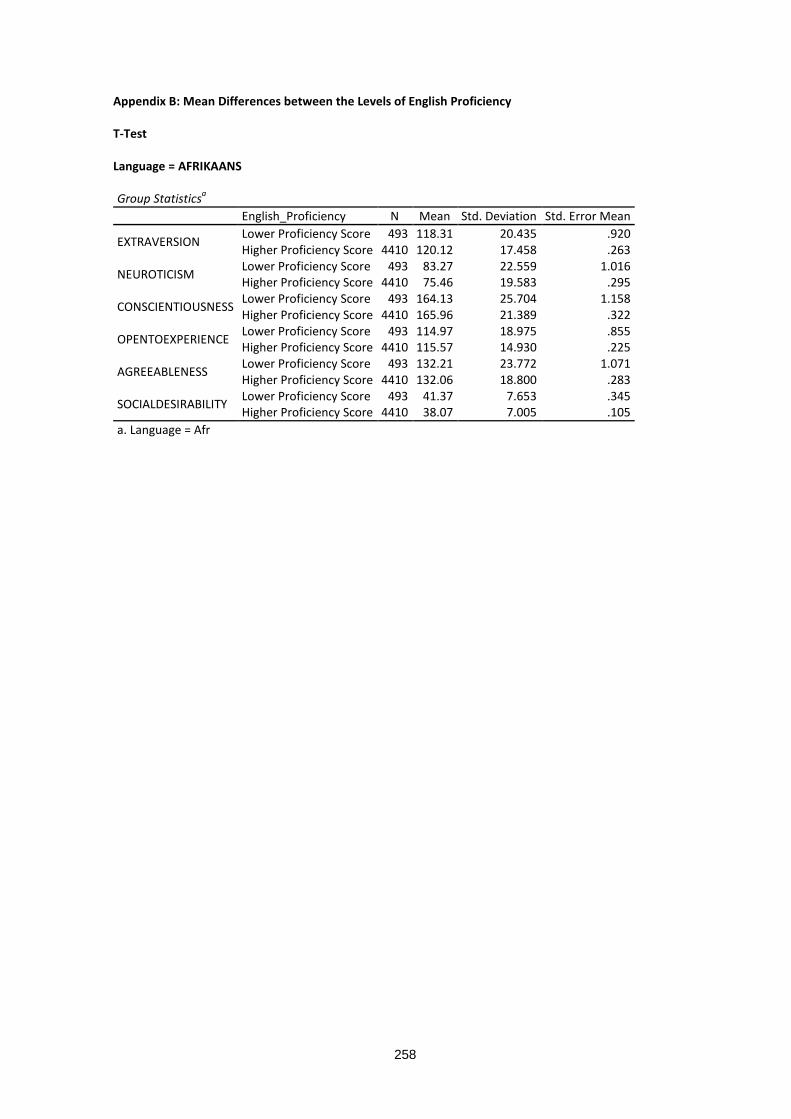
258
Appendix B: Mean Differences between the Levels of English Proficiency T-Test Language = AFRIKAANS Group Statisticsa
English_Proficiency N Mean Std. Deviation Std. Error Mean
EXTRAVERSION Lower Proficiency Score 493 118.31 20.435 .920 Higher Proficiency Score 4410 120.12 17.458 .263
NEUROTICISM Lower Proficiency Score 493 83.27 22.559 1.016 Higher Proficiency Score 4410 75.46 19.583 .295
CONSCIENTIOUSNESS Lower Proficiency Score 493 164.13 25.704 1.158 Higher Proficiency Score 4410 165.96 21.389 .322
OPENTOEXPERIENCE Lower Proficiency Score 493 114.97 18.975 .855 Higher Proficiency Score 4410 115.57 14.930 .225
AGREEABLENESS Lower Proficiency Score 493 132.21 23.772 1.071 Higher Proficiency Score 4410 132.06 18.800 .283
SOCIALDESIRABILITY Lower Proficiency Score 493 41.37 7.653 .345 Higher Proficiency Score 4410 38.07 7.005 .105
a. Language = Afr

259
Independent Samples Testa Levene's Test for
Equality of Variances t-test for Equality of Means
F Sig. t df Sig. (2-tailed)
Mean Difference
EXTRAVERSION
Equal variances assumed 9.859 .002 -
2.142 4901 .032 -1.809
Equal variances not assumed
-1.890 575.136 .059 -1.809
NEUROTICISM
Equal variances assumed 17.281 .000 8.262 4901 .000 7.809
Equal variances not assumed
7.381 577.922 .000 7.809
CONSCIENTIOUSNESS
Equal variances assumed 14.268 .000 -
1.764 4901 .078 -1.832
Equal variances not assumed
-1.524 570.739 .128 -1.832
OPENTOEXPERIENCE
Equal variances assumed 23.609 .000 -.829 4901 .407 -.605
Equal variances not assumed
-.685 562.157 .494 -.605
AGREEABLENESS
Equal variances assumed 14.818 .000 .164 4901 .869 .151
Equal variances not assumed
.136 562.898 .892 .151
SOCIALDESIRABILITY Equal variances assumed 4.038 .045 9.824 4901 .000 3.300
Independent Samples Testa t-test for Equality of Means
Std. Error Difference
95% Confidence Interval of the Difference
Lower Upper
EXTRAVERSION Equal variances assumed .844 -3.464 -.154 Equal variances not assumed .957 -3.689 .071
NEUROTICISM Equal variances assumed .945 5.956 9.662 Equal variances not assumed 1.058 5.731 9.887
CONSCIENTIOUSNESS Equal variances assumed 1.038 -3.867 .204 Equal variances not assumed 1.202 -4.192 .529
OPENTOEXPERIENCE Equal variances assumed .731 -2.038 .827 Equal variances not assumed .884 -2.341 1.130
AGREEABLENESS Equal variances assumed .919 -1.651 1.953 Equal variances not assumed 1.107 -2.024 2.326
SOCIALDESIRABILITY Equal variances assumed .336 2.641 3.958

260
Independent Samples Testa Levene's Test for
Equality of Variances t-test for Equality of Means
F Sig. t df Sig. (2-tailed)
Mean Difference
SOCIALDESIRABILITY Equal variances not assumed
9.154 587.907 .000 3.300
Independent Samples Testa t-test for Equality of Means
Std. Error Difference
95% Confidence Interval of the Difference
Lower Upper SOCIALDESIRABILITY Equal variances not
assumed .360 2.592 4.007
a. Language = Afr Language = ENGLISH Group Statisticsa
English_Proficiency N Mean Std. Deviation Std. Error Mean
EXTRAVERSION Lower Proficiency Score 124 117.44 19.279 1.731 Higher Proficiency Score 1869 124.16 16.914 .391
NEUROTICISM Lower Proficiency Score 124 82.90 22.198 1.993 Higher Proficiency Score 1869 69.87 18.879 .437
CONSCIENTIOUSNESS Lower Proficiency Score 124 161.45 28.279 2.539 Higher Proficiency Score 1869 169.16 21.205 .490
OPENTOEXPERIENCE Lower Proficiency Score 124 112.52 24.179 2.171 Higher Proficiency Score 1869 118.89 14.887 .344
AGREEABLENESS Lower Proficiency Score 124 129.75 31.343 2.815 Higher Proficiency Score 1869 136.65 18.862 .436
SOCIALDESIRABILITY Lower Proficiency Score 124 43.59 8.422 .756 Higher Proficiency Score 1869 38.49 7.262 .168
a. Language = Eng

261
Independent Samples Testa Levene's Test for
Equality of Variances t-test for Equality of Means
F Sig. t df Sig. (2-tailed)
Mean Difference
EXTRAVERSION
Equal variances assumed 2.345 .126 -
4.249 1991 .000 -6.726
Equal variances not assumed
-3.789 135.860 .000 -6.726
NEUROTICISM
Equal variances assumed 5.542 .019 7.359 1991 .000 13.036
Equal variances not assumed
6.388 135.068 .000 13.036
CONSCIENTIOUSNESS
Equal variances assumed 4.826 .028 -
3.827 1991 .000 -7.704
Equal variances not assumed
-2.979 132.336 .003 -7.704
OPENTOEXPERIENCE
Equal variances assumed 25.147 .000 -
4.392 1991 .000 -6.363
Equal variances not assumed
-2.894 129.259 .004 -6.363
AGREEABLENESS
Equal variances assumed 30.030 .000 -
3.744 1991 .000 -6.896
Equal variances not assumed
-2.421 128.977 .017 -6.896
SOCIALDESIRABILITY Equal variances assumed 3.093 .079 7.488 1991 .000 5.096
Independent Samples Testa t-test for Equality of Means
Std. Error Difference
95% Confidence Interval of the Difference
Lower Upper
EXTRAVERSION Equal variances assumed 1.583 -9.830 -3.621 Equal variances not assumed 1.775 -10.236 -3.216
NEUROTICISM Equal variances assumed 1.771 9.562 16.510 Equal variances not assumed 2.041 9.000 17.072
CONSCIENTIOUSNESS Equal variances assumed 2.013 -11.652 -3.756 Equal variances not assumed 2.586 -12.820 -2.588
OPENTOEXPERIENCE Equal variances assumed 1.449 -9.204 -3.522 Equal variances not assumed 2.198 -10.713 -2.013
AGREEABLENESS Equal variances assumed 1.842 -10.508 -3.284 Equal variances not assumed 2.848 -12.531 -1.260
SOCIALDESIRABILITY Equal variances assumed .681 3.762 6.431

262
Independent Samples Testa Levene's Test for
Equality of Variances t-test for Equality of Means
F Sig. t df Sig. (2-tailed)
Mean Difference
SOCIALDESIRABILITY Equal variances not assumed
6.578 135.414 .000 5.096
Independent Samples Testa t-test for Equality of Means
Std. Error Difference
95% Confidence Interval of the Difference
Lower Upper SOCIALDESIRABILITY Equal variances not
assumed .775 3.564 6.629
a. Language = Eng Language = NDEBELE Group Statisticsa
English_Proficiency N Mean Std. Deviation Std. Error Mean
EXTRAVERSION Lower Proficiency Score 717 121.39 17.229 .643 Higher Proficiency Score 508 122.23 17.906 .794
NEUROTICISM Lower Proficiency Score 717 83.24 18.758 .701 Higher Proficiency Score 508 74.03 17.455 .774
CONSCIENTIOUSNESS Lower Proficiency Score 717 162.79 22.398 .836 Higher Proficiency Score 508 166.95 19.931 .884
OPENTOEXPERIENCE Lower Proficiency Score 717 114.59 21.320 .796 Higher Proficiency Score 508 119.11 13.822 .613
AGREEABLENESS Lower Proficiency Score 717 130.67 28.759 1.074 Higher Proficiency Score 508 135.15 16.445 .730
SOCIALDESIRABILITY Lower Proficiency Score 717 45.33 7.793 .291 Higher Proficiency Score 508 41.74 7.898 .350
a. Language = Ndebele

263
Independent Samples Testa Levene's Test for
Equality of Variances t-test for Equality of Means
F Sig. t df Sig. (2-tailed)
Mean Difference
EXTRAVERSION
Equal variances assumed 1.817 .178 -.831 1223 .406 -.844
Equal variances not assumed
-.825 1065.625 .409 -.844
NEUROTICISM
Equal variances assumed 1.777 .183 8.707 1223 .000 9.205
Equal variances not assumed
8.815 1137.074 .000 9.205
CONSCIENTIOUSNESS
Equal variances assumed .922 .337 -
3.347 1223 .001 -4.156
Equal variances not assumed
-3.414 1161.634 .001 -4.156
OPENTOEXPERIENCE
Equal variances assumed 16.457 .000 -
4.199 1223 .000 -4.525
Equal variances not assumed
-4.503 1214.079 .000 -4.525
AGREEABLENESS
Equal variances assumed 21.052 .000 -
3.160 1223 .002 -4.475
Equal variances not assumed
-3.447 1175.748 .001 -4.475
SOCIALDESIRABILITY Equal variances assumed 1.192 .275 7.894 1223 .000 3.588
Independent Samples Testa t-test for Equality of Means
Std. Error Difference
95% Confidence Interval of the Difference
Lower Upper
EXTRAVERSION Equal variances assumed 1.016 -2.836 1.149 Equal variances not assumed 1.022 -2.850 1.162
NEUROTICISM Equal variances assumed 1.057 7.131 11.279 Equal variances not assumed 1.044 7.156 11.254
CONSCIENTIOUSNESS Equal variances assumed 1.242 -6.592 -1.720 Equal variances not assumed 1.217 -6.544 -1.768
OPENTOEXPERIENCE Equal variances assumed 1.078 -6.639 -2.411 Equal variances not assumed 1.005 -6.497 -2.553
AGREEABLENESS Equal variances assumed 1.416 -7.254 -1.697 Equal variances not assumed 1.298 -7.023 -1.928
SOCIALDESIRABILITY Equal variances assumed .454 2.696 4.480

264
Independent Samples Testa Levene's Test for
Equality of Variances t-test for Equality of Means
F Sig. t df Sig. (2-tailed)
Mean Difference
SOCIALDESIRABILITY Equal variances not assumed
7.876 1082.848 .000 3.588
Independent Samples Testa t-test for Equality of Means
Std. Error Difference
95% Confidence Interval of the Difference
Lower Upper SOCIALDESIRABILITY Equal variances not
assumed .456 2.694 4.482
a. Language = Ndebele
Language = SEPEDI Group Statisticsa
English_Proficiency N Mean Std. Deviation Std. Error Mean
EXTRAVERSION Lower Proficiency Score 9840 119.83 16.987 .171 Higher Proficiency Score 4944 120.12 16.060 .228
NEUROTICISM Lower Proficiency Score 9840 83.76 18.961 .191 Higher Proficiency Score 4944 72.65 17.071 .243
CONSCIENTIOUSNESS Lower Proficiency Score 9840 161.29 23.711 .239 Higher Proficiency Score 4944 169.42 19.404 .276
OPENTOEXPERIENCE Lower Proficiency Score 9840 114.52 21.842 .220 Higher Proficiency Score 4944 119.74 15.764 .224
AGREEABLENESS Lower Proficiency Score 9840 129.21 32.301 .326 Higher Proficiency Score 4944 134.91 22.780 .324
SOCIALDESIRABILITY Lower Proficiency Score 9840 44.88 8.029 .081 Higher Proficiency Score 4944 42.50 7.818 .111
a. Language = Sepedi
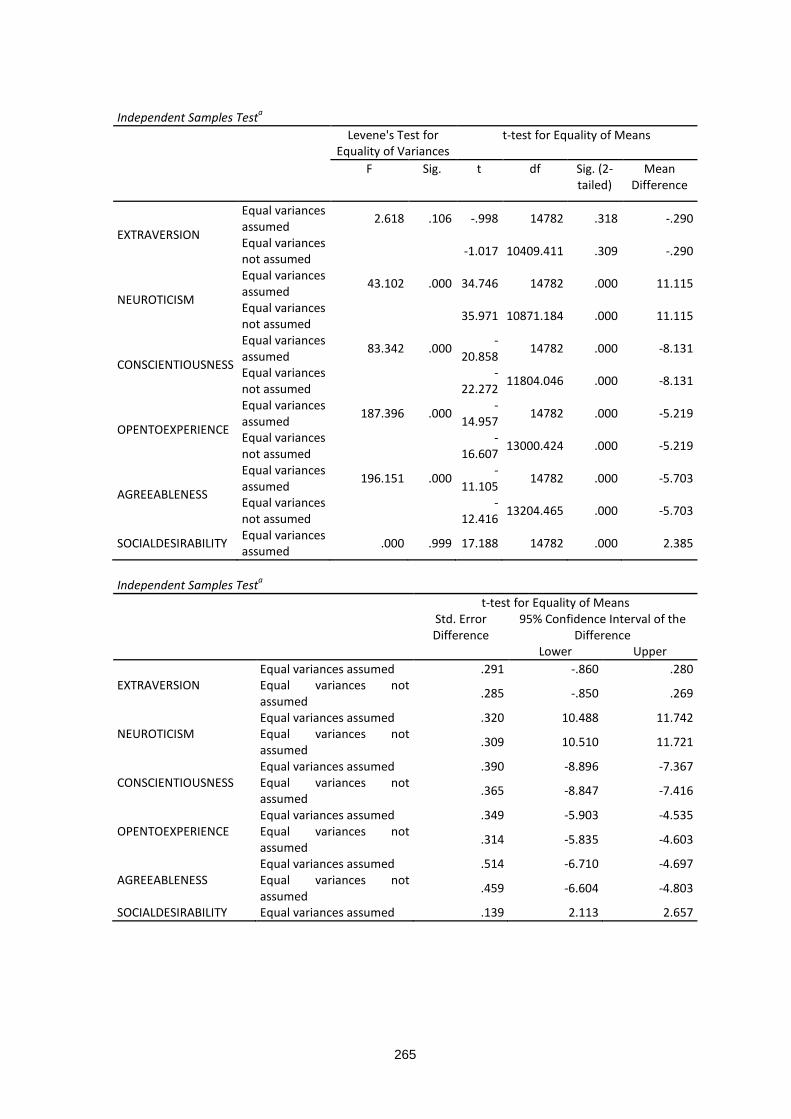
265
Independent Samples Testa Levene's Test for
Equality of Variances t-test for Equality of Means
F Sig. t df Sig. (2-tailed)
Mean Difference
EXTRAVERSION
Equal variances assumed 2.618 .106 -.998 14782 .318 -.290
Equal variances not assumed
-1.017 10409.411 .309 -.290
NEUROTICISM
Equal variances assumed 43.102 .000 34.746 14782 .000 11.115
Equal variances not assumed
35.971 10871.184 .000 11.115
CONSCIENTIOUSNESS
Equal variances assumed 83.342 .000 -
20.858 14782 .000 -8.131
Equal variances not assumed
-22.272 11804.046 .000 -8.131
OPENTOEXPERIENCE
Equal variances assumed 187.396 .000 -
14.957 14782 .000 -5.219
Equal variances not assumed
-16.607 13000.424 .000 -5.219
AGREEABLENESS
Equal variances assumed 196.151 .000 -
11.105 14782 .000 -5.703
Equal variances not assumed
-12.416 13204.465 .000 -5.703
SOCIALDESIRABILITY Equal variances assumed .000 .999 17.188 14782 .000 2.385
Independent Samples Testa t-test for Equality of Means
Std. Error Difference
95% Confidence Interval of the Difference
Lower Upper
EXTRAVERSION Equal variances assumed .291 -.860 .280 Equal variances not assumed .285 -.850 .269
NEUROTICISM Equal variances assumed .320 10.488 11.742 Equal variances not assumed .309 10.510 11.721
CONSCIENTIOUSNESS Equal variances assumed .390 -8.896 -7.367 Equal variances not assumed .365 -8.847 -7.416
OPENTOEXPERIENCE Equal variances assumed .349 -5.903 -4.535 Equal variances not assumed .314 -5.835 -4.603
AGREEABLENESS Equal variances assumed .514 -6.710 -4.697 Equal variances not assumed .459 -6.604 -4.803
SOCIALDESIRABILITY Equal variances assumed .139 2.113 2.657
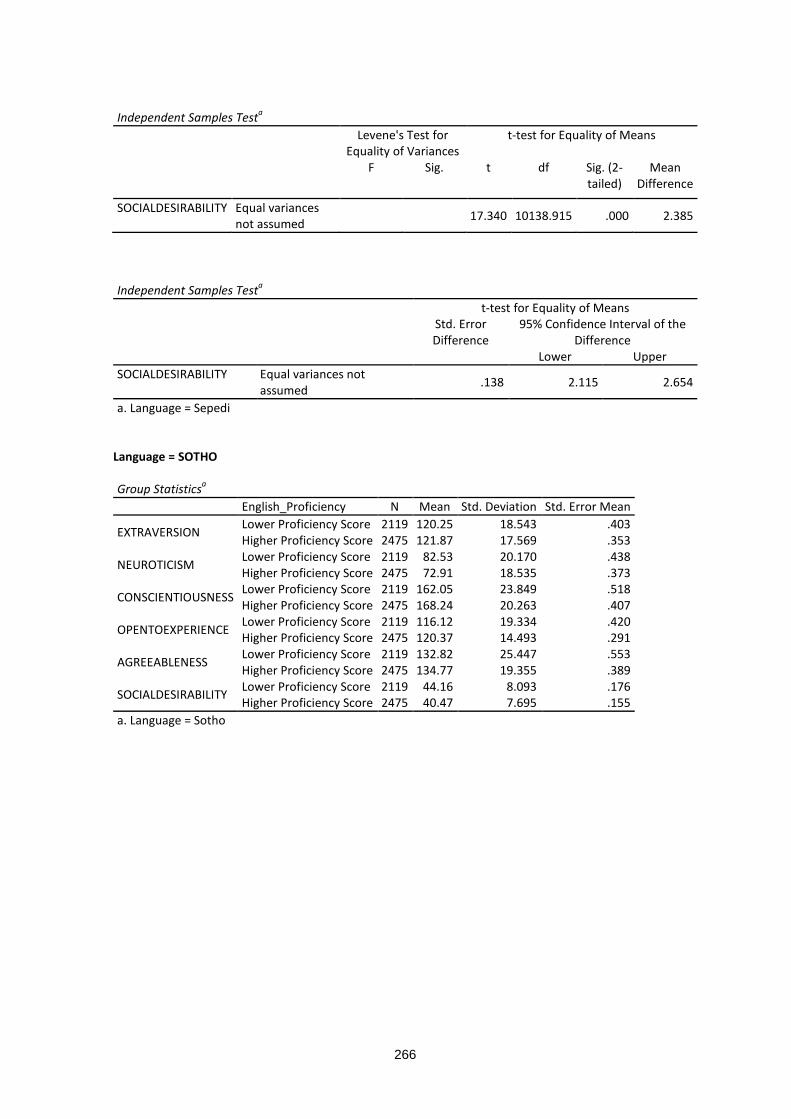
266
Independent Samples Testa Levene's Test for
Equality of Variances t-test for Equality of Means
F Sig. t df Sig. (2-tailed)
Mean Difference
SOCIALDESIRABILITY Equal variances not assumed
17.340 10138.915 .000 2.385
Independent Samples Testa t-test for Equality of Means
Std. Error Difference
95% Confidence Interval of the Difference
Lower Upper SOCIALDESIRABILITY Equal variances not
assumed .138 2.115 2.654
a. Language = Sepedi Language = SOTHO Group Statisticsa
English_Proficiency N Mean Std. Deviation Std. Error Mean
EXTRAVERSION Lower Proficiency Score 2119 120.25 18.543 .403 Higher Proficiency Score 2475 121.87 17.569 .353
NEUROTICISM Lower Proficiency Score 2119 82.53 20.170 .438 Higher Proficiency Score 2475 72.91 18.535 .373
CONSCIENTIOUSNESS Lower Proficiency Score 2119 162.05 23.849 .518 Higher Proficiency Score 2475 168.24 20.263 .407
OPENTOEXPERIENCE Lower Proficiency Score 2119 116.12 19.334 .420 Higher Proficiency Score 2475 120.37 14.493 .291
AGREEABLENESS Lower Proficiency Score 2119 132.82 25.447 .553 Higher Proficiency Score 2475 134.77 19.355 .389
SOCIALDESIRABILITY Lower Proficiency Score 2119 44.16 8.093 .176 Higher Proficiency Score 2475 40.47 7.695 .155
a. Language = Sotho

267
Independent Samples Testa Levene's Test for
Equality of Variances t-test for Equality of Means
F Sig. t df Sig. (2-tailed)
Mean Difference
EXTRAVERSION
Equal variances assumed 2.131 .144 -3.037 4592 .002 -1.620
Equal variances not assumed
-3.024 4399.879 .003 -1.620
NEUROTICISM
Equal variances assumed 12.513 .000 16.837 4592 .000 9.621
Equal variances not assumed
16.727 4343.776 .000 9.621
CONSCIENTIOUSNESS
Equal variances assumed 15.976 .000 -9.520 4592 .000 -6.196
Equal variances not assumed
-9.402 4178.575 .000 -6.196
OPENTOEXPERIENCE
Equal variances assumed 69.460 .000 -8.485 4592 .000 -4.244
Equal variances not assumed
-8.303 3877.861 .000 -4.244
AGREEABLENESS
Equal variances assumed 44.504 .000 -2.946 4592 .003 -1.951
Equal variances not assumed
-2.886 3913.758 .004 -1.951
SOCIALDESIRABILITY Equal variances assumed 1.570 .210 15.827 4592 .000 3.692
Independent Samples Testa t-test for Equality of Means
Std. Error Difference
95% Confidence Interval of the Difference
Lower Upper
EXTRAVERSION Equal variances assumed .533 -2.666 -.574 Equal variances not assumed .536 -2.670 -.570
NEUROTICISM Equal variances assumed .571 8.500 10.741 Equal variances not assumed .575 8.493 10.748
CONSCIENTIOUSNESS Equal variances assumed .651 -7.472 -4.920 Equal variances not assumed .659 -7.488 -4.904
OPENTOEXPERIENCE Equal variances assumed .500 -5.225 -3.263 Equal variances not assumed .511 -5.246 -3.242
AGREEABLENESS Equal variances assumed .662 -3.249 -.652 Equal variances not assumed .676 -3.276 -.625
SOCIALDESIRABILITY Equal variances assumed .233 3.234 4.149

268
Independent Samples Testa Levene's Test for
Equality of Variances t-test for Equality of Means
F Sig. t df Sig. (2-tailed)
Mean Difference
SOCIALDESIRABILITY Equal variances not assumed
15.766 4406.083 .000 3.692
Independent Samples Testa t-test for Equality of Means
Std. Error Difference
95% Confidence Interval of the Difference
Lower Upper SOCIALDESIRABILITY Equal variances not
assumed .234 3.233 4.151
a. Language = Sotho Language = SWATI Group Statisticsa
English_Proficiency N Mean Std. Deviation Std. Error Mean
EXTRAVERSION Lower Proficiency Score 1316 120.55 17.351 .478 Higher Proficiency Score 779 119.27 16.621 .596
NEUROTICISM Lower Proficiency Score 1316 83.33 19.128 .527 Higher Proficiency Score 779 71.95 17.659 .633
CONSCIENTIOUSNESS Lower Proficiency Score 1316 164.92 21.336 .588 Higher Proficiency Score 779 168.20 19.145 .686
OPENTOEXPERIENCE Lower Proficiency Score 1316 115.87 18.735 .516 Higher Proficiency Score 779 117.93 15.275 .547
AGREEABLENESS Lower Proficiency Score 1316 134.87 23.644 .652 Higher Proficiency Score 779 134.03 21.631 .775
SOCIALDESIRABILITY Lower Proficiency Score 1316 45.74 7.516 .207 Higher Proficiency Score 779 41.82 7.534 .270
a. Language = Swati

269
Independent Samples Testa Levene's Test for
Equality of Variances
t-test for Equality of Means
F Sig. t df Sig. (2-tailed)
Mean Difference
EXTRAVERSION
Equal variances assumed 1.443 .230 1.654 2093 .098 1.277
Equal variances not assumed
1.672 1689.541 .095 1.277
NEUROTICISM
Equal variances assumed 3.523 .061 13.545 2093 .000 11.387
Equal variances not assumed
13.825 1738.015 .000 11.387
CONSCIENTIOUSNESS
Equal variances assumed 2.434 .119 -3.534 2093 .000 -3.283
Equal variances not assumed
-3.634 1774.859 .000 -3.283
OPENTOEXPERIENCE
Equal variances assumed 9.726 .002 -2.596 2093 .010 -2.057
Equal variances not assumed
-2.733 1892.638 .006 -2.057
AGREEABLENESS
Equal variances assumed 3.380 .066 .810 2093 .418 .839
Equal variances not assumed
.829 1749.804 .407 .839
SOCIALDESIRABILITY Equal variances assumed .147 .702 11.549 2093 .000 3.927
Independent Samples Testa t-test for Equality of Means
Std. Error Difference
95% Confidence Interval of the Difference
Lower Upper
EXTRAVERSION Equal variances assumed .772 -.237 2.792 Equal variances not assumed .764 -.221 2.775
NEUROTICISM Equal variances assumed .841 9.738 13.035 Equal variances not assumed .824 9.771 13.002
CONSCIENTIOUSNESS Equal variances assumed .929 -5.105 -1.462 Equal variances not assumed .904 -5.056 -1.511
OPENTOEXPERIENCE Equal variances assumed .792 -3.611 -.503 Equal variances not assumed .752 -3.533 -.581
AGREEABLENESS Equal variances assumed 1.036 -1.192 2.871 Equal variances not assumed 1.013 -1.147 2.825
SOCIALDESIRABILITY Equal variances assumed .340 3.261 4.594

270
Independent Samples Testa Levene's Test for
Equality of Variances t-test for Equality of Means
F Sig. t df Sig. (2-tailed)
Mean Difference
SOCIALDESIRABILITY Equal variances not assumed
11.542 1630.002 .000 3.927
Independent Samples Testa t-test for Equality of Means
Std. Error Difference
95% Confidence Interval of the Difference
Lower Upper SOCIALDESIRABILITY Equal variances not
assumed .340 3.260 4.595
a. Language = Swati Language = TSONGA Group Statisticsa
English_Proficiency N Mean Std. Deviation Std. Error Mean
EXTRAVERSION Lower Proficiency Score 4617 120.73 17.270 .254 Higher Proficiency Score 2228 121.68 16.634 .352
NEUROTICISM Lower Proficiency Score 4617 80.68 18.965 .279 Higher Proficiency Score 2228 70.16 17.621 .373
CONSCIENTIOUSNESS Lower Proficiency Score 4617 164.86 23.306 .343 Higher Proficiency Score 2228 172.48 19.394 .411
OPENTOEXPERIENCE Lower Proficiency Score 4617 115.34 21.169 .312 Higher Proficiency Score 2228 120.72 15.527 .329
AGREEABLENESS Lower Proficiency Score 4617 133.46 29.207 .430 Higher Proficiency Score 2228 138.16 20.181 .428
SOCIALDESIRABILITY Lower Proficiency Score 4617 45.73 7.993 .118 Higher Proficiency Score 2228 44.00 8.046 .170
a. Language = Tsonga

271
Independent Samples Testa Levene's Test for
Equality of Variances t-test for Equality of Means
F Sig. t df Sig. (2-tailed)
Mean Difference
EXTRAVERSION
Equal variances assumed 1.768 .184 -2.162 6843 .031 -.952
Equal variances not assumed
-2.191 4552.286 .029 -.952
NEUROTICISM
Equal variances assumed 7.127 .008 21.991 6843 .000 10.516
Equal variances not assumed
22.562 4703.672 .000 10.516
CONSCIENTIOUSNESS
Equal variances assumed 30.379 .000 -
13.360 6843 .000 -7.619
Equal variances not assumed
-14.236 5195.101 .000 -7.619
OPENTOEXPERIENCE
Equal variances assumed 68.012 .000 -
10.689 6843 .000 -5.380
Equal variances not assumed
-11.875 5772.944 .000 -5.380
AGREEABLENESS
Equal variances assumed 77.847 .000 -6.847 6843 .000 -4.699
Equal variances not assumed
-7.752 6031.281 .000 -4.699
SOCIALDESIRABILITY Equal variances assumed 1.424 .233 8.356 6843 .000 1.727
Independent Samples Testa t-test for Equality of Means
Std. Error Difference
95% Confidence Interval of the Difference
Lower Upper
EXTRAVERSION Equal variances assumed .440 -1.815 -.089 Equal variances not assumed .434 -1.804 -.100
NEUROTICISM Equal variances assumed .478 9.579 11.454 Equal variances not assumed .466 9.603 11.430
CONSCIENTIOUSNESS Equal variances assumed .570 -8.737 -6.501 Equal variances not assumed .535 -8.669 -6.570
OPENTOEXPERIENCE Equal variances assumed .503 -6.367 -4.393 Equal variances not assumed .453 -6.268 -4.492
AGREEABLENESS Equal variances assumed .686 -6.045 -3.354 Equal variances not assumed .606 -5.888 -3.511
SOCIALDESIRABILITY Equal variances assumed .207 1.321 2.132

272
Independent Samples Testa Levene's Test for
Equality of Variances t-test for Equality of Means
F Sig. t df Sig. (2-tailed)
Mean Difference
SOCIALDESIRABILITY Equal variances not assumed
8.336 4374.379 .000 1.727
Independent Samples Testa t-test for Equality of Means
Std. Error Difference
95% Confidence Interval of the Difference
Lower Upper SOCIALDESIRABILITY Equal variances not
assumed .207 1.320 2.133
a. Language = Tsonga Language = TSWANA Group Statisticsa
English_Proficiency N Mean Std. Deviation Std. Error Mean
EXTRAVERSION Lower Proficiency Score 1430 119.94 18.928 .501 Higher Proficiency Score 2694 120.88 16.998 .327
NEUROTICISM Lower Proficiency Score 1430 83.85 20.928 .553 Higher Proficiency Score 2694 74.39 18.124 .349
CONSCIENTIOUSNESS Lower Proficiency Score 1430 162.51 24.076 .637 Higher Proficiency Score 2694 167.87 19.774 .381
OPENTOEXPERIENCE Lower Proficiency Score 1430 117.19 19.327 .511 Higher Proficiency Score 2694 120.21 14.170 .273
AGREEABLENESS Lower Proficiency Score 1430 133.58 26.607 .704 Higher Proficiency Score 2694 134.52 18.047 .348
SOCIALDESIRABILITY Lower Proficiency Score 1430 44.25 8.491 .225 Higher Proficiency Score 2694 40.21 7.747 .149
a. Language = Tswana

273
Independent Samples Testa Levene's Test for
Equality of Variances t-test for Equality of Means
F Sig. t df Sig. (2-tailed)
Mean Difference
EXTRAVERSION
Equal variances assumed 9.824 .002 -1.632 4122 .103 -.944
Equal variances not assumed
-1.579 2655.959 .115 -.944
NEUROTICISM
Equal variances assumed 35.212 .000 15.114 4122 .000 9.466
Equal variances not assumed
14.466 2576.526 .000 9.466
CONSCIENTIOUSNESS
Equal variances assumed 22.686 .000 -7.669 4122 .000 -5.361
Equal variances not assumed
-7.225 2467.644 .000 -5.361
OPENTOEXPERIENCE
Equal variances assumed 47.509 .000 -5.701 4122 .000 -3.012
Equal variances not assumed
-5.197 2263.063 .000 -3.012
AGREEABLENESS
Equal variances assumed 84.565 .000 -1.347 4122 .178 -.943
Equal variances not assumed
-1.202 2144.279 .229 -.943
SOCIALDESIRABILITY Equal variances assumed 10.817 .001 15.400 4122 .000 4.037
Independent Samples Testa t-test for Equality of Means
Std. Error Difference
95% Confidence Interval of the Difference
Lower Upper
EXTRAVERSION Equal variances assumed .579 -2.079 .190 Equal variances not assumed .598 -2.117 .229
NEUROTICISM Equal variances assumed .626 8.238 10.694 Equal variances not assumed .654 8.183 10.750
CONSCIENTIOUSNESS Equal variances assumed .699 -6.731 -3.990 Equal variances not assumed .742 -6.815 -3.906
OPENTOEXPERIENCE Equal variances assumed .528 -4.047 -1.976 Equal variances not assumed .579 -4.148 -1.875
AGREEABLENESS Equal variances assumed .700 -2.316 .430 Equal variances not assumed .785 -2.483 .596
SOCIALDESIRABILITY Equal variances assumed .262 3.523 4.551

274
Independent Samples Testa Levene's Test for
Equality of Variances t-test for Equality of Means
F Sig. t df Sig. (2-tailed)
Mean Difference
SOCIALDESIRABILITY Equal variances not assumed
14.974 2692.066 .000 4.037
Independent Samples Testa t-test for Equality of Means
Std. Error Difference
95% Confidence Interval of the Difference
Lower Upper SOCIALDESIRABILITY Equal variances not
assumed .270 3.509 4.566
a. Language = Tswana Language = Venda Group Statisticsa
English_Proficiency N Mean Std. Deviation Std. Error Mean
EXTRAVERSION Lower Proficiency Score 2048 122.98 17.886 .395 Higher Proficiency Score 1113 123.05 16.047 .481
NEUROTICISM Lower Proficiency Score 2048 83.84 19.327 .427 Higher Proficiency Score 1113 70.94 17.519 .525
CONSCIENTIOUSNESS Lower Proficiency Score 2048 163.83 23.834 .527 Higher Proficiency Score 1113 172.46 19.575 .587
OPENTOEXPERIENCE Lower Proficiency Score 2048 116.28 20.381 .450 Higher Proficiency Score 1113 121.65 14.854 .445
AGREEABLENESS Lower Proficiency Score 2048 134.30 27.845 .615 Higher Proficiency Score 1113 139.66 18.887 .566
SOCIALDESIRABILITY Lower Proficiency Score 2048 46.22 7.934 .175 Higher Proficiency Score 1113 43.23 8.147 .244
a. Language = Venda

275
Independent Samples Testa Levene's Test for
Equality of Variances t-test for Equality of Means
F Sig. t df Sig. (2-tailed)
Mean Difference
EXTRAVERSION
Equal variances assumed 11.295 .001 -.116 3159 .907 -.075
Equal variances not assumed
-.120 2501.122 .904 -.075
NEUROTICISM
Equal variances assumed 12.472 .000 18.513 3159 .000 12.899
Equal variances not assumed
19.057 2480.026 .000 12.899
CONSCIENTIOUSNESS
Equal variances assumed 33.661 .000 -
10.340 3159 .000 -8.636
Equal variances not assumed
-10.953 2680.416 .000 -8.636
OPENTOEXPERIENCE
Equal variances assumed 55.259 .000 -7.752 3159 .000 -5.376
Equal variances not assumed
-8.490 2901.539 .000 -5.376
AGREEABLENESS
Equal variances assumed 50.148 .000 -5.742 3159 .000 -5.359
Equal variances not assumed
-6.409 3009.545 .000 -5.359
SOCIALDESIRABILITY Equal variances assumed 2.763 .097 10.016 3159 .000 2.988
Independent Samples Testa t-test for Equality of Means
Std. Error Difference
95% Confidence Interval of the Difference
Lower Upper
EXTRAVERSION Equal variances assumed .643 -1.335 1.185 Equal variances not assumed .623 -1.296 1.146
NEUROTICISM Equal variances assumed .697 11.533 14.265 Equal variances not assumed .677 11.572 14.226
CONSCIENTIOUSNESS Equal variances assumed .835 -10.274 -6.998 Equal variances not assumed .788 -10.182 -7.090
OPENTOEXPERIENCE Equal variances assumed .694 -6.736 -4.017 Equal variances not assumed .633 -6.618 -4.135
AGREEABLENESS Equal variances assumed .933 -7.189 -3.529 Equal variances not assumed .836 -6.998 -3.719
SOCIALDESIRABILITY Equal variances assumed .298 2.403 3.573

276
Independent Samples Testa Levene's Test for
Equality of Variances t-test for Equality of Means
F Sig. t df Sig. (2-tailed)
Mean Difference
SOCIALDESIRABILITY Equal variances not assumed
9.938 2231.646 .000 2.988
Independent Samples Testa t-test for Equality of Means
Std. Error Difference
95% Confidence Interval of the Difference
Lower Upper SOCIALDESIRABILITY Equal variances not
assumed .301 2.398 3.577
a. Language = Venda Language = XHOSA Group Statisticsa
English_Proficiency N Mean Std. Deviation Std. Error Mean
EXTRAVERSION Lower Proficiency Score 4885 119.83 19.329 .277 Higher Proficiency Score 5428 119.24 17.118 .232
NEUROTICISM Lower Proficiency Score 4885 84.67 20.117 .288 Higher Proficiency Score 5428 75.55 17.262 .234
CONSCIENTIOUSNESS Lower Proficiency Score 4885 159.49 24.207 .346 Higher Proficiency Score 5428 163.90 20.040 .272
OPENTOEXPERIENCE Lower Proficiency Score 4885 113.68 22.080 .316 Higher Proficiency Score 5428 116.38 15.534 .211
AGREEABLENESS Lower Proficiency Score 4885 129.09 32.817 .470 Higher Proficiency Score 5428 131.81 22.151 .301
SOCIALDESIRABILITY Lower Proficiency Score 4885 43.95 8.210 .117 Higher Proficiency Score 5428 40.78 7.708 .105
a. Language = Xhosa

277
Independent Samples Testa Levene's Test for
Equality of Variances t-test for Equality of Means
F Sig. t df Sig. (2-tailed)
Mean Difference
EXTRAVERSION
Equal variances assumed 45.718 .000 1.669 10311 .095 .599
Equal variances not assumed
1.658 9812.587 .097 .599
NEUROTICISM
Equal variances assumed 87.266 .000 24.792 10311 .000 9.128
Equal variances not assumed
24.595 9677.128 .000 9.128
CONSCIENTIOUSNESS
Equal variances assumed 47.225 .000 -
10.127 10311 .000 -4.416
Equal variances not assumed
-10.028 9510.597 .000 -4.416
OPENTOEXPERIENCE
Equal variances assumed 172.521 .000 -7.241 10311 .000 -2.702
Equal variances not assumed
-7.113 8658.298 .000 -2.702
AGREEABLENESS
Equal variances assumed 221.748 .000 -4.990 10311 .000 -2.728
Equal variances not assumed
-4.893 8434.099 .000 -2.728
SOCIALDESIRABILITY Equal variances assumed 7.306 .007 20.244 10311 .000 3.174
Independent Samples Testa t-test for Equality of Means
Std. Error Difference
95% Confidence Interval of the Difference
Lower Upper
EXTRAVERSION Equal variances assumed .359 -.105 1.302 Equal variances not assumed .361 -.109 1.307
NEUROTICISM Equal variances assumed .368 8.406 9.849 Equal variances not assumed .371 8.400 9.855
CONSCIENTIOUSNESS Equal variances assumed .436 -5.271 -3.561 Equal variances not assumed .440 -5.279 -3.553
OPENTOEXPERIENCE Equal variances assumed .373 -3.433 -1.970 Equal variances not assumed .380 -3.446 -1.957
AGREEABLENESS Equal variances assumed .547 -3.799 -1.656 Equal variances not assumed .558 -3.821 -1.635
SOCIALDESIRABILITY Equal variances assumed .157 2.867 3.481

278
Independent Samples Testa Levene's Test for
Equality of Variances t-test for Equality of Means
F Sig. t df Sig. (2-tailed)
Mean Difference
SOCIALDESIRABILITY Equal variances not assumed
20.177 10027.563 .000 3.174
Independent Samples Testa t-test for Equality of Means
Std. Error Difference
95% Confidence Interval of the Difference
Lower Upper SOCIALDESIRABILITY Equal variances not
assumed .157 2.866 3.482
a. Language = Xhosa Language = ZULU Group Statisticsa
English_Proficiency N Mean Std. Deviation Std. Error Mean
EXTRAVERSION Lower Proficiency Score 6381 120.33 17.886 .224 Higher Proficiency Score 5254 121.37 16.915 .233
NEUROTICISM Lower Proficiency Score 6381 84.11 19.301 .242 Higher Proficiency Score 5254 73.41 16.986 .234
CONSCIENTIOUSNESS Lower Proficiency Score 6381 162.34 22.437 .281 Higher Proficiency Score 5254 168.12 19.577 .270
OPENTOEXPERIENCE Lower Proficiency Score 6381 115.60 19.287 .241 Higher Proficiency Score 5254 118.31 14.432 .199
AGREEABLENESS Lower Proficiency Score 6381 132.04 26.248 .329 Higher Proficiency Score 5254 134.67 18.647 .257
SOCIALDESIRABILITY Lower Proficiency Score 6381 44.75 7.790 .098 Higher Proficiency Score 5254 41.44 7.775 .107
a. Language = Zulu

279
Independent Samples Testa Levene's Test for
Equality of Variances t-test for Equality of Means
F Sig. t df Sig. (2-tailed)
Mean Difference
EXTRAVERSION
Equal variances assumed 4.304 .038 -3.210 11633 .001 -1.044
Equal variances not assumed
-3.227 11413.043 .001 -1.044
NEUROTICISM
Equal variances assumed 56.578 .000 31.404 11633 .000 10.701
Equal variances not assumed
31.793 11581.646 .000 10.701
CONSCIENTIOUSNESS
Equal variances assumed 24.373 .000 -
14.648 11633 .000 -5.783
Equal variances not assumed
-14.842 11593.968 .000 -5.783
OPENTOEXPERIENCE
Equal variances assumed 128.458 .000 -8.443 11633 .000 -2.716
Equal variances not assumed
-8.677 11531.047 .000 -2.716
AGREEABLENESS
Equal variances assumed 133.740 .000 -6.106 11633 .000 -2.631
Equal variances not assumed
-6.304 11397.452 .000 -2.631
SOCIALDESIRABILITY Equal variances assumed 2.973 .085 22.875 11633 .000 3.317
Independent Samples Testa t-test for Equality of Means
Std. Error Difference
95% Confidence Interval of the Difference
Lower Upper
EXTRAVERSION Equal variances assumed .325 -1.681 -.406 Equal variances not assumed .323 -1.678 -.410
NEUROTICISM Equal variances assumed .341 10.033 11.369 Equal variances not assumed .337 10.041 11.361
CONSCIENTIOUSNESS Equal variances assumed .395 -6.557 -5.010 Equal variances not assumed .390 -6.547 -5.020
OPENTOEXPERIENCE Equal variances assumed .322 -3.346 -2.085 Equal variances not assumed .313 -3.329 -2.102
AGREEABLENESS Equal variances assumed .431 -3.475 -1.786 Equal variances not assumed .417 -3.449 -1.813
SOCIALDESIRABILITY Equal variances assumed .145 3.032 3.601

280
Independent Samples Testa Levene's Test for
Equality of Variances t-test for Equality of Means
F Sig. t df Sig. (2-tailed)
Mean Difference
SOCIALDESIRABILITY Equal variances not assumed
22.879 11216.366 .000 3.317
Independent Samples Testa t-test for Equality of Means
Std. Error Difference
95% Confidence Interval of the Difference
Lower Upper SOCIALDESIRABILITY Equal variances not
assumed .145 3.033 3.601
a. Language = Zulu