Embed Size (px)
Citation preview

The impact of knowledge management on
customer journey
Joram Jansen
Student number: 11339799
University of Amsterdam, Faculty of Science
Thesis Master Information Studies: Business Information Systems
Final version: August 22, 2017
Supervisor: ir. A. M. Stolwijk
Examiner: dr. J. Brunner
Abstract. More and more organizations pay attention to their customers’
experiences. Many have been trying to measure customer experience resulting in a lot of data (Meyer & Schwager, 2007). The problem is that measuring customer
experience does not tell managers how to improve it. In this study, the following
question is central: How can Knowledge Management (KM) contribute to optimize the experiences (journey) of customers of service organizations? This research
makes clear that KM can be used for optimizing the customer journey. By
combining qualitative and quantitative research methods, a first step is taken in describing how service organizations can use KM to do this. By combining customer
interviews, interviews at a marketing department and literature research, a customer
journey for service organizations is defined. This journey consists of 10 important touchpoints which are influenced by at least 44 factors. The importance of these
touchpoints and related factors is made clear by taking a survey (of 175 customers
of a service organization). Discussing the survey results with involved employees of the customer journey results in different, for management important, relations
between customer experiences and KM. One of the highlights is that customer
experience can be optimized by providing accessible technical self-service information to customers. Also, up-to-date and precise appointment related
information is important for customers. For front-office employees, the availability
of technical-, and customer information is found as contributive to optimize a customer journey. Another important outcome is that changing technical tacit
knowledge to more codified knowledge can lead to better customer experiences.
This study can help managers to improve their customer journeys.
Keywords. Customer Journey, Customer Experience, Customer Satisfaction,
Knowledge Management, Service Quality.
2
Table of contents
1. Introduction ......................................................................................................... 4
1.1. Customer Journey ......................................................................................... 4
1.2. Knowledge management ............................................................................... 4
1.3. Research objective ........................................................................................ 4
1.4. Research questions ........................................................................................ 5
2. Literature review .................................................................................................. 5
2.1. Service Design .............................................................................................. 6
2.2. Conceptual Framework ................................................................................. 6
2.3. Customer Experience and Customer Journey ............................................... 7
2.4. Customer Satisfaction ................................................................................... 7
2.5. Service Quality ............................................................................................. 8
2.6. Knowledge Management .............................................................................. 9
2.7. Customer experience and Knowledge management ..................................... 9
3. Methodology ...................................................................................................... 10
3.1. Open interviews with customers ................................................................. 10
3.2. Literature research ...................................................................................... 11
3.3. Open interviews service company .............................................................. 11
3.4. Analysing preliminary results ..................................................................... 11
3.5. Survey ......................................................................................................... 11
3.6. Analyzing survey results ............................................................................. 12
3.7. Semi structured interviews .......................................................................... 12
3.8. Customer Journey Mapping ........................................................................ 12
4. Results ............................................................................................................... 12
4.1. Customer Journey ....................................................................................... 13
4.1.1. Customer touchpoints .......................................................................... 13
4.2. Influencing factors ...................................................................................... 13
4.2.1. Search for contact- and self-service information ................................. 14
4.2.2. Report a malfunction ........................................................................... 14
4.2.3. Try to solve the malfunction itself ....................................................... 15
4.2.4. Make an appointment ........................................................................... 15
4.2.5. Receive an appointment confirmation ................................................. 16
4.2.6. Change the appointment by customer .................................................. 16
4.2.7. Change the appointment by the company ............................................ 16

3
4.2.8. The service appointment ...................................................................... 16
4.2.9. Make a follow-up appointment ............................................................ 17
4.2.10. Receive confirmation and optionally invoice .................................... 17
4.2.11. Payment ............................................................................................. 18
4.2.12. Communication afterwards ................................................................ 18
5. Discussion .......................................................................................................... 18
6. Conclusion ......................................................................................................... 19
References ............................................................................................................. 20
Appendix A: Customer perceptions of quality and customer satisfaction ............. 22
Appendix B: I-Space framework ........................................................................... 22
Appendix C: Customer Journey Mapping ............................................................. 23
Appendix D: Influencing factors of customer satisfaction .................................... 24
Appendix E: Homogenous subsets of the touchpoints ........................................... 25
Appendix F: Customer Journey Map ..................................................................... 25
4
1. Introduction
1.1. Customer Journey
We are entering - or have already entered - the experience economy (Nenonen et al.,
2008). Nowadays, creating a strong customer experience is an important leading
management objective (Lemon and Verhoef, 2016). A recent study by Accenture (2015)
shows that improving the customer experience received the most number one rankings
when executives were asked about their top priorities for the next 12 months. Currently,
organizational attention in customer management is mainly focused on customers’ value
creation for organizations. The focus is mainly on metrics such as customer lifetime
value (CLV) instead of value creation for customers (Kumar and Reinartz 2016; Lemon
and Verhoef, 2016).
Customers now interact with organizations through many touchpoints in multiple
channels and media (Verhoef et al., 2015). Their experiences are influenced by different
factors such as peer customers (Brynjolfsson et al., 2013), which results in a reduced
control of increasingly complicated customer journeys. The strongly increased potential
customer touchpoints and the reduced control of the experiences require organizations to
integrate different business functions to create positive customer experiences. Examples
of these are information technology (IT), service operations, logistics, marketing and
human resources. Overall, it has become more complicated for firms to create, attempt
to manage and control the journey of its customers (Edelman and Singer 2015; Lemon
and Verhoef, 2016).
1.2. Knowledge management
A concept that organizations can help to optimize their customers’ journeys is knowledge
management (KM). Davenport (1994) defined KM as “the process of capturing,
distributing, and effectively using knowledge”. A more specific and one of the most cited
definitions is created by the Gartner Group: “a discipline that promotes an integrated
approach to identify, capture, evaluate, retrieve, and share all of an enterprise's
information assets” (Duhon, 1998). Currently, KM is considered as one of the most
important management research issues (Serenko and Bontis, 2016). A reason for this is
that it can positively influence innovativeness, organizational competitiveness and
economic performance (Donate and Guadamillas, 2015, Serenko and Bontis, 2016).
1.3. Research objective
This study examines how KM can contribute to the optimization of customer journeys.
To get more detailed results, the research concentrates on the service industry. It is
plausible that especially in this kind of industry, each different customer requires specific
(technical and non-technical) knowledge. Service organizations, from a customer
perspective, can be divided in four quadrants (typologies) which show two opposites
(figure 1). First, incidental and frequent customer moments of contact. Second, free
available services and services which require switching costs. In literature, different
quadrants are used to specify service typologies or organizations (e.g. Gallouj, 2002).

5
The figure, used in this report is derived from a combination of these quadrants and is
used to generalize the results. This research focuses on service organizations which
require switching costs and which have incidental contact with customers. In this
research, attention will be given to organizations which offer service and maintenance.
The following definition of a service organization is used: an organization that offers
service and maintenance within a contract or warranty. Customers are defined as owners
of a service object which is serviced by a company.
Both concepts, customer journey and KM are discussed in literature extensively.
However, there is limited research done about the effects of them on each other. This
paper tries to gain better insight into the effects of using KM to influence customer
journeys by focusing on the service industry. One objective of this research is to collect
existing literature about these topics. Because the literature on this topic is limited, an
extension will be made by doing empirical research (interviews and a survey).
Figure 1. Typologies of service.
1.4. Research questions
This research aims to make clear the effect of KM on customer journeys in the service
industry. To give more insights in these effects, the following research question is
answered in this study: How can Knowledge Management contribute to optimize the
experiences (journey) of customers of service organizations?
To be able to answer this question, the following sub-questions are answered first:
• How does the journey look like for customers of service organizations?
• What experiences are important for customer satisfaction?
• How is knowledge and information managed, shared and used in the customer
journey of service organizations (front-/back office, service operations and
knowledge systems)?
• How can Knowledge Management optimize offered services?
2. Literature review
In order to answer the research questions, an extensive review of literature related to the
research questions is presented. First an explanation is given about Service Design.
Second a conceptual framework is provided which shows the concept related to the
6
research scope and their relations. Finally, the different concepts are explained and
discussd.
2.1. Service Design
In the last years, the traditional ‘product design thinking’ is strongly influenced by so
called ‘Service Design thinking’. This change has an impact on society, industry and
economy (Vargo & Lusch, 2008; Rodriguez & Peralta, 2014). The western world,
delivers mainly products which are brought on the market in a service oriented way
(Polaine et al., 2013). For example, most installation companies not only sell products,
they also offer contractual services. Organizations in all kind of industries acknowledge
the importance of ‘customer experience’ strategies to differentiate themselves from their
competitors. (Teixeira et al., 2012; Shaw & Ivens, 2005; Polaine et al., 2013; Tjeng et
al.,1999).
Service Design is a design discipline with the focus on offering the right customer
experience on the right moment. It helps organizations to positively influence their
customers’ experiences which can lead to a competitive advantage. The process to design
the customer experience of a service or product in advance is a recent development in
this field (Texeira et al., 2012; Bitner et al., 2008). In the Service Design discipline,
different visualization techniques are used to design and evaluate services (Segelstorm
et al., 2010). An important technique is customer journey mapping which will be
explained later is in this literature review.
2.2. Conceptual Framework
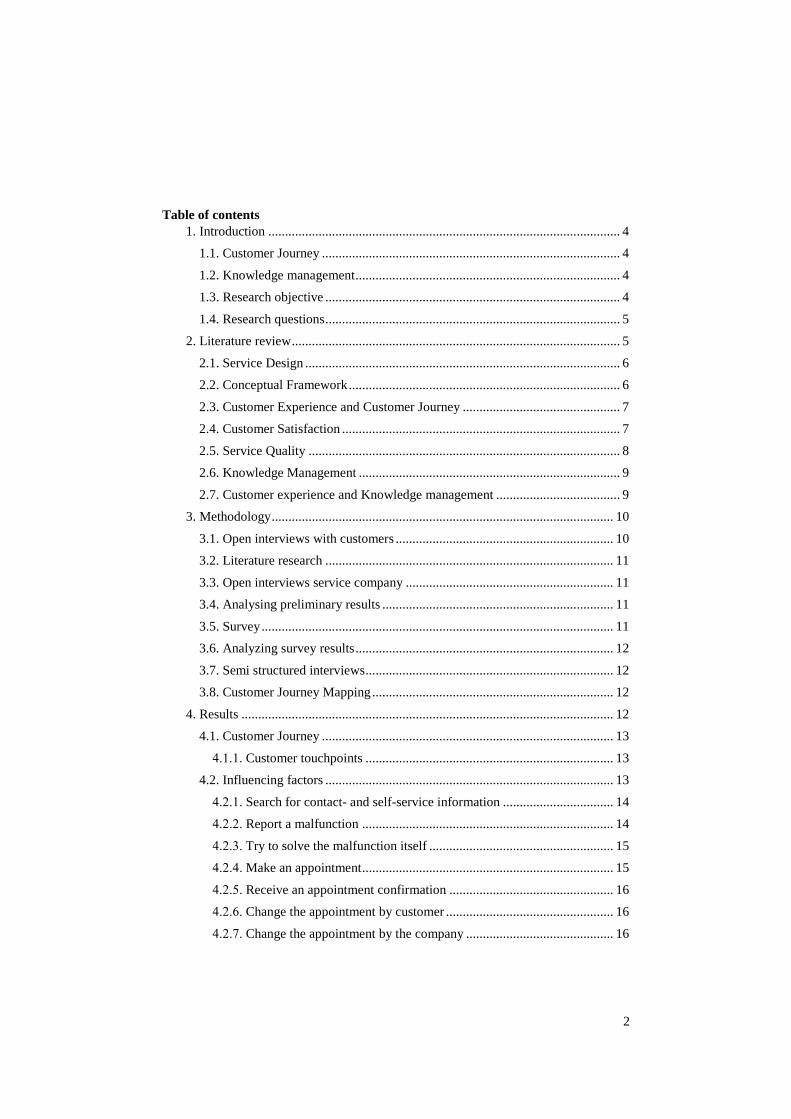
The conceptual framework, presented in this paragraph, shows the related concepts
to the study. The ‘equal to’ lines visualize the aspects that form the concepts customer
satisfaction and service quality. As discussed in this chapter, service quality impacts
customer satisfaction and customer experience. Customer Satisfaction is a key element
of customer experience which is shown with the single sided arrow. As later will be
defined, the customer journey is the collection of all touchpoints to reach a specific goal
for a customer. Thus, customer journey is a collection of different customer experiences.
The relation between these two concepts is showed with a two-sided arrow because
customer experience can be influenced by other experiences in the customer journey and
vice versa. The goal of this study is to investigate how Knowledge Management can help
optimizing customer experience (and thus the customer journey). For this reason, the
relationship with KM and these two concepts is shown with a one-sided arrow.

7
Figure 2. Conceptual Framework
2.3. Customer Experience and Customer Journey
Companies nowadays focus on creating customer loyalty and a competitive advantage
by creating favourable customer experiences (Badgett et al., 2007). Literature provide
multiple visions on, and definitions of customer experience. In their research, Pine and
Gilmore (1998) conceptualized the idea of experiences as distinct from goods and
services. They state that instead of buying a product or service, a consumer purchases an
experience to spend time enjoying a series of events that a company stages to engage
him in an inherently personal way. Other researchers add to this that every service
delivery, regardless from its nature and type, leads to a customer experience (Schmitt et
al., 2015). Gentile et al. (2007) define the concept as “a set of interactions between a
customer and a product, a company, or part of its organization, which provoke a reaction
which is strictly personal and implies the customer's involvement at different levels
(rational, emotional, sensorial, physical, and spiritual”. The definition of Meyer and
Schwager (2007) corresponds to this.
As stated by Gentile et al. (2007), customer experience consists of one or more
contacts between a customer and an organization or product. These moments of contact
are called touchpoints (Homburg et al., 2015; Rosenbaum et al., 2017). The collection of
all touchpoints to reach a specific goal for a customer is called a customer journey
(Rosenbaum et al., 2017). Literature provides different factors that influences customer
experience/journey (Jorritsma, 2010; Frow & Payne, 2007). A selection of these factors
are used to compile a list of influencing factors of the customer experience of service
organizations.
2.4. Customer Satisfaction
One key element of understanding and managing customer experience is the ability
to measure and monitor the reactions of customers to organization offerings (Lemon and
Verhoef, 2016). This can be described as customer satisfaction. Customer satisfaction
has drawn the interest of managers and academics for more than four decades because
they see that customers are one of the most important sources of organizations’ revenue

8
(Tam, 2004). Customers are always aiming to get maximum satisfaction from the
products or services that they buy (Tam, 2004). Satisfaction has been conceptualized as
a result from a comparison of customer expectations and the delivered performance
(Lemon and Verhoef, 2016). In line with this definition Churchill and Surprenant (1982)
recognize that satisfaction is a result of comparing what customers receive against to
what they give up to get a service. Other authors have a broader view, they see
satisfaction as an emotional feeling, resulting from evaluating a service (Westbrook,
1981). Like different other studies, in this paper a combination of both views is used to
define customer satisfaction: “an emotional response, that results from a cognitive
process of evaluating the service received against the costs of obtaining the service”
(Woodruff et al., 1991; Rust and Oliver, 1994; Tam, 2004).
Different researchers stated that factors such as (perceived) service quality, product
quality and pricing can affect customer satisfaction (Wilson et al., 2008; Agbor, 2011).
Wilson et al. (2008) provided a model that shows relevant factors of customer
satisfaction and their relationships (see appendix A); service quality, product quality,
pricing, a situational- and a personal factor. Because of the fact that the focus of this
study is specifically on service organizations, not all factors (i.e. product quality) are
relevant.
The National Business Research Institute (NBRI) also provided some relevant
dimensions to measure customer satisfaction: service quality, innocently, speed of
service, pricing, complaints or problems, trust in employees and the closeness of the
relationship with contacts in your firm (NBRI, 2009). Some of these dimensions
correspond with the model of Wilson et al. (2008).
2.5. Service Quality
Different researchers discovered an important relationship between service quality and
customer satisfaction (Meyer & Schwager, 2007; Tam, 2010; Agbor, 2011; Tavanazadeh
and Aligholi, 2014). Service quality is defined by different researchers as the extent to
which customer perceptions of service match with their expectations (Parasuraman,
1988; Zeithaml et al., 1990). Thus, service quality can intend how customers are served
in an organization which is important for organizations (see paragraph 2.4).
One of the most used measurements of service quality is the SERVQUAL model by
Parasuraman et al. (1985). In this model, 97 attributes are identified which have an
impact on service quality. These attributes were condensed into ten dimensions which
are later, because of corresponding ones, grouped in five dimensions (Parasuraman et al.,
1988). The dimensions are important to access customer’s expectations and perceptions
on delivered services (Agbor, 2011; Kumar, 2009). The five dimensions are listed below:
• Tangibility: physical facilities, equipment, and appearance of personnel
• Reliability: ability to perform the promised service dependably and accurately
• Responsiveness: willingness to help customers and provide prompt service
• Assurance: knowledge and courtesy of employees and their ability to inspire
trust and Confidence
• Empathy: caring individualized attention the firm provides to its customers
Kang en Bradley (2002) argued that customers are well able to perceive and estimate the
quality of an information service. Although confusion between the expected and the
adequate quality can lead to ambiguity (De Vries, Kasper and Van Helsdingen, 1999),

9
this research focuses only on the desired service. This prevents the potential disadvantage.
The dimensions and attributes of the model are used to make survey questions to study
influencers of the satisfaction and experience of service organizations’ customers.
2.6. Knowledge Management
Weggeman (2000) defined knowledge as “the, partly unconscious, ability that allow
people to perform certain tasks”. This is a combination of explicit knowledge, which is
knowledge that is noticeable, stored and not dependent on people (information). and
explicit knowledge which is personal knowledge and therefore more difficult to share
(experience, skills and attitude). In this report, the definition of Duhon (1998) is used: “
a discipline that promotes an integrated approach to identify, capture, evaluate, retrieve,
and share all of an enterprise's information assets”. According to Duon, these assets may
include databases, documents, policies, procedures, and previously un-captured expertise
and experience in individual workers.
Boisot (1999) believes that knowledge and information flows can be divided into
the degree of structure and to its degree of diffusion. He argues that these are positively
correlated, the more information is structured, the faster and more extensively it can be
shared. Tacit knowledge (low codification) flows very slowly between employees and
often only in face-to-face situations. Codified knowledge, by contrast, can diffuse rapidly
throughout a population. In line with this vision, Boisot (1999) developed the
Information Space framework (I-space framework) which represents the degree of
structure of knowledge (abstraction and codification) to its diffusion within a population
of agents. The framework can help organizations in assessing how its knowledge is
currently being structured and shared. A more detailed description of the framework is
provided in Appendix B.
2.7. Customer experience and Knowledge management
Different authors described relationships between KM and customer satisfaction (or
related concepts i.e. service quality). In this paragraph, these relations are discussed.
KM can improve customer satisfaction through self-service capabilities. By offering
self-service tools, for example a FAQ page on the website of an organization can
eliminate the need to speak directly with an employee. This helps customers to rapidly
find the information they want. According to an international survey in different
industries conducted by Van Belleghem (2013), 70% of consumers expect a self-service
option for handling questions and complaints. This indicates a relationship between KM
and customer experience.
Skarzynski (2016) argues that KM impacts the efficiency of customer service of
organizations. KM makes it possible to handle questions and service requests faster than
without KM. This positively affects customer experience.
Maoz (2016) describes that ineffective KM can lead to a reduced productivity and
poor customer satisfaction for organizations. He describes that an improved delivery of
contextual knowledge to employees or customers reduces the time to answer. Effective
KM can lead to more informed and knowledgeable internal and external customers which
has a positive effect on the customer experience.

10
3. Methodology
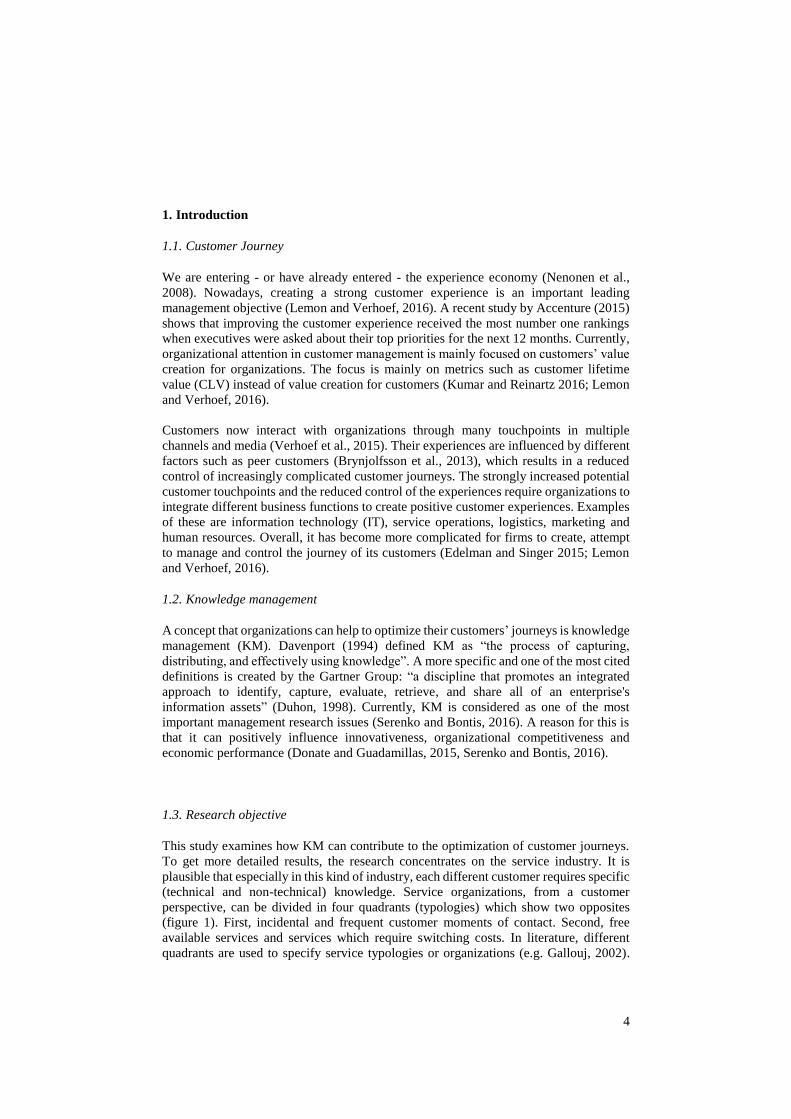
In order to answer the research questions, a combination of qualitive and quantitative
research methods was used. According to Gable (1994), “combining the main strength
of survey research (generalizability/external validity) with the main strength of case
studies (discoverability) can yield a superior piece of research”. Figure 3 visualizes the
research process, in this chapter the different used methods are explained.
Figure 3. Schematic representation of the process
For this research, a case study was done at Feenstra, one of the biggest service
companies in the Netherlands. The biggest and most important division of the company
is the one that services heating systems. To scope the research and to find useful and
comparable data, this study only focused on this division. The scope was further specified
by only focussing on B2C customers who own a heating system. Only the malfunction
solving process was considered. This specification was done because otherwise the data
was not well comparable. Within the focus group, customers can have a contract type A
(cheaper, but only labour and travel costs are included) or a contract type B (more
expensive, but all possible costs are included). In this research, customers with both
contracts were included.
3.1. Open interviews with customers
To define the different touchpoints in the customer journey, two open interviews
were done with a senior marketer and a business analyst at Feenstra. Because measuring
human feelings can be difficult, different researchers argue that the best way to know
how customers feel and what they want is to ask them (Levy, 2009; Agbor, 2011). Open
interviews allow the researcher to understand respondents´ perception of their experience
as an interpreter (Sofaer, 1999). As input for these interviews, a draft with touchpoints,
based on the experiences of the researcher was presented. After discussing these
touchpoints, a first version of the customer journey map (CJM) was made. A more
specific description of the customer journey mapping method is provided in appendix C.

11
3.2. Literature research
To find a list of influencing factors of the touchpoints, literature research was done
about related concepts. Especially attention was given to the way that these concepts can
influence each other. Examples of relevant keywords used to search in literature
databases (e.g. Ebsco and Catalogue Plus) were knowledge management, customer
journey, customer experience and service quality. The found determinants and attributes
were used to compile a list of influencing factors of the customer experience in the
service industry.
3.3. Open interviews service company
Next to the literature study, 5 open interviews were done with customers in different
age groups (21,35,58, 74 and 86). The different touchpoints were explained to the
customers and there was asked what they find important during these moments. First, the
questions were asked without showing the previously collected factors, but when
customers experienced difficulties with considering factors, examples were given.
3.4. Analysing preliminary results
Combining the found factors and dimensions with the outcomes of the interviews
and the literature review resulted in a list of 65 customer experience influencers, sorted
by moment of contact. Before testing the factors, the list was analyzed and discussed
again with a senior marketer from Feenstra. After discussing, the list was shortened to
prevent a too long survey (with negative effects on the response). After removing
irrelevant factors to KM (e.g. the clothing of the mechanics and their politeness), the list
had a total of 44 influencing factors (see appendix D).
3.5. Survey
To test the importance of the factors, a survey was set up. For each touchpoint, a
matrix question with associated factors was made. Also, a question was added to test the
importance of the different touchpoints. For the questions about the factors a variant of
the Likert scale was used (see paragraph 4.2). For the used scale was chosen to prevent
that respondents only answer ‘very important’.
The survey was designed and was taken in the online survey designing platform
SurveyMonkey. This platform was chosen because SurveyMonkey offers many
possibilities in designing a survey and analyzing the results. First the survey was tested
by sending it to 25 test respondents (Feenstra employees, and other selected people).
After testing, the formulation of some questions was changed. The final version of the
survey was sent by e-mail to 1.000 randomly selected customers with contract type A
and 1.000 randomly selected customers with contract type B. The survey was sent on
Tuesday evening, the for this survey optimal moment (Checkmaret, 2017). To reach the
highest number of respondents possible with the available resources, 4 gift cards were
given to randomly selected respondents and a reminder was sent. The response was 175
people which is 8,75%.

12
3.6. Analyzing survey results
The results were analyzed separately in SPSS. For each question, a ‘one-way
ANOVA’ test was performed to measure if the factors or touchpoints differed
significantly from each other. For the questions for which the ‘one-way ANOVA’
showed significant differences, a post-hoc test was used to localize the differences (Field,
2009). To measure the effect size of the measured differences, Partial Eta Squared was
calculated. The Partial Eta Squared was calculated to gain insight into the effect size of
the found differences. Hereby Cohen’s rule of thumb was used: .02(small effect
size), .13(medium effect size) and .26(large effect size) (De Vocht, 2013).
3.7. Semi structured interviews
After analyzing the survey results, all involved people in the customer journey were
listed and discussed with a business analyst from Feenstra. For every direct role in the
customer journey, a Feenstra employee was interviewed (telephone operator, web care
employee, planner, marketer, engineer and administrative worker). The goal of this
round of interviews was to investigate the information and knowledge needed during
every step in the customer journey. This information was used for making a CJM.
Another goal of the interviews was to investigate how KM can contribute to optimize the
customer experience at the different touchpoints. To reach these goals, an in-depth, semi-
structured with open-ended questions interview was most appropriate. In-depth
interviews contain open-ended questions and follow-up probes to obtain an in-depth
understanding of participants’ experiences, perceptions, opinions, feelings, and
knowledge (Rosenthal, 2016). During the interviews, the results of the survey were
presented. After transcribing the interviews, the interviews were coded to relate KM
statements to the touchpoints. The different factors related to the touchpoints were used
as a code. Other interview questions for these semi-structured interviews were based on
the I-Space framework (Boisot, 1999) which is discussed in appendix B.
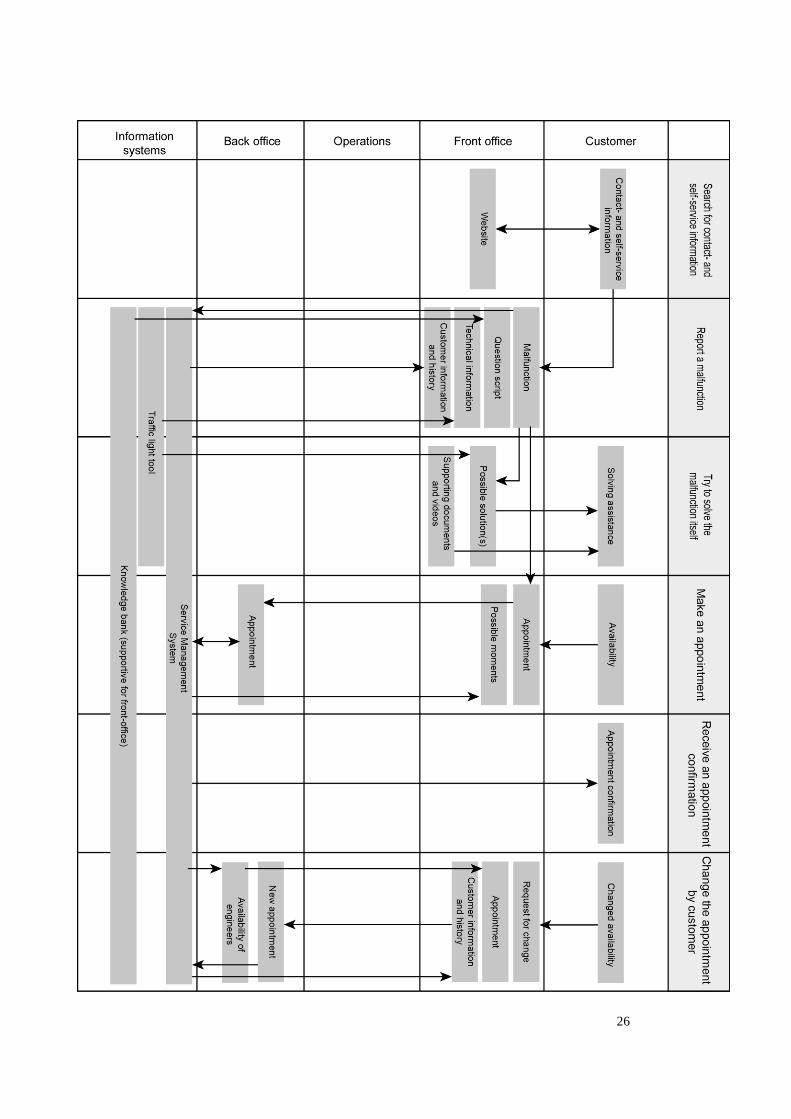
3.8. Customer Journey Mapping
Customer Journey Mapping (CJM) was used to visualize the information and knowledge
flows in the defined customer journey. The created CJM was used (see appendix F) to
understand the organization’s customer experience better and to determine the
importance of KM in this process. In the column ‘customer’, not only the information
and knowledge is shown, but also the physical evidence of the services. This is what a
customer receives after purchasing a service.
4. Results
In the first paragraph of this chapter (paragraph 4.1), the created customer journey is
shown. In addition to this, an analysis of the different touchpoints related to the journey
is given. For each touchpoint, different influencers (factors) of customer experience are
defined. In paragraph 4.2 for each touchpoint, the most important factors are described
according to the survey results.
13
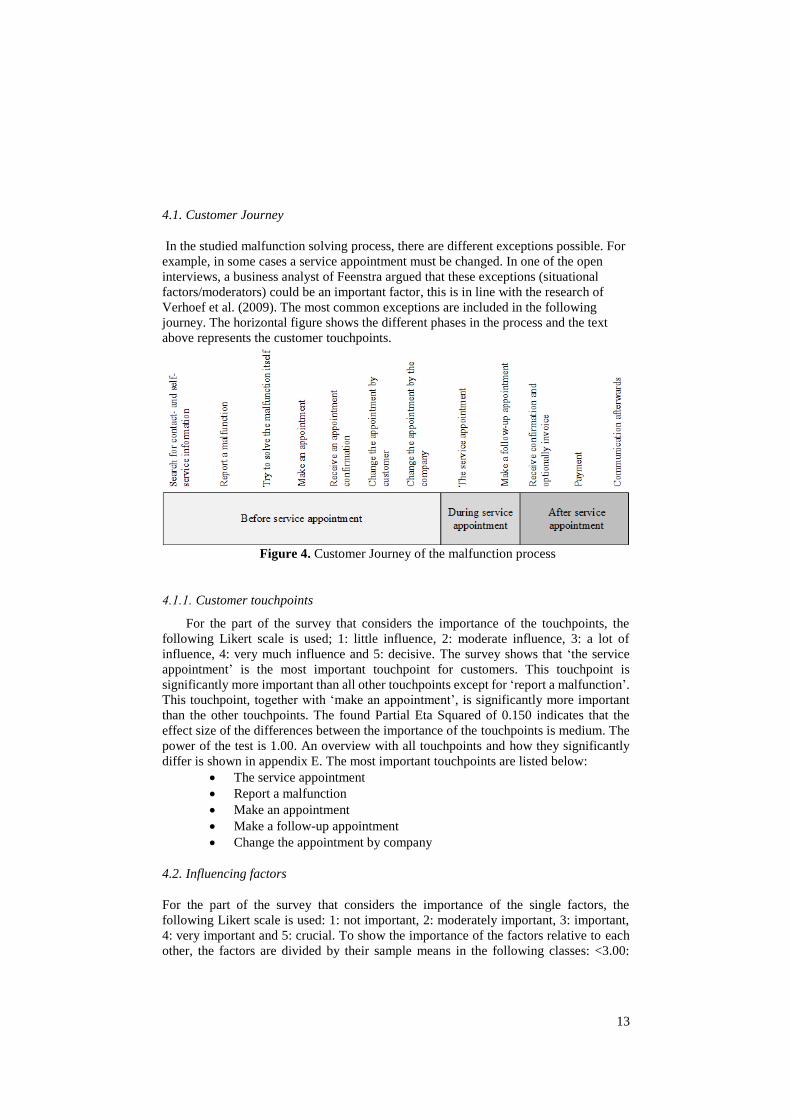
4.1. Customer Journey
In the studied malfunction solving process, there are different exceptions possible. For
example, in some cases a service appointment must be changed. In one of the open
interviews, a business analyst of Feenstra argued that these exceptions (situational
factors/moderators) could be an important factor, this is in line with the research of
Verhoef et al. (2009). The most common exceptions are included in the following
journey. The horizontal figure shows the different phases in the process and the text
above represents the customer touchpoints.
Figure 4. Customer Journey of the malfunction process
4.1.1. Customer touchpoints
For the part of the survey that considers the importance of the touchpoints, the
following Likert scale is used; 1: little influence, 2: moderate influence, 3: a lot of
influence, 4: very much influence and 5: decisive. The survey shows that ‘the service
appointment’ is the most important touchpoint for customers. This touchpoint is
significantly more important than all other touchpoints except for ‘report a malfunction’.
This touchpoint, together with ‘make an appointment’, is significantly more important
than the other touchpoints. The found Partial Eta Squared of 0.150 indicates that the
effect size of the differences between the importance of the touchpoints is medium. The
power of the test is 1.00. An overview with all touchpoints and how they significantly
differ is shown in appendix E. The most important touchpoints are listed below:
• The service appointment
• Report a malfunction
• Make an appointment
• Make a follow-up appointment
• Change the appointment by company
4.2. Influencing factors
For the part of the survey that considers the importance of the single factors, the
following Likert scale is used: 1: not important, 2: moderately important, 3: important,
4: very important and 5: crucial. To show the importance of the factors relative to each
other, the factors are divided by their sample means in the following classes: <3.00:
14
somewhat important (20% least important factors), => 3.00 and <3.72: medium
important and =>3.72: highly important (20% most important factors). An overview of
the found factors and their importance is shown in appendix D.
4.2.1. Search for contact- and self-service information
The ANOVA and post-hoc tests indicate that it is significantly most important that
customers can find organization’s contact information in an easy way. Relative to all
other factors, this factor is highly important. The possibility to choose a communication
channel and the availability of self-service information are significantly less important.
Both factors do not significantly differ from each other and are indicated as medium
important. The Partial Eta Squared of 0.184 indicates a medium effect size. This means
that differences between the factors differ moderately. The power of the test is 1.00.
In the interviews, no direct relations with KM are given. However, the interviewed
business analyst argued the importance of a ‘contact us’ page to provide an overview of
all supported communication channels. This is in line with Matthew (2015). When firms
store all used contact information of customers, KM can be used to recognize customers
during upcoming service requests. In this situation, customers can be helped faster which
positively affects their experiences.
4.2.2. Report a malfunction
The most important factor within this moment of contact is a well-accessible customer
service with minimal waiting times. This factor is significantly more important than all
other factors within this touchpoint and relative to all other factors, the factor is highly
important. The factor of directly coming into contact with the right person and the factor
about technical-, product- and customer related knowledge of the customer service
employee are significantly less important. The last two discussed factors are indicated as
medium important. The found Partial Eta Squared of 0.135 indicates that the effect size
of the differences between the importance of the touchpoints is medium. This means that
the factors, related to this touchpoint, differ moderately from each other. The power of
the test is 1.00.
During the interview with the telephone operator, she emphasized that waiting times
can be minimized by making available self-service information for customers. According
to the interviewed business analyst, the number of incoming service requests was
reduced since simple technical knowledge is available via a tool on the website. In this
tool, customers can search on fault codes. He added, using self-service information
positively affects customer experience because of shorter waiting times.
The telephone operator also discussed another KM solution to optimize customer
experience: a tool that provides technical knowledge to customer service employees.
Based on object types and fault codes, the tool shows possible solutions for customers
and other relevant information such as images of the service objects. Having this
information has positive effects on the efficiency of phone calls. The interviewee adds
that using a knowledge bank with question scripts and other training information
combined with the described tool, helps telephone operators with rapidly locating
problems and formulating them clearly for engineers.
An outcome of the interview with the web-care employee is that managing and
sharing information about customer contacts can also contribute to an optimized
customer experience. She emphasized that it is important that all front-office employees
see both social media contact and other customer history (i.e. by phone or service visits).
15
According to her, using different systems with different user rights to see information,
leads to irritated customers (because of ignorant employees) and inefficient contacts. The
telephone operator agreed to this and added that automatically identifying customers by
their phone number also leads to fewer necessary questions (about their identity etc.) and
thus less irritated customers and more efficient phone calls (see paragraph 4.2.1).
4.2.3. Try to solve the malfunction itself
Within this touchpoint, customers find it significantly most important that
employees know exactly how their heating system looks like and where all buttons are
located. Also getting personal assistance is indicated as highly important. Both factors
are indicated as medium important. The found Partial Eta Squared of 0.115 indicates that
the effect size of the found differences is small. This means that the factors, related to
this touchpoint, differ little from each other. The power of the test is 1.00.
As described in paragraph 4.2.2, a tool with technical knowledge for customer
service employees which contains information and images of the service objects, can
positively influence the most important factor of this moment of contact: the technical
knowledge of customer service employees.
4.2.4. Make an appointment
Within this touchpoint, customers find it most important that an engineer will be on
location the same day or maximum one day later. This factor is indicated as one of the
most important factors in this study. Receiving a cost indication and getting a precise
time indication for the appointment (maximum blocks of three hours) are significant
more important than other factors but less important than the first discussed one. Also,
the possibility of making an appointment during the first moment of contact is one of the
most important factors of this test. The last three factors are, relative to all other factors,
indicated as medium important. The found Partial Eta Squared of 0.130 indicates that the
effect size of the found differences is medium. This means that the factors, related to this
touchpoint, differ moderately from each other. The power of the test is 1.00.
The interview with a planner and telephone operator made clear that it is not possible
to give a precise cost indication before the service appointment has taken place. It is not
possible to know exactly what the problem is before an engineer has analyzed it. This
makes giving a cost indication at this moment unreliable and not relevant. However, it is
possible to inform customers about their contract conditions (what costs are included and
what costs not). According to the interviewees, this also affects the customer experience
positively. For this reason, it is important that the front office employee can easily see
the customer’s contract terms when making an appointment.
As described above, an important factor is receiving a precise time indication for an
appointment. According to the planner, appointments are made in blocks of a few hours
because it is difficult to predict how long an appointment will take place. According to
the interviewed engineer, KM can be used to optimize this. For example, it is clear that
many morning appointments take place at the end of the morning. Making this
information insightful for customers will have a positive impact on their experience.
These customers don’t have to stay at home the first hours of an agreed appointment
block.
According to the interviews it is important to include all engineers in a central
planning instead of creating separate ones for each region. KM can be used to consider
the skills and knowledge of engineers, the material in their vans, and their location to

16
make a more flexible and efficient planning. In this way, KM can help to make fast
appointments and to give more precise time indications.
4.2.5. Receive an appointment confirmation
The studied factors within this touchpoint differ significantly from each other.
Customers find receiving an appointment confirmation more important than the
availability of information about the engineer. Relative to the other factors, receiving the
confirmation is indicated as medium important. Providing the engineer’s name and photo
is indicated as somewhat important. The found Partial Eta Squared of 0.197 indicates
that the effect size of the found differences is medium. This means that the factors, related
to this touchpoint, differ moderately from each other. The power of the test is 1.00.
According to the telephone operator, sending an appointment confirmation is a good
method to share all relevant information about an appointment. This will prevent
miscommunication about service appointments.
4.2.6. Change the appointment by customer
Within this touchpoint, two factors are studied which differ significantly from each
other. When changing an appointment, for customers the most important factor is that it
is possible to change their appointment at all times without costs. This factor is indicated
as medium important. Less important than this is to let customers choose which
communication channel they use when changing their appointment which is indicated as
somewhat important. The found Partial Eta Squared of 0.068 indicates that the effect size
of the found differences is small. This means that the factors, related to this touchpoint,
differ little from each other. The power of the test is 0.997.
For this moment of contact, the same KM related suggestions are relevant as
described in paragraph 4.2.4. In the interviews, no specific suggestions were given about
changing an appointment.
4.2.7. Change the appointment by the company
Focusing on changing an appointment, respondents find it most important that they
are informed directly when an appointment has to be changed and that it is possible to
directly make a new appointment. Both factors belong to the most important factors of
the study, the other two factors are indicated as medium important. Because of the Partial
Eta Squared of 0.131, the effect size of the differences is medium. This means that the
factors, related to this touchpoint, differ moderately from each other. The power of the
test is 1.00.
Also for this moment of contact, the same suggestions given in paragraph 4.2.4 are
relevant. According to the interviewed planner, for this touchpoint it is extra important
that customers are contacted as quickly as possible. This is in line with the survey results.
When calling, the planner has to have access to customer information, customer history
and the availability of the engineers to be able to directly make a new appointment (see
CJM appendix F).
4.2.8. The service appointment
For the service appointment, the most important factor is that the engineer acts
professional. Significantly less important is that the malfunction is fixed during the first
appointment. However, both factors are still indicated as highly important. The factor
17
about being on time and receiving a message fifteen minutes before arriving are
significantly less important and indicated as medium important. The effect size of the
differences is large when looking to the Partial Eta Squared of 0.453. This means that
the factors, related to this touchpoint, differ greatly from each other. The power of this
test is 1.000.
As described above, customers find it the most important that the engineer acts
professional. The interviews with the engineer and the business analyst make clear that
when engineers need technical information or help on location, in most of the times they
call each other. The open interviews with customers show that this has a negative effect
on their professionality because it looks like the engineer does not have enough skills
and/or knowledge. By providing technical information to engineers via a knowledge
system, the number of phone calls can be reduced and engineers look more professional.
A KM related suggestion to optimize the first-time-fix percentage of malfunctions
was given by the interviewed planner. The mainly reason that a malfunction cannot be
fixed during the first appointment is the absence of needed parts of service objects. To
reduce the number of these cases, it is important to compare the stock parts of engineers
with the presumably broken ones. For this reason, planners need information about the
stock of the engineers and the type of the customer’s service object when making
appointments. The previously described supportive tool with technical knowledge
(paragraph 4.2.2) can be supportive for identifying presumably broken parts.
The engineer also argued that the availability of customer information and the
malfunction history of a specific service object enables him to predict what the problem
is more thoroughly (see CJM in appendix F). When having this information, he can
directly take the right material with him to fix the malfunction in an efficient way. Also,
the availability of product- and price information is necessary to give customers a cost
indication. Both affect customer experience positively.
4.2.9. Make a follow-up appointment
The two most important factors associated to the making of a follow-up appointment still
differ significantly from each other. Most important is the possibility to directly make
this appointment with an engineer. The less important factor is that the customer can
choose a moment for the appointment from different options. Both factors are indicated
as medium important relative to the other factors. The measured effect size is with an
Partial Eta Squared of 0.182 determined as medium which means that the factors, related
to this touchpoint, differ moderately from each other. The power of the test is 1.00.
Because customers find it most important to directly make a new appointment, it is
needed that the engineers have information about possible moments for appointments.
In his interview, the business analyst argued that engineers can be equipped with a
planning tool to make appointments independently instead of first contacting the
planning department. Thus, engineers act more professional.
4.2.10. Receive confirmation and optionally invoice
For this touchpoint, significantly most important is making clear what work has been
done. This factor is indicated as highly important. Showing how the total price is
calculated is significantly less important but still indicated as medium important. The
found Partial Eta Squared of 0.191 shows that the effect size of the found differences is
medium. This means that the factors, related to this touchpoint, differ moderately. The
power of the test is 1.00.
18
To reach an optimal customer experience at this point, it is important that engineers
describe their performed work and used materials correctly and upload this information
to the service management system directly. When this is described clearly, it is possible
to directly send a confirmation which shows the performed work, used parts and prices.
According to the survey results, this has a positive impact on the customer experience.
4.2.11. Payment
The different factors related to the payment do not differ significantly from each other.
The possibility to choose how to pay and the support of modern payment methods are
both indicated as medium important. The effect size of this test is medium with an Partial
Eta Squared of 0.127. This means that the factors, related to this touchpoint, differ
moderately from each other. The power of this test is 0.984.
According to the administrative employee, at this point of the journey it is
recommended that one single system is used for the registration and administration of
service appointments. When separate administration systems are used, a delay in the
communication between them (after finishing a case, it has to be synchronized first) can
cause problems. One of the problems is that it is not possible for customers to pay directly
after an appointment. This leads to limited payment possibilities.
The interviewee also argued that customers using an automatically direct debit,
commonly want to know at what time a payment is collected. Using a system that makes
this information insightful for customers and/or engineers leads to a better customer
experience.
4.2.12. Communication afterwards
Both factors about this touchpoint differ significantly. Receiving information about
discounts and tips is less important than receiving a request for feedback. Both factors
are indicated as somewhat important. The Partial Eta Squared of 0.060 indicates a small
effect size of this difference. This means that the factors, related to this touchpoint, differ
little from each other. The power of this test is 0.993.
According to the business analyst and the marketer, KM can be used to personalize e-
mails, advertisements, etc. based on the type and age of service objects for example.
However, the limited influence of this touchpoint and associated factors minimize the
effect on customer experience.
5. Discussion
From the previous chapter, it became clear that there are 44 KM related factors that can
influence the customer experience of service organizations. The different factors are
tested on importance using a survey of 175 respondents, which make this part of the
study robust. The power of all tests is around 1.00, which indicates that the chance of not
finding differences in the importance of the factors is nil.
According to Wilson et al. (2008), next to the found factors, customer satisfaction is
also influenced by a situational- and personal factor. Both factors are hard to include in
a model because they describe unforeseen circumstances. A factor affects the customer
experience more when something during a touchpoint goes wrong. Based on the
statistical part of the survey, the importance of factors in the most common situations

19
(which are situated in a single company) are considered. Future research at other
companies can give a general confirmation of this view.
To get clear conclusions, the scope of the study covers the most important- and
common touchpoints for the researched company. Examples of less important
touchpoints which can be optimized by using KM are handling (different kinds of)
questions at the customer service (Skarzynsk, 2016). To get a more complete overview
of the customer journey, other touchpoints can be researched in the future.
The results of the survey are discussed with involved employees of the customer
journey which are seen as experts of the processes because they are daily involved with
them. By doing this, it has become clear that KM can positively affect the customer
journey. Because of the fact that only one organization is in the scope, in future work,
interviews with more technical KM experts (from other organizations) can possibly make
clear the existence of new relations. It is recommended to focus on the organizations
discussed in paragraph 1.3 (figure 1) first. Because these organizations have similar
characteristics, it is plausible that the different results can be generalized.
The study makes clear that organizations can use KM to improve their customer
journey. Suggestions to do this are given. The extent to which the different suggestions
affect the journey can be studied in new research.
6. Conclusion
This study shows that the customer journey of solving malfunctions at service
organizations can consist of 10 moments of contact (touchpoints). Based on the survey,
it can be concluded that the customer experience in the researched company is most
influenced by the following moments of contact: the service appointment, reporting a
malfunction, making an (follow-up) appointment and changing an appointment by the
company.
Combining customer interviews, interviews at a marketing department and literature
research, resulted in a list of 44 factors which influence customer experience at the
different touchpoints. A survey is used to categorize the factors on importance. Because
the most important factors are covered in the most important touchpoints, it can be
concluded that these results strengthen each other. By discussing the tested factors with
the interviewed experts, different relations with KM are found. The interviews make
clear that providing accessible self-service information to customers can have a positive
effect on customer experience. Problems can be fixed rapidly, and waiting times can be
reduced. These results are in line with Van Belleghem (2013).
Other interviews show the importance of the availability of usable technical
information and customer contact information for front-office employees. This can lead
to an efficient handling of service requests which affects customer experience.
Another interview showed the importance of continuous monitoring planning(s) and
providing up-to-date and precise information about appointments to customers.
The survey shows that customers find it highly important that engineers act
professionally. Changing tacit technical knowledge to more codified knowledge, leads
to a more rapid diffusion of knowledge between engineers (Boisot, 1999). This can result
in more professional services which improve the customer experience.
A final found relation is that using an overall system, instead of different smaller
systems, could prevent synchronization-delays and for example not supportive payment
20
methods. This also has an impact on the customer experience. These results show how
KM can contribute to the optimizing of the customer journey of service organizations.
References
Accenture (2015), “Improving Customer Experience Is Top Business Priority for Companies Pursuing Digital Transformation, According to Accenture Study,” news release, (October 27), [available at
https://newsroom.accenture.com/news/improvingcustomer-experience-is-top-business-priority-
for-companiespursuing-digital-transformation-according-to-accenture-study.htm]. Agbor, J. M. (2011). The Relationship between Customer Satisfaction and Service Quality: a study of three
Service sectors in Umeå.
Badgett, M., Boyce, M. S., & Kleinberger, H. (2007). Turning shoppers into advocates. IBM Institute for Business Value, 35(3), 352-369.
Boisot, M., & Cox, B. (1999). The I-Space: a framework for analyzing the evolution of social computing.
Technovation, 525-536. Boxer, P. J. (2006) Managing over the whole Governance Cycle. Asymmetric Design.
Brynjolfsson, E., Hu, Y. J., & Rahman, M. S. (2013). Competing in the age of omnichannel retailing. MIT
Sloan Management Review, 54(4), 23. Buttle, F. (1996). SERVQUAL: review, critique, research agenda. European Journal of marketing, 30(1), 8-32.
Checkmarket (2017), Wanneer kan je best je enquête versturen? “”, [available at https://nl.checkmarket.com/
blog/beste-moment-enquete-versturen/]. Child, J., Ihrig, M., & Merali, Y. (2014). Organization as information–A space odyssey. Organization Studies,
35(6), 801-824.
Churchill Jr, G. A., & Surprenant, C. (1982). An investigation into the determinants of customer satisfaction.
Journal of marketing research, 491-504.
Cronin Jr, J. J., & Taylor, S. A. (1994). SERVPERF versus SERVQUAL: reconciling performance-based and
perceptions-minus-expectations measurement of service quality. The Journal of Marketing, 125-131.
Dasu, S., & Chase, R. B. (2010). Designing the soft side of customer service. MIT Sloan Management Review,
52(1), 33. Davenport, T. H. (1994). Saving IT's soul: Human-centered information management. Harvard business review,
72(2), 119-31.
De Vocht, A. (2013). Basishandboek SPSS 21, IBM SPSS Statistics. Donate, M. J., & Guadamillas, F. (2015). An empirical study on the relationships between knowledge
management, knowledge-oriented human resource practices and innovation. Knowledge
management research & practice, 13(2), 134-148. Duhon, B. (1998). It's all in our heads. Inform, 12(8), 8-13.
Edelman, D. C., & Singer, M. (2015). Competing on customer journeys. Harvard Business Review, 93(11),
88-100. Elzinga, D., Mulder, S., & Vetvik, O. J. (2009). The consumer decision journey. McKinsey Quarterly, 3, 96-
107. Field, A. (2009). Discovering statistics using SPSS. Sage publications.
Frow, P., & Payne, A. (2007). Towards the ‘perfect’customer experience. Journal of Brand Management, 15(2),
89-101. Gable, Guy G (1994) Integrating case study and survey research methods: an example in information
systems. European Journal of Information Systems 3(2):pp. 112-126.
Gallouj, F. (2002). Innovation in the service economy: the new wealth of nations. Edward Elgar Publishing. Gentile, C., Spiller, N., & Noci, G. (2007). How to sustain the customer experience:: An overview of experience
components that co-create value with the customer. European Management Journal, 25(5), 395-410.
Girard, J., & Girard, J. (2015). Defining knowledge management: Toward an applied compendium. Online Journal of Applied Knowledge Management, 3 (1), 1, 20.
Homburg, C., Jozić, D., & Kuehnl, C. (2015). Customer experience management: toward implementing an
evolving marketing concept. Journal of the Academy of Marketing Science, 45(3), 377-401. Jorritsma, A. (2010). TNT gaat op klantreis om tevredenheid te meten. Logistiek, Maart, 12-13.
Kang, H., & Bradley, G. (2002). Measuring the performance of IT services: An assessment of SERVQUAL.
International Journal of Accounting Information Systems, 3(3), 151-164. Maoz, M. (2016). Knowledge Management Will Transform CRM Customer Service. Gartner Research.
21
Matthew, J. (2015), “Tips to Present Contact Information to Satisfy Consumers AND Search Engines” news
release, (January 26), [available at https://www.linkedin.com/pulse/tips-present-contact-
information-satisfy-consumers-search-matthew]. Meyer, C., & Schwager, A. (2007). Understanding Customer Experience. Harvard business review, 1-11.
Nenonen, S., Rasila, H., Junnonen, J. M., & Kärnä, S. (2008). Customer Journey–a method to investigate user
experience. In Proceedings of the Euro FM Conference Manchester (pp. 54-63). Kasper, H., Van Helsdingen, P., & de Vries Jr, W. (1999). Services marketing management: An international
perspective. Wiley.
Koenig, M. E. (2012). What is KM? Knowledge management explained. KM World. Viitattu, 10, 2014.
Kumar, M., Tat Kee, F., & Taap Manshor, A. (2009). Determining the relative importance of critical factors in
delivering service quality of banks: an application of dominance analysis in SERVQUAL model.
Managing Service Quality: An International Journal, 19(2), 211-228. Kumar, V., Venkatesan, R., & Reinartz, W. (2006). Knowing what to sell, when, and to whom. Harvard
business review, 84(3), 131-137. Lemon, K. N., & Verhoef, P. C. (2016). Understanding customer experience throughout the customer journey.
Journal of Marketing, 80(6), 69-96.
Leong, L. C. (2005). Complexity, bureaucracy and the inforrmation space. Ethos, 11(3), 7-11. Lingqvist, O., Plotkin, C. L., & Stanley, J. (2015). Do you really understand how your business customers buy.
McKinsey Quarterly, 1, 74-85.
Parasuraman, A., Zeithaml, V. A., & Berry, L. L. (1985). A conceptual model of service quality and its implications for future research. the Journal of Marketing, 41-50.
Parasuraman, A., Zeithaml, V. A., & Berry, L. L. (1988). Servqual: A multiple-item scale for measuring
consumer perc. Journal of retailing, 64(1), 12. Parasuraman, A., Zeithaml, V. A., & Berry, L. L. (1994). Reassessment of expectations as a comparison
standard in measuring service quality: implications for further research. the Journal of Marketing,
111-124. Pine, B. J., & Gilmore, J. H. (1998). Welcome to the experience economy. Harvard business review, 76, 97-
105.
Rosenbaum, M. S., Otalora, M. L., & Ramírez, G. C. (2017). How to create a realistic customer journey map. Business Horizons, 60(1), 143-150.
Rust, R. T., & Oliver, R. L. (Eds.). (1993). Service quality: New directions in theory and practice. Sage
Publications. Saldaña, J. (2015). The coding manual for qualitative researchers. Sage.
Schmitt, B., Brakus, J. J., & Zarantonello, L. (2015). From experiential psychology to consumer experience. Journal of Consumer Psychology, 25(1), 166-171.
Serenko, A. and Bontis N. (2016). Negotiate, reciprocate, or cooperate? The impact of exchange modes on
inter-employee knowledge sharing. Journal of Knowledge Management, 20(4), 687-712. Serenko, A., Bontis, N., & Hull, E. (2016). An application of the knowledge management maturity model: the
case of credit unions. Knowledge Management Research & Practice, 14(3), 338-352.
Shaw, C., & Ivens, J. (2002). The seven philosophies of building great customer experiences. CUSTOMER MANAGEMENT, 10(6), 40-43.
Skarzynski, N. A. (2016). “How does knowledge management improve the quality of service for a company?”.
release (August 22). [available at https://www.quora.com/How-does-knowledge-management-improve-the-quality-of-service-for-a-company].
Sofaer, S. (1999). Qualitative Methods: What Are They and Why Use Them?. HSR: Health
Services Research, 34(5), 1101-1118. Tam, J. L. (2004). Customer satisfaction, service quality and perceived value: an integrative model. Journal of
marketing management, 20(7-8), 897-917.
Tavanazadeh, S., & Aligholi, M. (2014). Investigation of Relationship between Service Quality Dimensions and Customers' Satisfaction (Case study: Saderat Bank Branches in Tehran City, Iran).
Mediterranean Journal of Social Sciences, 5(20), 3116.
Van Belleghem, S. (2013). Why the future of customer service is self-service. Fast Company. Verhoef, P. C., Kannan, P. K., & Inman, J. J. (2015). From multi-channel retailing to omni-channel retailing:
introduction to the special issue on multi-channel retailing. Journal of retailing, 91(2), 174-181.
Verhoef, P. C., Lemon, K. N., Parasuraman, A., Roggeveen, A., Tsiros, M., & Schlesinger, L. A. (2009). Customer experience creation: Determinants, dynamics and management strategies. Journal of
retailing, 85(1), 31-41.
Weggeman, M. (2000) Kennismanagement: de praktijk, Scriptum, Schiedam. Westbrook, R. A. (1981). Sources of consumer satisfaction with retail outlets. Journal of retailing, 57(3), 68-
85.

22
Wilson A., Zeithaml V.A., Bitner M.J., Gremler D.D. (2008) Services Marketing, McGraw-Hill Education
Woodruff, R. B., Clemons, D. S., Schumann, D. W., Gardial, S. F., & Burns, M. J. (1991). The standards issue
in CS/D research: a historical perspective. Journal of Consumer Satisfaction, Dissatisfaction and Complaining Behavior, 4, 103-109.
Zeithaml, V. A., Parasuraman, A., & Berry, L. L. (1990). Delivering quality service: Balancing customer
perceptions and expectations. Simon and Schuster.
Appendix A: Customer perceptions of quality and customer satisfaction
Customer perceptions of quality and customer satisfaction (Wilson et al., 2008)
Appendix B: I-Space framework
Using the I-Space framework (Boisot, 1999) results in four types of knowledge (Boxer,
2006):
- Public knowledge, such as textbooks and newspapers, which is codified and
diffused.
- Proprietary knowledge, such as patents and official secrets, which is codified
but not diffused. Here barriers to diffusion have to be set up.
- Personal knowledge, such as biographical knowledge, which is neither
codified nor diffused.
- Common sense – i.e. what ‘everybody knows’, which is not codified but widely
diffused.
23
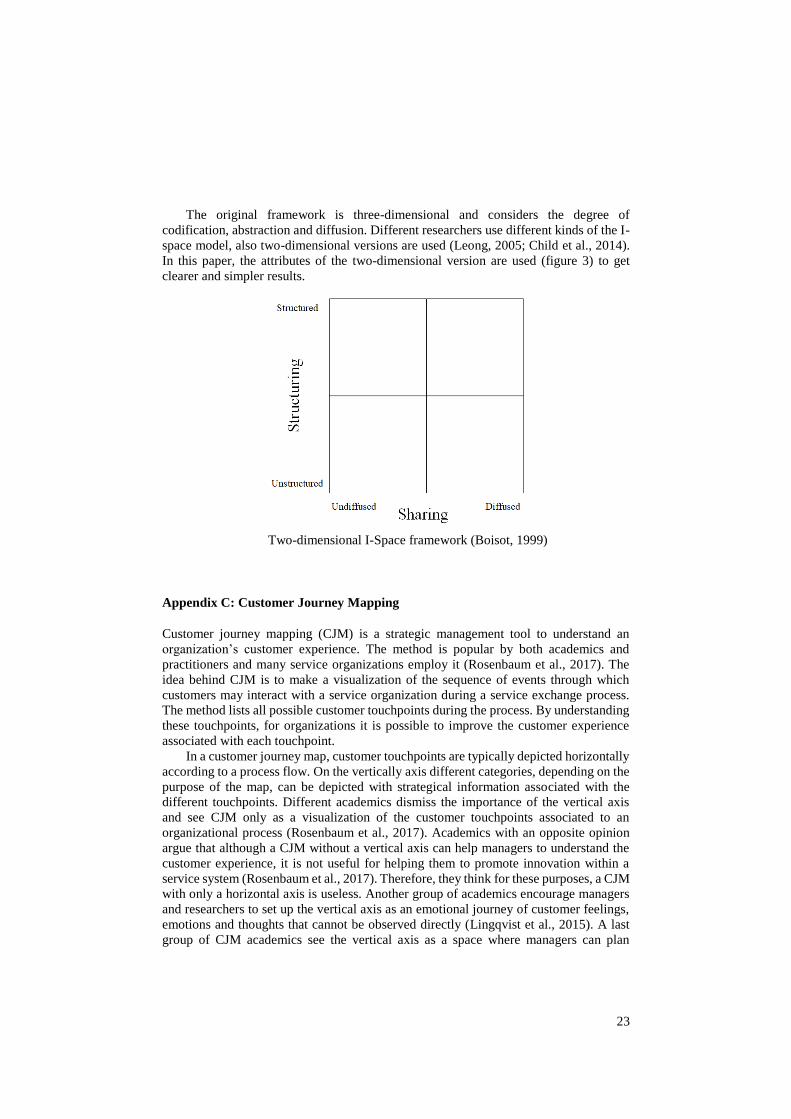
The original framework is three-dimensional and considers the degree of
codification, abstraction and diffusion. Different researchers use different kinds of the I-
space model, also two-dimensional versions are used (Leong, 2005; Child et al., 2014).
In this paper, the attributes of the two-dimensional version are used (figure 3) to get
clearer and simpler results.
Two-dimensional I-Space framework (Boisot, 1999)
Appendix C: Customer Journey Mapping
Customer journey mapping (CJM) is a strategic management tool to understand an
organization’s customer experience. The method is popular by both academics and
practitioners and many service organizations employ it (Rosenbaum et al., 2017). The
idea behind CJM is to make a visualization of the sequence of events through which
customers may interact with a service organization during a service exchange process.
The method lists all possible customer touchpoints during the process. By understanding
these touchpoints, for organizations it is possible to improve the customer experience
associated with each touchpoint.
In a customer journey map, customer touchpoints are typically depicted horizontally
according to a process flow. On the vertically axis different categories, depending on the
purpose of the map, can be depicted with strategical information associated with the
different touchpoints. Different academics dismiss the importance of the vertical axis
and see CJM only as a visualization of the customer touchpoints associated to an
organizational process (Rosenbaum et al., 2017). Academics with an opposite opinion
argue that although a CJM without a vertical axis can help managers to understand the
customer experience, it is not useful for helping them to promote innovation within a
service system (Rosenbaum et al., 2017). Therefore, they think for these purposes, a CJM
with only a horizontal axis is useless. Another group of academics encourage managers
and researchers to set up the vertical axis as an emotional journey of customer feelings,
emotions and thoughts that cannot be observed directly (Lingqvist et al., 2015). A last
group of CJM academics see the vertical axis as a space where managers can plan

24
activities such as design opportunities, customer objectives and employee tasks (Elzinga
et al., 2009; Dasu & Chase, 2010). Critics argue that this type of CJM expands vertically
and becomes more complex.
Organizations should regard the vertical axis of a customer journey map as
specifying the key components of the entire service system, showing how marketing,
human resources, operations, and information technology can work together to meet
customer expectations at every touchpoint (Bitner et al., 2008). In this paper, a version
of this specified CJM is used. Using customer, front-office, back-office, operation and
information-/knowledge systems the information flows that are needed during the
customer journey can be visualized. This visualization is used to discuss the importance
of KM in the customer journey. By doing so, the CJM process is inherently linked to the
service blueprinting process, another service innovation tool.
Appendix D: Influencing factors of customer satisfaction
# Factor Moment of contact Importance
1 Contact information is easy to find Search for contact- and self-service information
Highly important
2 The customer service is well accessible with minimal waiting
times
Report a malfunction Highly important
3 Receiving a cost indication with contact information Make an appointment Highly important
4 An engineer will be on location the same day or maximum one
day later
Make an appointment Highly important
5 Possibility to directly make a new appointment Change the appointment by the
company
Highly important
6 Company contacts customer directly about the change Change the appointment by the company
Highly important
7 The malfunction is fixed during the first appointment The service appointment Highly important
8 The Engineer acts professional The service appointment Highly important 9 It is possible to directly make a follow-up appointment with the
engineer
Make a follow-up appointment Highly important
10 It is clear how the total cost price is calculated Confirmation and invoicing Highly important 11 Self-service information is available Search for contact- and self-
service information
Medium important
12 Customer can choose communication channel Search for contact- and self-service information
Medium important
13 The customer service employee has enough technical knowledge
to analyze the problem
Report a malfunction Medium important
14 The customer service employee knows which type of service
object a customer has and the history of it
Report a malfunction Medium important
15 The customer speaks directly to the right person Report a malfunction Medium important 16 No menu when calling the company Report a malfunction Medium important
17 The customer service employee knows exactly how the service
object looks like and where are the buttons are located
Try to solve the malfunction itself Medium important
18 The customer gets personal guidance Try to solve the malfunction itself Medium important
19 Supporting documents and videos are available Try to solve the malfunction itself Medium important
20 Customer gets a precise time indication for the appointment Make an appointment Medium important 21 Making an appointment at night or during the weekend is
possible
Make an appointment Medium important
22 It is possible to make a possible during the first contact Make an appointment Medium important 23 It is possible to choose a moment from different options Make an appointment Medium important
24 Possible preparations for the customer are communicated clearly Make an appointment Medium important
25 Receive an appointment confirmation Receive an appointment confirmation
Medium important

25
26 It is possible to change an appointment without costs Change the appointment by
customer
Medium important
27 Company contact customer personally, without automatic messages
Change appointment by Company Medium important
28 The cause of the change is communicated clearly Change appointment by Company Medium important
29 The engineer is on time The service appointment Medium important 30 Possible to choose a moment from different options Make a follow-up appointment Medium important
31 The performed work is explained clearly Payment Medium important
32 Possible the choose the payment method Payment Medium important
33 Modern payment methods are supported (e.g. contactless paying
and iDeal)
Payment Medium important
34 Possible to pay directly or after the appointment Payment Medium important 35 Possible to choose which communication channel is used
(omnichannel)
Try to solve the malfunction itself Somewhat important
36 Get information about what work should be performed Make an appointment Somewhat important
37 Know which engineer is coming by name and photo Receive an appointment
confirmation
Somewhat important
38 Possible to choose which communication channel is used
(omnichannel)
Change the appointment by
customer
Somewhat important
39 Receive a message 15 minutes before the engineer arrives The service appointment Somewhat important 40 Engineer asks how the customer experienced the appointment The service appointment Somewhat important
41 For both appointments, the same engineer is deployed Make a follow-up appointment Somewhat important
42 Possible to choose to receive the invoice digital or hardcopy Receive confirmation and optionally invoice
Somewhat important
43 Company asks for feedback to improve her service Communication afterwards Somewhat important
44 Receive information about discounts and tips Communication afterwards Somewhat important
Appendix E: Homogenous subsets of the touchpoints
The following table shows the different touchpoints of the studied customer journey with
associated importance. The percentage represents the respondents that answered that the
touchpoint has a lot of influence on their satisfaction.
Touchpoint 1 2 3 4 5 =>3
Communication afterwards 2.68 54,36% Search for contact- and self-service
information
2.77 59,33%
Payment 2.80 2.80 74,66%
Receive an appointment confirmation 2.90 2.90 69,33%
Change the appointment by customer 2.90 2.90 70,00%
Try to solve the malfunction itself 2.92 2.92 70,66%
Receive confirmation and optionally invoice 2.93 2.93 2.93 67,78%
Change the appointment by the company 3.13 3.13 77.33% Make a follow-up appointment 3.27 3.27 84,00%
Make an appointment 3.49 93,33%
Report a malfunction 3.60 3.60 89,34% The service appointment 3.92 96,66%
Appendix F: Customer Journey Map
26

27