Embed Size (px)
Citation preview
Marketing Letters 11:2 (2000): 151±163
# 2000 Kluwer Academic Publishers, Manufactured in The Netherlands
The Impact of Innovativeness and Development Time onNew Product Performance for Small Firms
ABDUL ALI
Abdul Ali is Assistant Professor at Marketing Division, Babson College, Babson Park, MA 02457.
Email: [email protected]
Abstract
Timing is becoming a new source of competitive advantage. The business press extols the bene®ts of faster
product development. This paper examines whether competitive advantage can be gained by reducing develop-
ment time across all types of new products or whether this advantage is restricted to certain types of new products.
It proposes that product innovativeness moderates the relationship between development time and initial market
performance. A survey of 110 small manufacturing ®rms in computer related industries supports the hypothesis.
The survey ®ndings indicate that a ®rm must guard against over- or under-development of the new product since
product innovativeness was found to in¯uence the impact of development time on market performance. The
implications for managers are: beware of bringing a new product that is `̀ too much, too early'' or `̀ too little, too
late.''
Key words: New product development, cycle time, market performances
1. Introduction
Today, in an environment characterized by intense global competition and faster pace of
technological development, ®rms face increasing pressure to develop new products to
maintain pro®tability and market position. The importance of new products to market
success is well-documented (Robinson 1990; Cooper 1979). However, as Urban and
Hauser (1993) note, one emerging correlate of success not cited in past studies is `̀ time to
market'' (also known as `̀ product development cycle time'')Ðthe time from initiation of a
project to successful launch of the resulting product. The business press contains many
examples concerning ®rms that have reduced development time and reaped many bene®ts
(Dumaine 1989, 1991). Similarly, the articles published in the academic literature that
include both empirical demonstration (Grif®n 1997; Ittner and Larcker 1997) and
analytical model development (Bayus et al. 1997; Cohen et al. 1996) suggest that speeding
up the product development process is an important way to gain competitive advantage in
the marketplace. The important question arises: Will speeding up be uniformly successful
in improving market performance across all types of new products?
This paper addresses this question. It has been suggested here that product innovative-
ness in¯uences the relationship between development time and market performance. Based
on a survey of one hundred and ten manufacturing ®rms in the computer-related industry,
this paper observes the presence of a signi®cant moderating relationship across two
different measures of initial market performance. The market performance measured in
this study has short-term perspective because several environmental and market variables
which are beyond the control of managers in¯uence long-run market performance and it
would be dif®cult to isolate the effect of development time on longer term market
performance.
2. Hypothesis regarding moderating role of product innovativeness
Past research suggests that product innovativeness in¯uences market performance of new
products (Robinson 1990). However, a new product should be acceptable to customers if it
is to be successful in the marketplace. Based on the observation that product newness
re¯ects the amount of relevant experience (Olson et al. 1995), this paper suggests that
bringing an innovative product too early to the marketplace will result in poor responses
from inexperienced customers. That is, a highly innovative product may produce some
incompatibility with customers' existing way of doing things (see Rogers 1983), or may
increase technological risk for the buyers (Seth and Ram 1987). Customers may fear
economic loss, physical danger, and reliability problems due to inexperience with the
product. In contrast, customers at the later stage of product life cycle will be knowledge-
able and experienced with the product category. In this situation, bringing less innovative
incremental products too late to the marketplace will also result in poor responses from
experienced customers. The potential gain from switching to incremental innovative
products may not outweigh the switching cost from existing products. Thus, the success
of a product that is ahead or behind its time will suffer. This is also consistent with the
concept of `̀ strategic window'' (Abell 1978; Lilien and Yoon 1990).
The choice of market-entry time to improve new product success is contingent upon the
completion of the product development process. Only when a product is developed, can a
®rm think of entering the market and exploiting the `̀ strategic window.'' Thus, by taking
too long to develop an incremental product a ®rm may face a closed strategic window
since customers already exposed to existing brands will not postpone their purchase
decision while awaiting minor improvements. Also, competitors may have introduced
similar improvements by then. In contrast, by taking too short time to develop a highly
innovative product a ®rm may risk not only facing a not-yet-open strategic window, but
also of committing a costly mistake in the development process due to over-speeding.
Therefore, how development time in¯uences market performance depends on how
innovative the resulting product is. More formally, this paper proposes that:
H1: When there is a minor product innovation, the shorter the development time, the
greater the level of initial market performance. However, when there is a major product
innovation, shorter development time will not necessarily increase the level of initial
market performance.
152 A. ALI
Research setting: The sampling frame selected for this study consisted of a cross-section
(4 different 4-digit SIC groups) of mostly small (less than 100 employees) ®rms involved
in manufacturing computers, computer peripherals, prepackaged software or semiconduc-
tor devices1. These ®rms were chosen to represent an industry where ®rms are actively
engaged in product development, and as a result it was possible to investigate broad
patterns of new product development activities that ®rms are pursuing to speed up the
development process. The unit of analysis is the ®rm's most recently completed new
product development project. Entrepreneurs (e.g., president or owner) were used as single
key informants on the basis of their vested interest and presumed intimate knowledge of
their ®rms' new product development processes.
Data collection: The data collection phase proceeded in four stages. First, unstructured
personal interviews were undertaken with several entrepreneurs and industry experts from
a new product discussion group on the internet. The interviews focused on identifying the
most important issues facing the key decision-maker. Second, a questionnaire was
developed based on the personal interviews and the literature review. A second wave of
personal interviews focused on re®ning the content and wording of the measurement
indicators. Third, 1000 invitations to participate in the study were sent out. Of these, 107
letters were found to have wrong mailing addresses. This is quite common in this industry
because of a high failure rate in the rapidly changing technology. Of the remaining 893
®rms, 626 ®rms responded, but only 543 ®rms agreed to participate in the survey and ®t
the criteria of recent product development2. Fourth, questionnaires were mailed to these
543 ®rms. Of the 543 questionnaires mailed, 110 (20.2%) were returned. The median
respondent ®rm had a total staff size of 14.5 people with $1.5 million annual revenue. The
median product development time was 10 months.
Non-response: No signi®cant differences between full sample of 543 ®rms and the 110
responding ®rms were found with respect to sales, total employees and geographic location
for these ®rms. As suggested by Armstrong and Overton (1977), responses from early
versus late respondents were compared to further assess non-response bias. The time
between when the questionnaire was mailed and when it was returned was used to form
early (67%) and late (33%) respondent groups. Subsequent t-tests revealed that no
signi®cant differences existed between the groups regarding company size, locations,
types of new products being developed, and other constructs used in the study. Therefore,
non-response does not appear to be a signi®cant issue3.
3. Measures
Development time: Two ratio-scale items were used to measure development time. The ®rst
ratio scale de®nes development time from a ®rm perspective. It measures the total project
time from the date when a ®rm discussed the product idea to the date when ®rst production
for sales from the manufacturing facility started (see Grif®n 1993). This de®nition is also
consistent with the notion of product development time (Lilien and Yoon 1990; Wheel-
wright 1988), innovation time (Mans®eld 1988), and lead time (Clark 1989). The second
ratio scale, de®ned from market perspective, measures the total time from when the
NEW PRODUCT PERFORMANCE FOR SMALL FIRMS 153
marketplace or technological development ®rst revealed an opportunity to when a ®rm's
new product was installed and working for the ®rst time in a customer's facility4.
Initial market performance: One can measure initial market performance in many ways.
The performance measures included in this study are sales, revenue growth, market share,
and pro®ts. Since ®rms, most often, are reluctant to reveal actual performance data, I use
5-point Likert rating scale to measure the performance assessment of the key informant.
Product innovativeness: In this paper, a 5-level categorical variable was developed to
measure the product innovativeness. Following Booz, Allen and Hamilton (1982)
taxonomy of new product types and recent classi®cation discussed by Wheelwright and
Clark (1992), I de®ned ®ve categories of new product. These categories are: similar to
available (me-too) products (6.4% of the survey respondents indicated developing this type
of new product), improved version of existing product(s) (34.9%), line extensions (20.2%),
next generation new-to-the-market products (25.7%) and radical or breakthrough products
that create new industries or markets (12.8%). As can be seen from the descriptions of the
®ve categories, it has been assumed that the level of innovativeness is increasing as one
moves from developing a me-too product to line extension to next-generation to radical
product. Consequently this item was treated as a continuos scale in the analysis5.
Model speci®cation: The marketing strategy literature suggests that the performance
of a new entry depends on (1) the competitive environment facing the entry, (2) the
capabilities of the entrant, and (3) the market entry strategy (Gatignon et al. 1990).
Robinson et al. (1992) state that ®rms' resources and skills in¯uence the entry strategy of
these ®rms and subsequently their market performances. Consequently, the model included
following variables to reduce speci®cation error:
Project=Product: technology acquisition, complexity, product quality,
Environmental: market attractiveness, competitive intensity, technological change, uncer-
tainty,
Launch Strategy: relative price, relative promotion, relative distribution,
Organizational: resource, skills, and development experience6.
Functional form: To test the robustness of the results, initial market performance were
measured in two different ways. Consequently, two equations, shown below, are used to
test the hypotheses concerning the moderating effect of product innovativeness on the
relationship between development time and initial market performances (revenue or
pro®tability). This paper proposes that product innovativeness operate as a moderator
between development time and initial market performance. Hence, both equations include
an interaction term. To establish moderation, one needs to show that the parameter for the
interaction term is signi®cant. The equations also include speci®cation variables.
REVi � b0 � b1PIi � b2DTi � b3PIiDTi �P
i
biXi �1�
PROFITi � b0 � b1PIi � b2DTi � b3PIi:DTi �P
i
biXi �2�
154 A. ALI
where,
REV � revenue related goal;
PROFIT � profitability goal;
DT � development time;
PI � product innovativeness;
Xi � specification variable; �e:g:; market attractiveness; skills etc:�:
Endogeneity problem: This paper included many explanatory variables to reduce
speci®cation error problem. However, there is a chance that development time may be
correlated with many variables that are omitted from the above speci®cation mentioned in
Equations (1) and (2). For example, development times may vary for `me-too' versus `new-
to-the-world' products. Usually, it is expected that `new-to-the-world' products would take
longer time to develop than `me-too' products. Hence, if some companies have taken
longer time to develop `me-too' products than expected, it is presumably because
something has gone wrong or it was a deliberate decision on the part of the company to
hold out for a better product. In order to control this effect, this paper further investigated
the same relationship as described in Equations (1) and (2) only for those ®rms that had
actually brought out their new products faster to market.
Model estimation: Ordinary least squares (OLS) procedure was used to estimate the
regression coef®cients. No evidence of heteroskedasticity was found in the analyses. The
focus on only computer-related industries in the study may have alleviated the hetero-
skedasticity problem. However, the explanatory variables in the regression model consist
of development time as well as the interaction term involving development time. Thus, not
unexpectedly, a multicollinearity problem was observed in the analysis. Cronbach (1987)
recommends centering the component variables (prior to forming the multiplicative term)
as a means of addressing this problem. Consequently, the product innovativeness and
development time variables were mean-centered in the equations.
4. Results
Reliability and validity of measures: Sixteen constructs were developed for the research.
All but two constructs were based on multiple item measures. These items, item to total
correlation, reliability of measures (coef®cient alpha), and the means and standard
deviations of the constructs are shown in Table 1.
Exploratory factor analysis was used to con®rm the underlying factor structure of the
main constructs. Each multiple item construct was subjected to a varimax rotated principal
components factor analysis. Each of these factor analyses produced only one factor with
eigen value greater than one. Further, three measures of initial market performance namely
revenue goal, sales growth and market share were combined to form a composite scale.
This was done because both the correlation matrix and factor analysis suggested that these
three items were basically measuring the revenue-related dimension of initial market
NEW PRODUCT PERFORMANCE FOR SMALL FIRMS 155
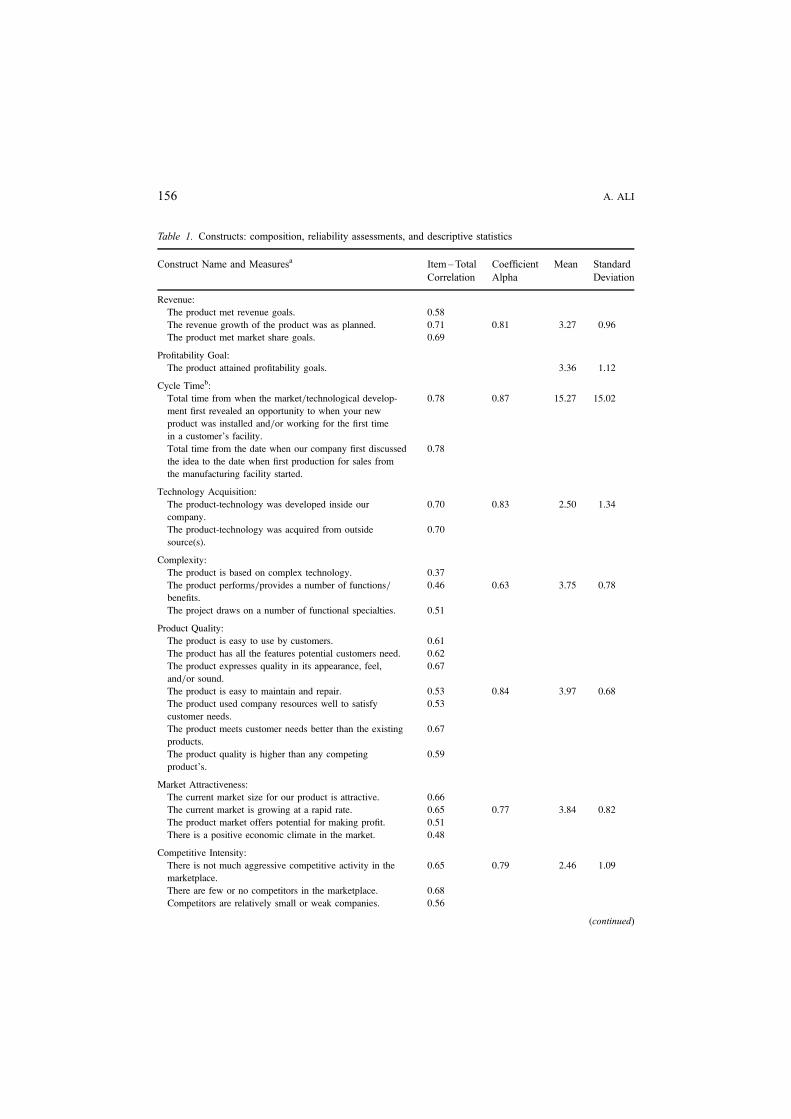
Table 1. Constructs: composition, reliability assessments, and descriptive statistics
Construct Name and Measuresa Item ± Total
Correlation
Coef®cient
Alpha
Mean Standard
Deviation
Revenue:
The product met revenue goals. 0.58
The revenue growth of the product was as planned. 0.71 0.81 3.27 0.96
The product met market share goals. 0.69
Pro®tability Goal:
The product attained pro®tability goals. 3.36 1.12
Cycle Timeb:
Total time from when the market=technological develop-
ment ®rst revealed an opportunity to when your new
product was installed and=or working for the ®rst time
in a customer's facility.
0.78 0.87 15.27 15.02
Total time from the date when our company ®rst discussed
the idea to the date when ®rst production for sales from
the manufacturing facility started.
0.78
Technology Acquisition:
The product-technology was developed inside our
company.
0.70 0.83 2.50 1.34
The product-technology was acquired from outside
source(s).
0.70
Complexity:
The product is based on complex technology. 0.37
The product performs=provides a number of functions=
bene®ts.
0.46 0.63 3.75 0.78
The project draws on a number of functional specialties. 0.51
Product Quality:
The product is easy to use by customers. 0.61
The product has all the features potential customers need. 0.62
The product expresses quality in its appearance, feel,
and=or sound.
0.67
The product is easy to maintain and repair. 0.53 0.84 3.97 0.68
The product used company resources well to satisfy
customer needs.
0.53
The product meets customer needs better than the existing
products.
0.67
The product quality is higher than any competing
product's.
0.59
Market Attractiveness:
The current market size for our product is attractive. 0.66
The current market is growing at a rapid rate. 0.65 0.77 3.84 0.82
The product market offers potential for making pro®t. 0.51
There is a positive economic climate in the market. 0.48
Competitive Intensity:
There is not much aggressive competitive activity in the
marketplace.
0.65 0.79 2.46 1.09
There are few or no competitors in the marketplace. 0.68
Competitors are relatively small or weak companies. 0.56
(continued)
156 A. ALI
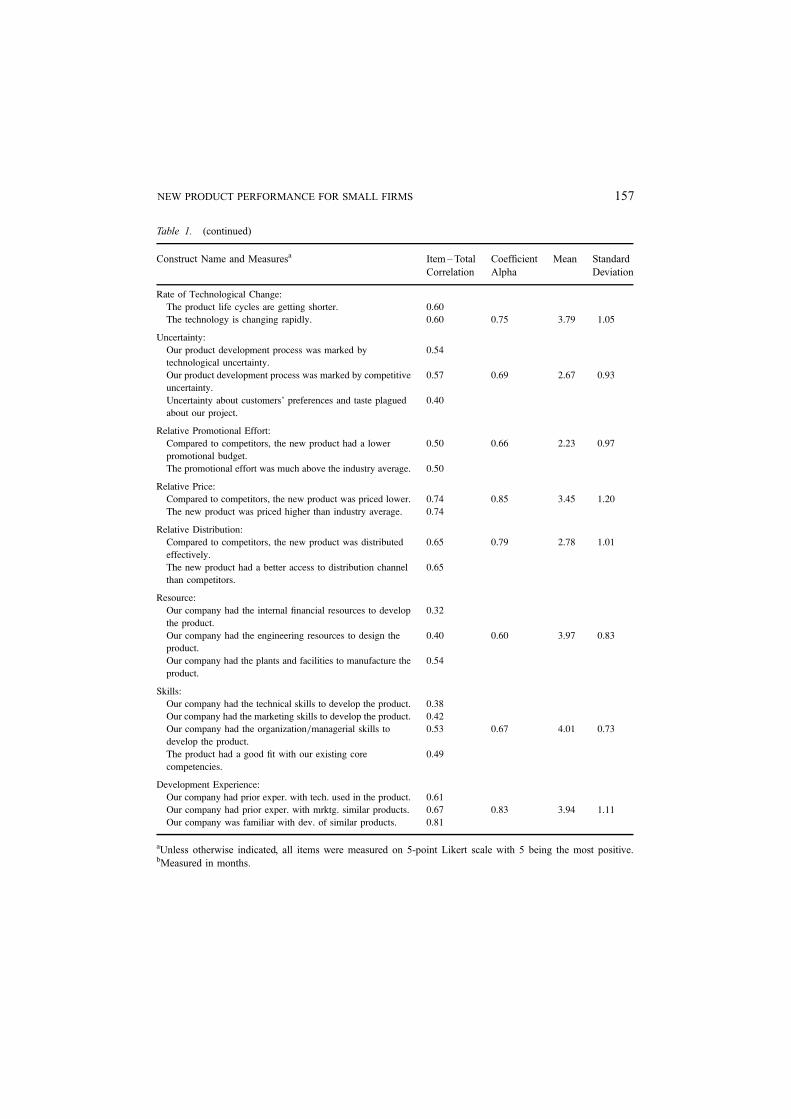
Table 1. (continued)
Construct Name and Measuresa Item ± Total
Correlation
Coef®cient
Alpha
Mean Standard
Deviation
Rate of Technological Change:
The product life cycles are getting shorter. 0.60
The technology is changing rapidly. 0.60 0.75 3.79 1.05
Uncertainty:
Our product development process was marked by
technological uncertainty.
0.54
Our product development process was marked by competitive
uncertainty.
0.57 0.69 2.67 0.93
Uncertainty about customers' preferences and taste plagued
about our project.
0.40
Relative Promotional Effort:
Compared to competitors, the new product had a lower
promotional budget.
0.50 0.66 2.23 0.97
The promotional effort was much above the industry average. 0.50
Relative Price:
Compared to competitors, the new product was priced lower. 0.74 0.85 3.45 1.20
The new product was priced higher than industry average. 0.74
Relative Distribution:
Compared to competitors, the new product was distributed
effectively.
0.65 0.79 2.78 1.01
The new product had a better access to distribution channel
than competitors.
0.65
Resource:
Our company had the internal ®nancial resources to develop
the product.
0.32
Our company had the engineering resources to design the
product.
0.40 0.60 3.97 0.83
Our company had the plants and facilities to manufacture the
product.
0.54
Skills:
Our company had the technical skills to develop the product. 0.38
Our company had the marketing skills to develop the product. 0.42
Our company had the organization=managerial skills to
develop the product.
0.53 0.67 4.01 0.73
The product had a good ®t with our existing core
competencies.
0.49
Development Experience:
Our company had prior exper. with tech. used in the product. 0.61
Our company had prior exper. with mrktg. similar products. 0.67 0.83 3.94 1.11
Our company was familiar with dev. of similar products. 0.81
aUnless otherwise indicated, all items were measured on 5-point Likert scale with 5 being the most positive.bMeasured in months.
NEW PRODUCT PERFORMANCE FOR SMALL FIRMS 157
performance. The other uncorrelated measure of initial market performance namely
pro®tability was left as one single item construct.
Finally, the content validity of some measures were checked by examining the
relationship between these measures and other measures asked in the questionnaire. For
example, the relationship between the product innovativeness measure and development
strategy suggested that ®rms which were developing next generation or radical products
were also following a `̀ great-leap-forward'' strategy, whereas ®rms that were developing
minor improvement or line extension products were following an `̀ incremental'' strategy
(Chi-square� 28.08, p� .0005).
5. Hypotheses regarding moderating effect of product innovativeness
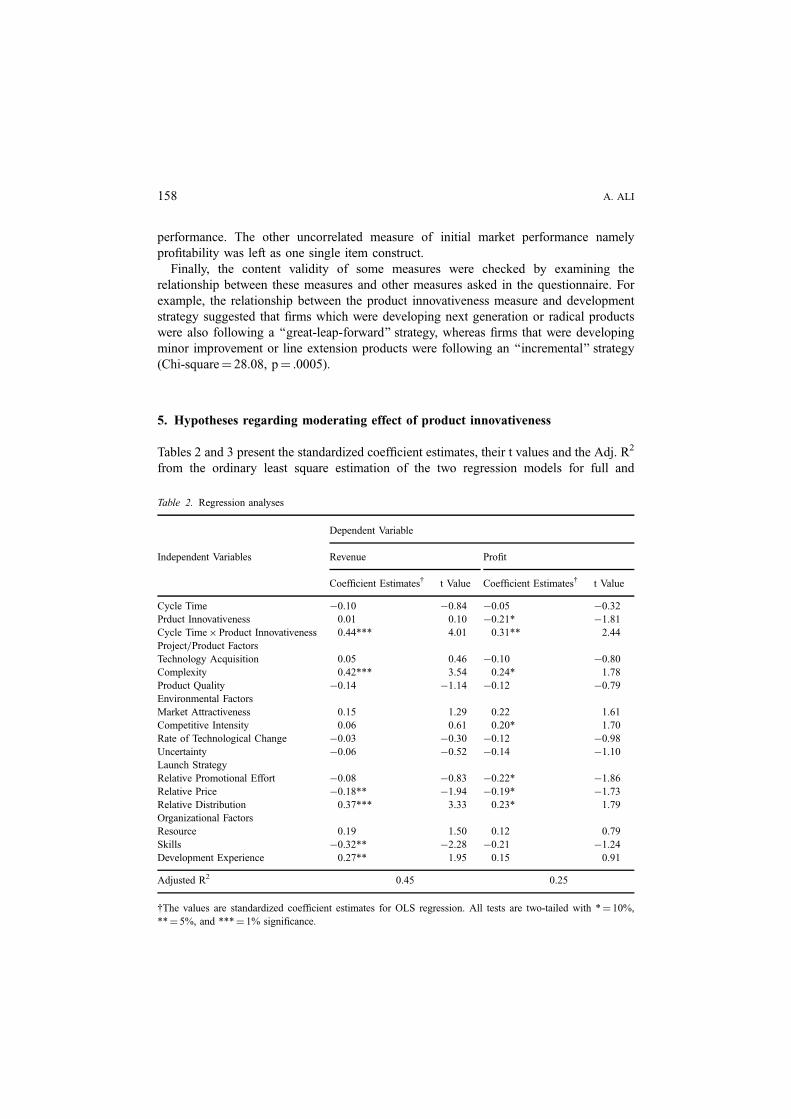
Tables 2 and 3 present the standardized coef®cient estimates, their t values and the Adj. R2
from the ordinary least square estimation of the two regression models for full and
Table 2. Regression analyses
Dependent Variable
Independent Variables Revenue Pro®t
Coef®cient Estimates{ t Value Coef®cient Estimates{ t Value
Cycle Time ÿ0.10 ÿ0.84 ÿ0.05 ÿ0.32
Prduct Innovativeness 0.01 0.10 ÿ0.21* ÿ1.81
Cycle Time�Product Innovativeness 0.44*** 4.01 0.31** 2.44
Project=Product Factors
Technology Acquisition 0.05 0.46 ÿ0.10 ÿ0.80
Complexity 0.42*** 3.54 0.24* 1.78
Product Quality ÿ0.14 ÿ1.14 ÿ0.12 ÿ0.79
Environmental Factors
Market Attractiveness 0.15 1.29 0.22 1.61
Competitive Intensity 0.06 0.61 0.20* 1.70
Rate of Technological Change ÿ0.03 ÿ0.30 ÿ0.12 ÿ0.98
Uncertainty ÿ0.06 ÿ0.52 ÿ0.14 ÿ1.10
Launch Strategy
Relative Promotional Effort ÿ0.08 ÿ0.83 ÿ0.22* ÿ1.86
Relative Price ÿ0.18** ÿ1.94 ÿ0.19* ÿ1.73
Relative Distribution 0.37*** 3.33 0.23* 1.79
Organizational Factors
Resource 0.19 1.50 0.12 0.79
Skills ÿ0.32** ÿ2.28 ÿ0.21 ÿ1.24
Development Experience 0.27** 1.95 0.15 0.91
Adjusted R2 0.45 0.25
{The values are standardized coef®cient estimates for OLS regression. All tests are two-tailed with *� 10%,
**� 5%, and ***� 1% signi®cance.
158 A. ALI
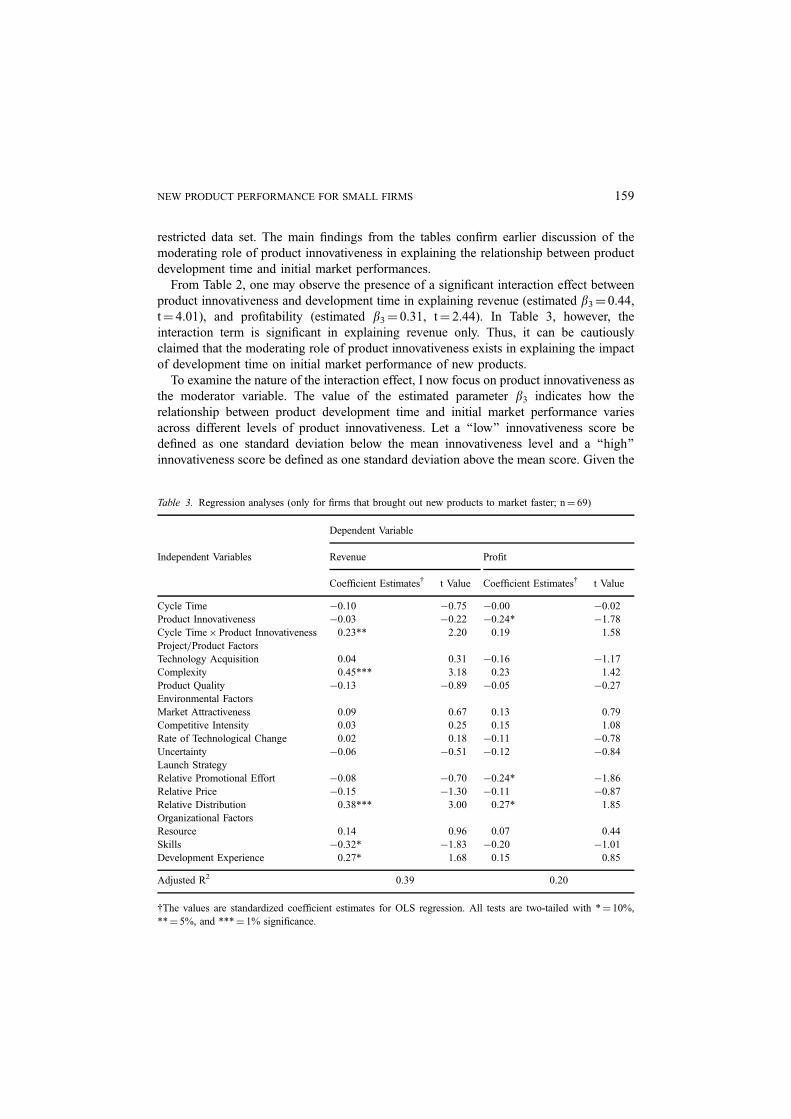
restricted data set. The main ®ndings from the tables con®rm earlier discussion of the
moderating role of product innovativeness in explaining the relationship between product
development time and initial market performances.
From Table 2, one may observe the presence of a signi®cant interaction effect between
product innovativeness and development time in explaining revenue (estimated b3� 0.44,
t� 4.01), and pro®tability (estimated b3� 0.31, t� 2.44). In Table 3, however, the
interaction term is signi®cant in explaining revenue only. Thus, it can be cautiously
claimed that the moderating role of product innovativeness exists in explaining the impact
of development time on initial market performance of new products.
To examine the nature of the interaction effect, I now focus on product innovativeness as
the moderator variable. The value of the estimated parameter b3 indicates how the
relationship between product development time and initial market performance varies
across different levels of product innovativeness. Let a `̀ low'' innovativeness score be
de®ned as one standard deviation below the mean innovativeness level and a `̀ high''
innovativeness score be de®ned as one standard deviation above the mean score. Given the
Table 3. Regression analyses (only for ®rms that brought out new products to market faster; n� 69)
Dependent Variable
Independent Variables Revenue Pro®t
Coef®cient Estimates{ t Value Coef®cient Estimates{ t Value
Cycle Time ÿ0.10 ÿ0.75 ÿ0.00 ÿ0.02
Product Innovativeness ÿ0.03 ÿ0.22 ÿ0.24* ÿ1.78
Cycle Time�Product Innovativeness 0.23** 2.20 0.19 1.58
Project=Product Factors
Technology Acquisition 0.04 0.31 ÿ0.16 ÿ1.17
Complexity 0.45*** 3.18 0.23 1.42
Product Quality ÿ0.13 ÿ0.89 ÿ0.05 ÿ0.27
Environmental Factors
Market Attractiveness 0.09 0.67 0.13 0.79
Competitive Intensity 0.03 0.25 0.15 1.08
Rate of Technological Change 0.02 0.18 ÿ0.11 ÿ0.78
Uncertainty ÿ0.06 ÿ0.51 ÿ0.12 ÿ0.84
Launch Strategy
Relative Promotional Effort ÿ0.08 ÿ0.70 ÿ0.24* ÿ1.86
Relative Price ÿ0.15 ÿ1.30 ÿ0.11 ÿ0.87
Relative Distribution 0.38*** 3.00 0.27* 1.85
Organizational Factors
Resource 0.14 0.96 0.07 0.44
Skills ÿ0.32* ÿ1.83 ÿ0.20 ÿ1.01
Development Experience 0.27* 1.68 0.15 0.85
Adjusted R2 0.39 0.20
{The values are standardized coef®cient estimates for OLS regression. All tests are two-tailed with *� 10%,
**� 5%, and ***� 1% signi®cance.
NEW PRODUCT PERFORMANCE FOR SMALL FIRMS 159
average score obtained for product innovativeness scale in the dataset, a `̀ low'' score
implies that ®rms are developing me-too products or products with minor improvements
over existing ones. Similarly, a `̀ high''score implies the development of next-generation or
radical new products. Note that the variables were mean-centered and the coef®cient
estimates presented in Table 3 were standardized. Thus, a low innovativeness score
corresponds to ÿ1, the average score corresponds to 0, and a high score corresponds to
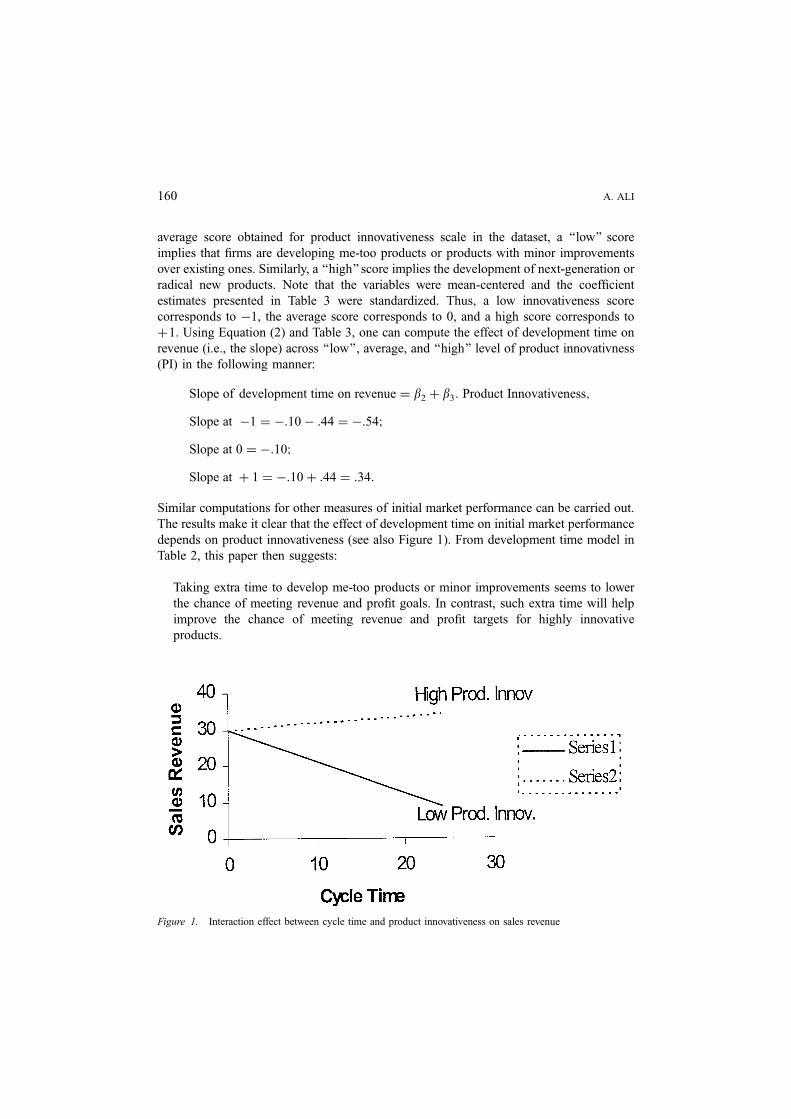
�1. Using Equation (2) and Table 3, one can compute the effect of development time on
revenue (i.e., the slope) across `̀ low'', average, and `̀ high'' level of product innovativness
(PI) in the following manner:
Slope of development time on revenue � b2 � b3: Product Innovativeness;
Slope at ÿ1 � ÿ:10ÿ :44 � ÿ:54;
Slope at 0 � ÿ:10;
Slope at � 1 � ÿ:10� :44 � :34:
Similar computations for other measures of initial market performance can be carried out.
The results make it clear that the effect of development time on initial market performance
depends on product innovativeness (see also Figure 1). From development time model in
Table 2, this paper then suggests:
Taking extra time to develop me-too products or minor improvements seems to lower
the chance of meeting revenue and pro®t goals. In contrast, such extra time will help
improve the chance of meeting revenue and pro®t targets for highly innovative
products.
Figure 1. Interaction effect between cycle time and product innovativeness on sales revenue
160 A. ALI
6. Discussion
This paper suggests that product innovativeness in¯uences the relationship between
development time and market performance. Product innovativeness should be seen as a
re¯ection of the amount of relevant experience customers in the marketplace will have in
acquiring and using the resulting product. While bringing highly innovative products too
early may not evoke desired responses from inexperienced customers, bringing incre-
mental products too late may not appeal to experienced customers either.
Although the theory of product development acceleration and its impact on new product
performance is of academic interest, it is also important to marketing managers as ®rms
increasingly rely on development time for competitive advantage. Managers should
seriously consider the nature of a new product being developed before speeding up the
process and be vigilant against either over- or under-development. The results in this paper
show that bringing highly innovative products too early to market or bringing minor
improvements too late to customers will not help managers to meet their revenue and pro®t
targets. What makes the product development acceleration more challenging is that
managers cannot afford to over or under develop a new product, especially if the resulting
product is perceived by customers as `̀ too little, too late'', or `̀ too much, too early.'' For
example, an article in the Wall Street Journal noted that Syquest Technologies, a maker of
data storage drives, had `̀ decisively lost the battle'' against its arch rival Iomega in the
ancillary-storage-drive business as its new system was `̀ too little, too late'' (Dorman
1996). In contrast, Akio Morita, Sony Corporation's past chairman, once observed that
`̀ the relentless push for accelerated product cycle times is simultaneously exhausting
consumers and corroding pro®t margins'' (Schrage 1992). Thus, there is one important
message for managers: Beware of bringing `̀ too much, too early'' or `̀ too little, too late.''
Given the nature of the sample here, this caution may be particularly appropriate for small
manufacturers.
The research ®ndings, here, are based on four computer-related industries. Although
such focus on a major industry group may reduce cross-sectional bias, the idiosyncratic
nature of the industry may put more emphasis on certain types of a development process
than some other types. Further, the static nature of cross-sectional analysis precludes
investigation of full effect of development time on market performance of a new product
that occurs over time. To generalize these ®ndings, one needs to test the hypotheses across
different industries and also over time. Further, this paper investigated the moderating
effect of product innovativeness for small ®rms. There is a need to replicate this study in
larger ®rms. Clearly, there is an opportunity for further work in this area to improve our
understanding of product development time.
Notes
1. The sampling frame was constructed from a highly regarded commercial mailing list provider.
2. Two reasons motivated this approach: First, new product development is an infrequent activity in many small
®rms; thus, at any one time many ®rms are not likely to have recently completed a project. This was evidenced
NEW PRODUCT PERFORMANCE FOR SMALL FIRMS 161
by several responses indicating the ®rm had not recently developed a new product. Second, the complexity of
the new product development task was felt to be such that the quality of the response was likely to decay
rapidly with time. Therefore, managers were asked to respond only if they could report on a recently developed
project.
3. Some non-respondents were also contacted by telephone in order to determine the reason for nonparticipation.
The majority reported that they had not recently developed any new products.
4. I thank one of the members of internet discussant group for pointing out the need to de®ne cycle time from
®rm and market perspective.
5. Product innovativeness was measured using a categorical scale as well as with a Likert scale. However, from
my past experience with another study, I found managers tend to rate their own products highly on Likert scale
measure of innovativeness. Consequently, I developed the categorical scale based on classi®cation scheme
described by past research (Booz, Allen and Hamilton 1982; Wheelwright and Clark 1992). I test the
relationship between two measures of innovativeness scale. It con®rmed my earlier ®ndings as respondents
reported me-too products more innovative than line extensions. Thus, I used the categorical scale of
innovativeness measure in the study.
6. Since the data consists of mostly small ®rms, I did not consider ®rm size as an important speci®cation variable
in our analysis.
Acknowledgements
The author would like to thank Amiya Basu, Don Lehmann, Bob Meyer, and one anonymous reviewer for their
helpful comments and suggestions on the earlier version of this paper. The author gratefully acknowledges the
support provided by the Board of Research at Babson College. The author would also like to thank Amiya Basu,
Don Lehmann, Bob Meyer, and one anonymous reviewer for their helpful comments and suggestions on the
earlier version of this paper.
References
Abell, Derek F. (1978). `̀ Strategic Windows,'' Journal of Marketing 42 (July), 21±26.
Armstrong, J. Scott and Terry S. Overton. (1977). `̀ Estimating Non-response Bias in Mail Surveys,'' Journal of
Marketing Research 14 (August), 396±402.
Bayus, Barry L., Sanjay Jain, and Ambar G. Rao. (1997). `̀ Too Little, Too Early: Introduction Timing and New
Product Performance in the Personal Digital Assistant Industry,'' Journal of Marketing Research 34 (February),
50±63.
Booz, Allen & Hamilton. (1982). New Products for the 1980's. New York, NY.
Clark, Kim B. (1989). `̀ Project Scope and Project Performance: The Effect of Parts Strategy and Supplier
Involvement on Product Development,'' Management Science 35 (October), 1247±63.
Cooper, Robert G. (1979). `̀ The Dimensions of Industrial New Product Success and Failure,'' Journal of
Marketing 43 (Summer), 93±103.
Cohen, M., J. Eliashberg, and T. H. Ho. (1996). `̀ New Product Development: The Performance and Time-to-
market Tradeoff,'' Management Science 42 (January=February), 173±186.
Cronbach, L. (1987). `̀ Statistical Tests for Moderator Variables: Flaws in Analysis Recently Proposed,''
Psychological Bulletin 102, 414±417.
Dorfman, John R. (1996). `̀ Some Issues Still Flying at Lofty Levels,'' The Wall Street Journal (July 16), C1±C2.
Dumaine, B. (1989). `̀ How Managers Can Succeed Through Speed,'' Fortune (February 13), 54±59.
Dumaine, B. (1991). `̀ Earning More by Moving Faster,'' Fortune (October 7) 89±90.
Gatignon, H., B. Weitz, and P. Bansal. (1990). `̀ Brand Introduction Strategies and Competitive Environments,''
Journal of Marketing Research 27 (November), 390±401.
162 A. ALI
Grif®n, A. (1993). `̀ Metrics for Measuring Product Development Cycle Time,'' Journal of Product Innovation
Measurement 10 (March), 112±125.
Grif®n, A. (1997). `̀ The Effect of Project and Process Characteristics on Product Development Cycle Time,''
Journal of Marketing Research 34 (February), 24±35.
Ittner, Christopher D. and David F. Larcker. (1997). `̀ Product Development Cycle Time and Organizational
Performance,'' Journal of Marketing Research 34 (February), 13±23.
Lilien, Gary and Eusang Yoon. (1990). `̀ Timing of Competitive Market Entry,'' Management Science 36 (May),
568±85.
Mans®eld, E. (1988). `̀ The Speed and Cost of Industrial Innovation in Japan and The United States: External vs.
Internal Technology,'' Management Science 34 (October), 1157±1168.
Olson, Eric M., Orville C. Walker, Jr., and Robert W. Ruekert. (1995). `̀ Organizing for Effective New Product
Development: The Moderating Role of Product Innovativeness,'' Journal of Marketing 59 (January), 48±62.
Robinson, William T. (1990). `̀ Product Innovation and Start-Up Business Market Share Performance,'' Manage-
ment Science 36 (October), 1279±1289.
Robinson, William T., Claes Fornell, and Mary Sullivan. (1992). `̀ Are Market Pioneers Intrinsically Stronger than
Later Entrants?'' Strategic Management Journal 13, 609±624.
Rogers, Everett M. (1983). Diffusion of Innovations, 3rd ed., New York, NY, Free Press.
Schrage, Michael. (1992). `̀ Speed Can Kill When It Comes To Bringing New Products to Market'' The
Washington Post (July 3) F3.
Seth, Jagdish, N. and Ram, S. (1987). Bringing Innovation to Market: How to Break Corporate and Customer
Barriers. New York: John Wiley & Sons.
Smith, Preston G. and Donald G. Reinertsen. (1991). Developing Products in Half the Time, New York: Van
Nostrand Reinhold.
Urban, Glen. L. and John R. Hauser. (1993). Design and Marketing of New Products, Englewood Cliffs, New
Jersey: Prentice Hall.
Wheelwright, Steven C. (1988). `̀ Product Development and Manufacturing Start-up,'' In M. Tushman and W.
Moore (eds.), Readings in the Management of Innovation, 2nd ed. Cambridge, MA: Ballinger, 444±453.
Wheelwright, Steven C. and Kim B. Clark. (1992). Revolutionalizing Product Development: Quantum Leaps in
Speed, Ef®ciency, and Quality, New York, NY, 237.
NEW PRODUCT PERFORMANCE FOR SMALL FIRMS 163