Embed Size (px)
Citation preview
1
The Impact of the Financial Crisis on CARICOM countries
By
Preeya Mohan1
and
Patrick Kent Watson
Sir Arthur Lewis Institute of Social and Economic Studies
University of the West Indies
St. Augustine
Trinidad & Tobago
Tel: (868) 662-6965,
Fax: (868) 645-6329
Abstract
The current global financial crisis is a reminder of the inherent vulnerabilities faced by
CARICOM economies on their road to economic growth and development. The crisis has
negatively affected growth and, as data gradually become available, its far-reaching after-effects
are becoming more evident. A study of the impact of the crisis on economic growth in the region
is needed in the way forward for CARICOM development. As such the aftermath of the crisis on
the region requires detailed documentation. This paper seeks to examine the outcome of the
crisis on economic growth among CARICOM countries with particular emphasis on
international trade and private capital flows from which lessons and productive development
policies can be derived.
1 Corresponding author
2
1. Introduction
The development of the CARICOM region must begin with a comprehensive synopsis of the
developmental hurdles faced by the region. In other words the question “where are we now?”
must be answered before we know where we need to go. In April 2007 the United States (US)
sub-prime mortgage market went belly-up, which triggered a crash in its financial system and
marked the beginning of the International Financial Crisis (IFC). The crisis eventually spread to
the real sector of the US and, in December 2007, the economy went into a deep recession. In
September 2008, contagion effects led to the contamination of international financial markets
creating a worldwide calamity. The IFC then became a global economic crisis as, worldwide,
real sector effects materialized. Unlike recent crises which started off in emerging and
developing economies such as the 1994 Mexico crisis, Thailand and Korea in 1997, Indonesia,
Malaysia and Russia in 1998 and Argentina in 2001, this catastrophe originated in the world’s
largest economy creating the largest shock to economic growth since the 1930’s, which has since
been labeled the “Great Recession”.
The result has been a sharp downturn in world gross domestic product (GDP), commencing in
the latter half of 2008 to 2009. The recovery however remains highly uncertain. The
International Monetary Fund’s (IMF) World Economic Outlook (WEO) Report (October 2010)
states that recovery rests on two rebalancing acts, fiscal consolidation and a realignment of
international trade which entails increasing net exports in advanced economies and reducing net
exports in emerging economies. Furthermore, the global financial system is yet to recover and
there exists considerable uncertainty as sovereign and banking vulnerabilities persist which has
increased market volatility and reduced investor confidence. Sovereign balance sheets are highly
vulnerable to growth shocks, making debt sustainability less certain, prices in stock exchanges
have fallen and the risk premiums on corporate bonds have widened, and corporate bond issues
have slowed (Global Financial Stability Report October 2010). Nevertheless, in 2010, there has
been some recovery with emerging markets particularly, Asia at the forefront and advanced
economies lagging behind (table 1). The recovery is however questionable as it was being driven
by mammoth fiscal deficits which have since subsided while consumption and investment
remains depressed.
As the advanced and emerging economies undergo fiscal consolidation and attempt to develop
domestic sources of growth coupled with weak financial markets the worst of the crisis may yet
to come for the CARICOM region.
economic growth in CARICOM countri
financial capital flows as the transmission channel of the crisis has been on the balance of
payment accounts of CARICOM economies.
introduction. The rest of the paper is organized as fol
transmission mechanisms of the crisi
and private capital flows, section four the impact of the crisis on CARICOM’s macro economy,
section five provides a global outlook followed by
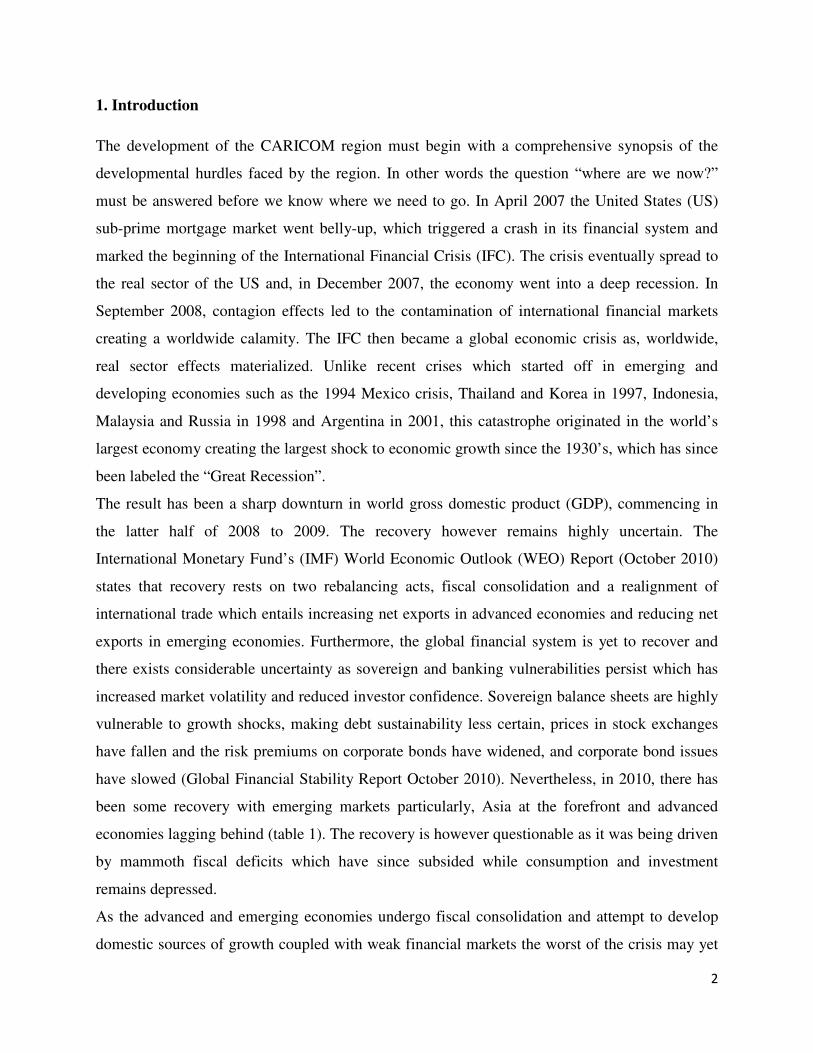
2. The Transmission Channels of the Crisis
The IFC acted as an external shock
economies was spared from direct effects due to t
region’s financial markets into the world system. The real economy, however, was not spared
and there has been a plunge in economic gr
CARICOM economies has been a tumble in
tourism, a dip in commodity prices along with
investments, remittances and official development assistance
current account and capital account of the balance of payments, the consequence of which are
lower employment, shrinking government revenue, curtailed loan demand and balance of
payments imbalances. Figure 1 illustrates the transmission mechanism of the IFC on CARICOM
economies.
Figure 1: Transmission c
region. This paper examines the impact of the financial crisis on
economic growth in CARICOM countries with particular emphasis on international trade
he transmission channel of the crisis has been on the balance of
payment accounts of CARICOM economies. This paper consists of six sections including the
The rest of the paper is organized as follows: section two
f the crisis; section three the impact of the crisis on international trade
and private capital flows, section four the impact of the crisis on CARICOM’s macro economy,
outlook followed by section six which concludes the paper
2. The Transmission Channels of the Crisis
as an external shock to CARICOM economies. The financial
direct effects due to the lack of development and i
l markets into the world system. The real economy, however, was not spared
n economic growth. The transmission channels
CARICOM economies has been a tumble in export demand for goods and services, particularly
tourism, a dip in commodity prices along with Foreign Direct Investment (FDI),
, remittances and official development assistance (ODA). The crisis has impacted the
capital account of the balance of payments, the consequence of which are
lower employment, shrinking government revenue, curtailed loan demand and balance of
payments imbalances. Figure 1 illustrates the transmission mechanism of the IFC on CARICOM
Figure 1: Transmission channels of the crisis on CARICOM economies
3
This paper examines the impact of the financial crisis on
national trade and
he transmission channel of the crisis has been on the balance of
sists of six sections including the
section two examines the
on international trade
and private capital flows, section four the impact of the crisis on CARICOM’s macro economy,
section six which concludes the paper.
to CARICOM economies. The financial sector of these
development and integration of the
l markets into the world system. The real economy, however, was not spared
owth. The transmission channels of the crisis on
xport demand for goods and services, particularly
eign Direct Investment (FDI), portfolio
The crisis has impacted the
capital account of the balance of payments, the consequence of which are
lower employment, shrinking government revenue, curtailed loan demand and balance of
payments imbalances. Figure 1 illustrates the transmission mechanism of the IFC on CARICOM
hannels of the crisis on CARICOM economies
4
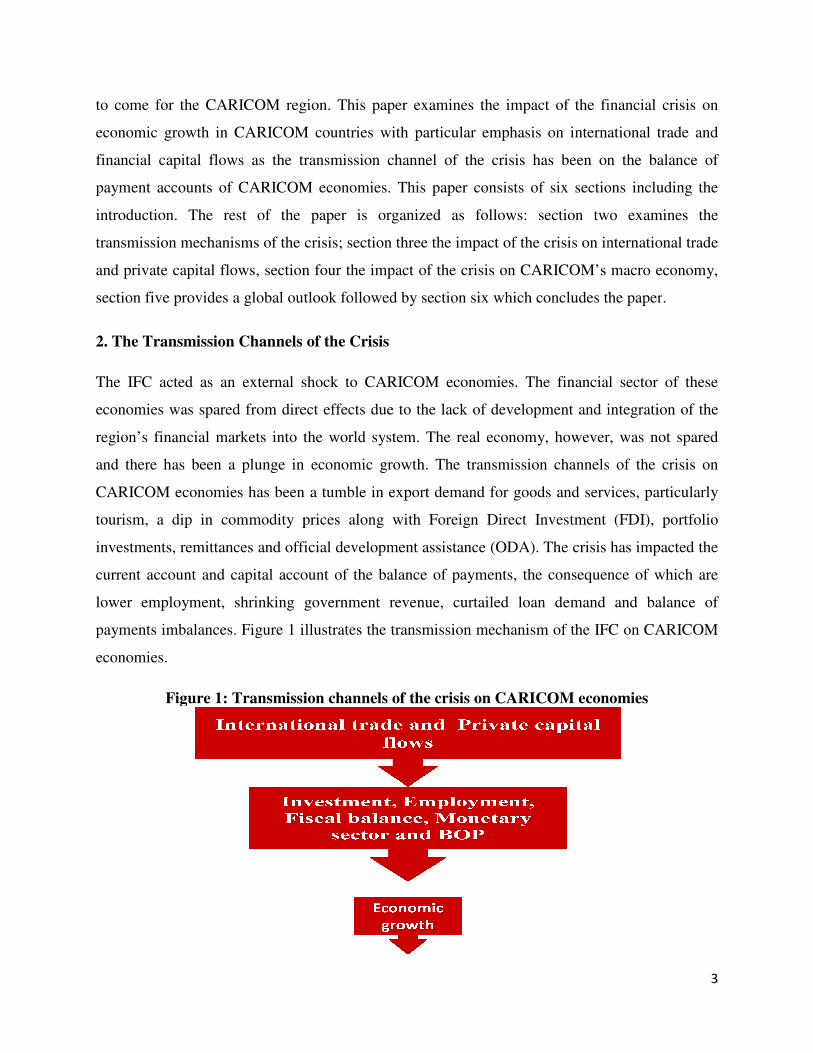
3. The Impact of the IFC on CARICOM
Figure 2 provides a summary of the impact of the IFC on CARICOM showing the percentage
change in goods exports, tourism arrivals, the international commodity price index, FDI,
remittances, ODA and GDP per capita in 2008 and 2009. The crisis has impacted CARICOM via
a fall international trade and capital flows. International financial flows have been more
negatively affected by the crisis compared to trade flows. ODA took the largest plunge and fell
74 percentage points in 2009 followed by FDI falling by 44 per cent. The crisis has even
challenged the pro-cyclical nature of remittances which fell by 7 per cent. Goods exports were
also negatively affected. Export volume declined by 43 per cent. Furthermore, the international
commodity price index fell by 40 per cent reducing the value of exports. Tourism arrivals fell
significantly less at 6 per cent.
Figure 2: The Impact of the IFC on CARICOM, percentage change in international trade
and private capital flows, 2008 and 2009.
Source: Author’s compilation from various sources.
3.1. Trade in goods and services
CARICOM main exports destination are the US, the European Union and Canada (WTO trade
profiles, March 2010) which are the countries most negatively affected by the crisis. As shown in
-80
-60
-40
-20
0
20
40
60
Goods exports
Tourism CPI FDI Remittances ODA GDP per capita
2008 2009
5
Table 1, there was a significant fall in demand for CARICOM exports, in 2009; Guyana and
Trinidad and Tobago were most negatively affected and experienced a 66 and 51 per cent fall in
exports respectively. Other territories experiencing declines were Belize and Barbados of 18 per
cent and 14 per cent respectively. Imports for all countries also fell in 2009 but by less compared
to exports creating current account imbalances.
Table 1: Percentage change in CARICOM Exports and Imports, 2007, 2008 and 2009.
Exports Imports
Country 2007 2008 2009 2007 2008 2009
Bahamas 8.7 2.9 NA 4.6 0.5 NA
Barbados 5.1 1.7 -13.7 4.1 13.9 -23.4
Belize -0.4 9.6 -18.1 3.6 22.3 -20.2
ECCU 5.5 28.1 4.1 13.3 10.6 -17.5
Guyana 19.3 14.4 -66.4 20.1 22.3 -11.7
Haiti 6.1 -6.1 NA 4.5 30.2 NA
Jamaica 10.7 21.5 NA 16.1 20.9 NA
Suriname NA NA NA NA NA NA
Trinidad and Tobago 10.7 -36.8 -50.6 12.1 -35 -27.2 Source: CCMF, Caribbean Economic Performance Report, Dec.2009 and June 2010.
The primary factors accounting for the breakdown in CARICOM trade are as a direct result of
the IFC. Firstly, there has been a lower demand for goods and services particularly in
industrialized economies that account for a substantial portion of global trade demand.
According to Baldwin (November 2009) trade among all nations experienced a “sudden, severe
and synchronized collapse”. The fall in trade has been described as the sharpest in recorded
history and deepest since the 1930’s. Both North-South and South-South trade were adversely
affected. Figure 3a, highlights the collapse in world trade in goods and services which declined
by 18 percentage points from 2007 to 2009. In addition, this collapse in trade has even been
larger than the downfall in GDP (figure 3a) and is referred to as the “Great Trade Collapse” in
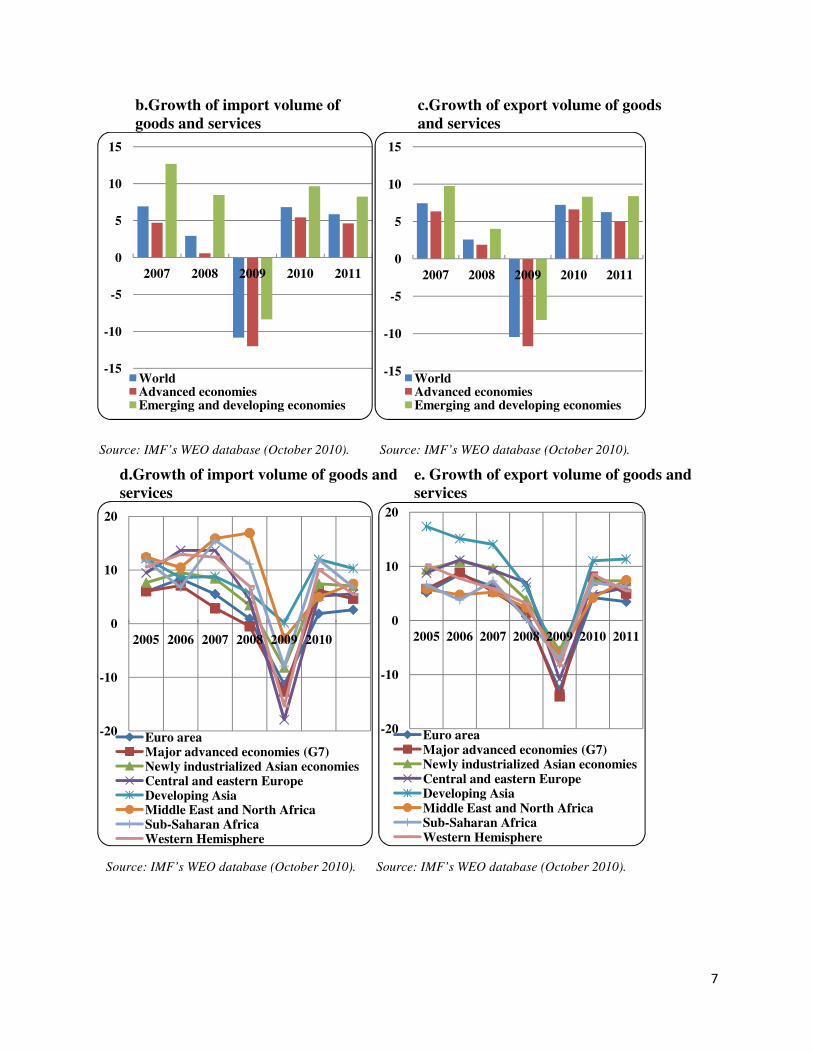
the literature. World imports and exports fell by 11 per cent and 10 per cent respectively (figures
3b and 3c). Exports from advanced economies fell by 12 per cent and emerging and developing
economies 8 per cent. The decline in imports has been largest for advanced economies which
experienced a 12 per cent decline and emerging and developing economies an 8 per cent decline
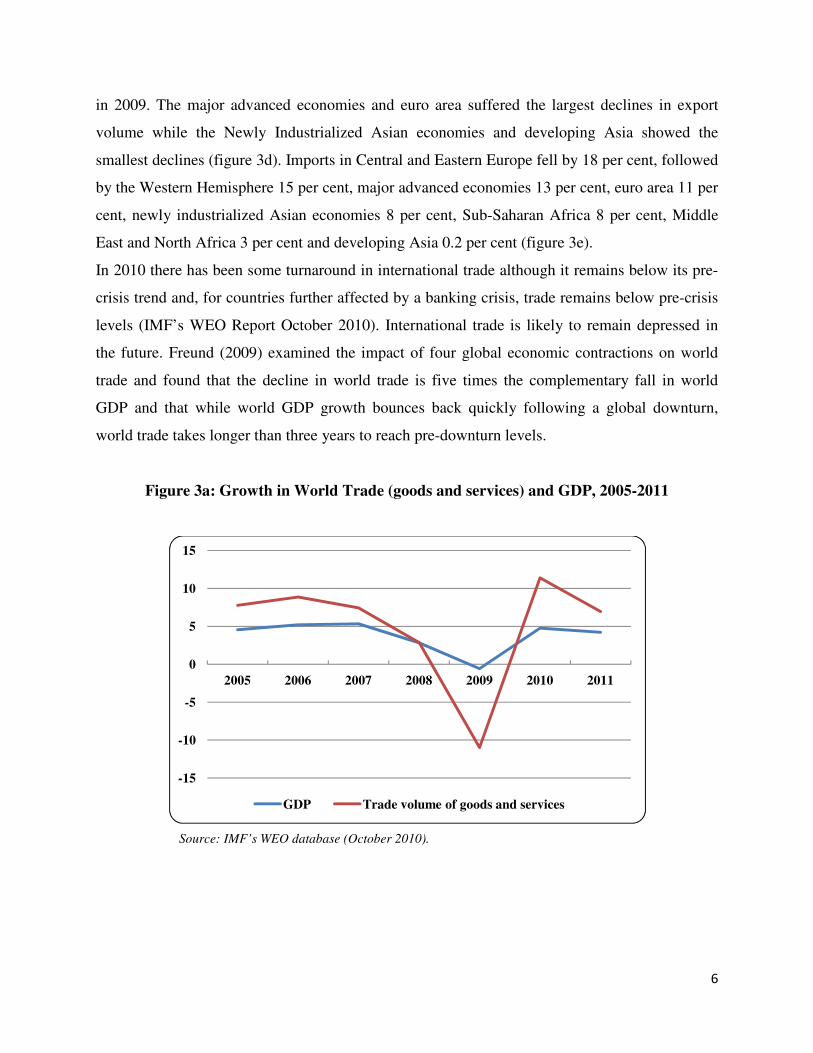
6
in 2009. The major advanced economies and euro area suffered the largest declines in export
volume while the Newly Industrialized Asian economies and developing Asia showed the
smallest declines (figure 3d). Imports in Central and Eastern Europe fell by 18 per cent, followed
by the Western Hemisphere 15 per cent, major advanced economies 13 per cent, euro area 11 per
cent, newly industrialized Asian economies 8 per cent, Sub-Saharan Africa 8 per cent, Middle
East and North Africa 3 per cent and developing Asia 0.2 per cent (figure 3e).
In 2010 there has been some turnaround in international trade although it remains below its pre-
crisis trend and, for countries further affected by a banking crisis, trade remains below pre-crisis
levels (IMF’s WEO Report October 2010). International trade is likely to remain depressed in
the future. Freund (2009) examined the impact of four global economic contractions on world
trade and found that the decline in world trade is five times the complementary fall in world
GDP and that while world GDP growth bounces back quickly following a global downturn,
world trade takes longer than three years to reach pre-downturn levels.
Figure 3a: Growth in World Trade (goods and services) and GDP, 2005-2011
Source: IMF’s WEO database (October 2010).
-15
-10
-5
0
5
10
15
2005 2006 2007 2008 2009 2010 2011
GDP Trade volume of goods and services
7
b.Growth of import volume of goods and services
c.Growth of export volume of goods and services
Source: IMF’s WEO database (October 2010). Source: IMF’s WEO database (October 2010).
d.Growth of import volume of goods and services
e. Growth of export volume of goods and services
Source: IMF’s WEO database (October 2010). Source: IMF’s WEO database (October 2010).
-15
-10
-5
0
5
10
15
2007 2008 2009 2010 2011
WorldAdvanced economiesEmerging and developing economies
-15
-10
-5
0
5
10
15
2007 2008 2009 2010 2011
WorldAdvanced economiesEmerging and developing economies
-20
-10
0
10
20
2005 2006 2007 2008 2009 2010
Euro area Major advanced economies (G7)Newly industrialized Asian economiesCentral and eastern EuropeDeveloping AsiaMiddle East and North AfricaSub-Saharan AfricaWestern Hemisphere
-20
-10
0
10
20
2005 2006 2007 2008 2009 2010 2011
Euro area Major advanced economies (G7)Newly industrialized Asian economiesCentral and eastern EuropeDeveloping AsiaMiddle East and North AfricaSub-Saharan AfricaWestern Hemisphere
8
The crisis has also caused a dwindling of trade credit and finance which has resulted in a fall i
international trade (Qalo 2009, WTO/OECD 2009). The cost of trade credit instruments rose
astronomically in the latter part of 2008 and, in March 2009, there was an excess demand for
credit financing between US$100 billion and US$300 billion on an annual and roll-over basis
(WTO/OECD 2009). A fall in countries’ foreign exchange reserves is another cause cited for the
fall in trade (Qalo 2009). Another consequence of the crisis has been burgeoning protectionism.
Since the start of the crisis, nations have proposed approximately 78 trade measures and, of
these, 47 eventually were implemented, the effect of which has been to restrict trade (Gamberoni
and Newfarmer 2009). In addition, antidumping initiatives grew by 15 per cent and the
imposition of duties grew by 22 per cent from 2007 to 2008 (Gamberoni and Newfarmer 2009).
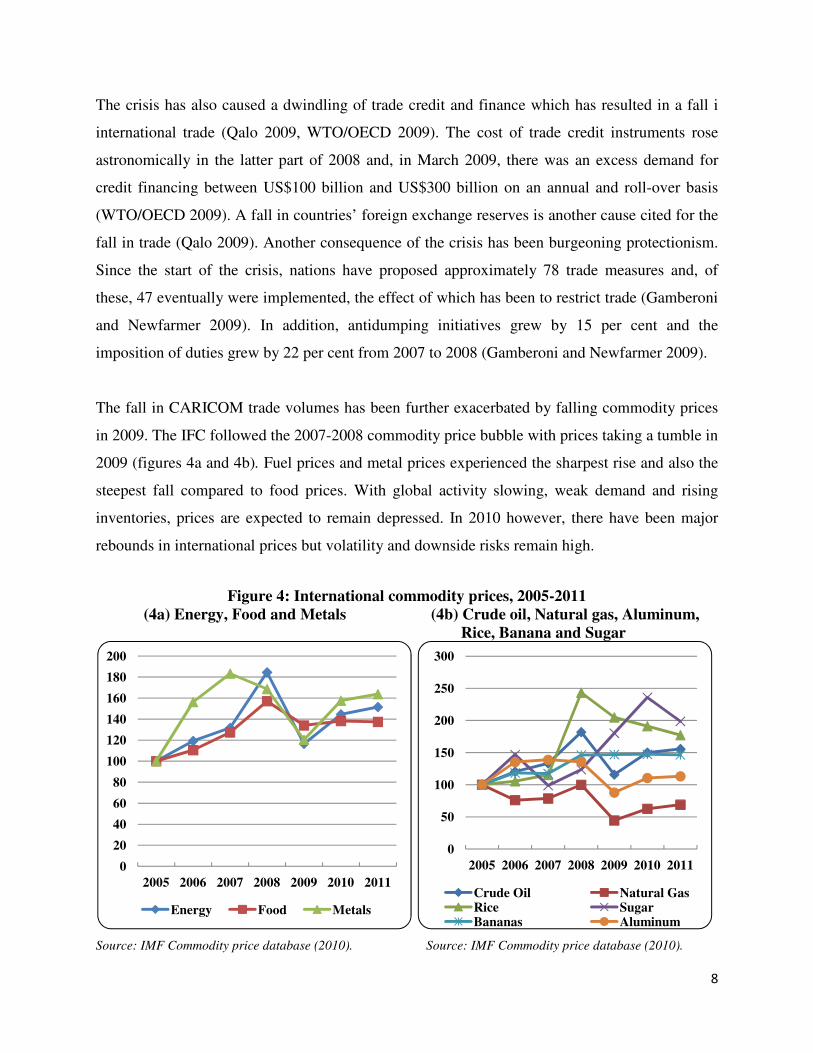
The fall in CARICOM trade volumes has been further exacerbated by falling commodity prices
in 2009. The IFC followed the 2007-2008 commodity price bubble with prices taking a tumble in
2009 (figures 4a and 4b). Fuel prices and metal prices experienced the sharpest rise and also the
steepest fall compared to food prices. With global activity slowing, weak demand and rising
inventories, prices are expected to remain depressed. In 2010 however, there have been major
rebounds in international prices but volatility and downside risks remain high.
Figure 4: International commodity prices, 2005-2011 (4a) Energy, Food and Metals (4b) Crude oil, Natural gas, Aluminum,
Rice, Banana and Sugar
Source: IMF Commodity price database (2010). Source: IMF Commodity price database (2010).
0
20
40
60
80
100
120
140
160
180
200
2005 2006 2007 2008 2009 2010 2011
Energy Food Metals
0
50
100
150
200
250
300
2005 2006 2007 2008 2009 2010 2011
Crude Oil Natural GasRice SugarBananas Aluminum
9
3.1.1. Tourism
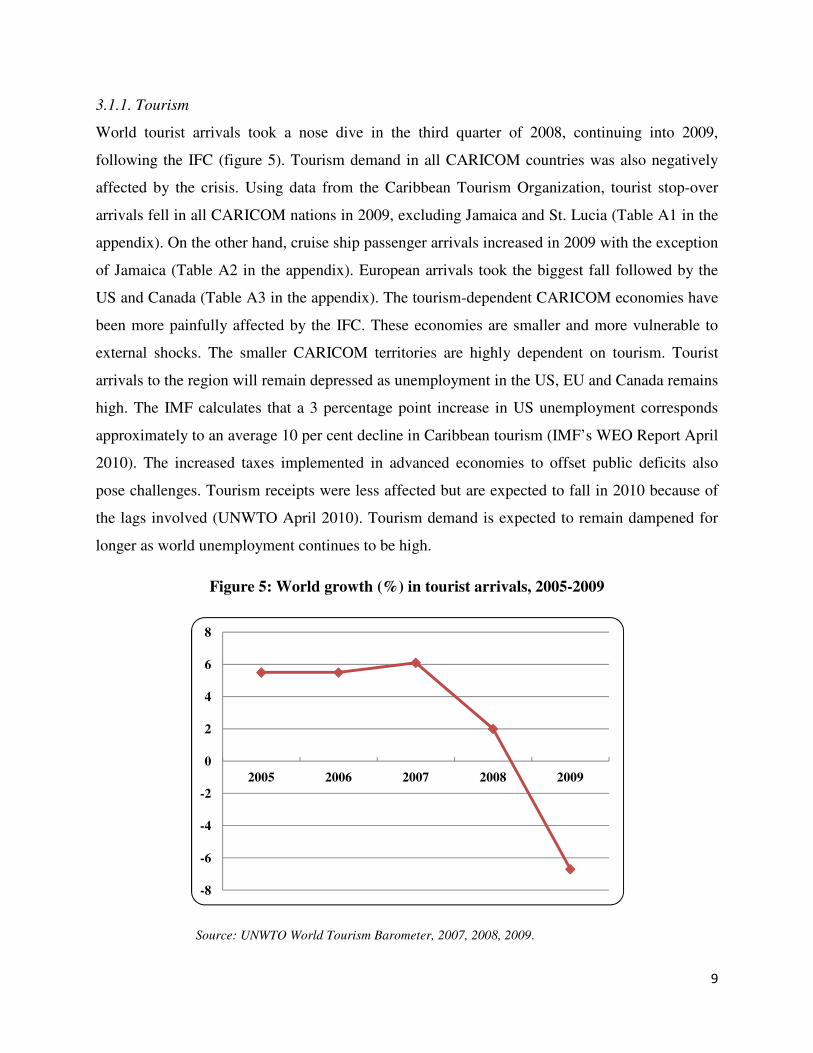
World tourist arrivals took a nose dive in the third quarter of 2008, continuing into 2009,
following the IFC (figure 5). Tourism demand in all CARICOM countries was also negatively
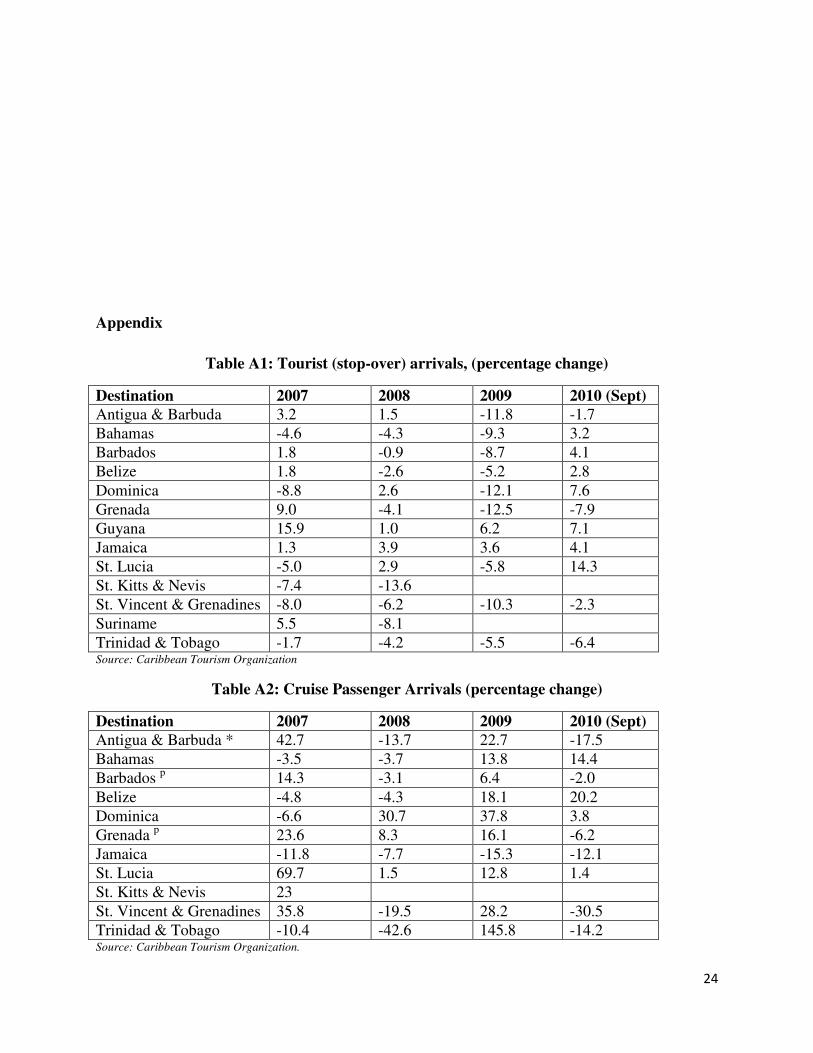
affected by the crisis. Using data from the Caribbean Tourism Organization, tourist stop-over
arrivals fell in all CARICOM nations in 2009, excluding Jamaica and St. Lucia (Table A1 in the
appendix). On the other hand, cruise ship passenger arrivals increased in 2009 with the exception
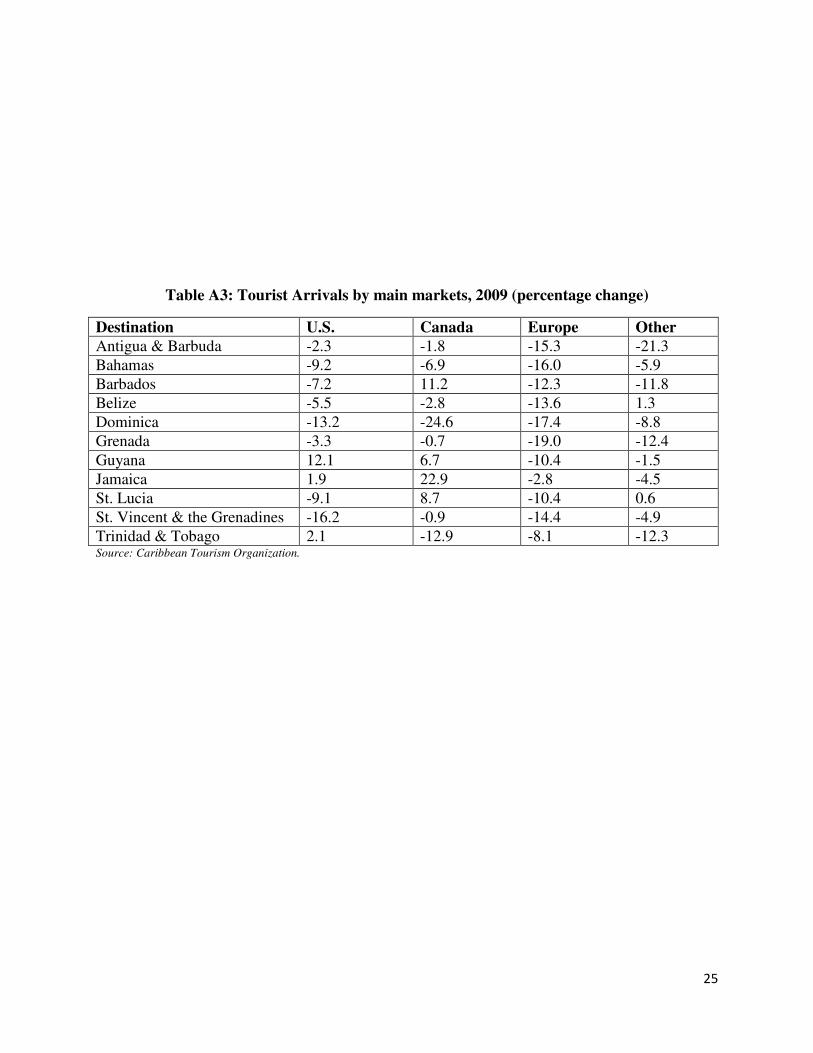
of Jamaica (Table A2 in the appendix). European arrivals took the biggest fall followed by the
US and Canada (Table A3 in the appendix). The tourism-dependent CARICOM economies have
been more painfully affected by the IFC. These economies are smaller and more vulnerable to
external shocks. The smaller CARICOM territories are highly dependent on tourism. Tourist
arrivals to the region will remain depressed as unemployment in the US, EU and Canada remains
high. The IMF calculates that a 3 percentage point increase in US unemployment corresponds
approximately to an average 10 per cent decline in Caribbean tourism (IMF’s WEO Report April
2010). The increased taxes implemented in advanced economies to offset public deficits also
pose challenges. Tourism receipts were less affected but are expected to fall in 2010 because of
the lags involved (UNWTO April 2010). Tourism demand is expected to remain dampened for
longer as world unemployment continues to be high.
Figure 5: World growth (%) in tourist arrivals, 2005-2009
Source: UNWTO World Tourism Barometer, 2007, 2008, 2009.
-8
-6
-4
-2
0
2
4
6
8
2005 2006 2007 2008 2009
10
3.2. International Private Capital Flows
The flow of capital like trade was severely affected by the IFC impacting the capital account of
the balance of payment. Prior to the IFC net foreign private capital flows especially to
developing countries had surged stimulating growth in these economies. However, the onset of
the crisis has led to sudden stops and even reversals of these flows.
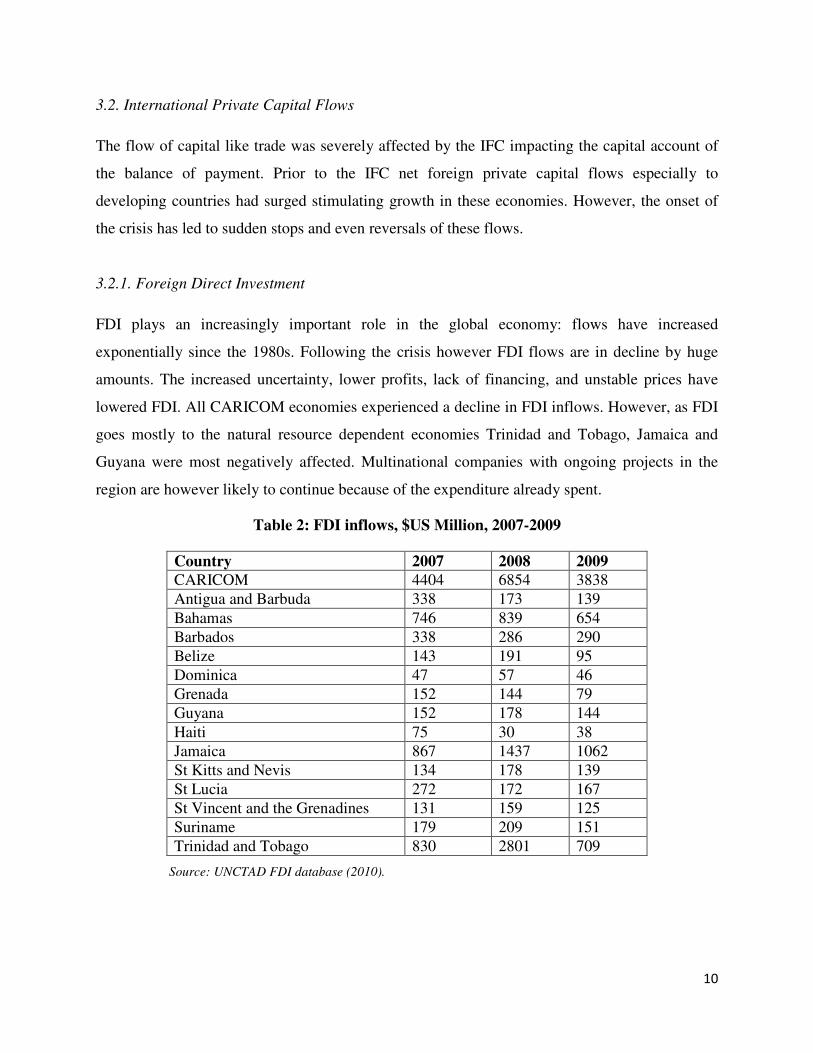
3.2.1. Foreign Direct Investment
FDI plays an increasingly important role in the global economy: flows have increased
exponentially since the 1980s. Following the crisis however FDI flows are in decline by huge
amounts. The increased uncertainty, lower profits, lack of financing, and unstable prices have
lowered FDI. All CARICOM economies experienced a decline in FDI inflows. However, as FDI
goes mostly to the natural resource dependent economies Trinidad and Tobago, Jamaica and
Guyana were most negatively affected. Multinational companies with ongoing projects in the
region are however likely to continue because of the expenditure already spent.
Table 2: FDI inflows, $US Million, 2007-2009
Country 2007 2008 2009 CARICOM 4404 6854 3838
Antigua and Barbuda 338 173 139
Bahamas 746 839 654
Barbados 338 286 290
Belize 143 191 95
Dominica 47 57 46
Grenada 152 144 79
Guyana 152 178 144
Haiti 75 30 38
Jamaica 867 1437 1062
St Kitts and Nevis 134 178 139
St Lucia 272 172 167
St Vincent and the Grenadines 131 159 125
Suriname 179 209 151
Trinidad and Tobago 830 2801 709
Source: UNCTAD FDI database (2010).
11
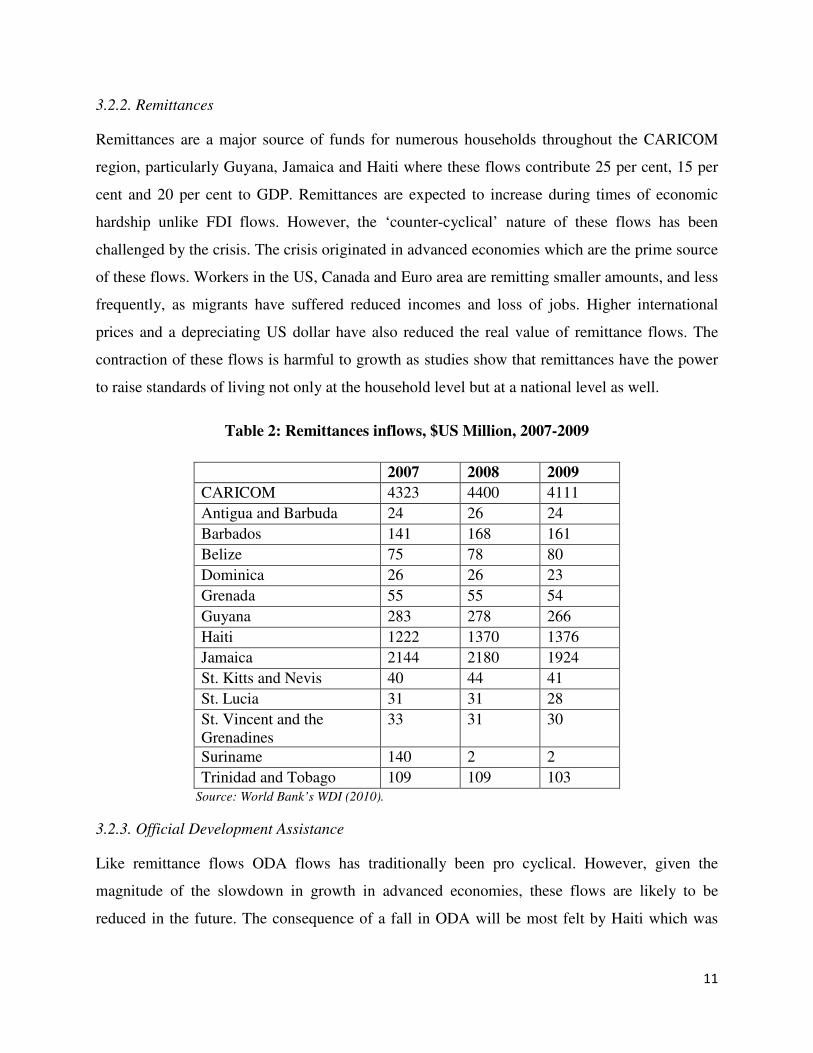
3.2.2. Remittances
Remittances are a major source of funds for numerous households throughout the CARICOM
region, particularly Guyana, Jamaica and Haiti where these flows contribute 25 per cent, 15 per
cent and 20 per cent to GDP. Remittances are expected to increase during times of economic
hardship unlike FDI flows. However, the ‘counter-cyclical’ nature of these flows has been
challenged by the crisis. The crisis originated in advanced economies which are the prime source
of these flows. Workers in the US, Canada and Euro area are remitting smaller amounts, and less
frequently, as migrants have suffered reduced incomes and loss of jobs. Higher international
prices and a depreciating US dollar have also reduced the real value of remittance flows. The
contraction of these flows is harmful to growth as studies show that remittances have the power
to raise standards of living not only at the household level but at a national level as well.
Table 2: Remittances inflows, $US Million, 2007-2009
2007 2008 2009
CARICOM 4323 4400 4111
Antigua and Barbuda 24 26 24
Barbados 141 168 161
Belize 75 78 80
Dominica 26 26 23
Grenada 55 55 54
Guyana 283 278 266
Haiti 1222 1370 1376
Jamaica 2144 2180 1924
St. Kitts and Nevis 40 44 41
St. Lucia 31 31 28
St. Vincent and the Grenadines
33 31 30
Suriname 140 2 2
Trinidad and Tobago 109 109 103 Source: World Bank’s WDI (2010).
3.2.3. Official Development Assistance
Like remittance flows ODA flows has traditionally been pro cyclical. However, given the
magnitude of the slowdown in growth in advanced economies, these flows are likely to be
reduced in the future. The consequence of a fall in ODA will be most felt by Haiti which was

12
endured a catastrophic earthquake in the beginning of 2010 and is most dependent CARICOM
nation on ODA. Table three provides information on ODA to CARICOM countries.
Table 3: Total Net bilateral aid flow from donor countries, $US Million, 2006-2008
2006 2007 2008
CARICOM 656 909 1084
Antigua and Barbuda 3 4 3
Barbados -1 13 4
Belize 7 13 17
Dominica 15 18 19
Grenada 8 6 11
Guyana 64 57 95
Haiti 446 532 674
Jamaica 32 23 70
St. Kitts and Nevis 6 5 43
St. Lucia 2 12 15
St. Vincent and the Grenadines
4 62 23
Suriname 58 146 99
Trinidad and Tobago 11 180 116 Source: World Bank’s WDI (2010).
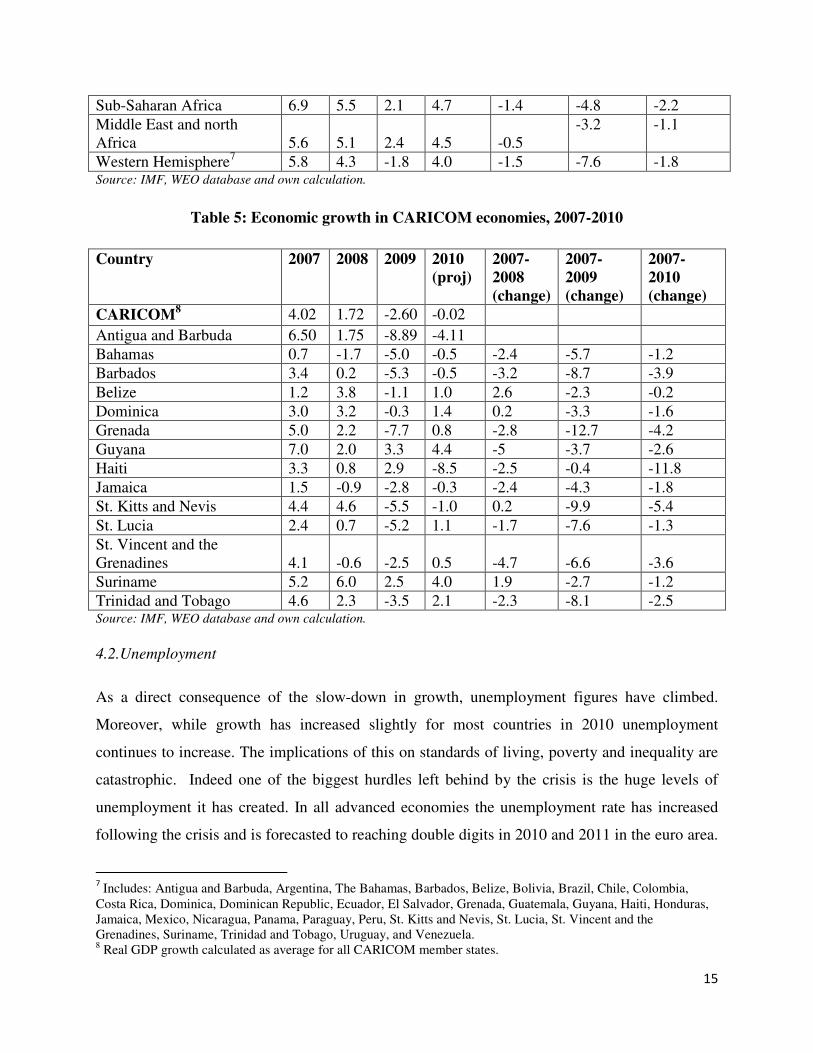
4. The Impact of the IFC on the CARICOM Macroeconomy
4.1. Impact of the crisis on economic growth
Most countries of the world experienced a slowdown in growth following the crisis. The change
in the rate of growth is calculated for country groupings (Table 4) and individual CARICOM
economies (Table 5) for 2007 to 2010 using the IMF’s WEO Report (October 2010). The change
is computed by taking the absolute difference in the value of the real GDP growth rates between
2007 and 2010. This method avoids calculating large declines in growth for countries that had
low growth rates prior to the crisis in 2007 (Goldstein and Xie 2009).
The downturn was severe and global in nature as all country groupings were negatively affected
in 2008, 2009 and 2010 (estimate) subsequent to the crisis (table 4). The full impact of the crisis
occurred in 2009 which recorded the largest decline in growth. World real GDP growth declined
from 5.2 per cent in 2007 to negative 0.6 per cent in 2009, a fall in the growth rate of 5.8 per
cent. The decline is expected to slow in 2010 with a growth rate of 4.2 per cent.
13
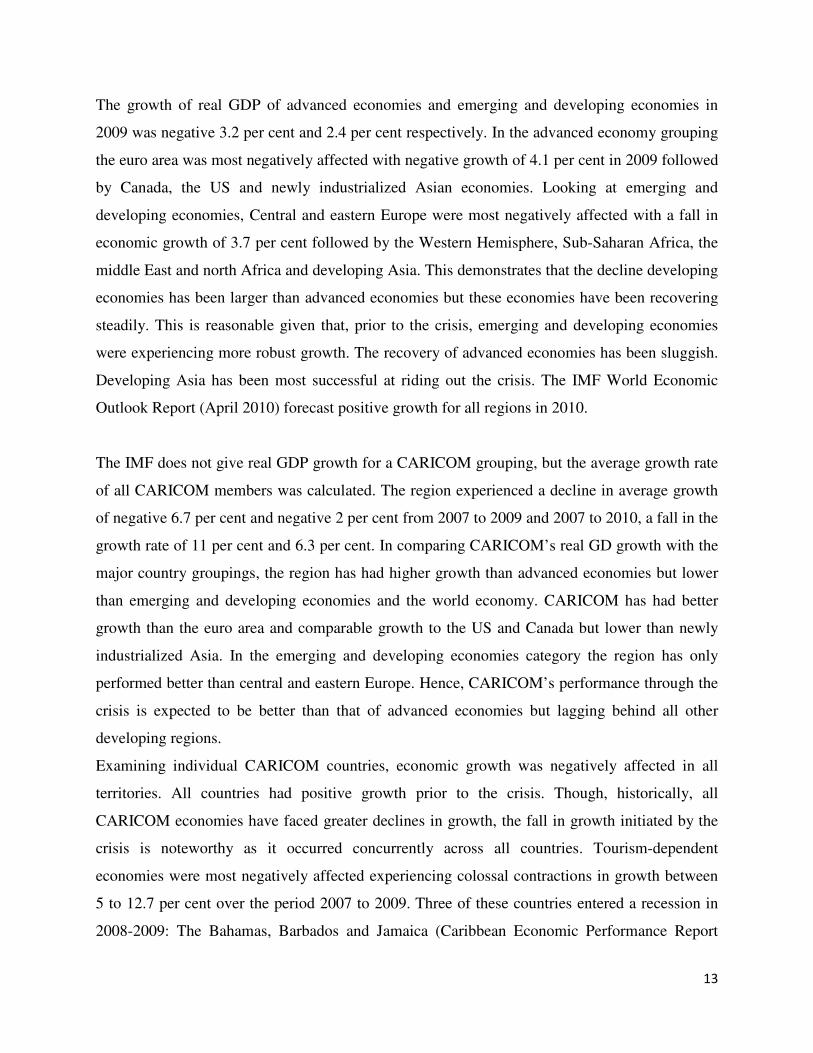
The growth of real GDP of advanced economies and emerging and developing economies in
2009 was negative 3.2 per cent and 2.4 per cent respectively. In the advanced economy grouping
the euro area was most negatively affected with negative growth of 4.1 per cent in 2009 followed
by Canada, the US and newly industrialized Asian economies. Looking at emerging and
developing economies, Central and eastern Europe were most negatively affected with a fall in
economic growth of 3.7 per cent followed by the Western Hemisphere, Sub-Saharan Africa, the
middle East and north Africa and developing Asia. This demonstrates that the decline developing
economies has been larger than advanced economies but these economies have been recovering
steadily. This is reasonable given that, prior to the crisis, emerging and developing economies
were experiencing more robust growth. The recovery of advanced economies has been sluggish.
Developing Asia has been most successful at riding out the crisis. The IMF World Economic
Outlook Report (April 2010) forecast positive growth for all regions in 2010.
The IMF does not give real GDP growth for a CARICOM grouping, but the average growth rate
of all CARICOM members was calculated. The region experienced a decline in average growth
of negative 6.7 per cent and negative 2 per cent from 2007 to 2009 and 2007 to 2010, a fall in the
growth rate of 11 per cent and 6.3 per cent. In comparing CARICOM’s real GD growth with the
major country groupings, the region has had higher growth than advanced economies but lower
than emerging and developing economies and the world economy. CARICOM has had better
growth than the euro area and comparable growth to the US and Canada but lower than newly
industrialized Asia. In the emerging and developing economies category the region has only
performed better than central and eastern Europe. Hence, CARICOM’s performance through the
crisis is expected to be better than that of advanced economies but lagging behind all other
developing regions.
Examining individual CARICOM countries, economic growth was negatively affected in all
territories. All countries had positive growth prior to the crisis. Though, historically, all
CARICOM economies have faced greater declines in growth, the fall in growth initiated by the
crisis is noteworthy as it occurred concurrently across all countries. Tourism-dependent
economies were most negatively affected experiencing colossal contractions in growth between
5 to 12.7 per cent over the period 2007 to 2009. Three of these countries entered a recession in
2008-2009: The Bahamas, Barbados and Jamaica (Caribbean Economic Performance Report
14
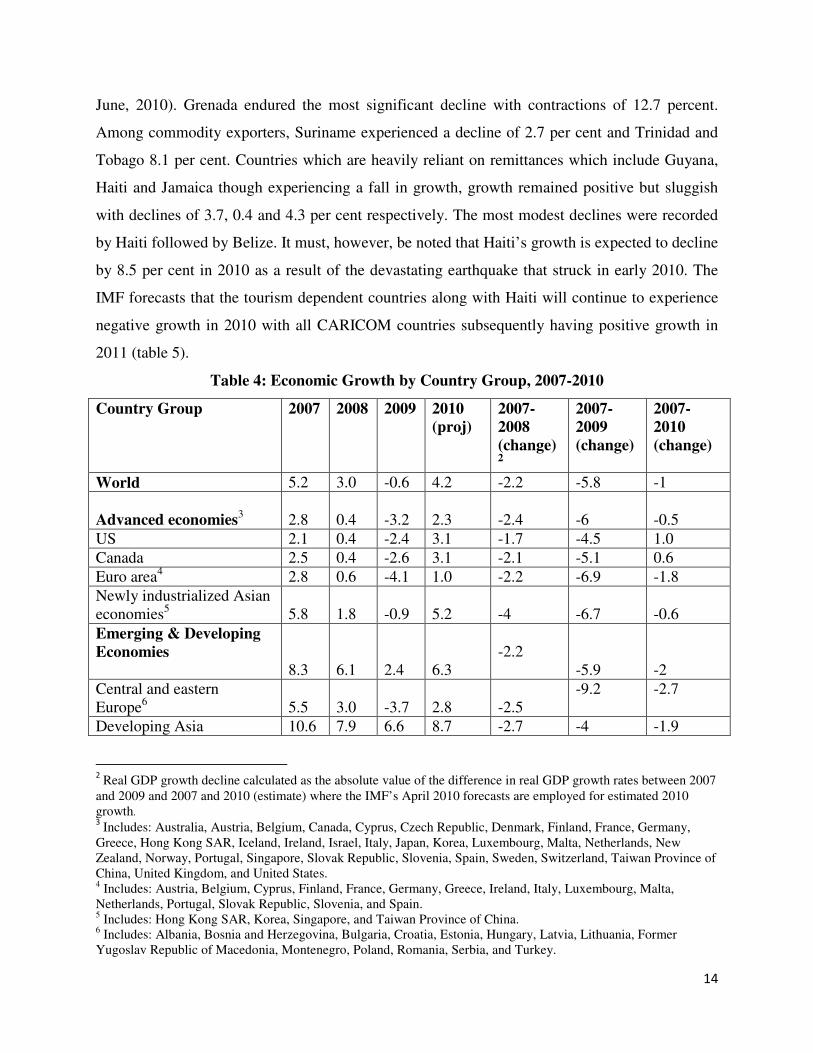
June, 2010). Grenada endured the most significant decline with contractions of 12.7 percent.
Among commodity exporters, Suriname experienced a decline of 2.7 per cent and Trinidad and
Tobago 8.1 per cent. Countries which are heavily reliant on remittances which include Guyana,
Haiti and Jamaica though experiencing a fall in growth, growth remained positive but sluggish
with declines of 3.7, 0.4 and 4.3 per cent respectively. The most modest declines were recorded
by Haiti followed by Belize. It must, however, be noted that Haiti’s growth is expected to decline
by 8.5 per cent in 2010 as a result of the devastating earthquake that struck in early 2010. The
IMF forecasts that the tourism dependent countries along with Haiti will continue to experience
negative growth in 2010 with all CARICOM countries subsequently having positive growth in
2011 (table 5).
Table 4: Economic Growth by Country Group, 2007-2010
Country Group 2007 2008 2009 2010 (proj)
2007-2008 (change)2
2007-2009 (change)
2007- 2010 (change)
World 5.2 3.0 -0.6 4.2 -2.2 -5.8 -1
Advanced economies3 2.8 0.4 -3.2 2.3
-2.4
-6
-0.5
US 2.1 0.4 -2.4 3.1 -1.7 -4.5 1.0
Canada 2.5 0.4 -2.6 3.1 -2.1 -5.1 0.6
Euro area4 2.8 0.6 -4.1 1.0 -2.2 -6.9 -1.8
Newly industrialized Asian
economies5 5.8 1.8 -0.9 5.2 -4
-6.7
-0.6
Emerging & Developing Economies
8.3 6.1 2.4 6.3
-2.2
-5.9
-2
Central and eastern Europe6 5.5 3.0 -3.7 2.8
-2.5
-9.2 -2.7
Developing Asia 10.6 7.9 6.6 8.7 -2.7 -4 -1.9
2 Real GDP growth decline calculated as the absolute value of the difference in real GDP growth rates between 2007
and 2009 and 2007 and 2010 (estimate) where the IMF’s April 2010 forecasts are employed for estimated 2010 growth. 3 Includes: Australia, Austria, Belgium, Canada, Cyprus, Czech Republic, Denmark, Finland, France, Germany,
Greece, Hong Kong SAR, Iceland, Ireland, Israel, Italy, Japan, Korea, Luxembourg, Malta, Netherlands, New Zealand, Norway, Portugal, Singapore, Slovak Republic, Slovenia, Spain, Sweden, Switzerland, Taiwan Province of China, United Kingdom, and United States. 4 Includes: Austria, Belgium, Cyprus, Finland, France, Germany, Greece, Ireland, Italy, Luxembourg, Malta, Netherlands, Portugal, Slovak Republic, Slovenia, and Spain. 5 Includes: Hong Kong SAR, Korea, Singapore, and Taiwan Province of China. 6 Includes: Albania, Bosnia and Herzegovina, Bulgaria, Croatia, Estonia, Hungary, Latvia, Lithuania, Former Yugoslav Republic of Macedonia, Montenegro, Poland, Romania, Serbia, and Turkey.
15
Sub-Saharan Africa 6.9 5.5 2.1 4.7 -1.4 -4.8 -2.2
Middle East and north Africa 5.6 5.1 2.4 4.5
-0.5
-3.2 -1.1
Western Hemisphere7 5.8 4.3 -1.8 4.0 -1.5 -7.6 -1.8 Source: IMF, WEO database and own calculation.
Table 5: Economic growth in CARICOM economies, 2007-2010
Country 2007 2008 2009 2010 (proj)
2007-2008 (change)
2007-2009 (change)
2007- 2010 (change)
CARICOM8 4.02 1.72 -2.60 -0.02
Antigua and Barbuda 6.50 1.75 -8.89 -4.11
Bahamas 0.7 -1.7 -5.0 -0.5 -2.4 -5.7 -1.2
Barbados 3.4 0.2 -5.3 -0.5 -3.2 -8.7 -3.9
Belize 1.2 3.8 -1.1 1.0 2.6 -2.3 -0.2
Dominica 3.0 3.2 -0.3 1.4 0.2 -3.3 -1.6
Grenada 5.0 2.2 -7.7 0.8 -2.8 -12.7 -4.2
Guyana 7.0 2.0 3.3 4.4 -5 -3.7 -2.6
Haiti 3.3 0.8 2.9 -8.5 -2.5 -0.4 -11.8
Jamaica 1.5 -0.9 -2.8 -0.3 -2.4 -4.3 -1.8
St. Kitts and Nevis 4.4 4.6 -5.5 -1.0 0.2 -9.9 -5.4
St. Lucia 2.4 0.7 -5.2 1.1 -1.7 -7.6 -1.3
St. Vincent and the Grenadines
4.1
-0.6
-2.5
0.5
-4.7
-6.6
-3.6
Suriname 5.2 6.0 2.5 4.0 1.9 -2.7 -1.2
Trinidad and Tobago 4.6 2.3 -3.5 2.1 -2.3 -8.1 -2.5 Source: IMF, WEO database and own calculation.
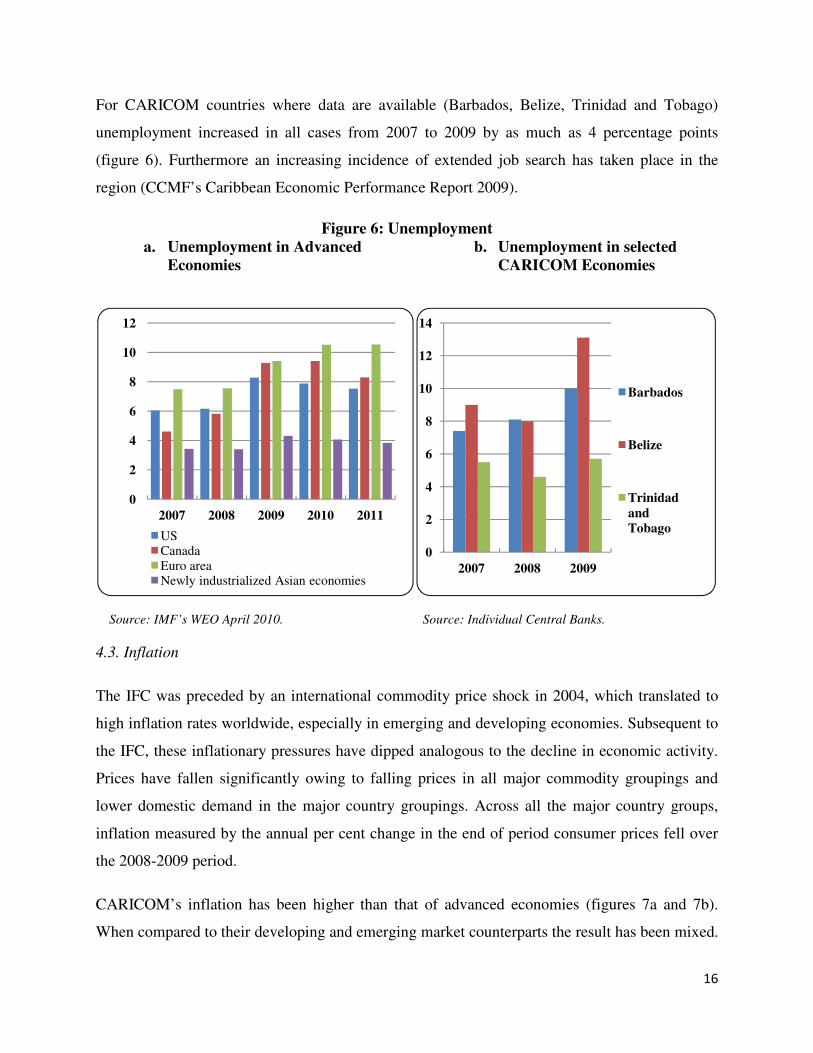
4.2.Unemployment
As a direct consequence of the slow-down in growth, unemployment figures have climbed.
Moreover, while growth has increased slightly for most countries in 2010 unemployment
continues to increase. The implications of this on standards of living, poverty and inequality are
catastrophic. Indeed one of the biggest hurdles left behind by the crisis is the huge levels of
unemployment it has created. In all advanced economies the unemployment rate has increased
following the crisis and is forecasted to reaching double digits in 2010 and 2011 in the euro area.
7 Includes: Antigua and Barbuda, Argentina, The Bahamas, Barbados, Belize, Bolivia, Brazil, Chile, Colombia,
Costa Rica, Dominica, Dominican Republic, Ecuador, El Salvador, Grenada, Guatemala, Guyana, Haiti, Honduras, Jamaica, Mexico, Nicaragua, Panama, Paraguay, Peru, St. Kitts and Nevis, St. Lucia, St. Vincent and the Grenadines, Suriname, Trinidad and Tobago, Uruguay, and Venezuela. 8 Real GDP growth calculated as average for all CARICOM member states.
16
For CARICOM countries where data are available (Barbados, Belize, Trinidad and Tobago)
unemployment increased in all cases from 2007 to 2009 by as much as 4 percentage points
(figure 6). Furthermore an increasing incidence of extended job search has taken place in the
region (CCMF’s Caribbean Economic Performance Report 2009).
Figure 6: Unemployment a. Unemployment in Advanced
Economies b. Unemployment in selected
CARICOM Economies
Source: IMF’s WEO April 2010. Source: Individual Central Banks.
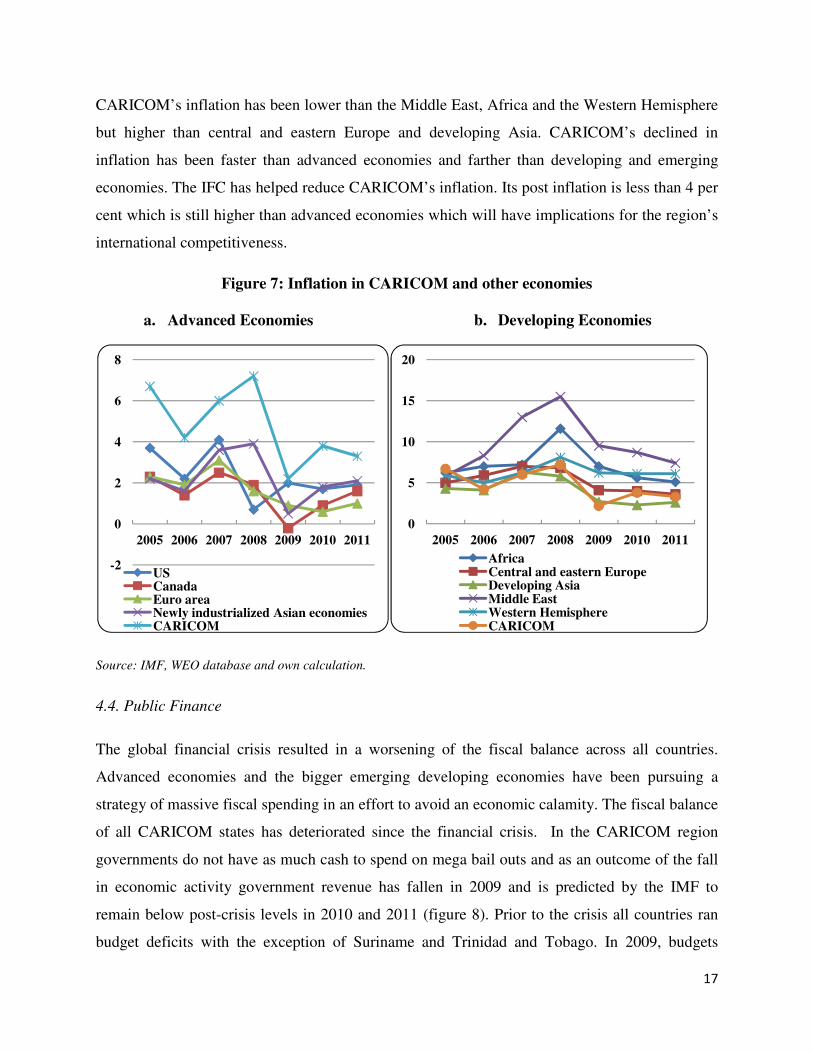
4.3. Inflation
The IFC was preceded by an international commodity price shock in 2004, which translated to
high inflation rates worldwide, especially in emerging and developing economies. Subsequent to
the IFC, these inflationary pressures have dipped analogous to the decline in economic activity.
Prices have fallen significantly owing to falling prices in all major commodity groupings and
lower domestic demand in the major country groupings. Across all the major country groups,
inflation measured by the annual per cent change in the end of period consumer prices fell over
the 2008-2009 period.
CARICOM’s inflation has been higher than that of advanced economies (figures 7a and 7b).
When compared to their developing and emerging market counterparts the result has been mixed.
0
2
4
6
8
10
12
2007 2008 2009 2010 2011
USCanadaEuro area Newly industrialized Asian economies
0
2
4
6
8
10
12
14
2007 2008 2009
Barbados
Belize
Trinidad and Tobago
17
CARICOM’s inflation has been lower than the Middle East, Africa and the Western Hemisphere
but higher than central and eastern Europe and developing Asia. CARICOM’s declined in
inflation has been faster than advanced economies and farther than developing and emerging
economies. The IFC has helped reduce CARICOM’s inflation. Its post inflation is less than 4 per
cent which is still higher than advanced economies which will have implications for the region’s
international competitiveness.
Figure 7: Inflation in CARICOM and other economies
a. Advanced Economies b. Developing Economies
Source: IMF, WEO database and own calculation.
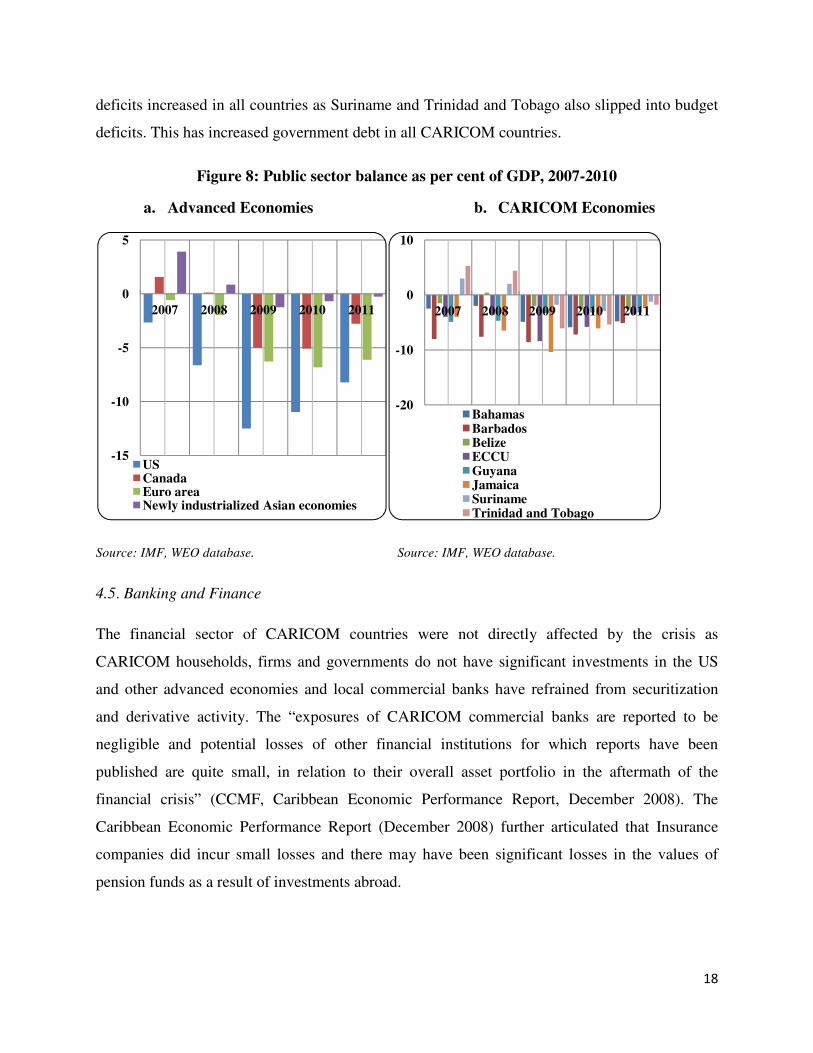
4.4. Public Finance
The global financial crisis resulted in a worsening of the fiscal balance across all countries.
Advanced economies and the bigger emerging developing economies have been pursuing a
strategy of massive fiscal spending in an effort to avoid an economic calamity. The fiscal balance
of all CARICOM states has deteriorated since the financial crisis. In the CARICOM region
governments do not have as much cash to spend on mega bail outs and as an outcome of the fall
in economic activity government revenue has fallen in 2009 and is predicted by the IMF to
remain below post-crisis levels in 2010 and 2011 (figure 8). Prior to the crisis all countries ran
budget deficits with the exception of Suriname and Trinidad and Tobago. In 2009, budgets
-2
0
2
4
6
8
2005 2006 2007 2008 2009 2010 2011
USCanadaEuro area Newly industrialized Asian economiesCARICOM
0
5
10
15
20
2005 2006 2007 2008 2009 2010 2011
AfricaCentral and eastern EuropeDeveloping AsiaMiddle EastWestern HemisphereCARICOM
18
deficits increased in all countries as Suriname and Trinidad and Tobago also slipped into budget
deficits. This has increased government debt in all CARICOM countries.
Figure 8: Public sector balance as per cent of GDP, 2007-2010
a. Advanced Economies b. CARICOM Economies
Source: IMF, WEO database. Source: IMF, WEO database.
4.5. Banking and Finance
The financial sector of CARICOM countries were not directly affected by the crisis as
CARICOM households, firms and governments do not have significant investments in the US
and other advanced economies and local commercial banks have refrained from securitization
and derivative activity. The “exposures of CARICOM commercial banks are reported to be
negligible and potential losses of other financial institutions for which reports have been
published are quite small, in relation to their overall asset portfolio in the aftermath of the
financial crisis” (CCMF, Caribbean Economic Performance Report, December 2008). The
Caribbean Economic Performance Report (December 2008) further articulated that Insurance
companies did incur small losses and there may have been significant losses in the values of
pension funds as a result of investments abroad.
-15
-10
-5
0
5
2007 2008 2009 2010 2011
USCanadaEuro area Newly industrialized Asian economies
-20
-10
0
10
2007 2008 2009 2010 2011
BahamasBarbadosBelizeECCUGuyanaJamaicaSurinameTrinidad and Tobago
19
The falling output, as well as a decline in employment, government revenue, FDI and foreign
portfolio investment and increased pressures on the exchange rates have impacted on the
financial sector of CARICOM countries. The main risk facing the financial systems in the region
is credit risk stemming from depressed economic conditions. There has also been increased risk
aversion which had led to slower credit, falling financial asset prices and lower interest rates
(CCMF, Caribbean Economic Performance Report, December 2009). The January 2009 collapse
of the Trinidad and Tobago based CL Financial Group and the collapse of the Stanford Financial
Group in Antigua and Barbuda have compounded the increased risk aversion. Both experiences
point to the need to improve regional regulation and cross-border cooperation. The fiscal expense
of dealing with these collapses is still indeterminate. Higher exposure and high debt levels in
several countries in the rest of the Caribbean pose significant challenges in dealing with the
problems created by the CL’s insurance subsidiaries, the Colonial Life Insurance Company
(CLICO) and the British American Insurance Company (BAICO).
In addition, the crisis has brought with it an increase in regulation costs for CARICOM countries
with Offshore Financial Centers. These countries are required to comply with increasingly
tighter international standards (spearheaded by the G20) in fiscal/tax and financial regulatory
areas (IMF, World Economic Outlook, 2010). This represents an additional cost and applies
mainly to the eastern Caribbean countries which have already had significant reductions in
growth from lower tourism demand.
4.6. External Accounts
CARICOM economies recorded a widespread deterioration in their external accounts. Preceding
the crisis all countries apart from Suriname and Trinidad and Tobago had current account deficits
(table A5). Following the crisis these deficits have grown in size with Suriname also slipping
into a deficit. Trinidad and Tobago retained its surplus despite the fact that it dwindled. This has
contributed to higher debt levels. Foreign Direct Investment (FDI), portfolio investment and
reserves have also been negatively affected. The global recession largely manifested itself in
terms of a collapse in commodity prices and a fall in tourism demand in most countries. The fall
in non agriculture commodity prices was more severe than the fall out in agriculture prices
(figure). Regional exports struggled in 2009, as exports declined in most territories, except for

20
the ECCU where it actually increased by 4.1 per cent for the year largely on account of its
performances in the first and second quarter. The most dramatic declines in exports were
registered by Guyana where they fell by 66.4 per cent and in Trinidad and Tobago where exports
halved (50.6 per cent).
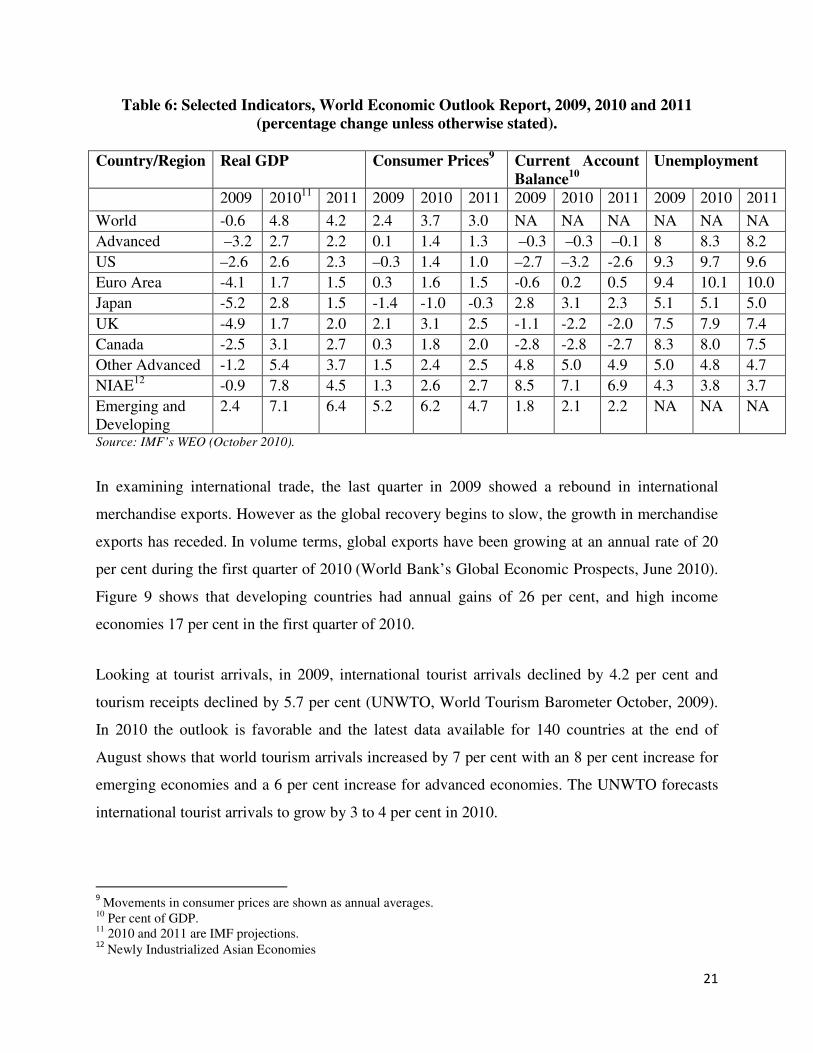
5. The Global Outlook
While there has been some recovery from the crisis in 2010 significant uncertainties prevail. The
main economic indicators for major country groupings from the IMF’s WEO Report (October
2010) are summarized in table 6. From the table global economic activity is forecasted to grow
by 4.8 per cent in 2010 and 4.2 per cent in 2011. For advanced economies growth is projected at
2.7 and 2.2 per cent, respectively with Euro area slowing considerably more and for emerging.
Growth for the newly Industrialized Asian economies will slow by almost half in 2011 compared
to 2010. Developing economies, growth will expand at rates of 7.1 and 6.4 per cent, in 2010 and
2011 respectively. Unemployment is expected to remain persistently high. Current account
imbalances between advanced and emerging and developing economies are predicted to persist.
Inflation is projected to remain low generally with slightly higher rates in the emerging and
developing economies.
The report further states the downside risk remains and recovery rests on two rebalancing acts,
fiscal consolidation and current account imbalances. Furthermore, the global financial system is
yet to recover and there exists considerable uncertainty as significant sovereign and banking
vulnerabilities exist. These balance sheets are highly vulnerable to growth shocks, making debt
sustainability less certain, prices in stock exchanges have fallen and the risk premiums on
corporate bonds have widened, and corporate bond issues have slowed (Global Financial
Stability Report October 2010). As the recovery progresses the momentum gained from fiscal
stimulus is slowing and growth must now be determined by private investment and household
consumption.
21
Table 6: Selected Indicators, World Economic Outlook Report, 2009, 2010 and 2011 (percentage change unless otherwise stated).
Country/Region Real GDP Consumer Prices9 Current Account
Balance10 Unemployment
2009 201011 2011 2009 2010 2011 2009 2010 2011 2009 2010 2011
World -0.6 4.8 4.2 2.4 3.7 3.0 NA NA NA NA NA NA
Advanced –3.2 2.7 2.2 0.1 1.4 1.3 –0.3 –0.3 –0.1 8 8.3 8.2
US –2.6 2.6 2.3 –0.3 1.4 1.0 –2.7 –3.2 -2.6 9.3 9.7 9.6
Euro Area -4.1 1.7 1.5 0.3 1.6 1.5 -0.6 0.2 0.5 9.4 10.1 10.0
Japan -5.2 2.8 1.5 -1.4 -1.0 -0.3 2.8 3.1 2.3 5.1 5.1 5.0
UK -4.9 1.7 2.0 2.1 3.1 2.5 -1.1 -2.2 -2.0 7.5 7.9 7.4
Canada -2.5 3.1 2.7 0.3 1.8 2.0 -2.8 -2.8 -2.7 8.3 8.0 7.5
Other Advanced -1.2 5.4 3.7 1.5 2.4 2.5 4.8 5.0 4.9 5.0 4.8 4.7
NIAE12 -0.9 7.8 4.5 1.3 2.6 2.7 8.5 7.1 6.9 4.3 3.8 3.7
Emerging and Developing
2.4 7.1 6.4 5.2 6.2 4.7 1.8 2.1 2.2 NA NA NA
Source: IMF’s WEO (October 2010).
In examining international trade, the last quarter in 2009 showed a rebound in international
merchandise exports. However as the global recovery begins to slow, the growth in merchandise
exports has receded. In volume terms, global exports have been growing at an annual rate of 20
per cent during the first quarter of 2010 (World Bank’s Global Economic Prospects, June 2010).
Figure 9 shows that developing countries had annual gains of 26 per cent, and high income
economies 17 per cent in the first quarter of 2010.
Looking at tourist arrivals, in 2009, international tourist arrivals declined by 4.2 per cent and
tourism receipts declined by 5.7 per cent (UNWTO, World Tourism Barometer October, 2009).
In 2010 the outlook is favorable and the latest data available for 140 countries at the end of
August shows that world tourism arrivals increased by 7 per cent with an 8 per cent increase for
emerging economies and a 6 per cent increase for advanced economies. The UNWTO forecasts
international tourist arrivals to grow by 3 to 4 per cent in 2010.
9 Movements in consumer prices are shown as annual averages.
10 Per cent of GDP. 11 2010 and 2011 are IMF projections. 12
Newly Industrialized Asian Economies
22
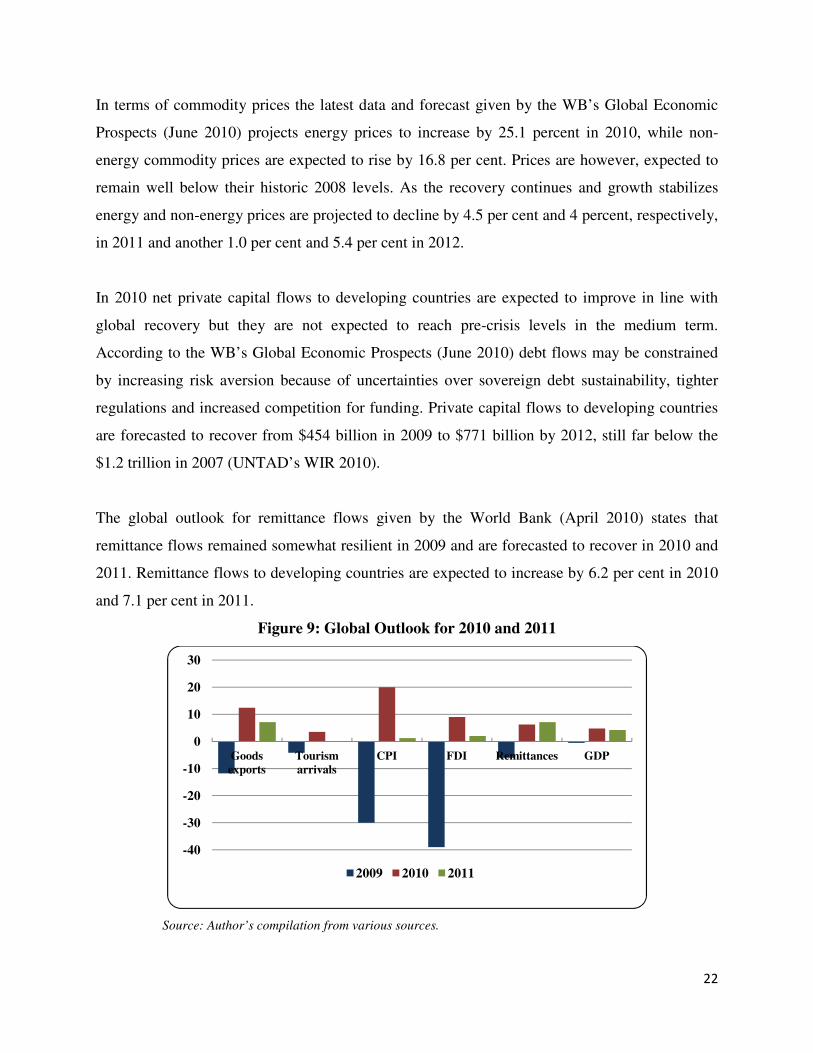
In terms of commodity prices the latest data and forecast given by the WB’s Global Economic
Prospects (June 2010) projects energy prices to increase by 25.1 percent in 2010, while non-
energy commodity prices are expected to rise by 16.8 per cent. Prices are however, expected to
remain well below their historic 2008 levels. As the recovery continues and growth stabilizes
energy and non-energy prices are projected to decline by 4.5 per cent and 4 percent, respectively,
in 2011 and another 1.0 per cent and 5.4 per cent in 2012.
In 2010 net private capital flows to developing countries are expected to improve in line with
global recovery but they are not expected to reach pre-crisis levels in the medium term.
According to the WB’s Global Economic Prospects (June 2010) debt flows may be constrained
by increasing risk aversion because of uncertainties over sovereign debt sustainability, tighter
regulations and increased competition for funding. Private capital flows to developing countries
are forecasted to recover from $454 billion in 2009 to $771 billion by 2012, still far below the
$1.2 trillion in 2007 (UNTAD’s WIR 2010).
The global outlook for remittance flows given by the World Bank (April 2010) states that
remittance flows remained somewhat resilient in 2009 and are forecasted to recover in 2010 and
2011. Remittance flows to developing countries are expected to increase by 6.2 per cent in 2010
and 7.1 per cent in 2011.
Figure 9: Global Outlook for 2010 and 2011
Source: Author’s compilation from various sources.
-40
-30
-20
-10
0
10
20
30
Goods exports
Tourism arrivals
CPI FDI Remittances GDP
2009 2010 2011
23
6. Conclusion
The IFC has negatively affected international trade and financial flows of CARICOM countries
resulting in a fall in economic growth. International financial flows have been more severely
affected particularly ODA followed by FDI. Remittances have been less negatively affected
though there was a decrease. In terms of international trade exports of goods and services were
more negatively affected than imports. However, merchandise exports fell more than services
exports which includes primarily tourism. Nevertheless, when looking at the impact of the crisis
on growth tourism dependent were most negatively impacted followed by remittance dependent
economies and least negatively impacted were economies than export goods. Tourism dependent
economies face great uncertainties as their recovery rests solely on activity in the tourism sector.
The remittance dependent economies are also most dependent on ODA which has an unfavorable
outlook. The remaining economies which are export merchandisers face a gloomy outlook as the
recent spike in international commodity prices in 2010 are unlikely to continue into 2011.
Moreover, world exports are predicted to decease in 2011. The FDI outlook in 2011 is also likely
to fall as international firms wrap up ongoing investments.
References
Caribbean Centre for Money and Finance, 2009, Caribbean Economic Performance Report.
Inter-American Development Bank, 2009, Remittances in Times of Financial Instability
(Washington, March).
International Monetary Fund, 2010, World Economic Outlook Report (Washington, April).
24
Appendix
Table A1: Tourist (stop-over) arrivals, (percentage change)
Destination 2007 2008 2009 2010 (Sept) Antigua & Barbuda 3.2 1.5 -11.8 -1.7
Bahamas -4.6 -4.3 -9.3 3.2
Barbados 1.8 -0.9 -8.7 4.1
Belize 1.8 -2.6 -5.2 2.8
Dominica -8.8 2.6 -12.1 7.6
Grenada 9.0 -4.1 -12.5 -7.9
Guyana 15.9 1.0 6.2 7.1
Jamaica 1.3 3.9 3.6 4.1
St. Lucia -5.0 2.9 -5.8 14.3
St. Kitts & Nevis -7.4 -13.6
St. Vincent & Grenadines -8.0 -6.2 -10.3 -2.3
Suriname 5.5 -8.1
Trinidad & Tobago -1.7 -4.2 -5.5 -6.4 Source: Caribbean Tourism Organization
Table A2: Cruise Passenger Arrivals (percentage change)
Destination 2007 2008 2009 2010 (Sept) Antigua & Barbuda * 42.7 -13.7 22.7 -17.5
Bahamas -3.5 -3.7 13.8 14.4
Barbados p 14.3 -3.1 6.4 -2.0
Belize -4.8 -4.3 18.1 20.2
Dominica -6.6 30.7 37.8 3.8
Grenada p 23.6 8.3 16.1 -6.2
Jamaica -11.8 -7.7 -15.3 -12.1
St. Lucia 69.7 1.5 12.8 1.4
St. Kitts & Nevis 23
St. Vincent & Grenadines 35.8 -19.5 28.2 -30.5
Trinidad & Tobago -10.4 -42.6 145.8 -14.2 Source: Caribbean Tourism Organization.
25
Table A3: Tourist Arrivals by main markets, 2009 (percentage change)
Destination U.S. Canada Europe Other Antigua & Barbuda -2.3 -1.8 -15.3 -21.3
Bahamas -9.2 -6.9 -16.0 -5.9
Barbados -7.2 11.2 -12.3 -11.8
Belize -5.5 -2.8 -13.6 1.3
Dominica -13.2 -24.6 -17.4 -8.8
Grenada -3.3 -0.7 -19.0 -12.4
Guyana 12.1 6.7 -10.4 -1.5
Jamaica 1.9 22.9 -2.8 -4.5
St. Lucia -9.1 8.7 -10.4 0.6
St. Vincent & the Grenadines -16.2 -0.9 -14.4 -4.9
Trinidad & Tobago 2.1 -12.9 -8.1 -12.3 Source: Caribbean Tourism Organization.


![Welcome [salises-srad.com] Programme days 2 and 3... · 2012. 9. 30. · 1 Welcome I’m very happy to welcome you on behalf of SALISES to this important conference on ‘Globalization,](https://img.pdfslide.us/doc/110x75/600bd24a68710629c363f815/welcome-salises-sradcom-programme-days-2-and-3-2012-9-30-1-welcome.jpg)


![Welcome [salises-srad.com]salises-srad.com/pdf/FINAL Programme days 2 and 3.pdf · partnership with C-Change Canada Caribbean, the Planning Institute of Jamaica, ... Hearing Community](https://img.pdfslide.us/doc/110x75/5f34a54bccc41229d852ca39/welcome-salises-sradcomsalises-sradcompdffinal-programme-days-2-and-3pdf.jpg)