Embed Size (px)
Citation preview
1
The Impact of Farmer-Field-Schools on Knowledge and Productivity:
A Study of Potato Farmers in the Peruvian Andes1
by
Erin M. Godtland†, Elisabeth Sadoulet*, Alain de Janvry*,
Rinku Murgai**, and Oscar Ortiz‡
March 2004
Using survey-data from Peru, this paper evaluates the impact of a pilot farmer-field-school (FFS) program on farmers’ knowledge of integrated pestmanagement (IPM) practices related to potato cultivation. We use bothregression analysis controlling for participation and a propensity score matchingapproach to create a comparison group similar to the FFS participants inobservable characteristics. Results are robust across the two approaches as wellas with different matching methods. We find that farmers who participate in theprogram have significantly more knowledge about IPM practices than those inthe non-participant comparison group. We also find suggestive evidence thatimproved knowledge about IPM practices has the potential to significantlyimprove productivity in potato production.
† U.S. General Accounting Office, [email protected].* University of California at Berkeley, [email protected], [email protected].** Development Economics Research Group, The World Bank, [email protected].‡ International Potato Center, Consultative Group on International Agricultural Research, [email protected]. 1 We are especially indebted to the farmers of San Miguel and the extension and research staff at CIP and CARE-Peru, whogenerously offered their time and expertise on behalf of this project. This research was made possible by financial support fromthe World Bank Research Committee RPO No. 683-56 and the Development Research Group. The views expressed in thisarticle are those of the authors and should not be attributed to the World Bank or any affiliated organization. The authors takefull responsibility for any errors.
2
I. Introduction
The design of agricultural extension programs in developing countries has been the subject of heated
debate. Guided by these debates, extension services have undergone several transformations in the past few decades
(Byerlee, 1994). The main transformation, until recently, was a shift from the transfer-of-technology approach to the
Training-and-Visit, or T&V, system. Under T&V, the extension system was reoriented from a desk-bound
bureaucracy with multiple economic and social objectives to a field-based cadre of agents who focused mainly on
technology diffusion (Picciotto and Anderson, 1997). T&V extension agents would meet with a small group of
“contact” farmers who were expected to disseminate information to the members of their respective communities
and convey farmer’s opinions back to the agents, thus creating a feedback mechanism absent in the prior system
(Birkhaeuser, et al, 1991). For nearly three decades, international aid donors, such as the World Bank, promoted
T&V as the most cost-efficient extension system.
T&V did, however, have its critics. With continued budgetary crises of less developed countries, some
argued that it was too expensive and impossible to implement over extensive regions. Highly dispersed farmers
could never establish frequent contact with extension agents. And their needs varied widely and could not be
addressed with a single, inflexible technology package (Picciotto and Anderson, 1997; Feder, Willett, and Zijp,
2001).2
In recent years, a number of development agencies have promoted farmer field schools (FFS) as a
potentially more effective approach to extend knowledge to farmers. FFS programs were first introduced in East
Asia, in the late eighties, as a way of diffusing knowledge-intensive integrated pest management (IPM) practices for
rice.3 FFS have since been adapted to work with other crops and diseases, and have spread rapidly across Asia,
Africa, and Latin America (Nelson et al., 2001). The FFS approach represents a paradigm shift in agricultural
extension: the training program utilizes participatory methods “to help farmers develop their analytical skills, critical
thinking, and creativity, and help them learn to make better decisions” (Kenmore, 2002). Extension agents, who are
viewed as facilitators rather than instructors, conduct learning activities in the field on relevant agricultural practices.
Through interactive learning and field-experimentation, FFS programs teach farmers how to experiment and
problem-solve independently, with the expectation that they will thus require fewer extension services and will be
able to adapt the technologies to their own specific environmental and cultural needs (Vasquez-Caicedo et al., 2000).
Participants are encouraged to share their knowledge with other farmers, and are sometimes trained to teach the
courses themselves, thus reducing the need for external support.
FFS are costly undertakings, making a careful measurement of their impact important. However, empirical
evidence on their effectiveness has been mixed. Results of previous impact evaluations have varied greatly
according to the setting, the evaluation methods, and the yardstick used to assess impact. The few studies that
2 An abundance of empirical research exists on the effectiveness of T&V. See Birkhaeuser et al. (1991) for a review of studies onthe economic impact of these and other agricultural extension programs.3 IPM is knowledge-intensive because in order to effectively implement IPM – which employs natural predators to combat pests– farmers must be able to understand the origins, cycles, and natural enemies of pests.
3
examine the impact of FFS on farmers’ knowledge generally find that FFS participants tend to have higher
knowledge test scores after program participation or relative to a group of non-participants.4 Some studies show that
FFS participants use less pesticide and have higher yields compared to non-participants, while others find little
evidence of impact on these outcomes. At the same time, there appears to be little evidence of diffusion of
knowledge from FFS graduates to other farmers.5
A major drawback of most previous studies is that they do not properly control for potential differences
between FFS participants and farmers in the comparison group, making it difficult to draw definitive conclusions.
These differences could arise from the non-random placement of the program or from the voluntary nature of
participation in FFS. For example, FFS villages might be chosen for their relative advantages in land fertility or
climate. Or farmers who voluntarily participate in FFS might be more productive, on average, than those who do
not participate. Selective placement (through individual choice or purposive targeting) means that data on non-
participants does not reveal well the likely achievements of participants in the absence of the program. Unless
proper account of non-random farmer and village selection is taken, comparison of outcomes between FFS
participants and non-participants is likely to yield biased estimates of program impact.6
This paper uses data from a survey of potato farmers in Cajamarca, Peru, to examine the impact of a pilot
FFS program on farmers’ knowledge (as measured by a knowledge test score). Since there was no baseline survey
documenting the knowledge of farmers prior to their participation to FFS, we rely on methods based on comparison
groups. To deal with selection bias, we use propensity score matching (PSM) methods to build a statistical
comparison group of farmers comparable to FFS graduates. This allows us to ensure that bias in the impact estimate
due to selection on observables is minimized. Any remaining bias in the matching estimator can thus be attributed to
unobserved characteristics. That said, given the low participation rate of farmers in this small pilot program, the
sample of non-participants is very likely to include people who would participate if the program were more widely
available. Matching methods have been widely used in evaluations but there have as yet been no applications of
matching to the assessment of agricultural extension programs.
By assessing impact immediately after participation in FFS, we may be capturing short-term knowledge
acquisition that may or may not last over time. On the other hand, by restricting the measure of knowledge to the
results of a test score on IPM practices, our study does not do full justice to the stated purpose of the FFS
program—to promote critical thinking and creativity. According to FFS scientists, critical thinking is most valuable
in managing problems with pests and weather shocks, when farmers’ knowledge on how to react to such problems is
useful. Keeping in mind these limitations, our empirical results indicate that farmers who participated in the
program have significantly more knowledge about IPM practices than those in the non-participant comparison
group.
4 See for example, Rola et al. (2002) in the Philippines, Van de Fliert et al. (1999) in Indonesia, and Preneetvatakul and Waibel(2002) in Thailand.5 For a summary of these studies, see Feder et al., (2004).6 The only study that properly controls for selection biases finds no evidence of FFS impact (Feder et al., 2004).
4
Moving beyond knowledge to the impact of FFS on production decisions and ultimately yields would
require observing and comparing yields of FFS participants to non-participants. This survey was designed to
precisely be the baseline for such an analysis and therefore was implemented while FFS was only in the first year of
operation. Most of the production decisions had been taken either prior to or during the time when the FFS was in
operation. Hence, we cannot expect yields from the first year to reflect the knowledge acquired through FFS.
However, to get some sense of the importance of knowledge, we use the cross-sectional variation among the sub-
sample of non-participant farmers to correlate knowledge with yields. Conditional on observed characteristics, we
find that improved knowledge about IPM practices is positively correlated with productivity in potato production.
Combining these results, simulations suggest that FFS has the potential to raise productivity substantially, by about
32% of the average value in a normal year. This evidence is merely suggestive as it relies on the untestable
assumptions that (i) knowledge acquired through FFS does not dissipate over time and (ii) the observed relationship
between knowledge and yield can be inferred as causal and is not biased upwards. These results will need to be
confirmed by a rigorous analysis of impacts on yield when suitable data become available.
The paper proceeds as follows. Section II describes the FFS program in Peru and the data set. Section III
examines how farmers obtain information on potato cultivation, and their knowledge levels. In Section IV, we
present the research strategy used to test the impact of FFS on knowledge. Sections V and VI apply this
methodology to measure impact on knowledge. Finally, Section VII estimates how knowledge affects productivity
levels in potato cultivation and Section VIII concludes.
II. The Program and Data
As the home country for the headquarters of the International Potato Center (CIP), one of the CGIAR
centers, Peru has long been a focal point for the development and deployment of improved potato varieties and
cultivation practices. In 1998, CIP scientists, in collaboration with CARE-Peru, launched a pilot farmer field school
program for potato farmers in the department of Cajamarca. This department lies in the northern part of the Peruvian
Andes, which is known as the Green Andes. Unlike the dry flatlands of the Altiplano, the Green Andes are
characterized by steeply sloped, hilly terrain with relatively higher precipitation levels. The elevation of the survey
region ranges from 9,000 to 12,000 feet above sea level. The economy in the survey region is dominated by small
farms with potato farming as the main activity. Potatoes constitute the bulk of households’ food consumption and
are also their most lucrative market crop.
The main aim of the FFS program was to introduce IPM techniques to Andean potato farmers. FFS
participants were expected to attend 12 training sessions (typically once a week, with each session lasting for 3
hours). As the training strategy was based on the principle of learning by discovery, during these sessions the
facilitator would organize various activities and experiments that the farmers could implement themselves. The
curriculum was focused on the biology of late blight, the fungus that caused the Irish Potato Famine and continues to
take huge tolls on potato production in Peru. Farmers were taught its symptoms, its reproductive cycle, its
contamination source, and the conditions that foster its growth. On the experimental plot (one per FFS community),
5
they identified potato varieties that are resistant to late blight infection. They learned how to prevent and control
late blight with the use of improved varieties and fungicides. The program also introduced IPM for the Andean
potato weevil and the potato tuber moth in less detail.
There was a two-stage selection process that determined which farmers participated in the program. First,
CARE selected the villages in which to introduce the FFS program. These villages were chosen from a set of
villages where CARE had already been implementing another rural development project named “Andino”. This
project worked with farmers groups to improve farm production by providing technical advice and access to credit,
and by facilitating links to markets. Technical advice in Andino was imparted through conventional transfer-of-
technology approaches. The Andino villages (and consequently, the FFS villages) were not a random sample of
villages in the region. Rather, CARE had conducted a diagnostic survey of all communities within the watershed,
and based on this survey, classified communities into three types: subsistence, middle income, and high income.
The target population for the Andino program was the set of middle-income communities and, from this target
group, 20 villages that were close to their respective district capitals were selected for participation. CARE planned
to introduce FFS in all the Andino villages. However, at the time of the survey, field schools were operating only in
four. These four villages constitute our ‘treatment villages’. Although no explicit rule was applied for the selection
of the four villages, extensive interviews with CARE agents and our field observations did not suggest any clear
patterns whereby more or less productive Andino villages were targeted for the program. The phasing in plan for
FFS seems to have been driven by practical considerations rather than expected performance; indeed, four more of
the Andino villages included in our analysis were covered by the FFS program in the season immediately following
the survey.
Within the FFS villages, all farmers were invited to participate in the program. The only requirement
imposed on participants was that they had to attend all the training sessions. In reality, although the call for
participation was open to all community members, pre-existing groups took advantage of their already-existing
organization and formed an FFS group. As a result, most FFS participants were also participants in other farmer
groups such as Andino, and all but 9 Andino farmers participated in FFS. However, the participation rate in FFS
remained very low during the first year of implementation, with only 45 farmers out of a population of 900 (or 5%
of the farmers) participating in the program. Similarly low participation rates of 2.5% are observed for the Andino
program in villages where it is offered. This low enrollment rate is largely due to the limited resources of CARE,
and the fact that these first FFS were planned as pilot projects. Thus, while FFS participants self-selected into the
program, there are most likely many similar farmers in the large population that were not enrolled in the program.
The main objective of this paper is to analyze the impact of FFS on knowledge by contrasting FFS
participants to a matched control group of non-participants in either the FFS or the Andino program. A secondary
objective is to analyze the impact of Andino on knowledge by contrasting Andino participants to the same group of
non-participants. Because we have a large group of non-participants, these two measures of impact can be
performed. We are, however, limited by the small number of observations in directly testing the difference in
knowledge between FFS and Andino. We thus compare and test for a difference in the two impact measures just
6
described. To limit repetition, we report the results on the impact of FFS in detail, but reporton the impact of
Andino only secondarily.
The data for our analysis come from a 1999 survey of potato farmers in thirteen communities within the
province of San Miguel located in the Department of Cajamarca. Ten of the thirteen villages included in the sample
are among the CARE Andino villages, including the four villages that were selected as FFS villages at the time of
the survey. The sample includes all of the FFS and Andino participants and a random sample of non-participant
farmers from (a) the four villages that have FFS programs, (b) six villages which have experience with CARE
through Andino but do not have farmer field schools, and (c) three control villages. The control villages were chosen
to be similar to the FFS villages in observable characteristics such as agro-climatic conditions, distance to district
capitals, and infrastructure. The distribution of households in the three types of villages is reported in Table 1.
CARE villages CARE villages Non-CAREwith FFS program with Andino program villages Total
FFS participants 45 0 0 45Work with CARE, non-participants in FFS 9 62 2 73Do not work with CARE 39 181 148 368
Total number of households in sample 93 243 150 486Total number of households in villages 900 2337 1278 4515Villages 4 6 3 13
Table 1. Sample of Households
The survey was carried out over two household visits. The first visit gathered detailed plot-level data,
including the costs and quantities of seed, chemical, and labor inputs for each agricultural activity (from land
preparation through harvest) during the year preceding the survey. It also included a knowledge test, which was
based on the curriculum of the FFS. The second visit collected information on each household member’s education
level and marital status, off-farm activities and credit sources, and the household’s experience with agricultural and
other extension services. The second visit also included a full household consumption recall for the last year and an
itemized account of all household and farm assets.
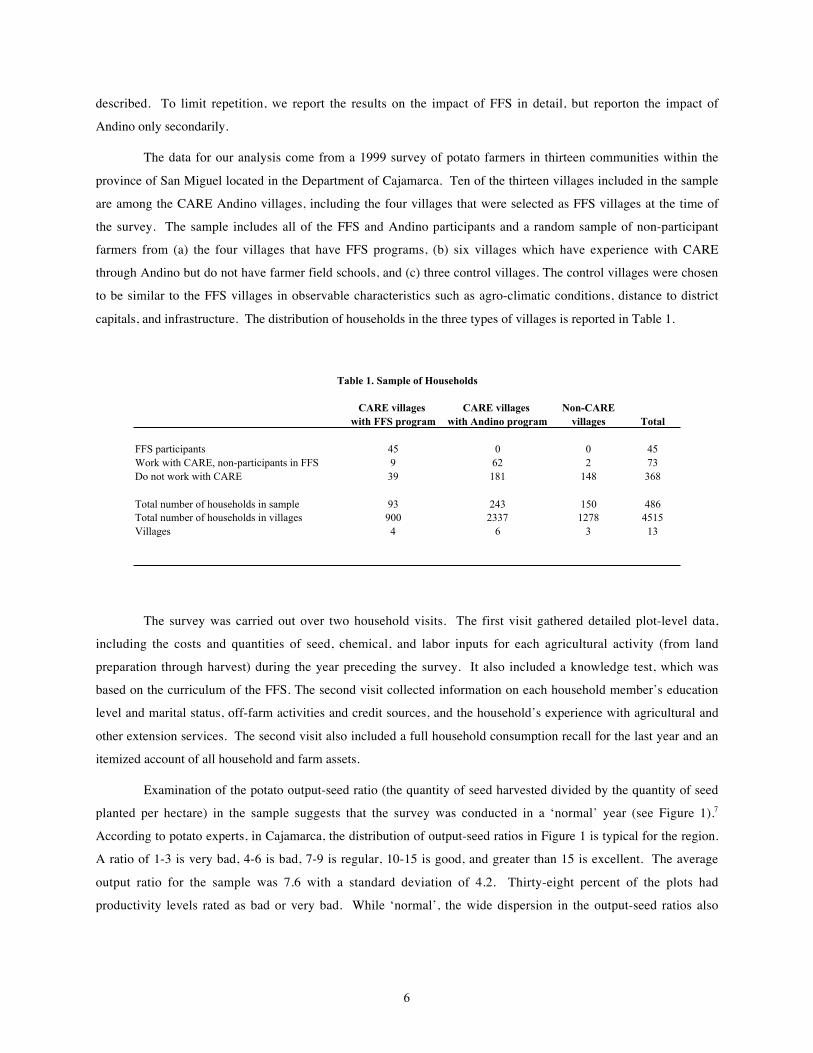
Examination of the potato output-seed ratio (the quantity of seed harvested divided by the quantity of seed
planted per hectare) in the sample suggests that the survey was conducted in a ‘normal’ year (see Figure 1).7
According to potato experts, in Cajamarca, the distribution of output-seed ratios in Figure 1 is typical for the region.
A ratio of 1-3 is very bad, 4-6 is bad, 7-9 is regular, 10-15 is good, and greater than 15 is excellent. The average
output ratio for the sample was 7.6 with a standard deviation of 4.2. Thirty-eight percent of the plots had
productivity levels rated as bad or very bad. While ‘normal’, the wide dispersion in the output-seed ratios also
7
illustrates the tremendous variation in productivity levels in the sample villages. This is the variable that we will use
to measure the impact of knowledge on productivity.
Figure 1. Histogram for Potato Output/Input Ratios
Percentage of farmers
0 5 10 15 20
0
5
10
Potato output/input ratio
Part of the variation in productivity arises from production losses due to late blight, as is evident in Table 2
which shows the primary causes of production losses by plot during 1998, as reported by farmers in the sample. It
illustrates the need for a curriculum with a heavy emphasis on late blight. Although this was not a wet year, 47% of
the potato plots in the sample experienced losses due to late blight. 19% experienced losses from frost. The Andean
potato weevil, the potato tuber moth, and hail were not critical problems in the year the survey was conducted.
Source of stress Late blight
Andean potato weevil
Potato tuber moth Frost Hail
% of plots affected 47.1 5.4 1.0 19.3 1.4% of plots with 0-25% loss 31.9 3.8 1.0 7.0 1.4% of plots with 26-50% loss 10.8 1.6 0 6.9 0% of plots with 51-75% loss 3.0 0 0 2.8 0% of plots with 76-100% loss 1.4 0 0 2.6 0
Table 2. Agricultural Losses Caused by Common Pests and Weather Conditions
III. Information Channels and Knowledge Levels
Before evaluating the impact of FFS on farmers’ knowledge of IPM practices, it is useful to examine how
farmers in San Miguel typically obtain information on potato cultivation. The questionnaire requested farmers to
7 Tuber scientists call this measurement the multiplication ratio. It is one of the two most commonly used productivity measures,

8
name their primary sources of information on a number of tasks related to potato cultivation. Table 3 summarizes
these results. The majority of farmers get information on potato farming from family members. Farmers seek
information on new technologies, such as new varieties and pesticides and fungicides from other neighbors in the
community. Given the traditional, rural environment, this makes sense. Using data from several surveys in India,
Foster and Rosenzweig (1995) note that information from neighbors on new technologies was as important as
information from government extension services. In their study in Northern India, Feder and Slade (1986) also note
the extensive role of discussions among farmers as a main source of agricultural advice. Ortiz and Valdez (1993)
found a similar role for neighbors for information in other Cajamarca communities. Agricultural economists
working in developed countries have also noted this phenomenon (Birkhaeuser et al., 1991). For the selection of
improved varieties and the control of pests and diseases, which are more technical issues, farmers not only cite
family members and neighbors as their primary sources of information, but also CARE (either FFS or conventional
training) as an important source. Feder and Slade (1986) similarly found that farmers in their sample are more likely
to seek information on complex agricultural practices from agricultural extension agents.
Source of informationFamily
member
Neighbor in the community or a
nearby community
Sharecropping partner
Merchant / At the market CARE
Other NGO Radio
Own Experience
Agronomic practicesSoil preparation 96 3 0.0 0 0 0 0 2Planting 96 4 0.7 0 0 1 0 1Fertilizing 92 8 1 0 1 1 0 3Weeding and uphilling 94 4 5 0 0 0 0 3Seed selection 88 8 1 0.5 1 1 0 0
Technical issuesImproved varieties 52 34 1 6 6 1 2 2Pesticide/fungicide use 73 24 2 3 1 2 1 5Late blight control 71 23 2 2 2 3 0 7Andean potato weevil control 28 9 0.7 1 1 2 0 5Potato tuber moth control 15 3 0 2 0 1 0 2
Sources do not sum to 100% since respondents were permitted to list multiple sources
Table 3. Sources of Information on Potato Cultivation (% of farmers who use the source)
How accurate is the knowledge that farmers share with one another? The questionnaire included a test,
designed by CIP extension experts, of farmers' knowledge about the control of the three major pests – late blight, the
Andean potato weevil, and the potato tuber moth. Farmers were asked how to identify the pest and its cause, how it
reproduces, and how to control it. For late blight, farmers were also asked what fungicides are used to control it,
how to differentiate categories of pesticides in general and of fungicides in particular, and to name resistant
varieties. Finally, farmers were asked how they select pesticides/fungicides, whether they could identify the
meaning of different warning labels on the pesticides, and what precautions they take in applying and storing the
the other measure being yield estimates based on harvest sampling (Terrazas, et. al, 1998).

9
agro-chemicals. The scores for each topic category are presented in Table 4. In general, they are very low, with
average scores that do not exceed twenty-five percent of the total score.
This low level of knowledge about important agricultural problems and solutions is what motivates several
NGOs to provide agricultural extension services to farmers in Cajamarca and throughout Peru. CARE-Peru works
extensively in the Cajamarca region to disseminate information on new technologies through conventional transfer-
of-technology agricultural extension programs (Andino) and through experimental extension programs, such as FFS.
Table 4 compares test scores of the farmers who participate in the FFS and Andino programs with farmers who do
not participate in any program. Farmers who participate in the FFS have significantly higher scores on tests in every
area. Farmers who worked with the Andino program also score significantly higher on the tests. Finally, FFS
participants have higher scores than Andino program participants overall and in all test scores but one.
Table 4. Agricultural Knowledge Test Score Comparisons Across Groups of Farmers
p -valueAll FFS Andino Non- for test of equality
households participants participants participants1 FFS = Andino
Number of observations 486 45 64 329Test scores: % of maximum score
Knowledge on late blight 24 35 29 24 0.06Knowledge on Andean weevil 10 25 14 9 0.02Knowledge on potato tuber moth 6 15 17 6 0.60Pesticide knowledge 21 29 25 21 0.04Knowledge on resistant varieties 17 49 33 16 0.00Total test score 19 34 26 19 0.00
1 All differences between FFS and non-participants and between CARE and non-participants are significantly positive at 1%.
IV. Empirical Approach
The purpose of the estimation that follows is to measure the impact of FFS on knowledge levels of those
who participated in the program. This is the Average Treatment Effect on the Treated (ATE1), where the treatment
is participation in the program. The empirical problem we face is the typical one of filling in missing data on the
counter-factual: what would knowledge levels of FFS participants have been if they had not participated in the
program? Our challenge is to identify a suitable comparison group of non-participants whose outcomes, on average,
provide an unbiased estimate of the outcomes that program participants would have had in the absence of the
program. Given the non-random selection of program villages and farmer self-selection, simple comparisons of
knowledge levels between participants and non-participants would yield biased estimates of program impact.
Based on program design, there are three potential sources of bias in measuring program impact. First, FFS
participants are likely to differ from non-participants in the distribution of their observed characteristics, leading to a
bias from “selection on observables”. Such a bias is likely to arise because the criteria used for FFS village selection
(e.g., distance to the district capital) and participant selection can also be expected to have a direct effect on
knowledge levels even in the absence of the program. We control for selection on observables in two ways. First,
10
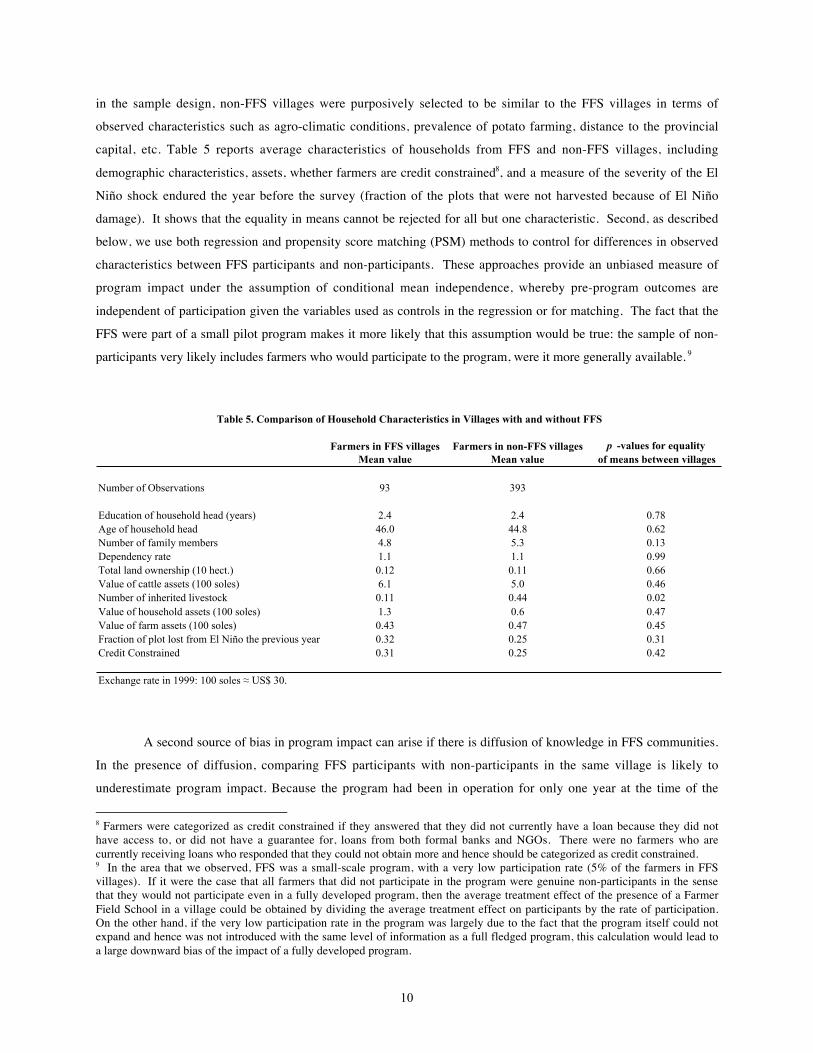
in the sample design, non-FFS villages were purposively selected to be similar to the FFS villages in terms of
observed characteristics such as agro-climatic conditions, prevalence of potato farming, distance to the provincial
capital, etc. Table 5 reports average characteristics of households from FFS and non-FFS villages, including
demographic characteristics, assets, whether farmers are credit constrained8, and a measure of the severity of the El
Niño shock endured the year before the survey (fraction of the plots that were not harvested because of El Niño
damage). It shows that the equality in means cannot be rejected for all but one characteristic. Second, as described
below, we use both regression and propensity score matching (PSM) methods to control for differences in observed
characteristics between FFS participants and non-participants. These approaches provide an unbiased measure of
program impact under the assumption of conditional mean independence, whereby pre-program outcomes are
independent of participation given the variables used as controls in the regression or for matching. The fact that the
FFS were part of a small pilot program makes it more likely that this assumption would be true: the sample of non-
participants very likely includes farmers who would participate to the program, were it more generally available. 9
Farmers in FFS villages Farmers in non-FFS villages p -values for equality Mean value Mean value of means between villages
Number of Observations 93 393
Education of household head (years) 2.4 2.4 0.78Age of household head 46.0 44.8 0.62Number of family members 4.8 5.3 0.13Dependency rate 1.1 1.1 0.99Total land ownership (10 hect.) 0.12 0.11 0.66Value of cattle assets (100 soles) 6.1 5.0 0.46Number of inherited livestock 0.11 0.44 0.02Value of household assets (100 soles) 1.3 0.6 0.47Value of farm assets (100 soles) 0.43 0.47 0.45Fraction of plot lost from El Niño the previous year 0.32 0.25 0.31Credit Constrained 0.31 0.25 0.42
Exchange rate in 1999: 100 soles ≈ US$ 30.
Table 5. Comparison of Household Characteristics in Villages with and without FFS
A second source of bias in program impact can arise if there is diffusion of knowledge in FFS communities.
In the presence of diffusion, comparing FFS participants with non-participants in the same village is likely to
underestimate program impact. Because the program had been in operation for only one year at the time of the
8 Farmers were categorized as credit constrained if they answered that they did not currently have a loan because they did nothave access to, or did not have a guarantee for, loans from both formal banks and NGOs. There were no farmers who arecurrently receiving loans who responded that they could not obtain more and hence should be categorized as credit constrained.9 In the area that we observed, FFS was a small-scale program, with a very low participation rate (5% of the farmers in FFSvillages). If it were the case that all farmers that did not participate in the program were genuine non-participants in the sensethat they would not participate even in a fully developed program, then the average treatment effect of the presence of a FarmerField School in a village could be obtained by dividing the average treatment effect on participants by the rate of participation.On the other hand, if the very low participation rate in the program was largely due to the fact that the program itself could notexpand and hence was not introduced with the same level of information as a full fledged program, this calculation would lead toa large downward bias of the impact of a fully developed program.
11
survey, the extent of diffusion is likely to have been low. In any event, to avoid all bias from potential diffusion
within FFS communities, we exclude non-participants in FFS communities from the comparison group. We will
return to this choice in the tests of robustness of the results. Hence, the sample that we retain P FFS nonFFS( ) +{ }includes FFS participants (P) from the FFS villages and non-FFS villages farmers (excluding the participants to the
Andino program).10
A final source of bias is that FFS participants may differ from non-participants in the distribution of
unobserved characteristics (e.g., in farming ability that affects both the decision to participate in FFS and the desire
to seek out new knowledge), resulting in “selection on unobservables”. In the absence of a suitable instrument for
program participation, we are unable to explicitly control for selection on unobservables. However, following
Altonji, Elder, and Taber (2002), we use an informal way of assessing the potential bias that could result from
unobservables and find that this bias is likely small compared to the estimated impact.
The assumptions underlying the above discussion can be formally expressed as follows:
Assumption 1. Stable Unit Treatment Value (SUTV) in the retained sample (excluding non-participants from the
FFS villages)
This assumes that the treatment only affects the outcomes of those who participate, i.e., there is no
diffusion of knowledge from FFS participants (all in FFS villages) to control farmers (all in non-FFS villages).
Assumption 2. Ignorability of treatment (participation in FFS): Conditional on observed village and individual
characteristics x xv i, , outcomes y y0 1, ( ) and participation w are independent.
This assumption implies the weaker conditional mean independence:
E , , E ,y x x w y x xv i v i0 0( ) = ( ) and E , , E ,y x x w y x xv i v i1 1( ) = ( ) , (1)
where y y0 1 and are the outcomes of interest (farmers’ knowledge) without and with participation in the FFS
program, w is a binary indicator of participation, and xv and xi denote observed village and individual
characteristics, respectively.
These two conditions allow us to build a statistical comparison group for FFS participants with similar
farmers from the non-FFS villages, and to estimate the impact of the FFS program by comparing the observed
outcome y1 of FFS participants with the outcome y0 of farmers in the comparison group. We use two different
estimators.
4.1. Estimation by regression
The first method is based on assuming a parametric expression for the conditional mean independence (1):
E y x x x0 0 0( ) = + -( )a b
10 Note that this assumes that there is no diffusion from FFS farmers to farmers in non-FFS villages, which seems reasonable

12
and E y x x x1 1 1( ) = + -( )a b
where x is the vector of covariates x xv i,( ) with average value x in the treated population.
This gives the expected knowledge outcome y conditional on a given set of covariates as:
E ,y x w w x w x x( ) = + + + -( )m a b g0 . (2)
where y w y wy= -( )1 0 1+ is the observed outcome (equal to y1 for participants and y0 for non-participants). Since
the regression of y on x w w x x, , -( ) consistently estimates the parameters, we can derive an estimate of the average
treatment effect conditional on covariates x:
ATE x x xRegˆ ˆ ˆ( ) = + -( )a g ,
which can be averaged over any group of observations. In particular, the coefficient a is the average treatment
effect on the treated.
ATERegˆ ˆ1 = a .
4.2. Estimation by matching on probability propensity scores
This method, developed by Rosenbaum and Rubin (1983), is based on modeling the probability of
treatment given covariates, called the probability propensity score (PPS):
p x w x( ) ∫ =( )P 1 .
Suppose that two agents from the population have identical PPS. Then under the ignorability condition, the
average treatment effect, conditional on the PPS and provided it is not equal to either 0 or 1, is equal to the expected
difference in the observed outcomes between participants and matched non-participants:
E E , E ,y y p x y w p x y w p x1 0 1 0- ( )( ) = = ( )( ) - = ( )( ) .
Averaging over the distribution of propensity scores in the treated population gives the average treatment
effect on the treated:
ATE y w p x y w p x wPSM1 1 0 1= = ( )( ) - = ( )( ) =[ ]E E , E , .
Implementation of this method relies on having an estimator for the PPS, which we discuss in the next
section.
V. Estimation of the probability propensity score
While estimation of the average impact effect is done in the population that excludes the non-participants
from the FFS villages because of the required SUTV assumption, this need not be the case for the independent
estimation of the PPS. In fact, it is within the FFS villages that we have a better identification of the covariates that
given the limited time that had elapsed between training and the date of the survey.
13
determine FFS participation, since farmers in these villages were all, to a certain extent, given the opportunity to
participate.
Using the sub-sample FFS{ } of farmers living in the FFS villages, we estimate a flexible probit model of
participation, where covariates and various functions of these covariates are introduced. The estimated model can
be used to predict p x( ) for the population P FFS nonFFS( ) +{ } used for the estimation of the average treatment
effect. As farmers from the non-FFS villages are not included in the estimation of the propensity score, this
constitutes an out-of-sample prediction. Its validity relies on the existence of sufficient overlap of the covariates,
and on the assumption that the same participation model would apply in both samples were all villages offered the
FFS program. The latter is an assumption of ignorability of the choice of village for participation.
Assumption 3. Ignorability of the selection of FFS villages for participation choice: Conditional on observed village
and individual characteristics x xv i, , the choice of villages for the placement of an FFS and participation w are
independent.
This assumption implies conditional mean independence:
P , , P ,w x x w x xv i v i=( ) = =( )1 1presence of FFS .
The results for the probit on FFS participation are reported in Table 6. They show the importance of age,
the number of family members in a household, and wealth (land and household assets) in influencing FFS
participation. Interview with farmers during our fieldwork corroborated the correlation of FFS participation with the
availability of labor in the household: many non-participants cited the lack of time and availability of labor as their
main constraint in participating in the FFS program. In order to improve the prediction of treatment assignment
(critical to matching methods), the model is intentionally over-parameterized, using many variables and quadratic
terms.

14
Coefficient p -value
Education of household head -0.74 0.18Quadratic term for education 0.20 0.14Age of household head -0.02 0.05Number of family members 0.21 0.02Dependency rate -0.27 0.32Total land ownership (10 hect.) 0.70 0.03Quadratic term for land ownership 1.05 0.41Value of cattle assets (100 soles) 0.01 0.76Number of inherited livestock 0.00 1.00Value of household assets (100 soles) 0.22 0.00Quadratic term for household assets -0.01 0.00Value of farm assets (100 soles) 0.24 0.66Quadratic term for farm assets -0.23 0.21Fraction of plots lost in El Niño 1.61 0.12
-2.21 0.00Credit constraint 0.16 0.69Constant 0.12 0.84
Number of observations 93Pseudo-R2 0.18
Table 6. Farmer Field School Participation ProbitDependent variable: participation (0/1)
Quadratic term for plots lost in El Niño
A similar procedure (results not reported) was applied to participants of the Andino program. The same
variables are significant in explaining participation as in the FFS prediction. The only qualitative difference is age
which acts negatively in FFS participation and positively in Andino participation, which is telling of the difference
between the two approaches and who might benefit most. Education is insignificant in both cases.
These parameters are used to predict the probability of participating p x( ) , or PPS, for the sample
P FFS nonFFS( ) +{ } that is then used to match FFS participants with observationally similar non-participants.
Different rules of thumb could be applied to define what constitutes an observationally similar group of non-
participants. Smith and Todd (2000) demonstrate that program impact estimates calculated using PPS methods are
highly sensitive to which method is used, but robustness can be improved by restricting matches only to those
participants and non-participants who have a common support in the distribution of propensity scores. Therefore, we
derive impact estimates by applying the common support condition and further check robustness by using two
different methods for selecting matched non-participants.
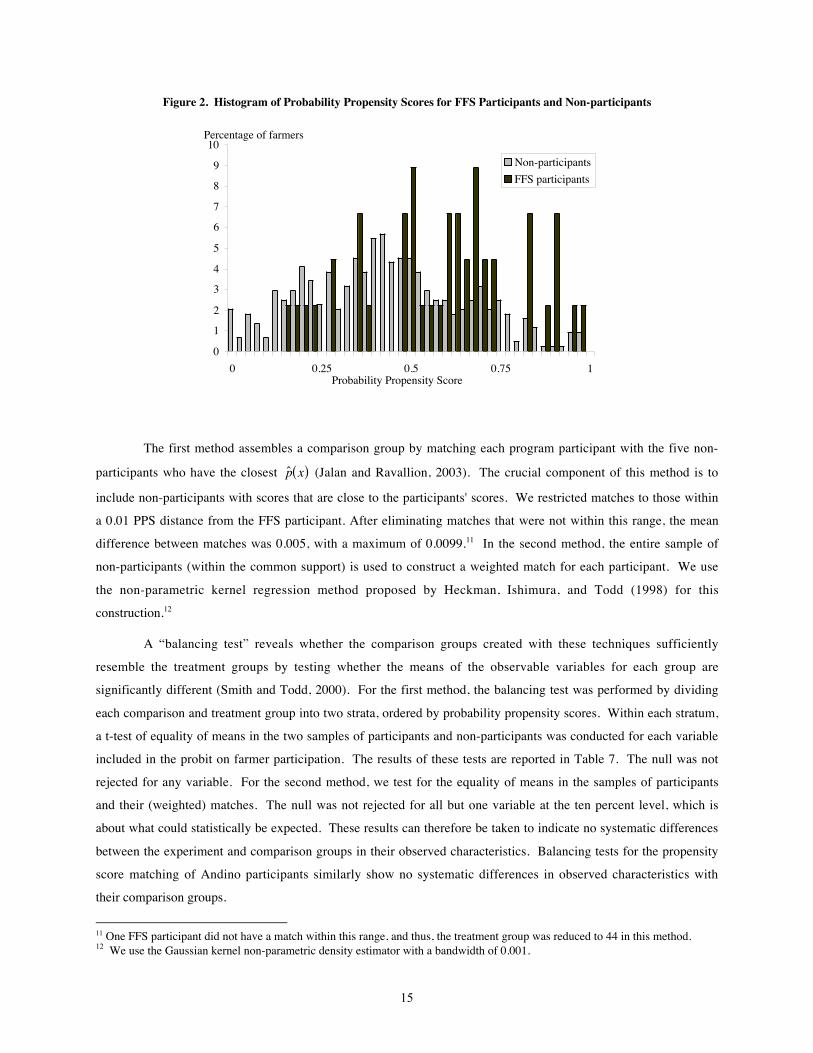
The distributions of propensity scores for FFS participants and non-participants are plotted in Figure 2.
The distribution with the darker bars is the distribution of p x( ) for participants. For the purpose of matching,
observations with very low or very high values of p x( ) are eliminated, as they may indicate a true value of 0 or 1.
Observations outside the support of the two distributions of p x( ) for participants and non-participants were also
excluded from the analysis. Fifty-one observations among the non-participants were dropped in total.
15
Figure 2. Histogram of Probability Propensity Scores for FFS Participants and Non-participants
0
1
2
3
4
5
6
7
8
9
10
0 0.25 0.5 0.75 1
Non-participants
FFS participants
Percentage of farmers
Probability Propensity Score
The first method assembles a comparison group by matching each program participant with the five non-
participants who have the closest p x( ) (Jalan and Ravallion, 2003). The crucial component of this method is to
include non-participants with scores that are close to the participants' scores. We restricted matches to those within
a 0.01 PPS distance from the FFS participant. After eliminating matches that were not within this range, the mean
difference between matches was 0.005, with a maximum of 0.0099.11 In the second method, the entire sample of
non-participants (within the common support) is used to construct a weighted match for each participant. We use
the non-parametric kernel regression method proposed by Heckman, Ishimura, and Todd (1998) for this
construction.12
A “balancing test” reveals whether the comparison groups created with these techniques sufficiently
resemble the treatment groups by testing whether the means of the observable variables for each group are
significantly different (Smith and Todd, 2000). For the first method, the balancing test was performed by dividing
each comparison and treatment group into two strata, ordered by probability propensity scores. Within each stratum,
a t-test of equality of means in the two samples of participants and non-participants was conducted for each variable
included in the probit on farmer participation. The results of these tests are reported in Table 7. The null was not
rejected for any variable. For the second method, we test for the equality of means in the samples of participants
and their (weighted) matches. The null was not rejected for all but one variable at the ten percent level, which is
about what could statistically be expected. These results can therefore be taken to indicate no systematic differences
between the experiment and comparison groups in their observed characteristics. Balancing tests for the propensity
score matching of Andino participants similarly show no systematic differences in observed characteristics with
their comparison groups.
11 One FFS participant did not have a match within this range, and thus, the treatment group was reduced to 44 in this method.12 We use the Gaussian kernel non-parametric density estimator with a bandwidth of 0.001.
16
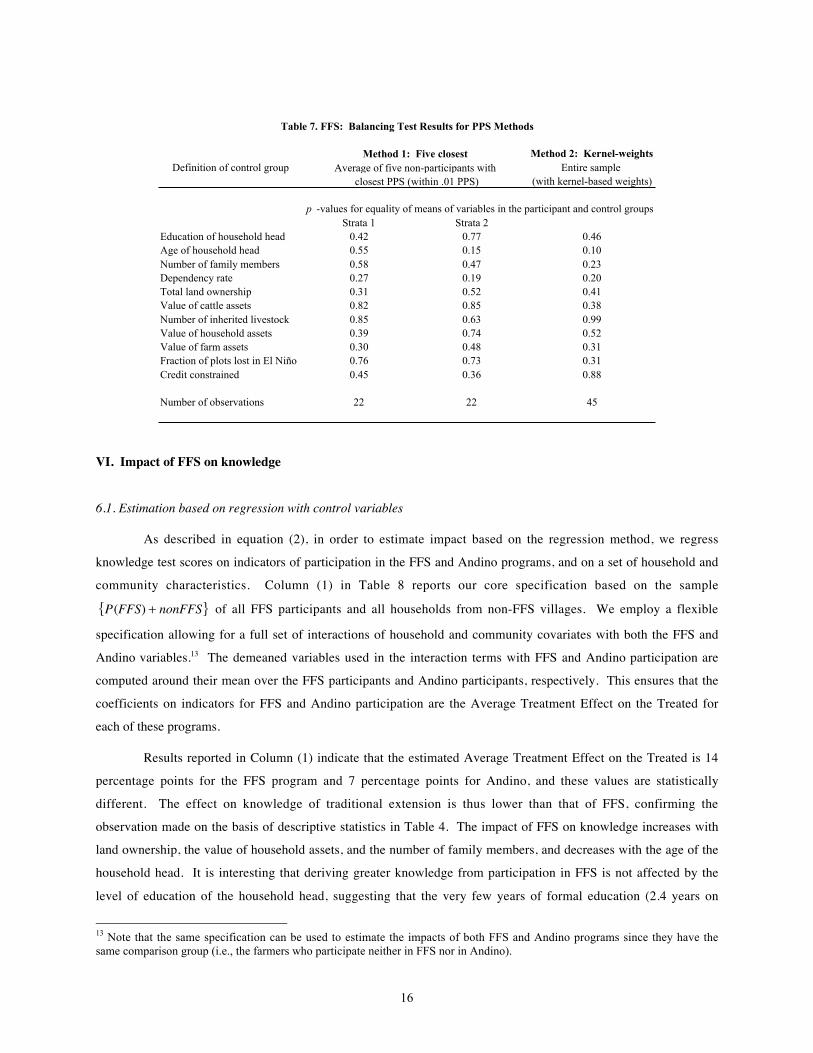
Method 2: Kernel-weightsDefinition of control group Entire sample
(with kernel-based weights)
Strata 1 Strata 2Education of household head 0.42 0.77 0.46Age of household head 0.55 0.15 0.10Number of family members 0.58 0.47 0.23Dependency rate 0.27 0.19 0.20Total land ownership 0.31 0.52 0.41Value of cattle assets 0.82 0.85 0.38Number of inherited livestock 0.85 0.63 0.99Value of household assets 0.39 0.74 0.52Value of farm assets 0.30 0.48 0.31Fraction of plots lost in El Niño 0.76 0.73 0.31Credit constrained 0.45 0.36 0.88
Number of observations 22 22 45
p -values for equality of means of variables in the participant and control groups
Table 7. FFS: Balancing Test Results for PPS Methods
Method 1: Five closest
closest PPS (within .01 PPS)Average of five non-participants with
VI. Impact of FFS on knowledge
6.1. Estimation based on regression with control variables
As described in equation (2), in order to estimate impact based on the regression method, we regress
knowledge test scores on indicators of participation in the FFS and Andino programs, and on a set of household and
community characteristics. Column (1) in Table 8 reports our core specification based on the sample
P FFS nonFFS( ) +{ } of all FFS participants and all households from non-FFS villages. We employ a flexible
specification allowing for a full set of interactions of household and community covariates with both the FFS and
Andino variables.13 The demeaned variables used in the interaction terms with FFS and Andino participation are
computed around their mean over the FFS participants and Andino participants, respectively. This ensures that the
coefficients on indicators for FFS and Andino participation are the Average Treatment Effect on the Treated for
each of these programs.
Results reported in Column (1) indicate that the estimated Average Treatment Effect on the Treated is 14
percentage points for the FFS program and 7 percentage points for Andino, and these values are statistically
different. The effect on knowledge of traditional extension is thus lower than that of FFS, confirming the
observation made on the basis of descriptive statistics in Table 4. The impact of FFS on knowledge increases with
land ownership, the value of household assets, and the number of family members, and decreases with the age of the
household head. It is interesting that deriving greater knowledge from participation in FFS is not affected by the
level of education of the household head, suggesting that the very few years of formal education (2.4 years on
13 Note that the same specification can be used to estimate the impacts of both FFS and Andino programs since they have thesame comparison group (i.e., the farmers who participate neither in FFS nor in Andino).

17
average in the sample) have little bearing on how farmers acquire technical knowledge later. An interesting
difference between the impact of the FFS and Andino programs is that in the case of Andino, knowledge is not
affected by land ownership and family size and does not increase with the value of household assets. If control over
land and household assets proxies for wealth, it suggests that FFS is better taken advantage of by the wealthier,
while traditional transfer-of-technology approaches cater to less endowed farmers. The FFS extension method is
thus better fit for younger farmers and for farmers with greater endowments.
Since we exclude non-participants in FFS villages from the sample, it is possible that part of the estimated
FFS impact may be picking up endogenous program placement. For example, if Andino villages where there
existed a motivated and knowledgeable group of farmers were selected for FFS programs, comparisons of FFS
farmers with those from other villages would pick up this village effect, rather than the impact of the program. To
check for this possibility, we re-estimate the model with village effects by expanding the sample to include the non-
participants from FFS villages. Village-fixed effects ensure that measures of program impact are derived essentially
by comparing program participants to non-participants within villages and has the advantage that the results are not
contaminated by village-level fixed unobservables that may be upwardly biasing impact estimates. It does suffer
from the disadvantage that diffusion from program participants to non-participants will downwardly bias estimates
of impact, although as mentioned earlier, given the short time elapsed since the start of the program, this is unlikely
to be important. Results of the village-fixed effects specification, reported in column (2), are remarkably similar to
our core estimates: the average treatment effect on the treated is 14 and 9 percentage points for the FFS and Andino
programs, respectively. Other parameter estimates do not also differ very much from the first specification,
confirming our ex-ante expectation that fixed village unobservables do not explain our estimates of program impact.

18
Table 8. Impact of FFS and Andino on Agricultural Knowledge Test Scores
Coefficient p -value Coefficient p -value
Participation in FFS 13.8 0.00 14.3 0.00Participation in Andino 7.0 0.00 8.9 0.00Community characteristics
Distance from Cajamarca (kms) -0.01 0.00Dairy delivery station in community (0/1) 1.11 0.23
Household characteristicsEducation of household head 0.33 0.65 0.79 0.28Age of household head -0.03 0.46 0.00 0.97Number of family members 0.07 0.70 -0.04 0.82Total land ownership (hectares) 7.00 0.18 5.47 0.29Quadratic total land -7.88 0.03 -8.42 0.04Value of cattle assets (100 soles) -0.01 0.91 0.04 0.54Number of inherited livestock 0.10 0.66 0.10 0.67Value of household assets (100 soles) 0.46 0.00 0.37 0.00Value of farm assets (100 soles) 0.42 0.67 1.35 0.24Fraction of plots lost in El Niño 1.18 0.33 0.80 0.47Credit constrained 1.61 0.10 0.86 0.36
Interaction terms: Participation in FFS xde-meaned community characteristics
Distance from Cajamarca 0.00 0.93Dairy delivery station in community -1.62 0.71
de-meaned household characteristicsEducation of household head -0.66 0.75 -1.42 0.47Age of household head -0.30 0.11 -0.32 0.05Number of family members 1.33 0.07 1.41 0.04Total land ownership 84.0 0.08 96.7 0.02Quadratic total land -179 0.02 -197 0.00Value of cattle assets 0.18 0.65 -0.03 0.94Number of inherited livestock -0.41 0.62 -0.09 0.92Value of household assets 3.33 0.05 3.81 0.02Value of farm assets -6.00 0.23 -7.06 0.13Fraction of plots lost in El Niño -10.27 0.01 -9.76 0.01Credit constrained 2.90 0.48 4.31 0.26
Interaction terms: Participation in Andino xde-meaned community characteristics
Distance from Cajamarca 0.02 0.36Dairy delivery station in community -0.28 0.92
de-meaned household characteristicsEducation of household head 1.00 0.68 -0.09 0.98Age of household head 0.04 0.67 0.12 0.43Number of family members 0.56 0.47 -2.05 0.09Total land ownership 23.7 0.56 16.1 0.75Quadratic total land -112 0.15 -11 0.90Value of cattle assets 0.19 0.52 -0.37 0.50Number of inherited livestock 0.31 0.67 -0.44 0.66Value of household assets -1.09 0.00 -0.61 0.26Value of farm assets 5.65 0.38 -11.19 0.21Fraction of plots lost in El Niño -0.08 0.98 -1.95 0.65Credit constrained 0.21 0.95 -4.53 0.30
Constant 19.7 0.00 13.9 0.00
Number of observations 438 486R2 0.17 0.23Community fixed effects No F(12, 485) = 2.07 0.02F-test for interaction terms with FFS F(13, 437) = 4.98 0.00 F(11, 485) = 4.46 0.00F-test for interaction terms with Andino F(13, 437) = 6.81 0.00 F(11, 485) = 3.13 0.00Test of ATE1(FFS) = ATE1(Andino) F(1, 437) = 8.27 0.00 F(1, 485) = 4.37 0.04
Excluding non-FFS participants in FFS villages Full sample
19
The validity of this simple regression method is based on the assumption that there is no selection bias due
to unobservables influencing both the choice of participation in FFS as well as the outcome. This means that, even
though participation in the program is endogenous, conditional on observables, it is not correlated with the error
term in the regression. While we have argued that this is a reasonable assumption for a pilot program such as FFS,
we also use an informal calculation proposed by Altonji, Elder, and Taber (2002) to evaluate the potential bias that
would be implied by selection on the unobservables. The idea is the following. Consider a simplified model without
interaction terms:
y w x= + + +m a b e0 , (3)
where y is the knowledge score, w is an indicator of FFS participation, the parameter a is the effect of FFS on
knowledge (the Average Treatment Effect rather than the Average Treatment Effect on the Treated in the full model
used above), xb captures the role of other observed factors that influence knowledge, and e combines all
unobservables. Under certain conditions, it is possible to show that selection on unobservables is comparable in
magnitude to the selection on observables in terms of its influence on the outcome y, in the sense that the normalized
difference between the average values of observables and of unobservables in the two groups are the same: 14
E x w x w
x
w wb bb
e ee
=( ) - =( )( ) =
=( ) - =( )( )
1 0 1 0E
var
E E
var. (4)
Under these conditions, by estimating equation (3) on the sample of FFS participants and non-participants from non
FFS villages, we can calculate how the index of observables in the knowledge equation varies with FFS
participation, and then ask how large the normalized shift due to unobservables would have to be in order to explain
away the entire FFS program effect. Applying this method we find that the bias due to unobservables on the
parameter a would be 2.7 points out of the average 7.6 points for the estimated average treatment effect. This is
likely to be an upper bound on the bias since the condition in equation (4) pessimistically assumes that the selected
covariates in the impact regression are a random sample of the full set of covariates. In any event, the bias
calculation suggests that selection due to unobservables is unlikely to wipe out the measured level of impact of the
FFS program on knowledge.
One approach to correct for selection on unobservables would be to estimate probit models that explain
which farmers are selected for participation in FFS and Andino, and then use the Heckman lambda approach
(Greene, 1997, p. 981) to correct for selection bias. This model is only weakly identified in our case, as there are no
evident instrumental variables that would explain farmer participation but would have no direct effect on
performance. The probit selection correction is identified by relying on a distributional assumption of joint
normality of the error terms in the selection and knowledge score equations (Heckman and Robb, 1985).
14 The conditions for equality of selection on observables and unobservables are that the included regressors should be a randomsubset of all factors that determine the outcome, and none of the factors dominate the distribution of program participation or theoutcome.
20
As an additional check for selection on unobservables, we estimate this model separately for FFS and
Andino participation.15 In both cases, we cannot reject the hypothesis that the error terms of the participation and
the test score equations are not correlated, further suggesting that selection on unobservables may not be a serious
problem. The estimated treatment effects are estimated to be 16.8 (s.e. 4.8) percentage points for FFS and 9.3 (s.e.
3.0) percentage points for Andino.
6.2. Estimation based on PPS matching methods
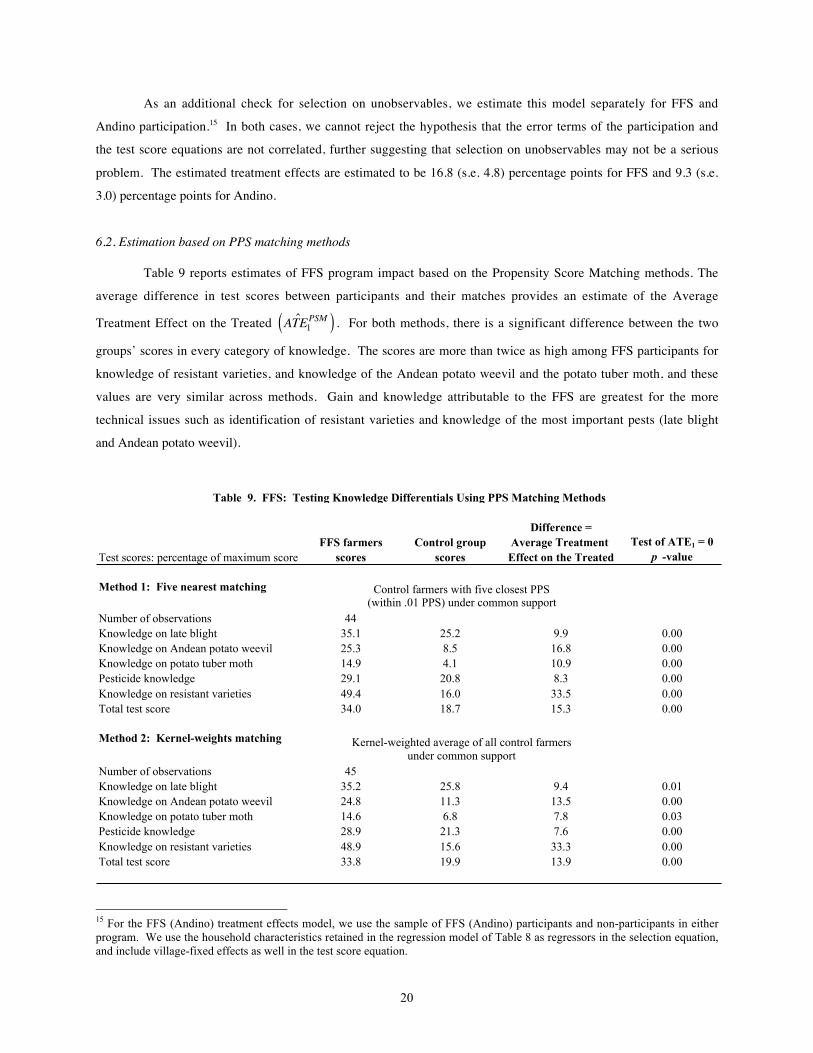
Table 9 reports estimates of FFS program impact based on the Propensity Score Matching methods. The
average difference in test scores between participants and their matches provides an estimate of the Average
Treatment Effect on the Treated ATE1PSM( ) . For both methods, there is a significant difference between the two
groups’ scores in every category of knowledge. The scores are more than twice as high among FFS participants for
knowledge of resistant varieties, and knowledge of the Andean potato weevil and the potato tuber moth, and these
values are very similar across methods. Gain and knowledge attributable to the FFS are greatest for the more
technical issues such as identification of resistant varieties and knowledge of the most important pests (late blight
and Andean potato weevil).
Difference =FFS farmers Control group Average Treatment Test of ATE1 = 0
Test scores: percentage of maximum score scores scores Effect on the Treated p -value
Method 1: Five nearest matching
Number of observations 44 Knowledge on late blight 35.1 25.2 9.9 0.00Knowledge on Andean potato weevil 25.3 8.5 16.8 0.00Knowledge on potato tuber moth 14.9 4.1 10.9 0.00Pesticide knowledge 29.1 20.8 8.3 0.00Knowledge on resistant varieties 49.4 16.0 33.5 0.00Total test score 34.0 18.7 15.3 0.00
Method 2: Kernel-weights matching
Number of observations 45 Knowledge on late blight 35.2 25.8 9.4 0.01Knowledge on Andean potato weevil 24.8 11.3 13.5 0.00Knowledge on potato tuber moth 14.6 6.8 7.8 0.03Pesticide knowledge 28.9 21.3 7.6 0.00Knowledge on resistant varieties 48.9 15.6 33.3 0.00Total test score 33.8 19.9 13.9 0.00
Table 9. FFS: Testing Knowledge Differentials Using PPS Matching Methods
Control farmers with five closest PPS (within .01 PPS) under common support
Kernel-weighted average of all control farmers under common support
15 For the FFS (Andino) treatment effects model, we use the sample of FFS (Andino) participants and non-participants in eitherprogram. We use the household characteristics retained in the regression model of Table 8 as regressors in the selection equation,and include village-fixed effects as well in the test score equation.

21
The impact estimates are robust to the different estimation methods: for the overall score, the two methods
give a remarkably similar estimate of 14 to 15 percentage points of program impact. This is also similar to the 13.8
percentage points estimate obtained with the regression method.
Knowledge scores are similarly significantly higher for Andino program participants relative to their
control group, with the two matching methods and for all categories of knowledge. We compare FFS and Andino
estimates in Table 10. For each of the programs, we bootstrap the kernel-weights matching procedure with 100
repetitions and compute the average and standard deviation of the estimated ATE1PSM . We report the p-value for the
test of equality of means from these two samples of estimates. Results show that ATE1PSM are higher for FFS than
for Andino. This is particularly the case for technical issues that matter most for farmers in the region: knowledge
of late blight, the Andean potato weevil, pesticides, and resistant varieties. For the total test score, the gain in
knowledge due to treatment for FFS participants (14.1, with standard deviation 2.7) is double that for Andino
participants (7.1 with standard deviation 1.5). All the means of ATE1PSM are significantly different between the two
programs at the 1% level.
Test of equality
of meansAverage St. dev. Average St. dev. p -value
Knowledge on late blight 13.0 (3.2) 4.0 (3.0) 0.00Knowledge on Andean potato weevil 16.0 (4.7) 4.0 (3.0) 0.00Knowledge on potato tuber moth 10.9 (3.4) 9.0 (2.5) 0.00Pesticide knowledge 6.6 (2.4) 4.4 (1.4) 0.00Knowledge on resistant varieties 26.2 (4.6) 17.4 (3.2) 0.00Total test score 14.1 (2.7) 7.1 (1.5) 0.00
Average and standard deviations are computed from bootstrapping the kernel-weights procedures 100 times.
Average Treatment Effect on Treated
AndinoFFS
Table 10. Differentials in Knowledge Gains: FFS vs. Andino
6.3. Robustness tests on the matching results
Given the fact that matching methods are usually applied when there exists a very large population of non-
participants for choosing proper matches, we might worry that our application of the approach to a small population
might lead to results that are not robust to specific choices of variables or samples. Table 11 reports on a number of
variations in the estimation procedure. Columns 2 and 3 report ATE1PSM estimates obtained by extending the
propensity score model to include plot and community characteristics (details on included variables are provided in
the notes to the Table). The extended models have similar explanatory power but balancing tests suggest that the
quality of matches are sensitive to model specification.16 In columns 4 and 5, we return to the original probit
specification, but use alternative samples. In the first case, we select a random sub-sample (80%) of farmers from
the groups of FFS participants and non-FFS participants. In the last column, we include non-FFS participants from
16 For the specification in column (2), balancing tests are rejected in 4 of the 32 cases in the five closest matching method and for3 of the 16 variables in the kernel-weights method. In column (3), balancing tests are rejected for 9 of 36 cases and 3 of 18variables in the five closest and kernel-weights matches, respectively.

22
FFS villages (they had been excluded because of the possibility of spillover effects) in the pool for potential matches
with FFS farmers. As with the previous variations, the quality of matches are indeed sensitive to the choice of
sample.17 However, the estimates of ATE1PSM are remarkably similar.
with plot with plot and Random Not excludingBase characteristics commumity ch. sub-sample FFS villages(1) (2) (3) (4) (5)
Method 1: Five nearest matchingKnowledge on late blight 9.9 10.4 12.7 15.6 12.0Knowledge on Andean potato weevil 16.8 16.8 16.6 15.7 16.3Knowledge on potato tuber moth 10.9 10.7 11.6 8.7 11.3Pesticide knowledge 8.3 8.1 6.3 7.7 6.1Knowledge on resistant varieties 33.5 32.9 30.3 36.9 29.1Total test score 15.3 15.3 14.5 15.9 14.1
Method 2 Kernel-weights matchingKnowledge on late blight 9.4 8.0 14.6 14.8 8.0Knowledge on Andean potato weevil 13.5 13.5 17.1 13.3 13.7Knowledge on potato tuber moth 7.8 4.6 11.3 9.4 4.0Pesticide knowledge 7.6 5.6 6.4 7.7 5.5Knowledge on resistant varieties 33.3 27.7 26.2 33.6 27.7Total test score 13.9 11.5 14.3 15.0 11.4
(1) Base estimation as reported in Table 9.
(4) Matching procedures performed on random subsamples of 80% of the FFS farmers and 80% of the non FFS farmers. (5) Non-participants from the FFS villages included in the pool of farmers for potential matching.
Table 11. Robustness of Average Treatment Effect from PPS Matching Methods
(2) Average plot characteristics (irrigated, rocky soil, fallowed, steep slope, area) included in participation probit.
(3) Community characteristics (distance from Camajarca, and presence of a dairy station) and plot characteristics included in participation probit.
Extended participation probit Variation on sample
In conclusion, all the variations on the matching method and the regression method yield similar results.
The FFS program increases the overall knowledge test score of participants by 11 to 15 percentage points, while the
Andino program increases knowledge of its participants by 7 to 9 percentage points. A few caveats are in order
when interpreting these results. First, as noted above, the FFS program was introduced in addition to the regular
activities of the Andino program, so that what we call FFS effect is effectively the cumulative effect of Andino
activity and FFS specific training. Second, FFS farmers were tested within the year of their specific FFS training
(Andino extension activities are permanent), and hence whatever increase in knowledge that is measured is a short-
term effect. Only time will tell if this knowledge lasts.
VII. From knowledge to productivity
As the FFS program was only in its first year of operation, we cannot expect yields of FFS participants to
yet reflect acquired knowledge from the FFS. This is because the output/input ratio is computed for the plots that
17 Only one out of 22 tests of equality of means between the treated and their matches is rejected for the five closest matchingmethod, and none for the kernel-weighting method in column (4) specification. The balancing tests reject 6 of 22 cases and 1variable out of 11 in the two methods in column (5).

23
were harvested during the year in which the FFS was occurring. Planting, and much of the spraying, was carried out
at the very inception of the program or perhaps even before participation started. This precludes the measure of an
average treatment effect of FFS on yield based on these observations.
For this reason, we choose to establish the relationship between agricultural knowledge and productivity on
the 245 plots of farmers from the non-FFS communities. We regress plot-level productivity on knowledge score,
controlling for plot characteristics and household productive assets, and correcting for clustering at the household
level. We also include village-fixed effects to control for village characteristics that may be correlated with both
knowledge and productivity. Results, reported in Table 12, show that a 10 percentage point increase in knowledge
score is associated with a 1.8 increase in the output/input ratio. A potential problem with this regression is the
endogeneity of knowledge. It is indeed likely that more entrepreneurial farmers are both more knowledgeable and
more productive. The OLS estimates would thus give an upward biased estimate of the effect of knowledge on
yield.
Mean Coefficient p -value
Knowledge score (0–100) 17.3 0.18 0.00Plot characteristics
Area of plot (hectare) 0.27 -4.30 0.01Steep slope 0.07 0.83 0.44Irrigated 0.32 1.62 0.01Fallowed last season 0.62 0.12 0.86
Household characteristicsEducation of household head 2.4 -0.06 0.90Age of household head 47.5 -0.01 0.80Number of workers in family 5.4 0.11 0.53Workers per hectare of arable land owned 1.21 0.01 0.97Value of farm assets (100 soles) 0.57 1.67 0.08Fraction of plots lost in El Niño 0.15 -1.39 0.14Credit constrained 0.28 -0.51 0.48
Community fixed effects included yesDependent variable: potato output/input ratio 7.7 (sd 4.8)Number of plots (150 households) 245R-squared 0.15
p -value computed from standard errors corrected for clustering at the household level.
Table 12. Impact of Score on Productivity in non-CARE CommunitiesDependent variable: Plot level potato output/input ratio
Given the cross-sectional nature of the data, it is difficult to find valid instruments, i.e., household variables
that are correlated with knowledge and do not influence productivity. We chose as instruments the average
knowledge score on varieties of farmers in the same age group in the community and its interactions with the arable
land owned by the household. These instruments together represent the influence of the common knowledge in the
24
age class, mediated by land wealth of the farmers. Although admittedly somewhat ad’hoc, these instruments are
statistically valid.18 The results of the instrumental variable regression (not reported) give a higher but not
significantly different coefficient of knowledge on yield of 0.29 (s.e. 0.18), suggesting that the OLS estimate is
unlikely to be upward biased.
Using the coefficients from the regression in Table 12 and the score differentials reported in Table 9, we
simulate the potential impact of FFS participation on productivity. Using the calculated score differential of 14
percentage points from FFS participation, this implies that farmer field school participation would have resulted in
an increase of 2.5 points in the output/input ratio. This corresponds to a 32% increase over the average observed
output/input ratio of 7.9, which corresponds to the value in a normal year. Note that non-seed inputs are not taken
into consideration in the productivity measure. Therefore, although higher knowledge scores help increase
productivity, we do not know if they result in higher profits.
VIII. Conclusions
The challenge of the FFS approach is whether training results in higher knowledge about complex technical
issues such as IPM and whether improved knowledge in turn translates into higher productivity. Using data on a
small-scale pilot FFS program targeted to Peruvian potato farmers, this paper finds that FFS participation
significantly enhances knowledge on pests, fungicides, and resistant varieties – all instrumental in implementing
IPM practices. The robustness of the positive results of FFS participation on knowledge is demonstrated by the fact
that two separate approaches (and several variations on each of them) used for estimating the effect of FFS yield the
same result: a fourteen-percentage point increase in knowledge score for FFS participants.
We also find evidence that the FFS approach adds to the traditional transfer-of-technology approach in
imparting knowledge of technical issues related to IPM to farmers. Gains in knowledge almost double when
participants of the Andino program also participate in farmer field schools. These results will need to be confirmed
with larger samples of participants to extension programs.
A caveat of our analysis, however, is that the knowledge test was applied to FFS farmers only shortly after
they completed their training. Its results thus reflect short-term knowledge acquisition. Re-surveying the
participants after time has elapsed would be necessary to confirm the effect of FFS in imparting lasting knowledge
related to IPM.
We have no direct observation that would allow us to measure the impact of FFS participation on
productivity. We therefore resort to a simulation exercise, based on the analysis of the association between
knowledge and productivity, among a sample of farmers that do not participate in FFS. If this association can be
interpreted as a causal relationship, and the fourteen percentage point increase in knowledge endures over time, then
our results indicate that FFS participation would raise the average potato seed output/input ratio by 2.5, or
18 The instruments are not significant when added directly in the productivity regression. The first stage regression indicated thatthe instruments were strong predictors of knowledge scores (F-statistic F(2,227) = 10.9, p–value =0.000). The overidentification

25
approximately 32% of the average value in a normal year. Given the timing of the survey, the results that we have
obtained are only suggestive. Collecting evidence to compare changes in actual productivity between FFS-treated
and untreated farmers over time would be necessary to confirm these results.
References
Altonji, Joseph , Todd Edler, and Christopher Taber. 2002. “Selection on Observed and Unobserved Variables:Assessing the Effectiveness of Catholic Schools.” Working Paper, Economics Department, NorthwesternUniversity.
Andrews, Donald. 1989. “Power in Econometric Applications.” Econometrica, 57(5): 1059–1090
Birkhaeuser, Dean, Evenson Robert, and Gershon Feder. 1991. "The Economic Impact of Agricultural Extension: aReview." Economic Development and Cultural Change, 39(3): 607–650.
Byerlee, Derek. 1994. “Technology Transfer Systems for Improved Crop Management: Lessons for the Future”. InJ. Anderson, ed., Agricultural Technology: Policy Issues for the International Community. Wallingford,UK: Cab International.
Feder, Gershon, and Roger Slade. 1986. A Comparative Analysis of Some Aspects of the Training and Visit Systemof Agricultural Extension in India. Journal of Development Studies, 22(3): 407–28.
Feder, Gershon, Rinku Murgai, and Jaime Quizon. 2004. “Sending Farmers Back to School: An EconomicEvaluation of the Farmer Field School (FFS) Extension Approach.” Review of Agricultural Economics26(1): 45-62.
Feder, Gershon, Anthony Willett, and Willem Zijp. 2001. “Agricultural Extension: Generic Challenges and theIngredients for Solutions.” In S. Wolf and D. Zilberman (eds) Knowledge Generation and TechnicalChange: Institutional Innovation in Agriculture. Kluwer: Boston, pp. 313–56.
Foster, Andrew, and Mark Rosenzweig. 1995. “Learning by Doing and Learning from Others: Human Capital andTechnical Change in Agriculture.” Journal of Political Economy, 103(6): 1176-1209.
Greene, W.H. 1997. Econometric Analysis. Prentice Hall, Third Edition.
Heckman, J.J. and R. Robb, Jr. 1985. “Alternative Methods for Evaluating the Impact of Interventions: An
Overview.” Journal of Econometrics 30:239-267.
Heckman, James, Hidehiko Ishimura, and Petra Todd. 1998. “Matching as an Econometric Evaluation Estimator.”Review of Economic Studies, 65: 261-294.
Jalan, Jyotsna, and Martin Ravallion, 2003. “Estimating the Benefit Incidence of an Anti-Poverty Program byPropensity-Score Matching”, Journal of Business and Economic Statistics¸ 21(1): 19-30.
Kenmore, Peter. 2002. “Integrated Pest Management”. International Journal of Occupational & EnvironmentalHealth 8(3):173-174.
test failed to reject the null hypothesis that the instruments are statistically valid (p–value = 0.91).
26
Nelson, R.J., R. Orrego, O. Ortiz, M. Mundt, M. Fredix, and N. V. Vien. 2001. “Working with Resource-poorFarmers to Mange Plant Diseases.” Plant Disease, 85(7): 684–695.
Ortiz, Oscar, and A. Valdez. 1993. “Enfoque de Sistemas y Metodología Participativa para Desarollar MediosEscritos de Comunicacíón Agrícola: El caso de la Papa en la Agricultura de Substitencia.” RevistaLatinoamericana de la Papa. Vol. 5/6: 103–121.
Picciotto, Robert, and Jock Anderson. 1997. “Reconsidering Agricultural Extension.” World Bank ResearchObserver. 12(2): 249-259.
Praneetvatakul, Suwanna, and Hermann Waibel. 2002. "A Socio-Economic Analysis of Farmer Field Schools (FFS)Implemented by the National Program on Integrated Pest Management of Thailand." Presented at theCYMMIT International Conference on Impacts of Agricultural Research and Development, February 4-72002, San Jose, Costa Rica.
Rola, A., S. Jamias, and Jaime Quizon. 2002. “Do Farmer Field School Graduates Retain and Share What TheyLearn?: An Investigation in Iloilo, Philippines.” Journal of International Agricultural and ExtensionEducation, 9(1): 65–76.
Rosenbaum, P.R., and Rubin, D.B. 1983. “The Central Role of the Propensity Score in Observational Studies forCausal Effects,” Biometrika, 70: 41-55.
Smith, Jeffrey, and Petra Todd. 2000. “Does Matching Overcome Lalonde’s Critique of Non-experimentalEstimators?” Working Paper, Economics Department, University of Pennsylvania.
Terrazas, F., V. Suarez, G. Gardener, G. Thiele, A. Devaux, and T. Walker. 1998. “Diagnosing Potato Productivityin Farmer's Fields in Bolivia,” International Potato Center, Social Science Department Working Paper, No.1998-5, Lima, Peru.
Van de Fliert, E., N. Johnson, R. Asmunati, and Wiyanto. 1999. "Beyond Higher Yields: The Impact of Sweetpotato Integrated Crop Management and Farmer Field Schools in Indonesia." CIP Program Report 1999-2000, pp. 331-342, Lima, Peru.
Vasquez-Caicedo, Gloria, Julio Portocarrero, Oscar Ortiz, and Cristina Fonseca. 2000. “Case Studies on Farmers’Perceptions about Farmer Field School (FFS) Implementation in San Miguel Peru: Contributing toEstablish the Baseline for Impact Evaluation of FFS.” Report to the DECRG from the World Bank, May.