Embed Size (px)
Citation preview

The Impact of Earnings Announcements on a Firm’s Information Environment*
Mark T. Bradshaw
Associate Professor
Boston College
Marlene A. Plumlee
Associate Professor
University of Utah
Benjamin C. Whipple
Assistant Professor
University of Georgia
Teri Lombardi Yohn
Professor
Indiana University
March 15, 2016
PRELIMINARY AND INCOMPLETE
_____________ * An earlier version of this paper benefitted from helpful comments from Dan Givoly and Erin McKenzie.
ABSTRACT
Prior research suggests that firm earnings announcements reduce information asymmetry in the
capital markets and level the playing field among investors by providing broadly available public
information. In contrast with these findings, Barron, Byard, and Kim (2002) find that the
commonality of analysts’ beliefs declines around earnings announcements. We revisit this research
question to examine how earnings announcement influence the investor information environment,
as opposed to the information environment for a specific set of active analysts. We use outstanding
earnings forecasts to calculate the ratio of common information uncertainty to total uncertainty
(the commonality of investor beliefs) and document predictable associations between firm and
earnings announcement disclosure characteristics and the commonality of beliefs. More
importantly, we find that earnings announcements increase rather than decrease the commonality
of beliefs about annual earnings. Further, bundled management forecasts (non-GAAP measures)
in the earnings announcement are associated with a more (less) pronounced increase in the
commonality of investor beliefs. Finally, we find that the pre-existing level of and change in
commonality of beliefs around earnings announcements differ across components of earnings (i.e.,
revenues and expenses). Overall, the study provides new evidence on how earnings
announcements influence the investor information environment and how firm and disclosure
characteristics moderate this relation.

1
I. INTRODUCTION
The public disclosure of financial information is viewed as one mechanism that reduces
information asymmetry in capital markets and levels the playing field among investors. For
example, the SEC argues that public disclosure is beneficial for sound investing decisions:
The laws and rules that govern the securities industry in the United States derive
from a simple and straightforward concept: all investors, whether large institutions
or private individuals, should have access to certain basic facts about an investment
prior to buying it, and so long as they hold it…This provides a common pool of
knowledge for all investors to use to judge for themselves whether to buy, sell, or
hold a particular security. Only through the steady flow of timely, comprehensive,
and accurate information can people make sound investment decisions.1
The SEC’s argument for public disclosure (e.g., quarterly earnings announcements) suggests that
increasing the common pool of knowledge levels the playing field and increases the health of
capital markets. This intuition is supported by analytical research on the effect of public
announcements on information asymmetry. Specifically, such research suggests that public
disclosures reduce information asymmetry by providing information otherwise held by only a
subset of investors (Verrecchia 1982). In addition, research suggests that information asymmetry
decreases after earnings announcements because of the dissemination of information to all
investors (Lev 1989).
Despite these predictions, using a proxy developed by Barron, Kim, Lim, and Stevens (1998)
(hereafter BKLS) for the commonality of analysts’ information sets, Barron, Byard, and Kim
(2002) (hereafter BBK) find that the commonality of analysts’ beliefs decreases around quarterly
earnings announcements. BBK conclude that individual analysts generate idiosyncratic
1 See “The Investor's Advocate: How the SEC Protects Investors, Maintains Market Integrity, and Facilitates Capital
Formation” available at http://www.sec.gov/about/whatwedo.shtml.
2
information after earnings announcements, leading to a decrease in the commonality of beliefs.2
Finding that earnings announcements lead to an overall reduction in the commonality of analysts’
beliefs is provocative because it suggests that an SEC-mandated public disclosure actually reduces
the common pool of knowledge and runs counter to the spirit of the SEC’s remarks that public
disclosure levels the playing field among investors.
We revisit this research question and alter BBK’s research design in two primary ways. First,
BBK restrict their sample to analysts who specifically issue a forecast during windows both before
and after the earnings announcement (active analysts) when estimating the commonality of beliefs.
As a result, BBK exclude the majority of analysts’ forecasts because their focus is on
understanding how accounting information triggers “the generation of idiosyncratic information
by elite information processers” (pg. 821). Given that analysts generally only update forecasts
when they have new information (Ivkovic and Jegadeesh 2004), BBK’s sample restriction likely
results in the inclusion of a biased set of analysts in the construction of the commonality of beliefs
measure. For example, while BBK’s sample firms have an unconditional median analyst following
of 33, but after imposing the restriction the median number of analysts included in the analyses is
4. Thus, BBK’s setting captures informed analysts’ commonality of beliefs rather than providing
a more general investor-level measure. We reexamine how the commonality of beliefs changes
around earnings announcements using a measure based on all analyst forecasts of annual earnings
in the pre- and post-quarterly earnings announcement periods, regardless of whether an analyst
appears in both windows, in order to examine the influence of earnings announcements on the
investor information environment. Prior studies have shown that analysts serve as a reasonable
2 Although earnings announcements increase the precision of both common and idiosyncratic information, BBK find
that the percentage increase in the precision of idiosyncratic information is larger, which results in an overall reduction
in the commonality of analysts’ beliefs.

3
proxy for investors (e.g., Barefield and Comiskey 1975; Fried and Givoly 1982); relaxing the BBK
restriction increases the number of forecasts in our commonality measure and enhances its ability
to capture the information environment faced by investors.3
Second, in contrast to BBK, we include the level of commonality of beliefs prior to the
earnings announcement as a control variable in our changes analysis. We argue that it is more
(less) likely that an earnings announcement will increase the commonality of beliefs when the level
of the commonality of beliefs is low (high) prior to the announcement. To support our contention,
we also examine the factors that influence the pre-earnings announcement level of commonality
of beliefs. Understanding and considering the level of the commonality of beliefs prior to the
announcement allows us to focus on how earnings announcements change the commonality of
beliefs.
Similar to BBK, we employ the methodology developed by BKLS which uses outstanding
earnings forecasts to construct measures of the uncertainty in the information environment. BKLS
include a measure of common information uncertainty (shared by analysts) and a measure of
idiosyncratic information uncertainty (held by individual analysts). Using these proxies, BKLS
calculate a “consensus” measure of commonality (defined as the ratio of common uncertainty to
total uncertainty), which provides a measure of the extent to which the average beliefs reflect
common rather than private information.4 We refer to this BKLS measure as the “commonality of
beliefs.”
3 Removing this pre and post restriction significantly increases our number of analyst forecasts because most analyst
forecast revisions occur just after the earnings announcement, and not necessarily before (e.g., Yezegel 2015; Li,
Ramesh, Shen, and Wu 2015). 4 BKLS are careful to highlight that their notion of “consensus” differs from the typical use of the term, where
practitioners and researchers mean the “average” analyst forecast. We do not use the “consensus” label in our study
to minimize this confusion.

4
In the first part of our study, we examine the association between the commonality of beliefs
prior to the earnings announcements and firm and prior earnings announcement characteristics.
This provides evidence on the determinants of the pre-earnings announcement information
environment faced by investors. As documented by BBK and others (e.g., Botosan, Plumlee and
Xie 2004; Horton, Serafeim and Serafeim 2013), there is significant cross-sectional and time-series
variation in the commonality of beliefs, although few studies have examined how firm-level
factors are associated with such variation. In our analyses, we include well-established covariates
such as firm size, analyst following, profitability, expected growth, and previous voluntary
disclosures (i.e., management forecasts and non-GAAP reporting). We find that the pre-earnings
announcement commonality of beliefs is positively associated with analyst following and firm
profitability, and negatively associated with market value of equity and expected growth. We also
find that the pre-earnings announcement level of commonality of beliefs is decreasing across fiscal
quarters, is higher for firms that issued a management forecast in the prior quarter and for firms
with a greater absolute earnings surprise in the previous earnings announcement, and is lower for
firms that reported earnings on a non-GAAP basis in the previous earnings announcement.
Next, we examine the change in the commonality of beliefs around earnings announcements.
Similar, to BBK, univariate analysis suggests a decrease in the commonality of beliefs around
earnings announcements. However, once we control for the level of pre-earnings announcement
belief commonality, we find that earnings announcements increase the commonality of beliefs.
This suggests that failing to control for the level of common beliefs appears to confound inferences
in BBK regarding how earnings announcements influence the commonality of beliefs.
Furthermore, we find that certain firm and earnings announcement characteristics are associated
with the change in the commonality of beliefs around earnings announcements. Specifically, we

5
find that the increase in the commonality of beliefs around earnings announcements is more
pronounced for firms with greater analyst following, greater profitability, positive earnings
surprises, and for firms that issue a management forecast with the earnings announcement. In
contrast, the increase in the commonality of beliefs is less pronounced for firms with a higher level
of pre-existing belief commonality, a greater market value, higher expected growth, a larger
absolute earnings surprise, and for firms that report non-GAAP measures in the earnings
announcement. We also note that the increase in the commonality of beliefs around earnings
announcements diminishes across fiscal quarters.
In the final section of our study, we extend our primary analyses by examining the level and
change in the commonality of beliefs about revenues and expenses separately. Similar to our main
analyses, we begin by examining how the information environment related to these components is
affected by firm and earnings announcement characteristics. We also examine whether earnings
announcements differentially impact the commonality of beliefs about revenues versus expenses.
Such an analysis is important because the difficulty in forecasting differs across revenues and
expenses (e.g., Bradshaw, Lee, and Peterson 2016).
We find that the level prior to and the change in the commonality of beliefs around earnings
announcements differ for revenues and expenses. Specifically, we document that the pre-earnings
announcement level of the commonality of beliefs about revenues is greater than the belief
commonality about expenses. Likewise, the decrease in the commonality of beliefs across fiscal
quarters is smaller for revenues than for expenses. We also document that the commonality of
beliefs about revenues is positively related to analyst following, whereas the commonality of
beliefs about expenses is not associated with analyst following. In addition, the commonality of

6
beliefs about revenues (expenses) is higher (lower) for firms that report non-GAAP measures in
the previous earnings announcement.
With respect to the change in the commonality of beliefs around earnings announcements,
we find that the increase in the commonality of beliefs about revenues is more pronounced than
the increase in the commonality of beliefs about expenses. Additionally, the increase in the
commonality of beliefs about revenues around earnings announcements is positively associated
with analyst following, positive earnings surprise, and expected growth, while the increase in
belief commonality about expenses is not associated with these factors. The increase in the
commonality of beliefs about revenues is less positively associated with profitability and more
negatively associated with firm size than the commonality of beliefs about expenses. We also find
that the reporting of non-GAAP measures in the earnings announcement is associated with a
greater increase in the commonality of beliefs about revenues but a smaller increase in belief
commonality about expenses.
These findings provide insight into how firm and earnings announcement characteristics
impact the level of commonality of investor beliefs, as well as how these characteristics influence
the change in belief commonality around earnings announcements. Certain firm characteristics –
including size, profitability, and growth – affect investor belief commonality but are not easily
controlled by managers. However, other managerial choices, such as the decision to bundle a
management forecast or to report non-GAAP adjustments within the earnings announcement affect
investor belief commonality and are under the control of management. Overall, our analysis
provides new insights into how the disclosure of accounting information affects the information
environment at the firm level, and revises our understanding from prior studies on how earnings
announcements influence belief commonality.
7
II. BACKGROUND AND RESEARCH QUESTIONS
Background
Theoretical research suggests that earnings announcements affect information asymmetry in
the market for a company’s stock because they provide information that is otherwise held by only
a subset of investors (Diamond and Verrecchia 1991). McNichols and Trueman (1994) and
Demski and Feltham (1994) show that if traders have short investment horizons, they intensify
their private information search at earnings announcement dates in order to profit from the earnings
release. In the same spirit, Kim and Verrecchia (1994) show that, if investors differ in their ability
to process earnings information, the release of earnings announcements will temporarily increase
information asymmetry at the announcement date. These studies characterize the release of
information as triggering an increase in information asymmetry among investors at the
announcement.
In contrast, studies like Lev (1989) argue that information asymmetry decreases after an
earnings announcement as investors have more available information, which presumably levels
the playing field across investors. The argument follows analytical models demonstrating that
financial statement information helps reduce information asymmetry between the firm and
investors (Verrecchia 1982; Diamond 1985; Bushman 1991). Several empirical studies
corroborate the implications of these models and demonstrate that earnings announcements
ultimately decrease overall information asymmetry (Krinksy and Lee 1996; Lee, Mucklow and
Ready 1993; Yohn 1998).
Thus, both theoretical and empirical research supports the notion that earnings
announcements temporarily increase information asymmetry in the short-term but level the playing
field over the longer-term. In contrast, BBK employ empirical measures based on constructs

8
developed by BKLS and provide the interesting result that earnings announcements trigger the
generation of new, idiosyncratic information by sell-side analysts such that the commonality of
beliefs about earnings is reduced. Specifically, using changes in forecasts by analysts who provide
forecasts immediately before and immediately after the earnings announcement for a sample of
365 firms over eight quarters, BBK show that quarterly earnings announcements lead to a decrease
in the commonality of beliefs about earnings..
The main contribution of BBK is to use the methodology in BKLS to examine the generation
of idiosyncratic information by informed analysts around earnings announcements. Their results
suggest that longer-horizon forecasts primarily reflect common information, while shorter-horizon
forecasts reflect more common as well as more idiosyncratic information. In their study, the
increasing precision of idiosyncratic information outpaces the increasing precision of common
information, resulting in idiosyncratic information precision crowding out common information
precision across quarters within a fiscal year. Numerous studies build on BBKs’ evidence that
earnings announcements lead to more private information and greater information asymmetry in
the capital markets (Mayew, Sharp and Venkatachalam 2013; Mayew 2008; Botosan et al. 2004).
We revisit the question of how earnings announcements influence firms’ information
environments, but instead of limiting our examination to the information environment based on a
subset of analysts who actively update their forecasts in windows both before and after the earnings
announcement, we consider the broader information environment by considering all analysts that
cover a firm around an earnings announcement. Ivkovic and Jegadeesh (2004) find that analysts
who revise their forecasts prior to an earnings announcement have access to more precise
information relative to other analysts, consistent with those analysts being relatively better
informed than their counterparts who do not revise prior to the earnings announcement. Thus, by

9
reexamining this research question and including all analyst forecasts in the pre- and post-earnings
announcement period, we are able to capture the commonality of beliefs across a broader set of
analysts. The beliefs of this broader set of analysts are more likely to reflect the overall investor
information environment rather than the environment faced by active analysts.
Unlike BBK, we also condition changes in the commonality of beliefs on the level of belief
commonality prior to the earnings announcement in our study. We begin with the notion that it is
more (less) likely that an earnings announcement will increase the commonality of beliefs when
the pre-announcement level of the commonality of beliefs is lower (higher). This conditioning
allows for a tighter focus on how earnings announcements change the commonality of beliefs.
Therefore, our primary interest is in revisiting the question of how earnings announcements
influence the information environment faced by investors. We also provide insight into how a firm
might influence its information environment around earnings announcements through voluntary
disclosure.
Hypotheses Development
We begin by identifying firm characteristics that we expect to be associated the level of pre-
earnings announcement belief commonality. Prior research finds that firms with greater analyst
following have lower information asymmetry (Frankel and Li 2004; Roulstone 2003). Thus, we
conjecture that firms with greater analyst following are likely to experience a greater commonality
of beliefs prior to a quarterly earnings announcement. On the other hand, prior research also
suggests that larger firms are more complex with multiple products spanning multiple geographic
areas and are likely to provide more extensive disclosures (Buzby 1975), which could lead to a
lower commonality of investor beliefs. We therefore expect a negative relation between the pre-
earnings announcement level of belief commonality and firm size, after controlling for analyst
following.

10
We also expect that more profitable firms and firms with lower expected growth are likely
to be associated with a higher level of pre-earnings announcement belief commonality. We argue
that characteristics that lead to more persistent profitability will trigger a higher level of pre-
earnings announcement belief commonality as there is less need for analysts to search for and
interpret private information to forecast future earnings. Indeed, prior research suggests that higher
profitability (Hayn 1995) and lower growth (Fairfield, Whisenant, and Yohn 2003) are associated
with more persistent profitability. Finally, BBK document that the commonality of analysts’
beliefs decreases across fiscal quarters. Based on this and the increasing amount of information to
process over the quarters, we expect the pre-earnings announcement level of investor belief
commonality to be lower across fiscal quarters.5 These arguments lead to our first hypothesis:
Hypothesis 1: The pre-earnings announcement level of commonality of investor beliefs about
annual earnings is positively associated with analyst following and profitability and
negatively associated with firm size, expected growth, and fiscal quarter.
As noted above, our setting differs from the setting examined in BBK because we are
primarily interested in the change in the commonality of beliefs among investors more generally,
while BBK focus on the change in the commonality of beliefs among analysts who revised their
forecasts in windows before and after the earnings announcement. Given that prior analytical and
empirical research suggests that the information asymmetry faced by investors decreases around
earnings announcements, we expect that inferences from BBK’s study will not generalize to the
overall information environment faced by investors.
Specifically, prior theoretical research suggests that public disclosure increases private
information acquisition prior to the public disclosure and generates differential interpretation of
5 While this might seem counter-intuitive, it is important to remember that the commonality of beliefs is related to the
remaining uncertainty. Each fiscal quarter, a lower proportion of annual earnings remain uncertain. The commonality
of beliefs at each point provides the proportion of the remaining uncertainty that is common versus idiosyncratic.

11
the information at the public disclosure (e.g., Holthausen and Verrecchia 1990; Kim and
Verrecchia 1994, 1997). Likewise, prior archival research documents greater information
asymmetry prior to and at public disclosures (e.g., Krinksy and Lee 1996; Yohn 1998). However,
research also suggests that public information disclosure reduces information asymmetry because
it provides information that is otherwise held by only a subset of investors (Verrecchia 1982). This
research suggests that information asymmetry decreases from before to after an earnings
announcement as the announcement levels the playing field in terms of the information available
to investors (Lev 1989). This prediction is also supported by empirical research (e.g. Krinsky and
Lee 1996; Yohn 1998). Based on this evidence, we expect the commonality of investor beliefs
about annual earnings to increase around quarterly earnings announcements. This leads to our
second hypothesis:
Hypothesis 2a: After controlling for the level of pre-earnings announcement commonality of
investor beliefs, earnings announcements increase the commonality of investor beliefs about
annual earnings.
We also expect the change in the commonality of investor beliefs around earnings
announcements to be associated with firm and disclosure characteristics as discussed in hypothesis
H1. This leads to the following hypothesis.
Hypothesis 2b: The change in the commonality of investor beliefs around earnings
announcements is positively associated with analyst following and profitability, and
negatively associated with firm size, expected growth, and fiscal quarter.
We are also interested in understanding how firm voluntary disclosure can affect the
information environment, which is the focus of numerous studies (e.g. Firth 1979; Pownall and
Waymire 1989; Pownall, Wasley and Waymire 1993; Francis, Nanda and Olsson 2008). We
exploit the BKLS methodology to quantify the impact of voluntary disclosure on the commonality
of investor beliefs.

12
We examine two significant voluntary disclosures frequently included in earnings
announcements: management earnings forecasts and non-GAAP earnings disclosures.
Management earnings forecasts are often provided concurrently with earnings announcements
(Hutton, Miller, and Skinner 2003; Rogers and Van Buskirk 2013) and are viewed as informative
by investors (Waymire 1984; Ajinkya and Gift 1985). 6 Prior studies have documented that
management earnings forecasts impact investors’ and analysts’ earnings expectations and equity
prices (e.g., Baginski, Conrad, and Hassel 1993) and reduce information asymmetry (Coller and
Yohn 1997). Thus, we expect investors to rely less on idiosyncratic information production and
more on common information provided by management forecasts, leading to an increase in the
commonality of investor beliefs.
Prior research also documents that non-GAAP earnings disclosures within the earnings
announcement are increasingly common in capital markets and are viewed as informative to the
investors (e.g., Bradshaw and Sloan 2002; Bentley et al. 2015). Managers’ disclosure of non-
GAAP earnings also has conflicting effects on investor beliefs. For example, Bhattacharya, Black,
Christensen and Larson (2003) conclude that investors view non-GAAP metrics as more reflective
of core operating performance than GAAP earnings, and Lougee and Marquardt (2004) find that
non-GAAP earnings are particularly useful when GAAP earnings informativeness is low.
However, Bradshaw and Sloan (2002) speculate that managers might report non-GAAP metrics
for opportunistic reasons, such as to garner higher market valuations through more favorable non-
GAAP earnings metrics. Several studies find evidence consistent with opportunism motivating
6 Rogers and VanBuskirk (2013) document that ‘bundled’ forecasts (management earnings forecasts provided within
a five-day period around an earnings announcement) are increasingly common and constitute more than 63 percent of
their sample.
13
non-GAAP reporting for certain firms (e.g., Doyle, Lundholm and Soliman 2013; Curtis,
Lundholm and McVay 2014).
Non-GAAP metrics also appear to generate different responses across investor types. For
example, Bhattacharya, Black, Christensen, and Mergenthaler (2007) find that non-GAAP
reporting in earnings announcements encourages trading by less sophisticated investors, while
sophisticated investors are unaffected. In addition, Christensen et al. (2014) find that short sellers
trade as if non-GAAP reporting creates an exploitable information advantage. Because non-GAAP
earnings appears to trigger different responses for different investors, we hypothesize that various
investors process non-GAAP earnings differently, which would result in a lower commonality of
beliefs. These arguments lead to the following hypotheses:
Hypothesis 3a: The pre-earnings announcement level of the commonality of investor beliefs
about annual earnings is positively associated with the prior disclosure of a management
forecast and is negatively associated with the prior disclosure of non-GAAP earnings.
Hypothesis 3b: The change in the commonality of investor beliefs around earnings
announcements is positively associated with the disclosure of a management forecast and is
negatively associated with the disclosure of non-GAAP earnings.
Our final set of hypotheses predicts how earnings announcements affect the commonality of
investor beliefs about revenues and expenses. Revenues are more persistent than earnings and are
demonstrably easier to predict (Ertimur, Livnat and Martikainen 2003; Bradshaw, Lee and
Peterson 2016). In contrast, expenses are more complicated and idiosyncratic than revenues,
leading analysts to not fully incorporate the behavior of expenses into their forecasts. For example,
Kim and Prather-Kinsey (2010) suggest that analysts assume equal growth rates for expenses and
revenues and do not consider fixed costs, and Baumgarten, Berens, and Homburg (2011) find that
analyst forecasts appear to disregard cost stickiness, where costs decrease less with declines in
revenue than they increase with revenue growth. As a result, we expect a lower commonality of
investor beliefs about expenses relative to revenues, in general, and that earnings announcements
14
lead to a larger increase in the commonality of investor beliefs about revenues than about expenses.
This leads to our final set of hypotheses:
Hypothesis 4a: The pre-earnings announcement commonality of investor beliefs about
annual expenses is lower than the pre-earnings announcement commonality of investor
beliefs about annual revenues.
Hypothesis 4b: The increase in the commonality of investor beliefs around earnings
announcements is larger for annual revenues than for annual expenses.
III. SAMPLE SELECTION AND RESEARCH DESIGN
We use I/B/E/S to identify analysts’ forecasts of annual performance for fiscal years ending
2004-2014. We begin our sample in 2004, the year analyst component forecasts first became
widely available. Because we are interested in how firms’ information environments for annual
performance change throughout the fiscal year, we compare the information environments around
the first, second, and third fiscal quarters. For each quarter, we examine analysts’ forecasts of
earnings per share, revenue, and expenses (EPS, REV, and EXP) around the associated earnings
announcement. Because I/B/E/S does not contain explicit expense forecasts, we infer each
analyst’s expense forecast by taking the difference between their revenue and net income forecasts.
We merge the I/B/E/S analyst data with the Compustat dataset and the I/B/E/S management
guidance dataset and limit our analysis to observations with non-missing variables used in our
regression analyses. This selection process yields a final sample of 54,900 firm-quarter
observations.
As discussed earlier, we employ BKLS’s “consensus” measure (ρ) to capture the
commonality of investor beliefs, where ρ is defined as “the proportion of total information

15
uncertainty that is common among all capital market participants.” BKLS calculate ρ using
observable features of analysts’ forecasts as follows:7
𝜌 ≡ 𝐶
𝑉 =
𝐶𝑜𝑚𝑚𝑜𝑛 𝑈𝑛𝑐𝑒𝑟𝑡𝑎𝑖𝑛𝑡𝑦
𝑇𝑜𝑡𝑎𝑙 𝑈𝑛𝑐𝑒𝑟𝑡𝑎𝑖𝑛𝑡𝑦=
(𝑆𝐸− 𝐷
𝑁)
(𝑆𝐸− 𝐷
𝑁)+𝐷
,
where SE is the squared error in the median forecast, D is the dispersion in the forecasts, and N is
the number of analysts that provide a forecast. Total uncertainty (V) is the sum of common
uncertainty (C) and idiosyncratic uncertainty (D). In theory, ρ can range from zero (there is no
common uncertainty) to one (the uncertainty is comprised of only common uncertainty).8 We
calculate these metrics before and after quarterly earnings announcements for earnings per share
(EPS), revenues (REV), and expenses (EXP). See Appendix A for a more detailed variable
definition.
We begin our analyses by examining the determinants of a firm’s information environment
just prior to the earnings announcement (pre-earnings announcement level of investor belief
commonality) because the existing environment likely influences how an earnings announcement
changes that environment. Our analysis is based on the following model.
ρEPSq = α + β1Q2 + β2Q3 + β3MVEq-1 + β4AF_EPSq-1 + β5ROAq-1 + β6B/Mq-1
+ β7Pos_Surpq-1 + β8|EPSSurp|q-1 + β9MEFq-1 + β10NonGAAP_EPSq-1 + ε (1)
The dependent variable is the commonality of beliefs based on outstanding annual EPS forecasts
(ρEPS) prior to the quarterly earnings announcement. We include Q2 (Q3), which equal one when
ρEPS is measured prior to the second (third) fiscal quarter and zero otherwise. These quarterly
indicator variables, along with the intercept, provide insight into how the commonality of investor
7 See BBK’s (2002) equation 3. 8 The BKLS calculation might result in negative ρ when SE is quite small or zero (the consensus forecast is either very
close or equal to the reported value) and/or when D/N (dispersion divided by the number of analysts providing
forecasts) is large. This has been documented in prior studies that rely on the BKLS metric (e.g., Botosan et al. 2004).
In untabulated analyses, we confirm that observations with negative ρ do not unduly influence our inferences.

16
beliefs varies across the fiscal year. The remaining explanatory variables are lagged values (by one
quarter) of the relevant firm and earnings announcement characteristics that we predict are related
to the commonality of beliefs: firm size (market value of equity - MVE), analyst following (the
number of analysts that provide EPS forecasts - AF_EPS), profitability (return on assets - ROA),
and expected growth (book to market – B/M). We also include variables to capture earnings
announcement characteristics. Pos_Surp is an indicator variable equal to one if the firm had a
positive earnings surprise and |EPSSurp| is the absolute value of that earnings surprise (i.e., the
magnitude of the surprise). MEF (NonGAAP_EPS) is an indicator variable set equal to one if a
firm provided a management earnings forecast in the prior quarter (reported non-GAAP earnings
in its prior quarter’s earnings announcement).9 We include year and industry fixed effects, use
robust standard errors, and cluster the standard errors by firm. Hypotheses H1 and H3a predict
positive coefficients on AF_EPS, ROA, B/M, and MEF, and negative coefficients on Q2, Q3, MVE,
and NonGAAP_EPS.
Next, we examine the association between the change in the commonality of beliefs and firm
and earnings announcement characteristics using the following model:
ΔρEPSq = α + β1ρEPSq + β2Q2 + β3Q3 +β4MVEq +β5AF_EPSq + β6ROAq +β7B/Mq
+ β8Pos_Surpq +β9|EPSSurp|q +β10BundledEPSq +β11NonGAAP_EPSq + ε (2)
Our dependent variable is the change in ρ (Δρ), calculated as the difference between ρ measured
after the quarterly earnings announcement and ρ measured before the earnings announcement.
Thus, a positive (negative) value reflects an increase (decrease) in the commonality of investor
beliefs around the earnings announcement. As discussed earlier, we control for the level of the pre-
earnings announcement commonality of beliefs by including the pre-earnings announcement value
of ρ. In addition, to examine how firm and earnings announcement characteristics influence the
9 Detailed variables definitions for all analyses are in Appendix A.

17
change in the commonality of investor beliefs around the earnings announcement, Model (2)
includes the concurrent levels of the firm and earnings announcement characteristics.
Hypothesis 2a predicts a positive Δρ around an earnings announcement after controlling
for the pre-announcement commonality of beliefs, which implies a positive intercept (α).
Hypotheses 2b and 3b predict positive coefficients on AF_EPS, ROA, B/M, and BundledEPS, and
negative coefficients on Q2, Q3, MVE, and NonGAAP_EPS.
For our final set of tests, we re-examine how firm and earnings announcement characteristics
are associated with the commonality of investor beliefs about revenues and expenses. We employ
Models (1) and (2) but calculate both the level and change in the commonality of beliefs for
revenues (ρREV, ΔρREV) and expenses (ρEXP, ΔρEXP) based on analyst forecasts of annual revenues
and expenses. We examine differences in the overall explanatory power of the models and the
coefficients on the explanatory variables to provide evidence related to Hypotheses 4. Estimating
Model (1) using revenue and expense forecasts provides evidence on whether the level of
commonality of beliefs about these components is differentially associated with firm and
disclosure characteristics. Estimating Model (2) using revenue and expense forecasts provides
evidence on whether firm and disclosure characteristics differentially impact the change in the
commonality of beliefs about these components.
IV. EMPIRICAL RESULTS
Descriptive Statistics
Table 1 provides descriptive statistics related to firm, commonality, and earnings
announcement characteristics taken during the first fiscal quarter of the year. Consistent with other
studies that require analyst forecasts of EPS, revenues, and expenses, our sample is comprised of
larger firms, with a mean (median) MVE of $7.9 (1.99) billion and an average of 12.1 analysts
18
providing an annual EPS forecast prior to the first quarter earnings announcement. Mean (median)
ROA is 0.007 (0.010) and just under 21 percent of our sample firms report negative quarterly
earnings. Consistent with analysts’ forecasts being optimistic in the beginning of the year (Lim
2001), analysts’ consensus annual EPS forecasts (F_EPS) exceed firms’ reported EPS (EPS). The
commonality of beliefs is highest when measured based on EPS forecasts (ρEPS ) with a mean
(median) value of 0.657 (0.822).10 In contrast, the mean (median) ρREV is 0.588 (0.746) and the
mean (median) ρEXP is 0.559 (0.697). In our sample, 27.2 percent of the earnings announcements
are bundled with EPS forecasts (BundledEPS), and 50.4 percent of earnings announcements
include a non-GAAP earnings disclosure (NonGAAP_EPS).
Following BBK, we begin by providing a graphical representation of how the commonality
of beliefs changes around earnings announcements by plotting the commonality values around the
quarterly earnings announcements (Figure 1). Consistent with the univariate findings in BBK, we
find a decrease in the median commonality of beliefs about EPS across all three fiscal quarters. In
addition, the rate of decrease in the commonality of beliefs about EPS increases across the fiscal
quarters. We also plot the median commonality values for revenues and expenses. Although we
find that the commonality of beliefs decreases for both revenues and expenses around earnings
announcements, the decrease is greater for expenses than for revenues. In addition, the decrease in
belief commonality throughout the year for revenues is relatively stable when compared to that for
expenses, which decreases at an increasing rate throughout the year. Overall, this figure provides
descriptive evidence that the commonality of beliefs about EPS decreases around earnings
announcements and that the decrease is primarily attributable to decreases in the commonality of
10 To provide a direct comparison of our ρEPS to the similar calculation in BBK, we find that median ρEPS just before
the first quarter earnings announcement is 0.822, while BBK find the median value to be 0.89. There are several
reasons that likely explain why our calculation is slightly lower than that of BBK, such different time periods (2004-
2014 versus 1986-1997), broader firm and analyst coverage, and differences in sample selection criteria.

19
beliefs for expenses, particularly in the second and third quarters. These results also suggest that
BBK’s decision to restrict their analyses to active analysts does not affect the findings.
Test of Hypothesis 1
Table 2 provides results related to Hypothesis 1, where we examine the association
between the commonality of beliefs prior to an earnings announcement (ρEPS) and firm and
disclosure characteristics. The first column of Table 2 presents results when we include indicator
variables to capture whether the EPS announcement is made in the second or third fiscal quarter.
The second and third columns present results when we expand the model to include firm and
disclosure characteristics, respectively.
In the first column, we document that the average level of ρEPS prior to the first quarter
earnings announcement is approximately 0.714 and that the average level decreases across the
fiscal year (-0.049 in Q2 and -0.128 in Q3). In column two of Table 2, we expand the model to
include firm-specific characteristics that we predict to be associated with ρEPS. Consistent with our
predictions, we find that firms with greater analyst following (AF_EPSq-1), more profitable firms
(ROAq-1), and firms with lower growth opportunities (B/Mq-1) have higher levels of belief
commonality, while larger firms (MVEq-1) have lower levels of belief commonality. In the final
column in Table 2, we include earnings announcement characteristics in the model. We find that
the level of commonality of beliefs is higher when the firm previously issued a management
earnings forecast (MEFq-1) or reported a larger earnings surprise in the prior quarter (|EPSSurp|q-
1). When a firm provided non-GAAP earnings disclosure in the prior quarter (NonGAAP_EPSq-1),
however, the level of commonality of beliefs is lower.
Overall our results are consistent with high levels of belief commonality about earnings on
average across all three quarters and with a systematic association between a number of firm and

20
disclosure characteristics and the commonality of beliefs prior to an earnings announcement. The
decrease in the commonality of beliefs across quarters (Q2 and Q3) is consistent with the findings
in BBK, and with the commonality of beliefs decreasing across time.
Tests of Hypothesis 2 and Hypothesis 3
In Table 3, we present the results of regressing the change in the commonality of beliefs
around quarterly earnings announcements on the level of the commonality of beliefs and the
concurrent values of the explanatory variables included in Table 2. Our goal is to provide evidence
on how firm and disclosure characteristics influence how earnings announcements impact the
commonality of beliefs. In contrast to BBK’s research design, we employ a multivariate analysis,
which allows us to control for the pre-earnings announcement level of the commonality of beliefs
and factors other than the presence of an earnings announcement. We also directly examine the
impact of firm disclosures (management earnings forecasts and non-GAAP earnings disclosures)
on the change in ρEPS.
In the first column of Table 3, we present benchmark results by regressing ΔρEPS on ρEPS.
In the second and third columns, we include firm and earnings announcement characteristics in the
regression. For all three models, we find that the change in the commonality of beliefs (ΔρEPS) is
negatively associated with the pre-existing level, ρEPS. Intuitively, when the commonality of beliefs
before the announcement is high increases in belief commonality around an earnings
announcement are smaller. With this evidence, we view BBK’s results showing a decrease in the
commonality of beliefs as being partially affected by the high levels of ρEPS prevailing at the
beginning of a fiscal year in their study (e.g., the median ρEPS just before the first quarter earnings
announcement in BBK is 0.89, page 833 in their Table 2).

21
The overall explanatory power of the first model is high, with the pre-earnings
announcement level of the commonality of beliefs explaining almost 20 percent of the variation in
the change in commonality of beliefs. In addition, we find a positive intercept in all three
specifications, suggesting that after controlling for the level of the commonality of beliefs, the
commonality of beliefs increases around earnings announcements, consistent with Hypothesis 2.
When we expand our model to include additional explanatory variables, including an
indicator variable for whether the earnings announcement is related to the second or third quarter
earnings, we find a slight increase in the overall explanatory power of the model (from an R2 of
0.194 to 0.208). The commonality of beliefs (i.e., intercept) increases around each quarterly
earnings announcement: the increase is greatest for the first quarter. In addition, we find a less
pronounced increase in the commonality of beliefs for larger firms (MVE) and a more pronounced
increase in the commonality of beliefs for firms with greater analyst following (AF_EPS), more
profitable firms (ROA), and firms with lower growth opportunities (B/M).
In the final column of Table 3, we include variables to capture cross-sectional differences
in earnings announcements: an indicator variable to capture a positive earnings surprise
(Pos_Surp), a variable to capture the magnitude of the earnings surprise (|EPSSurp|), and two
indicator variables to capture whether the firm provides a bundled earnings forecast (BundledEPS)
or a non-GAAP earnings disclosure (NonGAAP_EPS) concurrent with the earnings
announcement. We document a positive (negative) association between the sign of the earnings
surprise (the magnitude of the surprise) and the change in the commonality of beliefs around the
earnings announcement. In addition, we document that when a firm issues a management earnings
forecast concurrent with its earnings announcement, the increase in the commonality of beliefs is
more pronounced, consistent with Hypothesis 3a. In contrast, we document that when a firm
22
discloses non-GAAP earnings in its earnings announcement, the increase in the commonality of
beliefs is less pronounced, consistent with Hypothesis 3b.
Overall, the results in Table 3 suggest that earnings announcements are associated with an
increase in the commonality of beliefs (i.e., the intercepts) after controlling for the prior level of
beliefs. Furthermore, we find that the greatest increase in the commonality of beliefs occurs around
the first quarter earnings announcement. We also find that voluntary disclosure in the form of a
management earnings forecast is associated with a greater increase in the commonality of beliefs,
while voluntary disclosure in the form of providing non-GAAP earnings is associated with a
smaller increase in the commonality of beliefs around the earnings announcement.
Test of Hypothesis 4
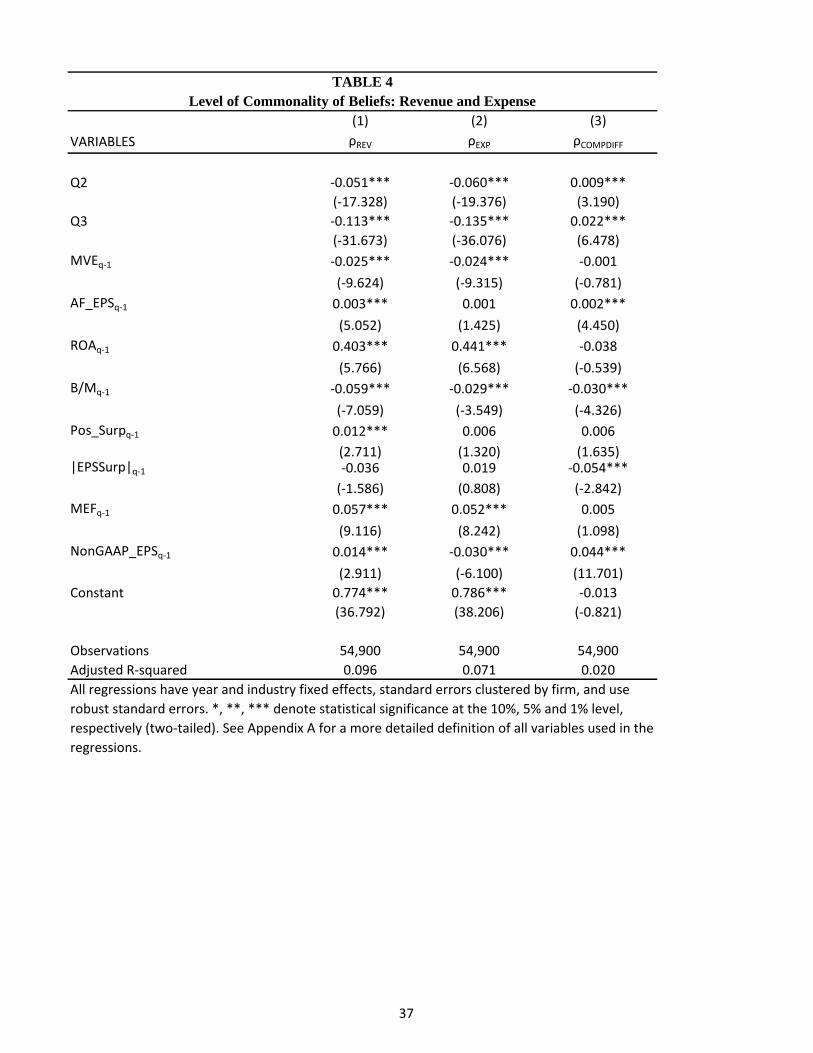
Table 4 provides results related to Hypothesis 4a, where we examine the association
between the commonality of beliefs related to revenues and expenses separately (ρREV and ρEXP)
prior to an earnings announcement and firm and disclosure characteristics. The first column
presents the results when ρREV is the dependent measure, the second column presents the results
when ρEXP is the dependent measure, and the third column presents the results when the firm-
specific difference between ρREV and ρEXP is the dependent measure. We include the full model in
all three columns. Consistent with the results for ρEPS, we find that the mean level of the
commonality of beliefs is high for both revenues and expenses: the level does not differ across the
two components (the intercept in the third column is insignificant). In addition, the level of the
commonality of beliefs about revenues and expenses is lower when the commonality is measured
immediately prior to the second quarter earnings announcement and lower still when the
commonality of beliefs is measured immediately prior to the third quarter earnings announcement.
23
Our results suggest that the average level of ρEXP is lower than the average level of ρREV in both the
second and third quarters.11
We also document a positive association between ρREV and ρEXP and firm profitability
(ROA), and the previous issuance of a management earnings forecast (MEF), and a negative
association between the commonality of beliefs about both components and firm size (MVE),
consistent with our ρEPS model. In contrast to our ρEPS findings, however, we find that firms with
less growth potential (B/M) have lower levels of ρREV and ρEXP. We also find that the issuance of a
non-GAAP earnings metric is associated with greater ρREV, but with lower ρEXP. Finally, we
document that analyst following and a previous positive earnings surprise is associated with a
higher level of ρREV but is unrelated to ρEXP. The final column in Table 4 suggests that several firm
and announcement characteristics explain the difference in the commonality of beliefs about
revenues versus expenses (ρREV vs ρEXP). Specifically, analyst following (AF_EPS), growth
potential (B/M), the magnitude of the prior period earnings surprise (|EPSSurp|), and the issuance
of a non-GAAP earnings metric in the previous earnings announcement (NonGAAP_EPS) explain
the difference in the commonality of beliefs about revenues versus expenses. Overall, we explain
almost 10 percent of the level of ρREV and just over seven percent of the level of ρEXP; in Table 2
we explain 5.6 percent of the variation in the level of ρEPS – the sum of REV and EXP.
Table 5 provides the results of regressing ΔρREV and ΔρEXP (changes in the commonality of
beliefs) and the difference between these two values on the explanatory variables. The signs of the
coefficients in the ΔρREV and ΔρEXP regression models are generally consistent with the findings
when we employ ΔρEPS as the dependent variable. However, we do find some differences in the
relation between the explanatory variables and ΔρREV versus ΔρEXP. For example, the increase in
11 The negative coefficients on Q2 and Q3 are statistically greater in the ρEXP model than the ρREV model.

24
the commonality of beliefs about revenues is more pronounced than the increase in the
commonality of beliefs about expenses around earning announcements. Moreover, the change in
the commonality of beliefs about revenues around earnings announcements is more negatively
associated with firm size than the change in the commonality of beliefs about expenses around
earnings announcement. Further, the increase in the commonality of beliefs about revenues around
earnings announcements is positively associated with analyst following and negatively associated
with B/M while the increase in the commonality of beliefs about expenses around earnings
announcements is not associated with these factors. The increase in the commonality of beliefs
about revenues is less positively associated with profitability than the commonality of beliefs about
expenses. With respect to the earnings announcement characteristics, we find that the reporting of
non-GAAP measures in the earnings announcement is associated with a larger increase in belief
commonality about revenues but with a smaller increase in belief commonality about expenses. A
positive earnings surprise is associated with a greater increase in the commonality of beliefs about
revenues but not expenses.
The results provided in Tables 4 and 5 suggest that the impact of earnings announcements
and firm and earnings announcement characteristics on the level and change in belief commonality
about revenues differs from the impact on the level and change in belief commonality about
expenses, suggesting that understanding the association between earnings announcements and the
commonality of beliefs about earnings can be enhanced by decomposing earnings into revenues
and expenses.
Additional Analysis
Finally, we examine the levels and changes in the two components that are combined to
calculate the commonality of beliefs – common and idiosyncratic uncertainty (C and D). The
25
results of this analysis are presented in Table 6. In columns one and two, we present the results of
regressing the levels of C and D on the explanatory variables and in columns three and four we
present the results of regressing changes in C and D on the explanatory variables.
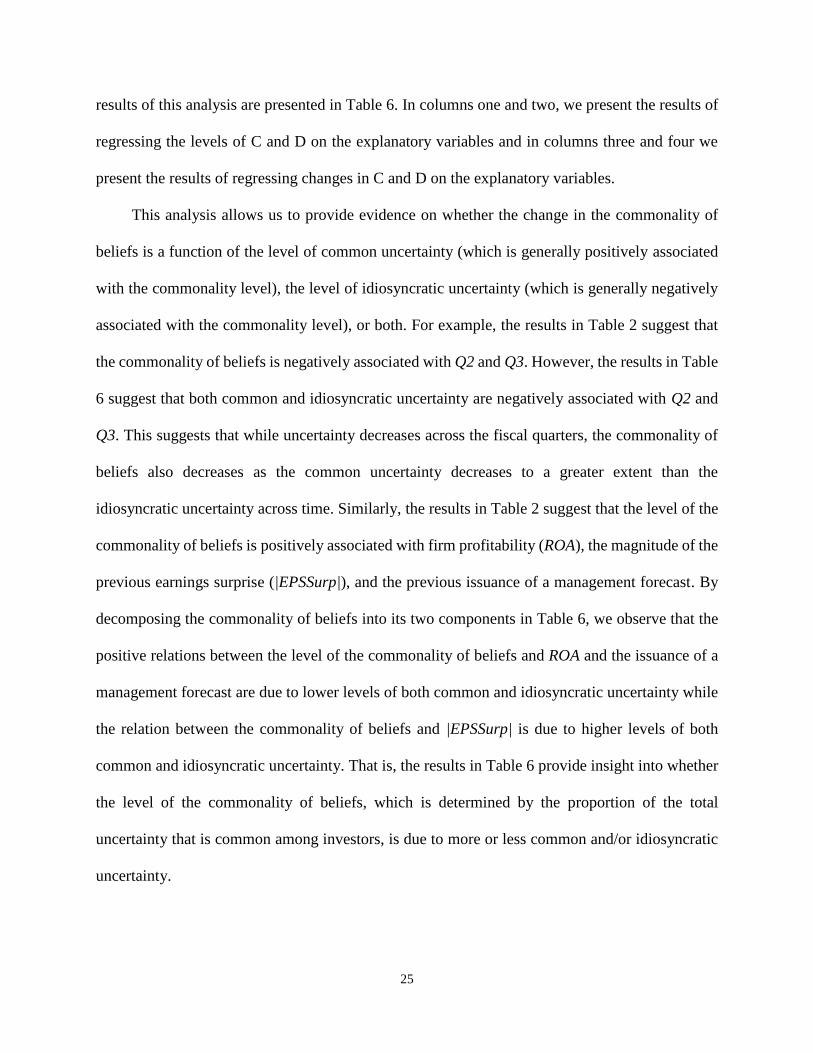
This analysis allows us to provide evidence on whether the change in the commonality of
beliefs is a function of the level of common uncertainty (which is generally positively associated
with the commonality level), the level of idiosyncratic uncertainty (which is generally negatively
associated with the commonality level), or both. For example, the results in Table 2 suggest that
the commonality of beliefs is negatively associated with Q2 and Q3. However, the results in Table
6 suggest that both common and idiosyncratic uncertainty are negatively associated with Q2 and
Q3. This suggests that while uncertainty decreases across the fiscal quarters, the commonality of
beliefs also decreases as the common uncertainty decreases to a greater extent than the
idiosyncratic uncertainty across time. Similarly, the results in Table 2 suggest that the level of the
commonality of beliefs is positively associated with firm profitability (ROA), the magnitude of the
previous earnings surprise (|EPSSurp|), and the previous issuance of a management forecast. By
decomposing the commonality of beliefs into its two components in Table 6, we observe that the
positive relations between the level of the commonality of beliefs and ROA and the issuance of a
management forecast are due to lower levels of both common and idiosyncratic uncertainty while
the relation between the commonality of beliefs and |EPSSurp| is due to higher levels of both
common and idiosyncratic uncertainty. That is, the results in Table 6 provide insight into whether
the level of the commonality of beliefs, which is determined by the proportion of the total
uncertainty that is common among investors, is due to more or less common and/or idiosyncratic
uncertainty.
26
Columns three and four of Table 6 present the results of regressing changes in common
and idiosyncratic uncertainty on our explanatory variables. We document that the increase in the
commonality of beliefs around earnings announcements is, in general, due to decreases in both
common and idiosyncratic uncertainty (intercepts of -0.076 and -0.016), consistent with
information resolving uncertainty. Because the commonality of beliefs captures the proportion of
uncertainty that is common, our findings reflect a proportionate reduction in idiosyncratic
uncertainty that is greater than the reduction in common uncertainty. Similarly, we find that the
negative association between |EPSSurp| and the change in the commonality of beliefs (Table 3) is
due to a negative (positive) association between the change in common (idiosyncratic) uncertainty
and |EPSSurp|. This suggests that the net lower increase in the commonality of beliefs for earnings
announcements with a larger surprise is driven by a reduction in common uncertainty as well as
an increase in idiosyncratic uncertainty. In contrast, the negative association between AF_EPS and
change in the commonality of beliefs (Table 3) is due to a negative association between AF_EPS
and both the change in common and idiosyncratic uncertainty. This finding suggests that the net
lower increase in the commonality of beliefs associated with the number of analysts that follow a
firm is driven by a reduction in common uncertainty that exceeds the relative reduction in
idiosyncratic uncertainty.
V. CONCLUSION
This study provides evidence on the effect of quarterly earnings announcements on the
change in the commonality of beliefs about annual earnings. We extend BBK by including a
broader set of analysts, controlling for the level of the commonality of beliefs, and incorporating
firm and disclosure characteristics in our analysis. Prior research suggests that, within a subset of
analysts that follow a firm, earnings announcements decrease the commonality of beliefs within

27
those analysts. To better understand how earnings announcements affect firm-level information
environments, we expand this analysis to include all analysts that provide forecasts. In addition,
we provide multivariate evidence on the link between firm and earnings attributes and the level of
the commonality of beliefs prior to an earnings announcement and between firm and earnings
attributes and changes in the commonality of beliefs around an earnings announcement.
We provide strong evidence that the level of the commonality of beliefs about earnings is a
function of prior period profitability, growth opportunities, earnings surprises, and whether a firm
provides voluntary disclosures (e.g., management earnings forecasts or non-GAAP earnings). We
also find that, after controlling for the beginning level of the commonality of beliefs, earnings
announcements are associated with an increase in the commonality of beliefs. We explore the
source of these effects by re-estimating our models after (1) decomposing earnings into revenues
and expenses, and (2) decomposing the commonality of beliefs into common and idiosyncratic
uncertainty. Our findings highlight that earnings announcements increase the commonality of
beliefs around earnings, although the level of commonality of beliefs about annual earnings across
the fiscal year tends to decrease. Overall, we provide evidence that the counter-intuitive finding
that earnings announcements reduce the commonality of beliefs can be explained by the complex
nature of the information provided by firms in and around earnings announcements.

28
REFERENCES
Ajinkya, B.B., and M.J. Gift, 1985. Dispersion of financial analysts' earnings forecasts and the (option
model) implied standard deviations of stock returns. The Journal of Finance, 40(5), 1353-1365.
Atiase, R.K., 1985. Predisclosure information, firm capitalization, and security price behavior around
earnings announcements. Journal of Accounting Research, 21-36.
Baginski, S., E. Conrad, and J. Hassell. 1993. The effects of management forecast precision on equity
pricing and on the assessment of earnings uncertainty. The Accounting Review, Vol. 68 (4):913-927.
Barefield, R.M., and E.E. Comiskey, 1975. The accuracy of analysts' forecasts of earnings per share.
Journal of Business Research, 3(3), 241-252.
Barron, O., D. Byard, and O. Kim. 2002. Changes in analysts’ information around earnings announcements.
The Accounting Review, Vol. 77 (4): 821-846.
Barron, O., D. Harris, and M. Stanford. 2005. Evidence that investors trade on private event-period
information around earnings announcements. The Accounting Review, Vol. 80 (2):403-421.
Baumgarten, D., M. Berens and C. Homburg, 2011. Analysts’ implied cost forecasts and cost stickiness.
Working paper, University of Cologne.
Bentley, J., T.E. Christensen, K.H. Gee, and B.C. Whipple, 2015. Disentangling managers’ and analysts’
non-GAAP reporting incentives. Working Paper, University of Georgia.
Bhattacharya, N. E. Black, T. Christensen, and C. Larson. 2003. Assessing the relative informativeness
and permanence of pro forma earnings and GAAP Operating Earnings.” Journal of Accounting and
Economics, Vol. 36: 285–319.
Bhattacharya, N., E. Black, T. Christensen, and R. Mergenthaler. 2007. Who trades on pro forma earnings
information? The Accounting Review, Vol. 82 (3):581-619.
Botosan, C, M. Plumlee, and Y. Xie. 2004. The role of information precision in determining the cost of
equity capital. Review of Accounting Studies, Vol. 9, 233-259.
Bradshaw, M.T., and R.G. Sloan, 2002. GAAP versus the street: An empirical assessment of two alternative
definitions of earnings. Journal of Accounting Research, 40(1), 41-66.
Bradshaw, M., L.F. Lee, and K. Peterson, 2016. The interactive role of difficulty and incentives in
explaining the annual earnings forecast walkdown. Forthcoming, The Accounting Review.
Bushman, R., 1991, Public disclosures and the structure of private information markets. Journal of
Accounting Research, Vol. 38, pp. 261–276.
Buzby, S. 1975. Company size, listed versus unlisted stocks, and the extent of financial disclosure. Journal
of Accounting Research 13 (1): 16-37.
Christensen, T.E., M.S. Drake, and J.R. Thornock, 2014. Optimistic reporting and pessimistic investing: do
pro forma earnings disclosures attract short sellers? Contemporary Accounting Research, Vol. 31, 67-
102.
Coller, M., and T.L. Yohn, 1997. Management forecasts and information asymmetry: An examination of
bid-ask spreads. Journal of Accounting Research, 181-191.
Curtis, A., R. Lundholm, and S. McVay. 2014. Forecasting sales: A model and some evidence from the
retail industry. Contemporary Accounting Research, Vol. 31(2): 581-607.
Demski, J.S., and G.A. Feltham, 1994. Market response to financial reports. Journal of Accounting and
Economics, 17(1), 3-40.

29
Diamond, D. W., 1985. Optimal release of information by firms. The Journal of Finance, 40(4), 1071-1094.
Diamond, D. W., R.E. Verrecchia, 1991. Disclosure, liquidity, and the cost of capital. The Journal of
Finance, 46(4), 1325-1359.
Doyle, J. T., R.J. Lundholm, and M.T. Soliman, 2003. The predictive value of expenses excluded from pro
forma earnings. Review of Accounting Studies, 8(2-3), 145-174.
Ertimur, Y., J. Livnat, and M. Martikainen, 2003. Differential market reactions to revenue and expense
surprises. Review of Accounting Studies 8 (2-3): 185-211.
Frankel, R. and X. Li. 2004. Characteristics of a firm’s information environment and the information
asymmetry between insiders and outsiders. Journal of Accounting and Economics 37 (2): 229-259.
Fried, D., and D. Givoly, 1982. Financial analysts' forecasts of earnings: A better surrogate for market
expectations. Journal of Accounting and Economics, 4(2), 85-107.
Fairfield, P., R. Sweeney, and T. Yohn. 1996. Accounting classification and the predictive content of
earnings. The Accounting Review, Vol. 71 (3): 337-355.
Fairfield, P. M., J.S. Whisenant, and T.L. Yohn, 2003. Accrued earnings and growth: Implications for future
profitability and market mispricing. The Accounting Review, 78(1), 353-371.
Firth, M., 1979. The impact of size, stock market listing, and auditors on voluntary disclosure in corporate
annual reports. Accounting and Business Research, 9(36), pp.273-280.
Francis, J., Nanda, D. and Olsson, P., 2008. Voluntary disclosure, earnings quality, and cost of capital.
Journal of Accounting Research, 46(1), pp.53-99.
Graham, R. C. and R. King. 2008. Industry information transfers: The effect of information environments.
Journal of Business Finance and Accounting, Vol. 23 (9-10):1289-1306
Hayn, C., 1995. The information content of losses. Journal of Accounting and Economics, 20(2), 125-153.
Horton, J., G. Serafeim, and I. Serafeim. 2013. Does mandatory IFRS adoption improve the information
environment? Contemporary Accounting Research (30):1, 388-423.
Hutton, A.P., G.S. Miller, and D.J. Skinner, 2003. The role of supplementary statements with management
earnings forecasts. Journal of Accounting Research, 867-890.
Ivkovic, Z. and N. Jegadeesh. 2004. The time and value of forecast and recommendation revisions. Journal
of Financial Economics 73 (3): 433-463.
Kim, M., and J. Prather-Kinsey, 2010. An additional source of financial analysts' earnings forecast errors:
Imperfect adjustments for cost behavior. Journal of Accounting, Auditing and Finance, 25(1), 27-51.
Kim, O., and R.E. Verrecchia, 1994. Market liquidity and volume around earnings announcements. Journal
of Accounting and Economics, 17(1), 41-67.
Krinsky, I., and J. Lee, 1996. Earnings announcements and the components of the bid‐ask spread. The
Journal of Finance, 51(4), 1523-1535.
Lee, C. M., B. Mucklow, and M.J. Ready, 1993. Spreads, depths, and the impact of earnings information:
An intraday analysis. Review of Financial Studies, 6(2), 345-374.
Lev, B., 1989. On the usefulness of earnings and earnings research: Lessons and directions from two
decades of empirical research. Journal of Accounting Research, 153-192.
Li, E., K. Ramesh, M. Shen, and J. Wu, 2015. Do analyst stock recommendations piggyback on recent
corporate news? An analysis of regular-hour and after-hours revisions. Forthcoming, Journal of
Accounting Research.
30
Lim, T. 2001. Rationality and analysts’ forecast bias. Journal of Finance 56(1) 369-385.
Lipe, R.C., 1986. The information contained in the components of earnings. Journal of Accounting
Research, 37-64.
Lougee, B.A., and C.A. Marquardt, 2004. Earnings informativeness and strategic disclosure: An empirical
examination of “pro forma” earnings. The Accounting Review, 79(3), 769-795.
Mayew, W. 2008. Evidence of management discrimination among analysts during earnings conference
calls. Journal of Accounting Research 46 (3): 627-659.
Mayew, W., N. Sharp, and M. Venkatachalam. 2013. Using earnings conference calls to identify analysts
with superior private information. Review of Accounting Studies 18: 386-413.
McNichols, M., and B. Trueman, 1994. Public disclosure, private information collection, and short-term
trading. Journal of Accounting and Economics, 17(1), 69-94.
Pownall, G., Wasley, C. and Waymire, G., 1993. The stock price effects of alternative types of management
earnings forecasts. The Accounting Review, pp.896-912.
Pownall, G. and Waymire, G., 1989. Voluntary disclosure credibility and securities prices: Evidence from
management earnings forecasts, 1969-73. Journal of Accounting Research, pp.227-245.
Rogers, J. L., A. Van Buskirk, 2013. Bundled forecasts in empirical accounting research. Journal of
Accounting and Economics, 55(1), 43-65.
Roulstone, D. Analyst following and market liquidity. Contemporary Accounting Research, 20 (3): 551-
578.
Verrecchia, R. 1982. Information acquisition in a noisy rational expectations economy. Econometrica 50:
1415 – 1430.
Waymire, G. 1984. Additional evidence on the information content of management earnings forecasts.
Journal of Accounting Research 22 (2): 703-718.
Yezegel, A., 2015. Why do analysts revise their stock recommendations after earnings announcements?
Journal of Accounting and Economics, 59(2), 163-181.
Yohn, T.L., 1998. Information asymmetry around earnings announcements. Review of Quantitative
Finance and Accounting, 11(2), 165-182.

31
APPENDIX A
Variable Descriptions
MVE Market value of equity (CSHOQ × PRCCQ)
AF_EPS Number of analysts providing annual EPS forecasts prior to the quarterly earnings
announcement
ΔAF_EPS Number of analysts providing annual EPS forecasts within ten days after the
earnings announcement less AF_EPS
ROA Return on assets (Net income divided by total assets (NIQ/ATQ))
Loss One if a firm reported a negative EPS for the fiscal quarter (EPSFIQ), and zero
otherwise
B/M Book to market ratio (SEQQ/MVE)
EPS Earnings per share, as reported by IBES (variable EPS)
F_EPS Median annual EPS forecast for analysts included in our sample for a given
quarter. We require at least three forecasts to calculate the median forecast
REV Total revenues, as reported by IBES (variable SAL)
F_REV Median annual revenue forecast for analysts included in our sample for a given
quarter. We require at least three forecasts to calculate the median forecast
EXP Total revenues less net income, as reported by IBES (variables SAL-NET)
F_EXP
For analysts that provide annual revenue and net income forecasts in a given
quarter, we obtain each analyst’s expense forecast by subtracting the net income
forecast from the revenue forecast. We then use these expense forecasts to
calculate the median annual expense forecast made in that quarter. We require at
least three forecasts to calculate the median forecast
BundledEPS One if a firm provided a management earnings forecast up to two days after the
earnings announcement, zero otherwise
BundledREV One if a firm provided a management revenue forecast up to two days after the
earnings announcement, zero otherwise
BundledEXP One if a firm provided a management expense forecast up to two days after the
earnings announcement, zero otherwise
NonGAAP_EPS One if IBES EPS is on a non-GAAP basis (i.e., IBES EPS ≠ EPSFXQ from
Compustat), and zero otherwise
Q2 One if the earnings announcement is for the second fiscal quarter and zero
otherwise
Q3 One if the earnings announcement is for the third fiscal quarter and zero otherwise
Pos_Surp One if IBES EPS is equal to or greater than the median consensus quarterly
earnings forecast, zero otherwise
|EPSSurp| The absolute value of the difference between IBES EPS and the median consensus
quarterly earnings forecast
MEF One if a firm provided a management earnings forecast at any point during the
quarter (bundled or unbundled forecasts), zero otherwise
SEEPS Squared error of the EPS forecast: (EPS less F_EPS) squared
SEREV Squared error of the REV forecast: (REV less F_REV) squared
SEEXP Squared error of the EXP forecast: (EXP less F_EXP) squared

32
DEPS Idiosyncratic uncertainty - Dispersion in analysts’ EPS forecasts: (variance of
F_EPS), scaled by absolute value of EPS
DREV Idiosyncratic uncertainty - Dispersion in analysts’ REV forecasts: (variance of
F_REV), scaled by absolute value of REV
DEXP Idiosyncratic uncertainty - Dispersion in analysts’ EXP forecasts: (variance of
F_EXP), scaled by absolute value of EXP
NEPS Number of analysts that provide EPS forecasts used in DEPS
NREV Number of analysts that provide REV forecasts used in DREV
NEXP Number of analysts that provide EXP forecasts used in DEXP
CEPS Common uncertainty in EPS: (SEEPS – DEPS/NEPS), scaled by absolute value of
EPS
CREV Common uncertainty in REV: (SEREV – DREV/NREV), scaled by absolute value of
REV
CEXP Common uncertainty in EXP: (SEEXP – DEXP/NEXP), scaled by absolute value of
EXP
VEPS Total uncertainty in EPS: CEPS + DEPS
VREV Total uncertainty in REV: CREV + DREV
VEXP Total uncertainty in EXP: CEXP + DEXP
ρEPS EPS commonality of beliefs: CEPS scaled by VEPS
ρREV REV commonality of beliefs: CREV scaled by VREV
ρEXP EXP commonality of beliefs: CEXP scaled by VEXP
ΔρEPS Change in EPS commonality of beliefs: ρEPS based on post earnings
announcement EPS forecasts less ρEPS based on pre-earnings announcement EPS
forecasts
ΔρREV Change in REV commonality of beliefs: ρREV based on post earnings
announcement REV forecasts less ρREV based on pre earnings announcement REV
forecasts
ΔρEXP Change in EXP commonality of beliefs: ρEXP based on post earnings
announcement EXP forecasts less ρEXP based on pre earnings announcement EXP
forecasts
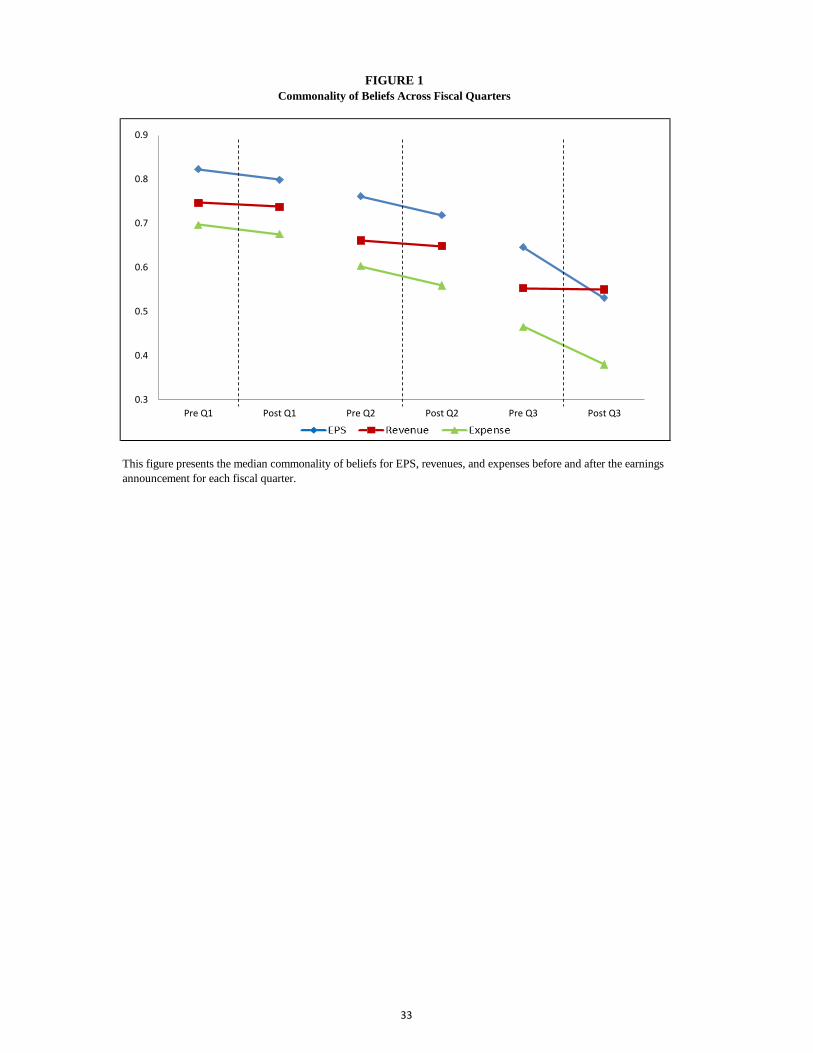
FIGURE 1
Commonality of Beliefs Across Fiscal Quarters
This figure presents the median commonality of beliefs for EPS, revenues, and expenses before and after the earnings
announcement for each fiscal quarter.
0.3
0.4
0.5
0.6
0.7
0.8
0.9
Pre Q1 Post Q1 Pre Q2 Post Q2 Pre Q3 Post Q3
33

Variable Mean Med Std Dev
MVE 7853 1989 17609
AF_EPS 12.104 10.000 7.077
ROA 0.007 0.010 0.033
Loss 0.209 0.000 0.407
B/M 0.496 0.409 0.383
EPS 1.587 1.295 2.113
F_EPS 1.705 1.350 1.912
ρEPS 0.657 0.822 0.366
ΔρEPS -0.023 -0.003 0.331
REV 5625 1315 12498
F_REV 5616 1313 12487
ρREV 0.588 0.746 0.391
ΔρREV -0.015 -0.001 0.343
EXP 5114 1188 11467
F_EXP 5088 1174 11401
ρEXP 0.559 0.697 0.396
ΔρEXP -0.025 -0.006 0.367
MEF 0.291 0.000 0.454
BundledEPS 0.272 0.000 0.445
NonGAAP_EPS 0.504 1.000 0.500
TABLE 1
Descriptive Statistics – Firm Level Variables
This table provides descriptive statistics for our sample. We rely on fiscal quarter 1 values to calculate all variables. Variables are
defined in Appendix A.
34

(1) (2) (3)
VARIABLES ρEPS ρEPS ρEPS
Q2 - -0.049*** -0.049*** -0.049***
(-17.636) (-17.696) (-17.292)
Q3 - -0.127*** -0.129*** -0.129***
(-37.099) (-37.508) (-36.880)
MVEq-1 - -0.015*** -0.018***
(-6.198) (-7.689)
AF_EPSq-1 + 0.002*** 0.002***
(2.937) (3.530)
ROAq-1 + 0.743*** 0.668***
(11.550) (10.418)
B/Mq-1 + 0.019*** 0.019***
(2.600) (2.583)
Pos_Surpq-1 ? 0.005
(1.333)|EPSSurp|q-1 ? 0.180***
(9.038)
MEFq-1 + 0.066***
(11.325)
NonGAAP_EPSq-1 - -0.020***
(-4.491)
Constant 0.714*** 0.800*** 0.801***
(84.398) (42.763) (43.266)
Observations 54,900 54,900 54,900
Adjusted R-squared 0.044 0.049 0.056
TABLE 2
Level of Commonality of Beliefs: EPS
Predicted
Sign
All regressions have year and industry fixed effects, standard errors clustered by firm, and use robust standard
errors. *, **, *** denote statistical significance at the 10%, 5% and 1% level, respectively (two-tailed). See
Appendix A for a more detailed definition of all variables used in the regressions.
35

(1) (2) (3)
VARIABLES ΔρEPS ΔρEPS ΔρEPS
ρEPSq -0.442*** -0.460*** -0.453***
(-94.259) (-97.542) (-94.444)
Q2 - -0.038*** -0.037***
(-10.988) (-10.858)
Q3 - -0.107*** -0.105***
(-29.307) (-28.736)
MVE - -0.007*** -0.006***
(-4.229) (-3.767)
AF_EPS + 0.001** 0.001***
(2.284) (2.745)
ROA + 0.379*** 0.263***
(6.819) (4.730)
B/M + 0.015*** 0.027***
(3.077) (5.449)
Pos_Surp +/- 0.017***
(4.867)
|EPSSurp| +/- -0.187***
(-10.774)
BundledEPS + 0.024***
(5.796)
NonGAAP_EPS - -0.029***
(-8.144)
Constant 0.258*** 0.358*** 0.344***
(38.014) (26.513) (24.797)
Observations 54,900 54,900 54,900
Adjusted R-squared 0.194 0.208 0.213
TABLE 3
Changes in Commonality of Beliefs: EPS
Predicted
Sign
All regressions have year and industry fixed effects, standard errors clustered by firm, and use robust standard errors. *,
**, *** denote statistical significance at the 10%, 5% and 1% level, respectively (two-tailed). See Appendix A for a more
detailed definition of all variables used in the regressions.
36
(1) (2) (3)
VARIABLES ρREV ρEXP ρCOMPDIFF
Q2 -0.051*** -0.060*** 0.009***
(-17.328) (-19.376) (3.190)
Q3 -0.113*** -0.135*** 0.022***
(-31.673) (-36.076) (6.478)
MVEq-1 -0.025*** -0.024*** -0.001
(-9.624) (-9.315) (-0.781)
AF_EPSq-1 0.003*** 0.001 0.002***
(5.052) (1.425) (4.450)
ROAq-1 0.403*** 0.441*** -0.038
(5.766) (6.568) (-0.539)
B/Mq-1 -0.059*** -0.029*** -0.030***
(-7.059) (-3.549) (-4.326)
Pos_Surpq-1 0.012*** 0.006 0.006
(2.711) (1.320) (1.635)|EPSSurp|q-1 -0.036 0.019 -0.054***
(-1.586) (0.808) (-2.842)
MEFq-1 0.057*** 0.052*** 0.005
(9.116) (8.242) (1.098)
NonGAAP_EPSq-1 0.014*** -0.030*** 0.044***
(2.911) (-6.100) (11.701)
Constant 0.774*** 0.786*** -0.013
(36.792) (38.206) (-0.821)
Observations 54,900 54,900 54,900
Adjusted R-squared 0.096 0.071 0.020
TABLE 4
Level of Commonality of Beliefs: Revenue and Expense
All regressions have year and industry fixed effects, standard errors clustered by firm, and use
robust standard errors. *, **, *** denote statistical significance at the 10%, 5% and 1% level,
respectively (two-tailed). See Appendix A for a more detailed definition of all variables used in the
regressions.
37

(1) (2) (3)
VARIABLES ΔρREV ΔρEXP ΔρCOMPDIFF
ρCompq -0.480*** -0.471*** -0.570***
(-95.828) (-98.055) (-83.801)
Q2 -0.024*** -0.034*** 0.011***
(-6.808) (-9.203) (3.258)
Q3 -0.051*** -0.087*** 0.038***
(-14.002) (-22.395) (10.558)
MVE -0.015*** -0.007*** -0.008***
(-7.939) (-3.779) (-4.923)
AF_EPS 0.002*** -0.000 0.003***
(6.254) (-1.047) (7.553)
ROA 0.231*** 0.425*** -0.179**
(4.138) (7.152) (-2.525)
B/M -0.019*** 0.008 -0.029***
(-3.570) (1.403) (-5.601)
Pos_Surp 0.010*** -0.004 0.014***
(2.870) (-0.999) (4.055)
|EPSSurp| -0.103*** -0.094*** -0.019
(-5.896) (-5.247) (-1.065)
BundledEPS 0.016*** 0.014*** 0.002
(4.006) (3.337) (0.540)
NonGAAP_EPS 0.009** -0.028*** 0.040***
(2.491) (-7.682) (11.812)
Constant 0.382*** 0.351*** 0.024*
(25.707) (23.823) (1.808)
Observations 54,900 54,900 54,900
Adjusted R-squared 0.225 0.216 0.246
Changes in Commonality of Beliefs: Revenue and Expense
All regressions have year and industry fixed effects, standard errors clustered by firm, and use
robust standard errors. *, **, *** denote statistical significance at the 10%, 5% and 1% level,
respectively (two-tailed). See Appendix A for a more detailed definition of all variables used in the
regressions.
TABLE 5
38

(1) (2) (3) (4)
VARIABLES CEPS DEPS ΔCEPS ΔDEPS
ρCompq -0.237*** -0.212***
(-38.550) (-16.846)
Q2 -0.138*** -0.007*** -0.017*** 0.001
(-17.382) (-4.852) (-5.032) (1.464)
Q3 -0.279*** -0.011*** -0.021*** 0.003***
(-24.470) (-6.283) (-6.551) (3.258)
MVE -0.033*** 0.001 0.009*** 0.003***
(-3.891) (0.717) (5.638) (4.707)
AF_EPS 0.002 -0.001*** -0.001** -0.001***
(1.004) (-3.261) (-2.418) (-4.789)
ROA -1.072*** -0.554*** 0.503*** -0.159***
(-4.135) (-8.919) (7.102) (-6.843)
B/M 0.314*** 0.043*** 0.006 -0.004*
(9.005) (6.789) (1.041) (-1.801)
Pos_Surp -0.148*** -0.021*** 0.058*** -0.003***
(-9.680) (-8.428) (14.787) (-3.010)
|EPSSurp| 1.760*** 0.317*** -0.565*** 0.052***
(13.830) (14.936) (-18.388) (5.902)
MEF -0.094*** -0.033***
(-5.744) (-12.004)
BundledEPS 0.001 -0.001
(0.181) (-1.076)
NonGAAP_EPS -0.017 -0.004 -0.013*** 0.004***
(-1.015) (-1.364) (-4.123) (3.845)
Constant 0.556*** 0.043*** -0.076*** -0.016***
(8.117) (3.619) (-5.714) (-4.126)
Observations 54,900 54,900 54,900 54,900
Adjusted R-squared 0.079 0.095 0.538 0.168
TABLE 6
Common and Idiosyncratic Uncertainty: EPS
Level Analysis Changes Analysis
All regressions have year and industry fixed effects, standard errors clustered by firm, and use robust
standard errors. *, **, *** denote statistical significance at the 10%, 5% and 1% level, respectively (two-
tailed). See Appendix A for a more detailed definition of all variables used in the regressions.
39