Embed Size (px)
Citation preview

Information Asymmetry around Earnings Announcements during the Financial Crisis
Gauri Bhat [email protected]
Sudarshan Jayaraman [email protected]
Olin School of Business Washington University in St. Louis
St. Louis, MO 63130-4899
November 2009
Abstract Motivated by recent theoretical models that examine how the extent to which earnings reveal or obscure information about underlying volatility affects informed trading, we examine changes in information asymmetry after earnings announcements during the recent financial crisis. Using bid-ask spreads to measure information asymmetry, we compare changes in spreads after earnings announcements during the crisis period. We find that spreads increase after earnings announcements for all firms during 2007 and that these increases are larger than during the non-crisis period. We also find that the increases are pronounced for banks compared to industrial firms. Cross-sectional variation tests based on the sub-sample of banks reveal that increases in spreads are pronounced for banks with higher exposure to sub-prime assets, those with greater managerial risk-taking incentives and those with poor risk management disclosures. In contrast to the results for 2007, spreads decrease significantly after bank earnings announcements during 2008 while those for industrial firms decrease only marginally. Consistent with the political cost hypothesis, decreases in spreads are driven by large banks who respond to the higher regulatory pressure in 2008 by recognizing losses and increasing loan loss provisions. Finally, our results accentuate the role of disclosure by documenting that banks with good risk management disclosures experience lower increases in spreads in 2007 and higher decreases in 2008. We thank Jeffrey Callen, Nick Dopuch, Richard Frankel, Mozaffar Khan, Chad Larson, Xiumin Martin, Venky Nagar, Stephen Ryan, Anjan Thakor, and Robert Verrecchia for helpful suggestions and discussions.

Information Asymmetry around Earnings Announcements during the Financial Crisis
1. Introduction
Neoclassical theories in information economics model public information and private
information as substitutes and find that earnings announcements reduce information asymmetry
by reducing the informational advantage of informed traders.1 However, recent theoretical
models find that earnings can increase information asymmetry by providing informed traders
with an ability to better interpret the earnings announcement than uninformed traders.2 In a
recent study, Ng, Verrecchia and Weber (2009) show that earnings that are not informative about
underlying volatility increase information asymmetry. We use the financial crisis as an
experimental setting which resulted in a shock to firms’ underlying volatility and examine
whether earnings decrease information asymmetry by providing information about underlying
volatility or whether they exacerbate information asymmetry by providing some traders with a
better ability to interpret these announcements.
Financial reporting for banks has come under increased scrutiny during the recent
financial crisis and has been subject to intense criticism. Motivated by concerns in the media
and the regulators about the failure of accounting information to provide timely information
about bank performance, we examine changes in information asymmetry around bank earnings
announcements during the financial crisis period. Several factors have been argued to have
aggravated the crisis, such as executive compensation schemes which encouraged bank managers
1 We define information asymmetry as the difference between the information known to informed traders (i.e., those with access to private information) that is not known to market-makers and uninformed traders (see e.g., Verrecchia (1982), Copeland and Galai (1983), Kyle (1985)). 2 Kim and Verrecchia (1994, p. 44)) explain such disclosures as ones that “stimulate informed judgments among traders who process public disclosure into private information. The ability of information processors to produce superior assessments of a firm’s performance on the basis of an earnings announcement provides them with a comparative information advantage over market makers”
- 1 -
to move into more opaque and risky transactions and the lack of relevant, reliable and
understandable financial reporting information by firms (Rajan (2006), Ryan (2008), OECD
Report (2009), Schwarcz (2009)).3 We investigate the role of exposure to sub-prime assets,
equity-based managerial incentives, risk-management disclosure, bank size, loss recognition and
fair value hierarchy information in alleviating or exacerbating information asymmetry around
bank earnings announcements.4
Using bid-ask spreads to measure information asymmetry, we compute changes in
spreads after earnings announcements and compare these changes during the crisis period with
those in the non-crisis period.5 Following Laeven and Huizinga (2009), we use the period from
2002 to denote the non-crisis period, as 2001 marked the end of a business cycle. As banks were
widely believed to have initiated the financial crisis in 2007 which then spread to the entire
economy, we examine changes in bid-ask spreads for 2007 and 2008 separately and also
differentiate between banks and industrial firms using an indicator variable. We use firm-fixed
effects in all our specifications thus enabling us to use a differences-in-differences approach (see
Bertrand, Duflo and Mullainathan (2004)).
Our empirical results provide several interesting insights. While bid-ask spreads increase
after earnings announcements for all firms in the non-crisis period, these increases are
pronounced during 2007. In particular, the increase in spreads in 2007 is higher by 10.5%
relative to the non-crisis period for industrial firms. Further, consistent with the prominent role of
banks in the advent of the financial crisis, we find that increases in spreads in 2007 are 13.1%
3 http://www.oecd.org/dataoecd/3/10/43056196.pdf 4 We focus on earnings announcements as it is the most important financial metric to external constituents (Graham, Harvey and Rajgopal (2005)). 5 We do not use short-window stock returns to gauge the informativeness of earnings announcements. This is because stock returns do not speak to the mechanism through which information gets into the price. Informed trading proxies help us determine whether public information got in directly into prices (i.e., less informed trading) or whether informed traders impounded the information into prices (i.e., more informed trading).
- 2 -
higher for banks relative to the non-crisis period. These results suggest that earnings
announcements in 2007 provide informed traders with an increased ability to interpret the
earnings relative to other market participants and increase information asymmetry.
Interestingly, we find that earnings announcements in 2008 decrease information
asymmetry relative to earlier periods and that this decrease exists only for banks and not for
industrial firms.6 In particular, we find that bank earnings announcements reduce spreads by
around 11% in 2008 relative to other periods. In subsequent tests, we find that these decreases
are driven by large banks which are more likely to be the focus of regulatory intervention. In
contrast, small banks experience increases in bid-ask spreads in 2008. We find that large banks
recognize more unrealized losses on securities available for sale, realize losses on securities
available for sale and have higher levels of loan loss provisions. These results are consistent with
the political cost hypothesis of Watts and Zimmerman (1978, 1986), and suggest that regulatory
interest in bank financial statements in 2008 is associated with greater loss recognition and
higher loss provisions which result in lower information asymmetry after earnings
announcements.
Next, we explore the role of factors that arguably contribute to the exacerbation of the
financial crisis. First, given that the sub-prime market failure was the trigger for the crisis, we
examine whether banks’ exposure to sub-prime assets affect the increase (decrease) in bid-ask
spreads. As the actual exposure to sub-prime assets is not observable, we compute a market-
based measure using the sensitivity of the firm’s returns to a sub-prime index return (see Ryan
(2008)). We calculate a sub-prime beta by regressing daily bank stock returns on the market
6 To ensure that our results for 2008 are not merely capturing a decrease relative to 2007 levels, we delete 2007 from the sample and thus compare changes in bid-ask spreads in 2008 relative to the non-crisis period. In unreported tests, we find similar results.
- 3 -
returns and the average of the six ABX Indices (for ratings BBB and below). These indices are
based on credit derivatives referenced to twenty BBB (and below) rated asset backed securities
collateralized by subprime home equity mortgages.7 We find that increases in spreads are higher
for banks with higher sub-prime betas relative to those with lower sub-prime betas. We do not
find that any association between the sub-prime exposure and the decline in spreads in 2008.
Second, we explore the role of managerial equity-based incentives in our results. In an
influential paper that preceded the financial crisis, Rajan (2006) argues that recent developments
in financial markets and the convexity imposed by managerial stock options encourage excessive
risk taking by bank managers. In an effort to portray risk-adjusted excess performance, these
managers have greater incentives to hide these risks from outsiders. To test this prediction, we
use managerial stock option vega (which measures the sensitivity of managerial wealth to
changes in stock return volatility) as per the methodology in Core and Guay (2002). Our results
suggest that bid-ask spreads during 2007 increase by around 20% relative to the non-crisis period
for firms with high vega. The comparable increase for banks with low vega is 12.5%. These
results appear to be consistent with Rajan’s argument that convexity of stock options encourages
banks to take more risk and to hide these risks from outsiders.
Third, we use a comprehensive disclosure index based on 92 items hand-collected from
the annual report of banks to explore the impact of risk-management disclosure on information
asymmetry during the financial crisis. The index includes items relating to capital structure,
capital adequacy, market risk internal modeling, internal and external ratings, credit risk
modeling, securitization activities, asset quality, credit derivatives and other credit
enhancements, derivatives (other than credit derivatives), geographic and business line
diversification, accounting and presentation policies and other risks (see Bhat (2009) for details). 7 www.markit.com
- 4 -

Empirical tests reveal that spreads in 2007 increase by 10.5% for the high disclosure banks and
by 14.4% for the low disclosure banks. Further, the decrease in spreads in 2008 is 19.5% for the
high disclosure banks relative to the decrease of 10.8% for the low disclosure banks.
Fourth, we examine the role of fair value hierarchy information. Following Laux and
Leuz (2009), we categorize banks into groups based on the proportion of fair-value assets that
are at Level 2 and Level 3. Controlling for the proportion of fair-value assets to total assets, we
find that banks with a high proportion of Level 1 assets to total fair-value assets are the ones that
experience decreases in spreads in 2008. The group with the high proportion of Level 2 and
Level 3 assets does not experience a statistically significant decrease in spreads during 2008.
We perform several tests to verify robustness of our inferences. First, we exclude
securities with a BBB rating while computing banks’ exposure to sub-prime assets. We find
similar results to those reported earlier. Second, we form the disclosure index based on an equal-
weighting of 11 categories instead of the 92 items and find similar results. Third, we use
effective spreads as an alternate measure of information asymmetry and find consistent results.
Finally, we perform checks to ensure that increases in bid-ask spreads around earnings
announcements are not merely capturing an increasing trend during this period.
Our paper offers three contributions to the literature. First, we use the financial crisis as
an experimental setting to tests theories about how the level of information asymmetry between
equity market participants is affected by the extent to which earnings provide information about
underlying volatility. Consistent with conjectures in prior studies, by regulators and by the media
that financial accounting information did not enable outsiders to gauge bank risk during the
crisis, we find that information asymmetry increases after earnings announcements for all firms
in 2007 and that this effect is significantly higher than that in the non-crisis period. Further, the
- 5 -
increases in spreads are pronounced for banks in 2007. We find that earnings announcements
reduce bid-ask spreads in 2008 and that this effect is limited to banks and does not extend to
industrial firms. Consistent with the political cost hypothesis of Watts and Zimmerman (1978,
1986), we find that these decreases are restricted to large banks which recognize more losses and
make higher provisions, presumably due to the greater regulatory intervention.
Second, our results speak to the role of managerial incentives and disclosures in the
relation between earnings and information asymmetry. They indicate that increases in
information asymmetry after earnings announcements are higher for banks with greater
managerial risk taking incentives, where managers have a greater desire to hide risks from
outsiders. We also find that increases in spreads in 2007 are lower while decreases in spreads in
2008 are pronounced for banks with higher risk management disclosure.
Third, our study is of potential interest to regulators and banking supervisors who are
currently contemplating introducing changes to bank disclosure, corporate governance and
especially managerial compensation as a fallout of the financial crisis (see OECD June (2009)).
The rest of the paper proceeds as follows. Section 2 presents the motivation and
hypotheses. Section 3 lays out the research design followed by the main results in Section 4.
Section 5 presents robustness tests and section 6 concludes.
2. Motivation
2.1. Earnings Announcements and Information Asymmetry during the financial crisis
The overriding opinion expressed by academics and regulators in the aftermath of the
most severe financial crisis since the Great Depression has been that financial reporting failed in
providing transparent and timely information about the health of banks. Although financial
- 6 -

reporting for banks has undergone considerable change to keep up with the changing dynamics
of the banking business, the information is still not well integrated and easily interpretable (Ryan
(2007)). In addition, the problem is magnified by managerial incentives that encouraged
excessive risk-taking but also induced perverse behavior in terms of risk concealment in order to
portray superior performance (Rajan (2006)). Further, the presence of deposit insurance provides
managers with an incentive to hide true performance from outsiders in order to indulge in risk-
shifting (e.g., Bushman and Williams (2007)). This is especially relevant for banks given that
bank depositors who are protected by deposit insurance have few incentives to monitor and
demand high quality information.
On the role of disclosure about bank risks, Rajan (2006) argues that financial reporting
can only help when financial positions are simple and static and that it is less useful when
financial positions are complex and dynamic. This suggests that some investors will be able to
interpret earnings announcements better than others. While neoclassical theories (e.g.,
Verrecchia (1982), Diamond (1985)) find that public signals such as earnings reduce information
asymmetry by publicly revealing the private information of informed traders, more recent
models show that earnings announcements can increase information asymmetry by allowing
informed traders the opportunity to better interpret earnings and thereby exploit their information
advantage (e.g., Kim and Verrecchia (1994, 1997), Boot and Thakor (2001), Ng (2007)). In
particular, Ng et al. (2009)) find that earnings that are not informative about underlying volatility
increase adverse selection thereby increasing bid-ask spreads.
We use the financial crisis as an experimental setting that affected firms’ underlying
volatility to examine the above countervailing forces of earnings, i.e., reducing information
asymmetry by publicly revealing information previously known only to informed traders versus
- 7 -

exacerbating information asymmetry by allowing some participants the ability to better interpret
the earnings announcements than other participants. Following prior studies (e.g., Grossman and
Stiglitz (1980), Verrecchia (1982, 2001), Diamond (1985), Baiman and Verrecchia (1996), Leuz
and Verrecchia (2000)) that predict that the level of information asymmetry is inversely related
to the informativeness of public information, we use changes in information asymmetry after
earnings announcements to gauge earnings informativeness during the financial crisis.
On one hand, we expect earnings announcements to provide more information during
periods of greater uncertainty. Thus, we expect information asymmetry around earnings
announcements to decrease more during the financial crisis period relative to the non-crisis
period. On the other hand, if earnings provide some participants the ability to interpret the
implications of earnings about underlying risk better than others, we expect earnings
announcements to be associated with increased information asymmetry during the crisis.
As the financial crisis was widely believed to have been initiated by banks, we examine
the information asymmetry effects separately for banks relative to other industrial firms.
Our two-sided hypothesis is as follows:
H1a: Earnings announcements are associated with a pronounced decrease in information
asymmetry during the financial crisis relative to the non-crisis period; and this decrease
is pronounced for banks relative to industrial firms.
H1a: Earnings announcements are associated with a pronounced increase in information
asymmetry during the financial crisis relative to the non-crisis period; and this increase
is pronounced for banks relative to industrial firms.
- 8 -

2.2. Sub-prime assets
The crisis was triggered initially by successive waves of failure in the subprime lending
markets. Subprime mortgage originations increased exponentially from 457,000 in 2000 to 2.3
million in 2005 (GAO Report 2009). In terms of dollar value, annual originations in the
subprime market increased from $100 billion to $600 billion. The subprime lending industry
grew especially in mortgages (also in automobile loans) as these loans are homogeneous and
collateralized by real property. Thus, it was believed that credit risk was easier to assess.
However, the loan and borrower characteristics associated with sub-prime mortgages typically
have a higher likelihood of default and foreclosure, such as adjustable interest rates, less than full
documentation, and higher debt service-to-income ratios.
The credit markets for risky debt were liquid while real estate prices were increasing, but
as real estate markets witnessed an unprecedented depreciation, the default rates on sub-prime
mortgages began to rise in 2006. Despite warnings from a number of organizations such as
International Monetary Fund, Bank of International Settlements about the impending crisis in the
highly leveraged loan market, financial institutions continued to maintain market share. To quote
Prince Chuck, CEO of Citibank at that time, “while the music is playing, you have to dance”
But in early 2007, as the liquidity squeezed up, firms began repeatedly recognizing credit
losses. Over 10% of the subprime loans originated during 2000 and 2007 were foreclosed and
approximately 28% of the active (not foreclosed or prepaid) were seriously delinquent as on
early 2009. In a key-note address on the financial crisis, Schwarz (2009) emphasizes that it is
hard for outsiders to price risky assets such as mortgage-backed securities in absence of
transparent information pertaining to the condition of the underlying mortgage loans and
borrowers. He contends that disclosure, in certain cases, is so complex that investors are simply
- 9 -
uncertain about how much the securities are worth. Thus, we expect the information asymmetry
affects of earnings announcements in the crisis period to be pronounced for firms with higher
exposure to sub-prime assets. We focus our tests to banks as exposure to sub-prime assets is
more meaningful for banks. Our second hypothesis is therefore as follows:
H2: The increase (decrease) in information asymmetry during the financial crisis is stronger
for banks with higher exposure to sub-prime assets.
2.3. Managerial incentives
Rajan (2006) argues that increased competition in the marketplace has led to banks
granting more equity-based incentives upon managers in order to incentivize them to find good
investment opportunities. However, one of the unintended consequences of equity-based
incentives is that these incentives have encouraged excessive risk-taking, which in turn forces
managers to conceal these risks to portray risk-adjusted over-performance relative to peers. As a
result, we expect informed traders to have an informational advantage in these banks. Thus, in
line with Rajan’s argument, we expect increases (decreases) in information asymmetry around
announcements to be pronounced (weaker) for banks with larger managerial equity-based
incentives. These arguments lead us to the third hypothesis:
H3: The increase (decrease) in information asymmetry during the financial crisis is
pronounced (weaker) for banks with higher risk-inducing managerial incentives.
2.4. Disclosure
The recent crisis brought to the forefront several issues with disclosures made by banks.
In addition to the complexity of disclosure, there is generally no consistent global set of
- 10 -

generally accepted risk management accounting principles and additional guidance available for
risk disclosures in the annual report. As pointed out by Schwarz (2009), these risks are especially
higher for securities such as mortgage-backed securities which are hard to price them in absence
of transparent information pertaining to the condition of the underlying mortgage loans and
borrowers. Following Ryan (2008) who remarks that essential components for a cure to the
recent sub-prime mortgage crisis are provision of relevant, reliable and understandable financial
reporting information, we expect banks which were more forthcoming with information to have
lower increases in information asymmetry during the financial crisis than banks which were less
forthcoming and had complex disclosures. The premise that accounting information can play a
fundamental role in reducing information asymmetry is consistent with the third pillar of New
Basel Capital Accord as well as Basel Core Principles No.21 which emphasize the need for
informational transparency as an important tool in market discipline and regulation of banks.
Flannery and Thakor (2006) argue that informational transparency is necessary for market
participants and regulators to have an effective disciplinary role on banks. These arguments lead
us to our fourth hypothesis:
H4: The increase (decrease) in information asymmetry during the financial crisis is weaker
(stronger) for banks with higher disclosure.
3. Sample and descriptive statistics
In this section, we first describe our proxies. Detailed definitions are included in
Appendix 1. We then provide a description of the sample.
- 11 -

3.1. Information asymmetry (SPREAD)
We use bid-ask spreads (SPREAD) as our measure of information asymmetry. The
relation between information asymmetry and bid-ask spreads was first discussed in Bagehot
(1971). Bagehot argues that market makers trade with two kinds of traders—informed and
uninformed. While the market maker loses to informed traders, he recoups these losses from
uninformed traders by increasing the bid-ask spread. Thus, a high level of informed trading leads
to higher bid-ask spreads. Bagehot’s intuition has been subsequently modeled by Copeland and
Galai (1983), Kyle (1985), and Glosten and Milgrom (1985).
There are many measures of bid-ask spreads commonly used in the literature. However,
Hasbrouck (2009) finds a high degree of correlation (above 0.9) among these alternate measures.
Since CRSP-based measures are available for a large sample of firms and over a long time
period, we use them for our primary results. Following Amihud and Mendelson (1986), we
define SPREAD as the relative bid-ask spread using daily closing bids and asks. Following
Rogers (2008), we use the log value of bid-ask spread. We compute SPREAD over two intervals
– the pre-announcement period [-10, -2] and the post announcement period [2, 30]. We define an
indicator variable (POST) which takes the value of 1 in the post-announcement period and 0 in
the pre-announcement period. To examine changes in bid-ask spreads, we regress SPREAD on
POST and other controls. Specifically,
2
, ,10, ,
1 (( )
, 0
i q tDi q t
)/ 2
ASK BIDSPREADD ASK BID
where POST
−
=−
−=
+
=
∑ (1)
30
, ,2, ,
1 (( )
, 1
i q tDi q t
)/ 2
ASK BIDSPREADD ASK BID
where POST=
−=
+
=
∑
(2)
- 12 -

where Di,q,t is the number of days in the announcement period in quarter q of year t for bank i for
which closing daily bids (BID) and closing daily asks (ASK) are available.
3.2. Sub-prime exposure (ABSBETA)
While managers have information about the sub-prime exposure of banks, it is not
disclosed in the annual reports. In order to measure banks’ sub-prime exposures, we use a
market-based measure using the sensitivity of bank stock returns to the ABX indices. As pointed
out by Ryan (2008), these indices which are administered by Markit and allow investors to take
positions on subprime mortgage-backed securities via CDS contracts have become a benchmark
for the performance of subprime real estate mortgage-backed securities (RMBS). The liquidity
and standardization allows investors to track movements in subprime RMBS market sentiment.
We compute the sensitivity of stock returns to changes in the ABX indices after controlling for
market returns and denote this sensitivity as 2β of the following regression:
, , 0 1 , , 2 , ,i d t m d t ABX d tr r rα β β= + + +ε
(4)
where ri,d,t is stock return for bank i during day d of year t; rm represents market return and rABX
indicates the average return across the six indices: ABX-HE-BBB 06-1, ABX-HE-BBB- 06-1,
ABX-HE-BBB 06-2, ABX-HE-BBB- 06-2, ABX-HE-BBB 07-2 and ABX-HE-BBB- 07-2.8
3.3. Managerial risk-inducing incentives (VEGA)
As studies (Rajan (2006), OECD (2009) among others) argue that the convexity of
payoffs due to stock options increases managerial risk-taking, we measure this risk-inducing
incentive using the stock option vega (which measures the sensitivity of changes in managerial
8 For example, Markit’s ABX-HE-BBB 06-2 index is based on credit derivatives referenced to twenty BBB-rated ABS primarily collateralized by subprime home equity mortgages originated in the second half of 2006.
- 13 -

wealth to changes in stock return volatility). We follow the methodology in Core and Guay
(2002) to measure stock option vega (VEGA).
3.4. Risk-management Disclosure (DISC)
Disclosure measure is based on the results of a public disclosure survey conducted by the
Basel Committee on Banking Supervision in 2001 (see Bhat (2009) for details). The disclosure
index includes 12 categories: capital structure, capital adequacy, market risk internal modeling,
internal and external ratings, credit risk modeling, securitization activities, asset quality, credit
derivatives and other credit enhancements, derivatives (other than credit derivatives), geographic
and business line diversification, accounting and presentation policies, other risks (i.e., interest
rate risk in the banking book, liquidity risk and operational risk). The positive aspects of using
the Basel disclosure questionnaire are: it is the most comprehensive disclosure index specifically
targeted at banks, and disclosure items are not geared to any particular database, but can be
implemented using annual report disclosures. We measure disclosure levels for the year 2005.
We implement the disclosure measure as a percentage of possible disclosure under each category
as dictated by the bank’s activities.9 Each item in the disclosure index is weighted equally.
3.5. Sample
Quarterly earnings data for banks are obtained from Bank Compustat while those for
industrial firms and all earnings announcement dates are from quarterly Compustat. Data for
computing bid-ask spreads come from CRSP. The final sample of banks comprises of 21,380
firm-quarter observations for 10,690 earnings announcements (one observation for the pre-period
9 For example, in 2005, a bank such as Abigail Adams National Bancorp, which does not engage in derivatives or securitization, has an aggregate disclosure score of 35 relative to a base of 64 (44%) as compared to the Bank of America, which has a disclosure score of 71 relative to a base of 93 (76%). This avoids penalizing the small and medium sized banks for lack in disclosures on account of activities they do not undertake.
- 14 -
and one for the post) pertaining to 512 unique bank holding companies between 2002 and 2008.
Similarly, the non-bank sample comprises of all firms that do not belong to an industry that starts
with the SIC code 6. This sample comprises of 119,102 firm-quarter observations for 59,551
earnings announcements for 3,626 unique firms over the period 2002 and 2008. The sample sizes
reduce for tests that examine the role of sub-prime assets, managerial incentives and disclosure
as these require data from Datastream, ExecuComp, and Bhat (2009) respectively. The sample
sizes for these tests are 17,510 , 4,136 and 8,696 observations respectively.
3.6. Descriptive statistics
Panel A in Table 1 presents descriptive statistics relating to banks. All variables have been
winsorized at the one-percent tails to mitigate the influence of outliers. The mean log of bid-ask
spread (SPREAD) is -5.1%. The banks vary in size from $19 million to $79 billion. 4.1% of the
sample comprises of observations listed on NYSE and 6.9% on AMEX. The average absolute
value of earnings surprise is 0.009 with a high of 0.307 and a low of 0.000. The average sub-
prime beta (ABSBETA) is -0.007 for the banks. On average, banks in the sample have mean
vega of 150.718 which implies that a 1% change in stock price causes a change of 150,718$ in
the manager’s wealth. Disclosure across the 92 annual report items varies from a minimum of
25% to a maximum of 70% with an average of 33%.
Panel B in Table 1 presents descriptive statistics relating to the control sample. The mean
log of bid-ask spread (SPREAD) is -5.4%. The industrial firms vary in size from $4 million to
$50 billion. 38% of the sample comprises of observations listed on NYSE and 10% on AMEX.
The average absolute value of earnings surprise is 0.050 with a high of 7.482 and a low of 0.000.
- 15 -
4. Results
4.1. SPREAD after earnings announcements during the crisis period
4.1.1 Preliminary evidence
Figure 1 presents the post-earnings announcements and the pre-announcements over the
time period 2002 to 2008. The x-axis plots the years in the sample while the y-axis plots the
mean values of the bid-ask spreads that correspond to these years. There are four lines – the thick
solid line and the thick dashed line represent post-announcement period and pre-annnouncement
period bid-ask spreads for banks respectively. Similarly, the thin solid line and the thin dashed
line represent post-announcement and pre-announcement period spreads for the control firms
(the industrial firms). Spreads have been declining since 2002 up until the crisis.
The post-earnings announcement spreads for banks jump dramatically in 2007 as well as
in 2008. While the pre-announcement spreads increase marginally in 2007, they jump up
significantly in 2008. More importantly, the post spread line is above the pre-spreads line in
2007 but below in 2008. This preliminary evidence appears to indicate that bank earnings
announcements in 2007 are associated with increases while those in 2008 are associated with
decreases in information asymmetry. While a similar trend appears for control firms, the
magnitudes of the changes are less dramatic.
These preliminary relations suggest that the initial period of the financial crisis (2007) is
associated with a significant increase in information asymmetry, which declines in the latter part
of the crisis (2008). In the next sections, we examine whether these preliminary relations are
robust to controlling for other determinants.
- 16 -

4.1.2 Multivariate regressions
In this section, we examine the change in SPREAD in a multivariate regression that
incorporates previously identified determinants of bid-ask spreads. In the following paragraphs,
we introduce the control variables and then describe our regression specifications.
Following prior research, we include the market value of equity (SIZE), because larger
firms have less information asymmetry (Atiase (1985), Bamber (1987)).10 Following Brennan,
Chordia and Subrahmanyam (1998) and Verrecchia and Weber (2006), we include two indicator
variables (NYSE and AMEX) to denote firms that trade on the NYSE and the AMEX exchanges.
All other firms trade on NASDAQ. As Ng et al. (2009) show that negative performance
increases adverse selection (see also Ng (2007) and Brown, Hillegeist and Lo (2009)), we
include an indicator variable to denote negative earnings (NEGATIVE).11 We also include the
absolute value of the earnings surprise defined as current quarter earnings less same quarter last
year earnings scaled by price (SURP).
Following Stoll (2000) and Jayaraman (2008), we include the inverse of the stock price
(PRCINV) as an additional determinant of spreads.12 We include turnover (TURN) as a proxy for
the inventory component of spreads so that the cross-sectional variation in spreads that remains
can be interpreted as capturing the adverse selection component (see Glosten and Harris (1988)).
All control variables have been defined as of the pre-earnings announcement period (day -45 to
day -2 relative to the earnings announcement date).
We estimate two regression specifications. In the first specification, we exclude firm
fixed-effects while the second specification includes firm fixed effects but excludes NYSE and
AMEX as these are time-invariant. Following Petersen (2009), we estimate the OLS regressions
10 Defining SIZE as the book value of assets yields similar results. 11 Our results are similar when we define NEGATIVE as negative earnings surprises. 12Our inferences are unaltered when we use the log value of stock price as an alternate definition.
- 17 -

with robust standard errors clustered at the firm level. The firm-level clustering of standard
errors corrects for the possibility of serial correlation attributable to unobserved firm effects. We
include fiscal quarter indicators in all specifications.13 The regression specifications are:
Model 1:
, , 0 1 , , 2 , , 3 , ,
4 , , 5 , , 6 , , 7 , , 8 , ,
9 , , 10 , , 11 , , 12 , ,
* 07 * 08
07 08i t q i t q i t q i t q
i t q i t q i t q i t q i t q
i t q i t q i t q i t q
Q
SPREAD POST POST YEAR POST YEAR
YEAR YEAR SIZE NYSE AMEX
NEGATIVE SURP PRCINV TURN
QUARTER
α α α α
α α α α α
α α α α
α ε
= + + +
+ + + + +
+ + + +
+ +∑
(5)
Model 2:
, , 0 1 , , 2 , , 3 , ,
4 , , 5 , , 6 , , 9 , , 10 , ,
11 , , 12 , ,
* 07 * 08
07 08i t q i t q i t q i t q
i t q i t q i t q i t q i t q
i t q i t q Q F
SPREAD POST POST YEAR POST YEAR
YEAR YEAR SIZE NEGATIVE SURP
PRCINV TURN QUARTER FIRM
α α α α
α α α α α
α α α α ε
= + + +
+ + + + +
+ + + + +∑ ∑ (6)
Model 3:
, , 0 1 , , 2 , , 3 , ,
4 , , 5 , ,
6 , , 7 , , 8 , , 9 , ,
10 , ,
* 07 * 08
* 07* * 08*
07 08 07* 08*
*
i t q i t q i t q i t q
i t q i t q
i t q i t q i t q i t q
i t
SPREAD POST POST YEAR POST YEAR
POST YEAR BANKS POST YEAR BANKS
YEAR YEAR YEAR BANKS YEAR BANKS
POST BANKS
α α α α
α α
α α α α
α
= + + +
+ +
+ + + +
+ 11 , , 12 , , 13 , , 14 , ,
15 , , 16 , , 17 , , 18 , ,
q i t q i t q i t q i t q
i t q i t q i t q i t q
Q
BANKS SIZE NYSE AMEX
NEGATIVE SURP PRCINV TURN
QUARTER
α α α α
α α α α
α ε
+ + + +
+ + + +
+ +∑
(7)
Model 4:
, , 0 1 , , 2 , , 3 , ,
4 , , 5 , ,
6 , , 7 , , 8 , , 9 , ,
10 , ,
* 07 * 08
* 07* * 08*
07 08 07* 08*
*
i t q i t q i t q i t q
i t q i t q
i t q i t q i t q i t q
i t
SPREAD POST POST YEAR POST YEAR
POST YEAR BANKS POST YEAR BANKS
YEAR YEAR YEAR BANKS YEAR BANKS
POST BANKS
α α α α
α α
α α α α
α
= + + +
+ +
+ + + +
+ 11 , , 12 , , 13 , ,
14 , , 15 , ,
q i t q i t q i t q
i t q i t q Q
SIZE NEGATIVE SURP
PRCINV TURN QUARTER
α α α
α α α ε
+ + +
+ + + +∑
(8)
13 We do not include year effects because our crisis indicator spans only two years – 2007 and 2008. To ensure that our results are not confounded by time-trends, we estimate our regression using only 2005 and 2006 as the non-crisis period and find similar results. Finally, we verify that using year indicators does not change any of our inferences.
- 18 -
Table 3 presents the results of the multivariate regressions of changes in bid-ask spreads
on the POST indicator and controls. The first two specifications present results for the banking
sample, while the next two specifications present results for the banking sample versus the
control sample. The coefficient of POST is positive and significant at the 1% level across all
specifications. This indicates that there is an increase in information asymmetry in the post
announcement period. The coefficient of POST*YEAR07 in the second specification is 0.159
which indicates that information asymmetry increases by 15.9% more in 2007 than in the non-
crisis period. These results are consistent with hypothesis H1b. On the other hand, the coefficient
of POST*YEA08 in the second specification is -0.128 which indicates that information
asymmetry decreases by 12.8% in 2008 relative to the non-crisis period.
The coefficient of POST*BANKS is positive and significant at the 1% level across the
third and the fourth specifications. This indicates that there is an increase in information
asymmetry in the post announcement period for banks relative to industrial firms. The
coefficients of POST*YEAR07*BANKS and POST*YEAR07*BANKS in the fourth specification
are 0.105 and 0.057 which indicates that information asymmetry increases by 10.5% for
industrial firms in 2007 relative to non-crisis period, and that the increase is 5.7% incremental
for the banking firms relative to industrial firms. On the other hand, the coefficient of
POST*YEA08 and POST*YEA08*BANKS is -0.012 and -0.109 which indicates that information
asymmetry decreases by 1% for industrial firms compared to a 10.9% decrease for banks in
2008.
- 19 -

4.2. Factors that influence the changes in information asymmetry during the crisis period
In this section, we consider the role of firm-specific factors that either aggravate or
mitigate the increase in information asymmetry during the crisis period. In particular, we
examine the role of exposure to sub-prime assets, stock option vega, and risk-management
disclosure.
In each of these tests, we split the sample into 2 groups based on the quartile value of the
respective variable and examine the difference in the coefficient of POST*YEAR07 and
POST*YEAR08 between the highest quartile and the lowest quartile. We report chi-squared tests
of the difference. We use the SPREAD as the dependent variable and use firm-fixed effects in all
the tests. As an additional robustness test, we also report differences in POST*YEAR07 and
POST*YEAR08 when we split the sample based on the median values of the respective variable.
4.2.1 Role of sub-prime exposure
If sub-prime exposure contributes to increased information asymmetry in the crisis
period, then as per hypothesis H2, we expect the coefficient on POST*YEAR07 and
POST*YEAR08 to be positive and significant for banks with high exposure to sub-prime assets
relative to banks with low exposure to sub-prime assets. Results are presented in table 4. The
coefficient of POST*YR2007 is positive and significant for both the high ABSBETA and the low
ABSBETA groups. The increase in information asymmetry for the low group is 15% while that
for the banks with high exposure to sub-prime assets is 16.8%. The coefficient on
POST*YEAR08 is negative and significant for both the groups. There is no difference in the
decline in 2008 between these two groups (10.7%). These results suggest that banks’ exposure to
sub-prime assets contributed to the increased information asymmetry during 2007 but does not
- 20 -

explain the decline in 2008. In addition, the subprime exposure was not the sole reason for the
increase in 2007 as there is an increase even for firms with low exposure to these toxic assets.
4.2.2 Role of stock option VEGA
Table 5 presents differences in POST spreads between the low and the high VEGA
groups. The coefficient of POST*YEAR07 is positive and significant and the coefficient of
POST*YEAR08 is negative and significant across both the groups. More importantly, the
increase in bid-ask spreads during 2007 is 19.9% for banks where managers have high vega
based on the quartile. On the other hand, for firms with low vega, the comparable increase is
12.5%. The difference between these groups is significant both statistically (as shown by the chi-
square test) as well as economically (the increase for the high group is almost one and half times
the increase for the low group). The decline in 2008 is higher for firm with high vega (8.9%)
compared to the firms with low vega (14.1%). These results are consistent with hypothesis H3
and indicate that the risk-inducing characteristics of stock option convexity contributed to the
increase in information asymmetry in the financial crisis period.
4.2.3 Role of disclosure
Our measure of disclosure (DISC) captures the extent of information provided about risk-
management practices followed by banks. A high score indicates that banks provide outsiders
with more transparent information relating to the risk management practices that it follows.
Consistent with hypothesis H5, if these disclosures help outsiders better interpret the
implications of earnings for the underlying risk profile of the bank, we expect the increased
information asymmetry during the financial crisis period to be attenuated for such banks.
- 21 -
Table 6 presents the results of the above tests. The coefficient of POST is positive and
significant for the both the disclosure groups – high and low, but different in magnitude. On
average, post spreads are higher than the pre spreads by 4.4% for firms that have high disclosures
and are higher by 8.4% for firms that have low disclosure. Further, consistent with hypothesis
H5, the coefficient of POST*YR07 for the high disclosure group based on the quartile is 10.5%
and 14.4% for the low DISC group. On the other hand, the coefficient of POST*YR8 for the high
disclosure group based on the quartile is 19.5% and 10.8% for the low DISC group. These results
suggest that banks with high disclosure had a lower increase in information asymmetry during
the early part of the crisis and had a more pronounced decrease in information asymmetry during
the latter part of the crisis. We investigate this decline in 2008 in information asymmetry.
5. What drives the decrease in information asymmetry in 2008?
5.1. Political Costs and loss recognition
While 2007 was characterized by uncertainty for all firms, the political and regulatory
pressure on the financial institutions, especially large, was high due to the dominant role that
these institutions play on the economic stability which is in line with the political cost hypothesis
(Watts and Zimmerman (1978, 1986). The crisis began with the rumblings in the subprime
mortgage markets in the late 2006 and came to the forefront in early 2007 when New Century
Financial announced restatement in earnings on account of allowance for loan repurchase losses,
and subsequently filed for bankruptcy. This early wave mostly affected subprime mortgage
markets. In the second and third quarter of 2007, major U.S. banks (for example, Merrill Lynch
and Citigroup) began to announce losses and discuss diffilculty in valuing subprime positions.
The loss recognition escalated in early 2008, when mortgage-related GSEs (Fannie Mae
and Freddie Mac) reported large losses on their credit guarantees and credit card banks reported
- 22 -
large provisions for loan losses. The banking industry witnessed record high loan loss provision,
high losses on investments securities and trading activities and goodwill impairment expenses
that combined to drive the industry earnings to record lows in 2008.14
The magnitude of the political costs is highly dependent on firm size. Thus, larger banks
are more exposed to political pressures from regulators because of their dominant influence on
the economic system’s stability. Therefore, we explore whether bank size played a role in the
decrease in information asymmetry in 2008. In addition, we explore the role of high loan loss
provision, high losses on investments securities and trading activities and goodwill impairment
expenses in reducing the information asymmetry.
We measure size using total assets. We measure loan loss provisions (LLP), unrealized
gains and losses on available for sale securities (UGLAFS), realized gains and losses on available
for sale securities (RGLAFS), and realized gains and losses relating to trading (GLTRADE)
deflated by total assets.
We present results based on the firm size in Panel A of Table 7. We find that bid-ask
spreads increase by 16.5% for the larger banks compared to an increase of 14% for the smaller
banks. Interestingly, the decrease in spreads in 2008 is 16.5% for the large banks, whereas the
there is an increase of 5.5% in the spreads for the small banks. These results are statistically and
economically significant.
The results relating to the loss recognition are documented in Panels B to E of Table 7. We
compare the coefficient on POST for the year 2008 between banks that have high LLP
14 According to the FDIC Quarterly reports, the aggregate earnings for the insured commercial banks and savings institutions reported earnings in the first quarter of 2008 were $19.3 billion, compared to $35.6 billion a year earlier. The second quarter earnings were $5.0 billion, which was $31.8 billion less than the amount industry earned in the second quarter in 2007. Third quarter net income totaled $1.7 billion, a decline of $27.0 billion from the third quarter of 2007. In the fourth quarter of 2008, the industry producing a net loss of $32.1 billion compared to a profit of 575 million in the fourth quarter of 2007.
- 23 -
recognition versus banks that have low LLP. The decrease in SPREAD for banks in the highest
quartile based on LLP is 11.2%, while the decrease in SPREAD for banks in the lowest quartile
based on LLP is 7.6% (Panel B).
Next, we compare the coefficient on POST for the year 2008 between banks that have
losses versus banks that have gains relating to available for sale of securities and trading
activities. The spreads decreased by 11.4% for the banks with RGLAFS<0 compared to a
decrease of 9.8% for the banks with RGLAFS>=0. The difference is more pronounced when we
compare two groups based on unrealized losses versus unrealized gains on available for sale
securities. The spreads decreased by 10.9% for the banks with UGLAFS<0 compared to a
decrease of 4.5% for the banks with UGLAFS>=0. Last, the results relating to losses on trading
indicate that the banks with trading losses had a decrease of 8.3% compared to a decrease of
10.4% for banks with trading gains.
Overall, evidence suggests that the decrease in information asymmetry in 2008 was
driven by the larger banks and banks that were forthcoming with losses.
5.2. Fair Value Levels
The FASB ASC 825–10–15 (SFAS 159 pre-codification) and FASB ASC 820-10-50
(SFAS No. 157 pre-codification) became mandatory for fiscal years beginning 15 November
2007. The ASC 825-10-15 allows firms to elect fair value option for any of the eligible financial
instruments. The accompanying FASB ASC 820-10-50 identifies a hierarchy to rank the
reliability of the inputs used in estimation of fair values. The Level 1 fair values are based on
direct market quotes for identical items in liquid markets. The Level 2 fair values are based on
observable inputs such as market quotes of similar financial instruments or inputs that a market
- 24 -

participant would use when financial instruments lack a ready market. The Level fair values are
fair values that are based on unobservable inputs. While fair values reflect current economic
conditions and are likely more relevant than historical costs in describing financial instruments,
the recent market turmoil has highlighted that fair values are not always easily determinable or
interpretable in stressed and illiquid markets. Given the hierarchical information, the information
asymmetry is expected to be highest relating to the level 2 and 3 assets relative to level 1 assets.
The gross level 1, level 2 and level 3 of fair value assets is available in Compustat. In line
with the analysis in Laux and Leuz 2009, we do not subtract liabilities reported at fair value but
all assets are reported after netting of derivatives and hedges. We allocate the netting adjustment
proportionally to Level 1, Level 2 and Level 3 assets. Our measure L2L3 is the level of fair value
assets at level 2 and level 3 as a proportion of the total fair value of assets.
We present results based on the proportion of level2 and level 3 assets in the total fair
value assets for banks in 2008 in Table 8. Consistent with high managerial discretion and
resulting biases and noise attenuating the increase in post spreads during 2008, we find that bid-
ask spreads decrease by 3.3% (7.9%) for banks with higher proportion of level 2 and level 3
assets relative to level 1 assets based on quartiles. These results are statistically and economically
significant.
6. Additional Analyses and Robustness Tests
6.1. Sub-prime exposure
While our main tests regarding exposure to sub-prime lending are based on the average of
six ABX indices, in this section we examine sensitivity tests based on excluding assets rated
BBB. In particular, we include only the BBB- indices as a finer measure of the extent of risky
- 25 -

loans on banks’ balance sheets. In unreported tests, we find similar results to those reported
earlier. In particular, the increases in bid-ask spreads in the crisis period is pronounced for firms
that are more highly correlated with the BBB- index.
6.2. Disclosure index
We examine the robustness of our disclosure tests using an equal-weighting of 11
categories instead of the 92 items. In unreported tests, we find that the coefficient on the crisis
indicator is positive and significant in all the specifications.
6.3. Effective spreads
While our primary results are based on the relative bid-ask spread, we examine the
robustness of our results using the effective spread as an alternate measure of informed trading.
In unreported results, we find that the coefficient of POST is positive and significant in all four
regression models of table 3 at 1% level of significance.
6.4. Trend-adjusted bid-ask spreads
It is possible that the increase in bid-ask spreads around earnings announcements that we
find is merely depicting an overall increase in information asymmetry during this period. While
this alternate interpretation does not explain why increases in spreads would be pronounced for
banks with greater sub-prime exposure, those with higher managerial stock option vega and for
those with poor disclosure, we verify sensitivity of our results to trend-adjusting the measures. In
particular, we adjust bid-ask spreads by subtracting the median bid-ask spread for all firms
- 26 -
during each week in the pre and post announcement periods. In unreported tests, we find a
significant increase in trend-adjusted bid-ask spreads around earnings announcements.
7. Conclusion
This study examines the role of financial reporting in the banking industry during the
recent financial crisis. We examine bid-ask spread around earnings announcements and find that
bid-ask spreads increase significantly in the post earnings announcement period during the
subprime crisis in 2007 bust decrease during the global meltdown in 2008. These results suggest
that ability of informed traders to use their superior information processing ability to gain an
informational advantage over uninformed investors was magnified during early part of the recent
financial crisis, but was attenuated in the latter part as banks started coming forth with loss
recognition.
We perform several tests to examine factors that contributed to these changes in
information asymmetry during the crisis. Although initially triggered by the crisis in the sub-
prime mortgage market, the recent financial crisis revealed a laundry list of culpable candidates.
Copious as the list is, the ones that were highlighted in the media and received regulator’s
attention are the risk-inducing role of equity-based compensation, and lack of meaningful risk-
management disclosures. We find that the increase in information asymmetry is more
pronounced when exposure to sub-prime assets is high, managerial equity incentives increase the
risk appetite of managers and there is lack of risk management disclosure. On the other hand, we
find that decreases in information asymmetry during 2008 are more pronounced for banks with
low vega, high risk-management disclosure, large banks and banks that have been forthcoming
in loss recognition.
- 27 -

- 28 -
Given the increased importance that bank regulators and the Basel Committee have
recently placed on the role of financial reporting in market discipline of banks, our results are of
potential interest to these constituents. The evidence in this study suggests that while the
subprime debacle may have indeed triggered the financial crisis, transparency in terms of high
quality risk management disclosures and loss recognition helped attenuate the negative
consequences on information asymmetry around earnings announcements.

References
Amihud, Y., and H. Mendelson, 1986, Asset Pricing and the Bid-Ask Spread Journal of Financial Economics 17 (1986): 223–249.
Atiase, R., 1985, Predisclosure Information, Firm Capitalization, and Security Price Behavior Earnings Announcements Journal of Accounting Research 23: 21–36.
Bagehot, W., 1971, The Only Game in Town Financial Analysts Journal 27: 12–22.
Baiman, S., and R. Verrecchia, 1996, The Relation among Capital Markets, Financial Disclosure, Production Efficiency, and Insider Trading, Journal of Accounting Research 34: 1–22.
Bamber, L. S. “Unexpected Earnings, Firm Size, and Trading Volume around Quarterly Earnings Announcements.” Accounting Review 62 (1987): 510–532.
Basel Committee on Banking Supervision, 2001a, The New Basel Capital Accord, <http://www.bis.org/publ/bcbsca.htm>, January
Basel Committee on Banking Supervision. "Consultative Document-Enhancing corporate governance for banking organizations ." 2005. Basel Committee on Banking Supervision. "Public Disclosure by Banks: Results of the 2001 Disclosure Survey." 2003.
Bebchuk, L., A. Cohen, and A. Ferrell., 2009, What Matters in Corporate Governance? Review of Financial Studies 22, no. 2: 783-827
Bhat, G., 2009, Impact of Disclosure and Corporate Governance on the Association Between Fair Value Gains and Losses and Stock Returns in the Commercial Banking Industry, Washington University Working paper
Bies, S Schmidt, Member of the Board of Governors of the US Federal Reserve System. Speech at the Banking Institute, Charlotte, North Carolina, March 31, 2006.
Boot, A. W. A., & Thakor, A. V. (2001). The many faces of information disclosure. Review of Financial Studies, 14(4), 1021-1057.
Brennan M.; T. Chordia; and A. Subrahmanyam. “Alternative Factor Specifications, Security Characteristics and the Cross-Section of Expected Stock Returns.” Journal of Financial Economics 49 (1998): 345–373.
Brown, Lawrence D., and Marcus L. Caylor, 2006, Corporate governance and firm valuation, Journal of Accounting and Public Policy July-Aug, 409-434.
Brown, S., S. A. Hillegeist and K. Lo, 2009, The effect of earnings surprises on information asymmetry, Journal of Accounting and Economics, forthcoming
Bushman, R. M., and A. J. Smith. 2001. Financial Accounting Information and Corporate Governance Journal of Accounting & Economics 32, no. 1-3: 237-333.
Bushman, R. M., and C. Williams. 2007. “Bank Transparency, Loan Loss Provisioning Behavior, and Risk-Shifting,” Working paper, UNC Chapel Hill
Copeland, T. E., and D. Galai. “Information Effects on the Bid-Ask Spread.” The Journal of Finance 38 (1983): 1457–1469.
Core, J., and W. Guay, 2002, Estimating the value of employee stock option portfolios and their sensitivities to price and volatility, Journal of Accounting Research, 40 (3), 613-630
Diamond, D. “Optimal Release of Information by Firms.” Journal of Finance 40 (1985): 1071–1094.
Flannery, M., & Thakor, A. V. (2006). Accounting, transparency and bank stability - Introduction. (Editorial Material). Journal of Financial Intermediation, 15(3), 281-284.
Glosten, L. R., and L. E. Harris. “Estimating the Components of the Bid/Ask Spread.” Journal of
Financial Economics 21 (1988): 123–142.
Glosten, L. R., and P. R. Milgrom. “Bid, Ask, and Transaction Prices in a Specialist Market with Heterogeneously Informed Traders.” Journal of Financial Economics 14 (1985): 71–100.
Graham, J. R.; C. R. Harvey and S. Rajgopal. “The economic implications of corporate financial reporting.” Journal of Accounting & Economics 40 (2005): 3-73.
Grossman, S. J., and J. E. Stiglitz. “On the Impossibility of Informationally Efficient Markets.” American Economic Review 70 (1980): 393–408.
Hasbrouck, J.. 2009, Trading Costs and Returns for US Equities: Estimating Effective Costs from Daily Data, Journal of Finance, forthcoming.
Jayaraman, S., 2008, Earnings Volatility, Cash flow Volatility and Informed Trading, Journal of Accounting Research Vol. 46 (4), 809-851
Kim, O., & Verrecchia, R. E. (1994). Market Liquidity And Volume Around Earnings Announcements. Journal of Accounting & Economics, 17(1-2), 41-67.
Kim, O., Verrecchia, R.E., 1997. Pre-announcement and event-period private information. Journal of Accounting and Economics 24, 395–419.
Kyle, A. S. “Continuous Auctions and Insider Trading.” Econometrica 53 (1985): 1315–1336.

Leuz, C., and R. Verrecchia. 2000. The Economic Consequences of Increased Disclosure. Journal of Accounting Research 38, 91-124.
Ng, Jeffrey, Earnings Surprises and Changes in Liquidity (March 2007). Working paper
Ng, Jeffrey, R.E. Verrecchia, and J. Weber. 2009. Firm Performance Measures and Adverse Selection, MIT working paper.
Petersen, M. A. “Estimating Standard Errors in Finance Panel Data Sets: Comparing Approaches.” Review of Financial Studies 22 (2009): 435-480.
Rajan, R. M., 2006, ‘Has finance made the world riskier?’ European Financial Management, Vol. 12, No. 4, 499-533.
Rogers, J. L., 2008, Disclosure Quality and Management Trading Incentives Journal of Accounting Research 46, no. 5: 1265-96.
Ryan, S. G., 2007. Financial Instruments and Institutions: Accounting and Disclosure Rules. John Wiley & Sons Ltd.
Ryan, S. G., 2008. Accounting in and for the Subprime Crisis. Accounting Review, 83(6), 1605-1638.
Schwarcz, Steven L., 2009., Keynote Address: Understanding the Subprime Financial Crisis. South Carolina Law Review, Vol. 60, No. 3,
Stoll, H. “Friction.” Journal of Finance 55 (2000): 1479–1514.
Verrecchia, R. E. “Essays on disclosure.” Journal of Accounting & Economics 32 (2001): 97–180.
Verrecchia, R. E. “The Use of Mathematical Models in Financial Accounting.” Journal of Accounting Research 20 (1982): 1–42.
Verrecchia, R., and J. Weber. 2006. Redacted Disclosure. Journal of Accounting Research 44, 791-814.
Watts, R.L. and J.L. Zimmerman, 1978, Towards a positive theory of the determination of accounting standards, Accounting Review 53, pp. 112–134. Watts, R.L. and J.L. Zimmerman, 1986, Positive accounting theory, Prentice-Hall, Englewood Cliffs, NJ (1986).

Appendix 1: Variable Definitions AMEX Indicator variable that represent whether or not the firm is listed on AMEX ABSBETA Sensitivity of bank stock returns to ABX indices return. It is measured as the
coefficient of ABX from a regression of bank daily stock returns on market returns and average of 6 ABX indices return administered by www.markit.com
ASSETS Book value of total assets. DISC The disclosure index of Bhat (2009) GLTRADE Realized gains and losses from trading securities scaled by total assets. NEGATIVE Indicator variable that denotes negative earnings NYSE Indicator variable that represent whether or not the firm is listed on NYSE POST Dummy variable to denote the post-earnings announcement period versus the
pre-announcement period. Takes the value of 1 for the post-announcement period (day 2 to 30 relative to the earnings announcement date) and 0 for the pre-announcement period (day -10 to -2 relative to the earnings announcement date)
PRCINV Inverse of the stock price RGLAFS Realized gains and losses from available for sale securities scaled by total
assets. SIZE Log of market value of equity defined as the number of shares outstanding
times stock price. SPREAD Log bid-ask spread defined as the difference between the ask price and the bid-
price divided by the average of the ask and the bid price. Data to compute daily spreads are from CRSP.
SURP Absolute value of the earnings surprise defined as change in earnings per share between the current quarter and the same quarter of the quarter of the previous year scaled by the pre-earnings announcement period stock price.
TURN Ratio of number of shares traded to shares outstanding.
UGLAFS Unrealized gains and losses from available for sale securities. VEGA Stock option vega computed as per the methodology in Core and Guay (2002) YEAR07 Indicator variable that denotes the year 2007 YEAR08 Indicator variable that denotes the year 2008

Table 1: Descriptive statistics SPREAD indicates the log value of bid-ask spreads. YEAR07 and YEAR08 are indicator variables that denote the 2007 and 2008 years. SIZE denotes log of market value of equity. NYSE and AMEX are indicator variables that represent whether or not the firm is listed on NYSE or AMEX respectively. NEGATIVE indicates firms with negative earnings. SURP denotes the extent of earnings surprise. PRCINV is the inverse of the stock price. TURN measures stock turnover. ABSBETA indicates banks’ exposure to sub-prime assets. VEGA is the measure of stock option vega computed as per Core and Guay (2002). DISC represents the disclosure index. ASSETS denotes book value of total assets. LLP represents loan loss provisions scaled by total assets. UGLAFS denotes unrealized gains and losses from available for sale securities. RGLAFS indicates realized gains and losses from available for sale securities scaled by total assets. GLTRADE is the realized gains and losses from trading securities scaled by total assets. Detailed variable definitions are in Appendix 1. Panel A presents descriptive statistics for banks while panel B presents comparable data for the control firms (all industrial firms). Panel A: Banks
N Mean Median Min. Max. Std. Dev.
SPREAD 21,380 -5.111 -5.045 -7.805 -2.416 1.238
YEAR07 21,380 0.134 0.000 0.000 1.000 0.341
YEAR08 21,380 0.093 0.000 0.000 1.000 0.290
SIZE 21,380 5.652 5.290 2.921 11.276 1.708
NYSE 21,380 0.041 0.000 0.000 1.000 0.199
AMEX 21,380 0.069 0.000 0.000 1.000 0.253
NEGATIVE 21,380 0.046 0.000 0.000 1.000 0.209
SURP 21,380 0.009 0.003 0.000 0.307 0.024
PRICEINV 21,380 0.053 0.044 0.013 0.226 0.034
TURN 21,380 -2.067 -2.028 -5.114 0.669 1.217
ABSBETA
17,510 -0.007 -0.008 -0.296 0.252 0.082
VEGA
4,136 140.251 51.658 0.000 1,242.337 226.939
DISC
8,696 32.581 31.000 25.000 48.000 4.856
ASSETS
21,376 13,876.740 1,294.050 175.502 485,901.000 58,225.060
LLP
19,596 0.002 0.001 -0.005 0.050 0.003
UGLAFS
10,668 0.000 0.000 -0.018 0.014 0.001
RGLAFS
19,588 0.000 0.000 -0.100 0.016 0.001
GLTRADE
19,570 0.000 0.000 -0.013 0.018 0.001

Panel B: Non-banks
N Mean Median Min. Max. Std. Dev.
SPREAD 119,102 -5.445 -5.590 -7.822 -2.121 1.344
YEAR07 119,102 0.148 0.000 0.000 1.000 0.355
YEAR08 119,102 0.110 0.000 0.000 1.000 0.313
SIZE 119,102 5.917 5.875 1.355 10.823 2.054
NYSE 119,102 0.380 0.000 0.000 1.000 0.485
AMEX 119,102 0.100 0.000 0.000 1.000 0.300
NEGATIVE 119,102 0.352 0.000 0.000 1.000 0.478
SURP 119,102 0.050 0.009 0.000 7.482 0.236
PRICEINV 119,102 0.233 0.073 0.011 3.261 0.464
TURN 119,102 -0.842 -0.698 -4.343 1.648 1.188
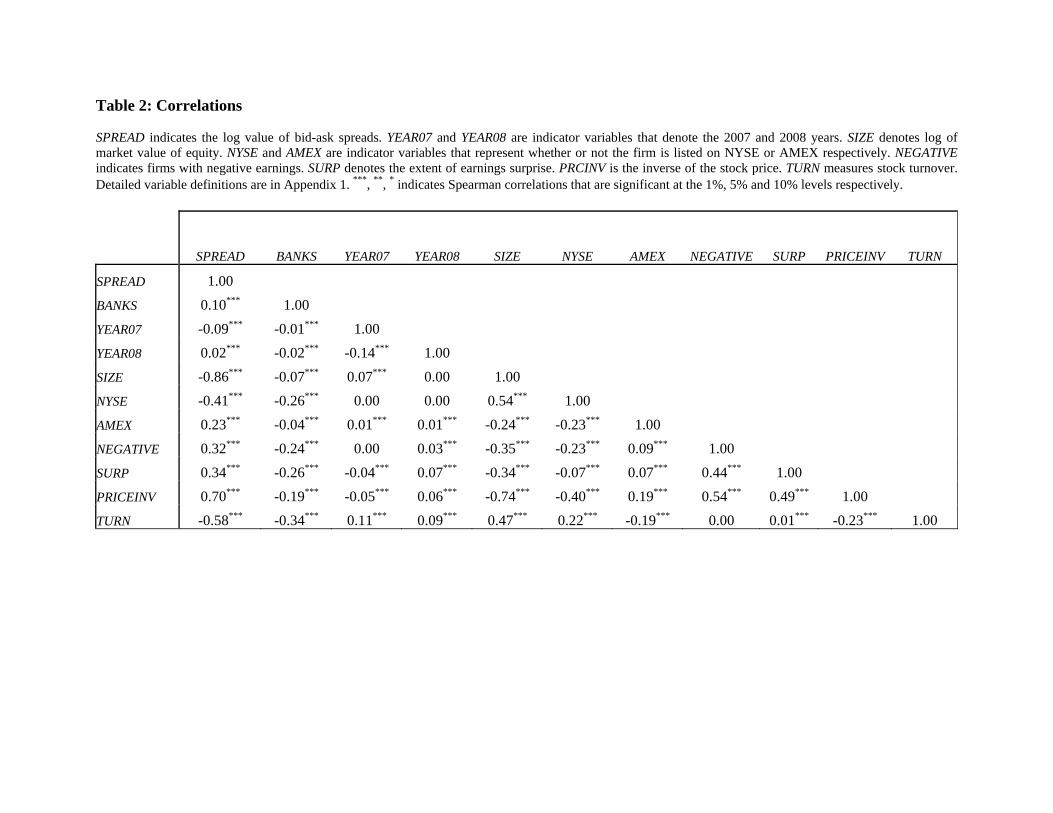
Table 2: Correlations SPREAD indicates the log value of bid-ask spreads. YEAR07 and YEAR08 are indicator variables that denote the 2007 and 2008 years. SIZE denotes log of market value of equity. NYSE and AMEX are indicator variables that represent whether or not the firm is listed on NYSE or AMEX respectively. NEGATIVE indicates firms with negative earnings. SURP denotes the extent of earnings surprise. PRCINV is the inverse of the stock price. TURN measures stock turnover. Detailed variable definitions are in Appendix 1. ***, **, * indicates Spearman correlations that are significant at the 1%, 5% and 10% levels respectively.
SPREAD BANKS YEAR07 YEAR08 SIZE NYSE AMEX NEGATIVE SURP PRICEINV TURN
SPREAD 1.00
BANKS 0.10*** 1.00
YEAR07 -0.09*** -0.01*** 1.00
YEAR08 0.02*** -0.02*** -0.14*** 1.00
SIZE -0.86*** -0.07*** 0.07*** 0.00 1.00
NYSE -0.41*** -0.26*** 0.00 0.00 0.54*** 1.00
AMEX 0.23*** -0.04*** 0.01*** 0.01*** -0.24*** -0.23*** 1.00
NEGATIVE 0.32*** -0.24*** 0.00 0.03*** -0.35*** -0.23*** 0.09*** 1.00
SURP 0.34*** -0.26*** -0.04*** 0.07*** -0.34*** -0.07*** 0.07*** 0.44*** 1.00
PRICEINV 0.70*** -0.19*** -0.05*** 0.06*** -0.74*** -0.40*** 0.19*** 0.54*** 0.49*** 1.00
TURN -0.58*** -0.34*** 0.11*** 0.09*** 0.47*** 0.22*** -0.19*** 0.00 0.01*** -0.23*** 1.00
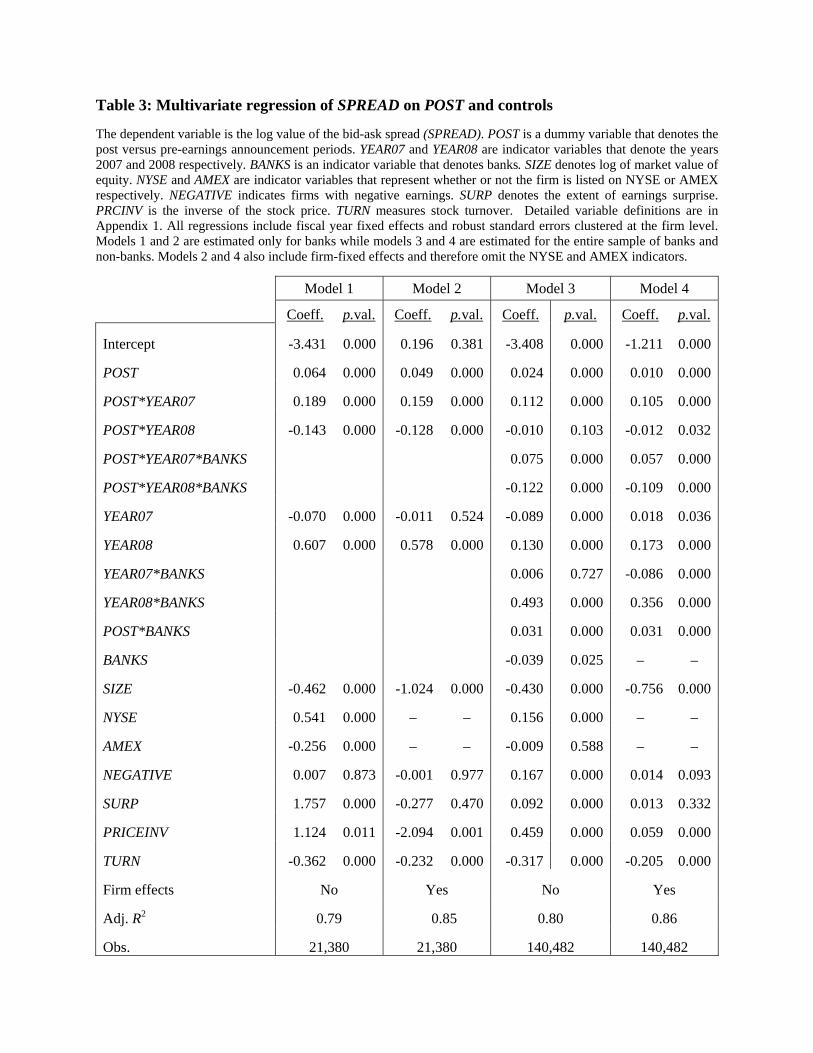
Table 3: Multivariate regression of SPREAD on POST and controls The dependent variable is the log value of the bid-ask spread (SPREAD). POST is a dummy variable that denotes the post versus pre-earnings announcement periods. YEAR07 and YEAR08 are indicator variables that denote the years 2007 and 2008 respectively. BANKS is an indicator variable that denotes banks. SIZE denotes log of market value of equity. NYSE and AMEX are indicator variables that represent whether or not the firm is listed on NYSE or AMEX respectively. NEGATIVE indicates firms with negative earnings. SURP denotes the extent of earnings surprise. PRCINV is the inverse of the stock price. TURN measures stock turnover. Detailed variable definitions are in Appendix 1. All regressions include fiscal year fixed effects and robust standard errors clustered at the firm level. Models 1 and 2 are estimated only for banks while models 3 and 4 are estimated for the entire sample of banks and non-banks. Models 2 and 4 also include firm-fixed effects and therefore omit the NYSE and AMEX indicators. Model 1 Model 2 Model 3 Model 4 Coeff. p.val. Coeff. p.val. Coeff. p.val. Coeff. p.val.
Intercept -3.431 0.000 0.196 0.381 -3.408 0.000 -1.211 0.000
POST 0.064 0.000 0.049 0.000 0.024 0.000 0.010 0.000
POST*YEAR07 0.189 0.000 0.159 0.000 0.112 0.000 0.105 0.000
POST*YEAR08 -0.143 0.000 -0.128 0.000 -0.010 0.103 -0.012 0.032
POST*YEAR07*BANKS 0.075 0.000 0.057 0.000
POST*YEAR08*BANKS -0.122 0.000 -0.109 0.000
YEAR07 -0.070 0.000 -0.011 0.524 -0.089 0.000 0.018 0.036
YEAR08 0.607 0.000 0.578 0.000 0.130 0.000 0.173 0.000
YEAR07*BANKS 0.006 0.727 -0.086 0.000
YEAR08*BANKS 0.493 0.000 0.356 0.000
POST*BANKS 0.031 0.000 0.031 0.000
BANKS -0.039 0.025 – –
SIZE -0.462 0.000 -1.024 0.000 -0.430 0.000 -0.756 0.000
NYSE 0.541 0.000 – – 0.156 0.000 – –
AMEX -0.256 0.000 – – -0.009 0.588 – –
NEGATIVE 0.007 0.873 -0.001 0.977 0.167 0.000 0.014 0.093
SURP 1.757 0.000 -0.277 0.470 0.092 0.000 0.013 0.332
PRICEINV 1.124 0.011 -2.094 0.001 0.459 0.000 0.059 0.000
TURN -0.362 0.000 -0.232 0.000 -0.317 0.000 -0.205 0.000
Firm effects No Yes No Yes
Adj. R2 0.79 0.85 0.80 0.86
Obs. 21,380 21,380 140,482 140,482

Table 4: Role of sub-prime exposure The dependent variable is the log value of the bid-ask spread (SPREAD). ABSBETA indicates banks’ exposure to sub-prime assets and is measured as the correlation between the bank’s stock returns and the sub-prime index returns. Low (High) ABSBETA banks are those with values above (below) the third quartile (first quartile). POST is a dummy variable that denotes the post versus pre-earnings announcement periods. YEAR07 and YEAR08 are indicator variables that denote the years 2007 and 2008 respectively. SIZE denotes log of market value of equity. NEGATIVE indicates firms with negative earnings. SURP denotes the extent of earnings surprise. PRCINV is the inverse of the stock price. TURN measures stock turnover. Detailed variable definitions are in Appendix 1. All regressions are estimated only for the sub-sample of banking firms and include firm fixed effects, fiscal year fixed effects and robust standard errors clustered at the firm level.
Low versus high ABX index sensitivity Low ABSBETA High ABSBETA Coeff. p.val. Coeff. p.val.
Intercept 0.216 0.586 -0.743 0.118
POST 0.042 0.000 0.056 0.000
POST*YEAR07 0.150 0.000 0.168 0.000
POST*YEAR08 -0.107 0.000 -0.107 0.002
YEAR07 -0.030 0.388 0.016 0.667
YEAR08 0.573 0.000 0.671 0.000
SIZE -1.056 0.000 -0.889 0.000
NEGATIVE 0.090 0.163 -0.020 0.871
SURP -0.376 0.547 0.133 0.839
PRICEINV -3.081 0.001 -1.516 0.284
TURN -0.254 0.000 -0.233 0.000
Firm effects Yes Yes
Chi-sq of difference POST*YEAR07: 0.024 POST*YEAR08: 0.951
Adj. R2 0.84 0.85
Obs. 4,412 4,482
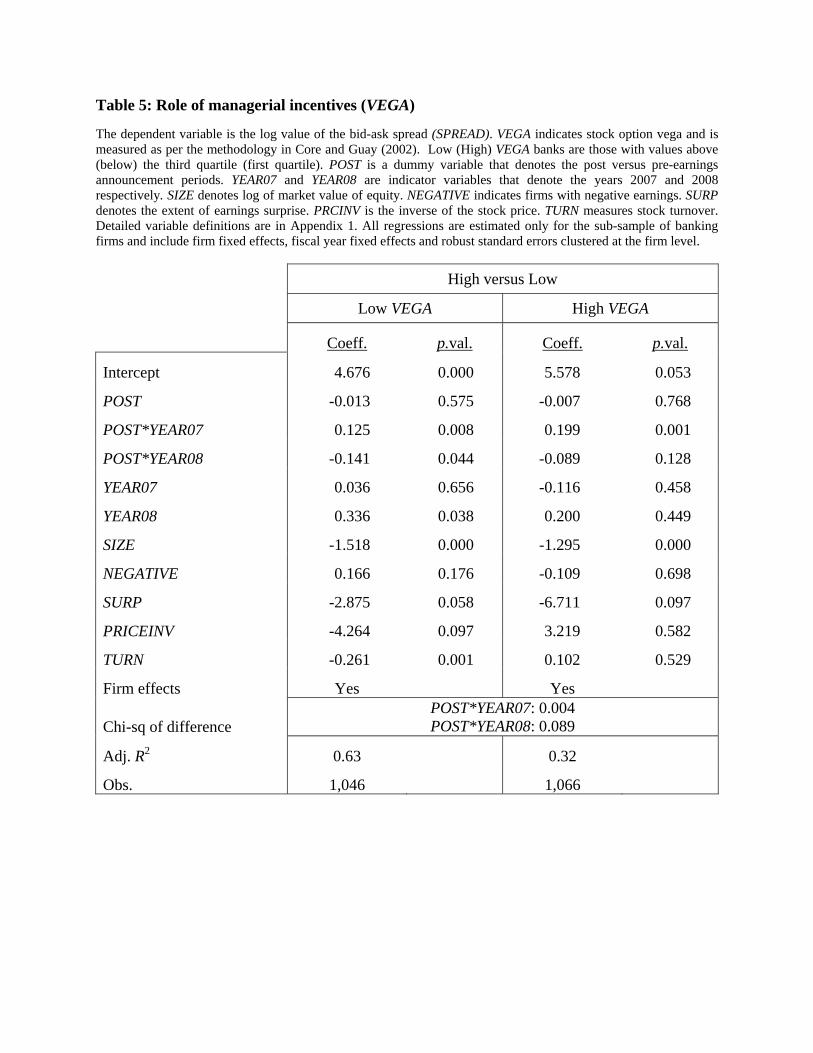
Table 5: Role of managerial incentives (VEGA) The dependent variable is the log value of the bid-ask spread (SPREAD). VEGA indicates stock option vega and is measured as per the methodology in Core and Guay (2002). Low (High) VEGA banks are those with values above (below) the third quartile (first quartile). POST is a dummy variable that denotes the post versus pre-earnings announcement periods. YEAR07 and YEAR08 are indicator variables that denote the years 2007 and 2008 respectively. SIZE denotes log of market value of equity. NEGATIVE indicates firms with negative earnings. SURP denotes the extent of earnings surprise. PRCINV is the inverse of the stock price. TURN measures stock turnover. Detailed variable definitions are in Appendix 1. All regressions are estimated only for the sub-sample of banking firms and include firm fixed effects, fiscal year fixed effects and robust standard errors clustered at the firm level. High versus Low Low VEGA High VEGA Coeff. p.val. Coeff. p.val.
Intercept 4.676 0.000 5.578 0.053
POST -0.013 0.575 -0.007 0.768
POST*YEAR07 0.125 0.008 0.199 0.001
POST*YEAR08 -0.141 0.044 -0.089 0.128
YEAR07 0.036 0.656 -0.116 0.458
YEAR08 0.336 0.038 0.200 0.449
SIZE -1.518 0.000 -1.295 0.000
NEGATIVE 0.166 0.176 -0.109 0.698
SURP -2.875 0.058 -6.711 0.097
PRICEINV -4.264 0.097 3.219 0.582
TURN -0.261 0.001 0.102 0.529
Firm effects Yes Yes
Chi-sq of difference POST*YEAR07: 0.004 POST*YEAR08: 0.089
Adj. R2 0.63 0.32
Obs. 1,046 1,066
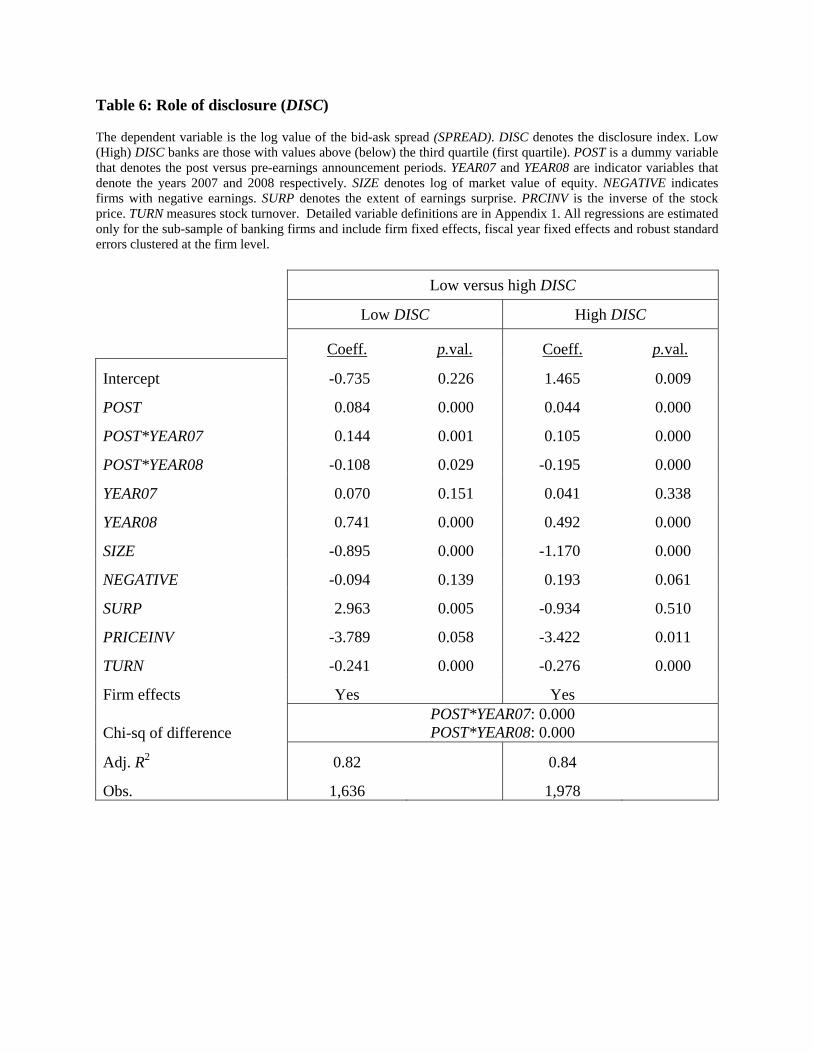
Table 6: Role of disclosure (DISC) The dependent variable is the log value of the bid-ask spread (SPREAD). DISC denotes the disclosure index. Low (High) DISC banks are those with values above (below) the third quartile (first quartile). POST is a dummy variable that denotes the post versus pre-earnings announcement periods. YEAR07 and YEAR08 are indicator variables that denote the years 2007 and 2008 respectively. SIZE denotes log of market value of equity. NEGATIVE indicates firms with negative earnings. SURP denotes the extent of earnings surprise. PRCINV is the inverse of the stock price. TURN measures stock turnover. Detailed variable definitions are in Appendix 1. All regressions are estimated only for the sub-sample of banking firms and include firm fixed effects, fiscal year fixed effects and robust standard errors clustered at the firm level. Low versus high DISC Low DISC High DISC Coeff. p.val. Coeff. p.val.
Intercept -0.735 0.226 1.465 0.009
POST 0.084 0.000 0.044 0.000
POST*YEAR07 0.144 0.001 0.105 0.000
POST*YEAR08 -0.108 0.029 -0.195 0.000
YEAR07 0.070 0.151 0.041 0.338
YEAR08 0.741 0.000 0.492 0.000
SIZE -0.895 0.000 -1.170 0.000
NEGATIVE -0.094 0.139 0.193 0.061
SURP 2.963 0.005 -0.934 0.510
PRICEINV -3.789 0.058 -3.422 0.011
TURN -0.241 0.000 -0.276 0.000
Firm effects Yes Yes
Chi-sq of difference POST*YEAR07: 0.000 POST*YEAR08: 0.000
Adj. R2 0.82 0.84
Obs. 1,636 1,978
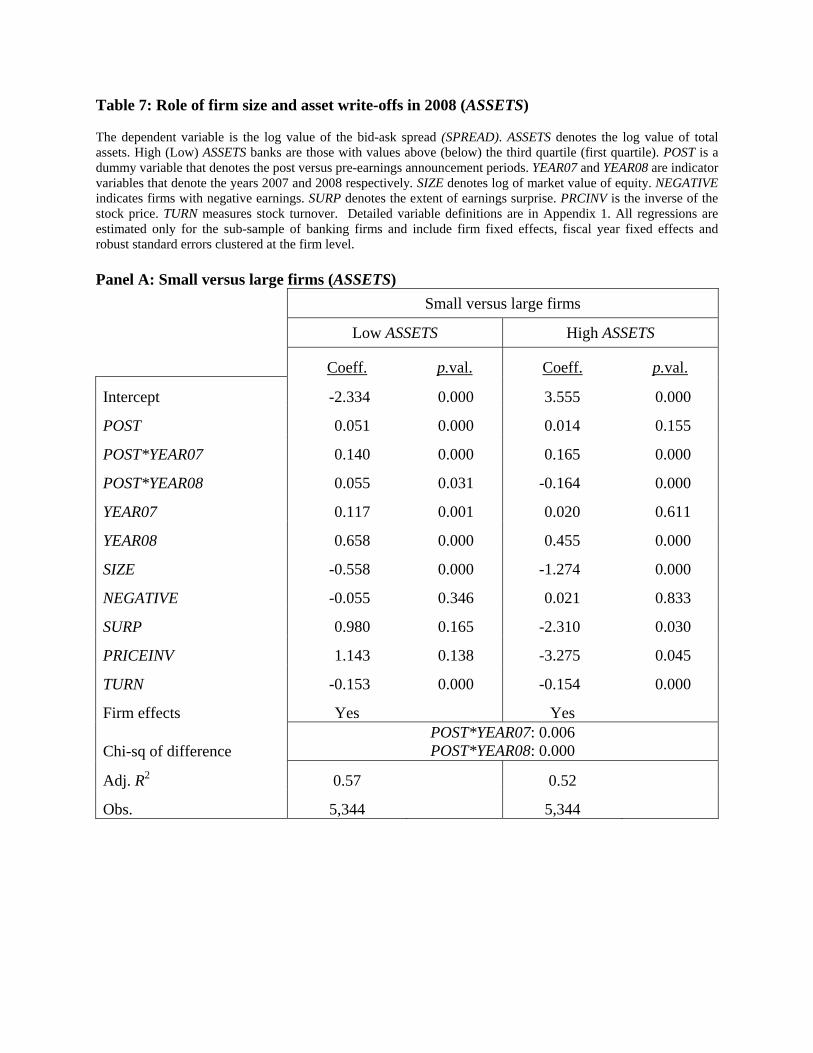
Table 7: Role of firm size and asset write-offs in 2008 (ASSETS) The dependent variable is the log value of the bid-ask spread (SPREAD). ASSETS denotes the log value of total assets. High (Low) ASSETS banks are those with values above (below) the third quartile (first quartile). POST is a dummy variable that denotes the post versus pre-earnings announcement periods. YEAR07 and YEAR08 are indicator variables that denote the years 2007 and 2008 respectively. SIZE denotes log of market value of equity. NEGATIVE indicates firms with negative earnings. SURP denotes the extent of earnings surprise. PRCINV is the inverse of the stock price. TURN measures stock turnover. Detailed variable definitions are in Appendix 1. All regressions are estimated only for the sub-sample of banking firms and include firm fixed effects, fiscal year fixed effects and robust standard errors clustered at the firm level. Panel A: Small versus large firms (ASSETS) Small versus large firms Low ASSETS High ASSETS Coeff. p.val. Coeff. p.val.
Intercept -2.334 0.000 3.555 0.000
POST 0.051 0.000 0.014 0.155
POST*YEAR07 0.140 0.000 0.165 0.000
POST*YEAR08 0.055 0.031 -0.164 0.000
YEAR07 0.117 0.001 0.020 0.611
YEAR08 0.658 0.000 0.455 0.000
SIZE -0.558 0.000 -1.274 0.000
NEGATIVE -0.055 0.346 0.021 0.833
SURP 0.980 0.165 -2.310 0.030
PRICEINV 1.143 0.138 -3.275 0.045
TURN -0.153 0.000 -0.154 0.000
Firm effects Yes Yes
Chi-sq of difference POST*YEAR07: 0.006 POST*YEAR08: 0.000
Adj. R2 0.57 0.52
Obs. 5,344 5,344

Panel B: High versus low loan loss provisions (LLP) LLP denotes loan loss provisions scaled by total assets. High (Low) LLP denotes banks with values below (above) the first (third) quartile. High versus low loan loss provisions Low LLP High LLP Coeff. p.val. Coeff. p.val.
Intercept 1.796 0.717 -0.001 0.999
POST -0.076 0.014 -0.112 0.003
SIZE -1.156 0.153 -0.851 0.000
NEGATIVE 0.365 0.082 -0.158 0.087
SURP -10.066 0.048 0.662 0.192
PRICEINV -4.947 0.564 -3.162 0.068
TURN -0.087 0.047 -0.098 0.093
Firm effects Yes Yes
Chi-sq of difference POST: 0.000
Adj. R2 0.96 0.95
Obs. 430 430
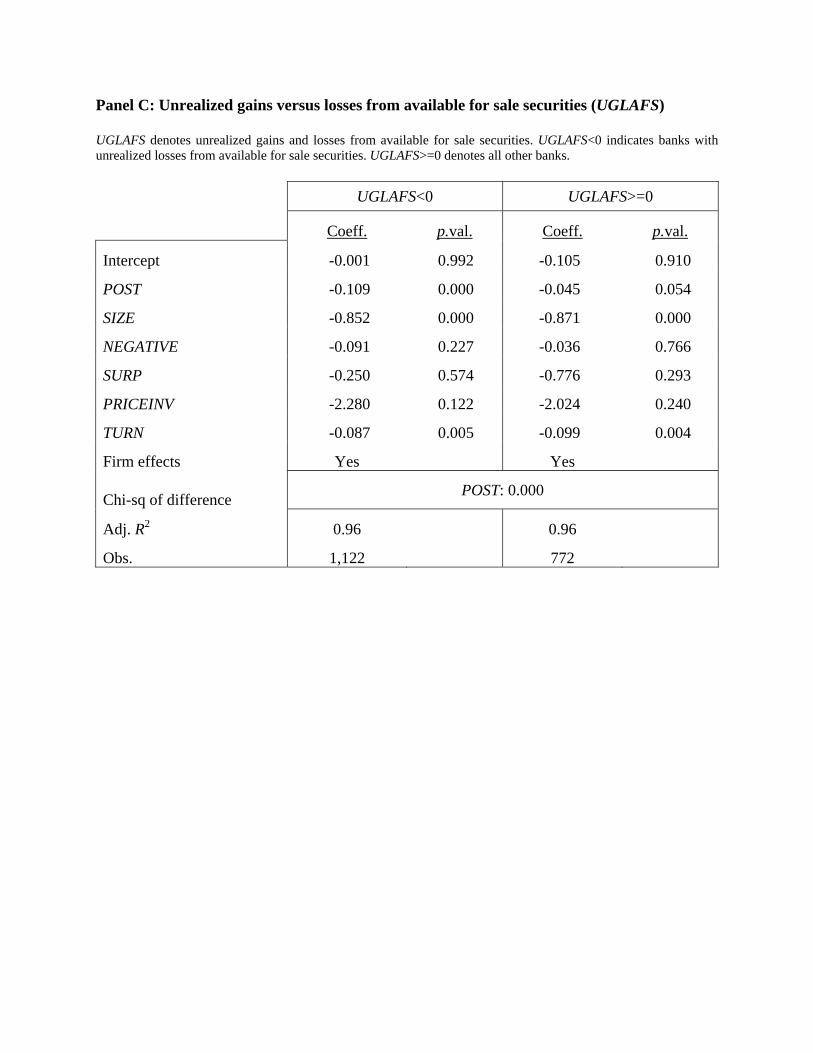
Panel C: Unrealized gains versus losses from available for sale securities (UGLAFS) UGLAFS denotes unrealized gains and losses from available for sale securities. UGLAFS<0 indicates banks with unrealized losses from available for sale securities. UGLAFS>=0 denotes all other banks. UGLAFS<0 UGLAFS>=0 Coeff. p.val. Coeff. p.val.
Intercept -0.001 0.992 -0.105 0.910
POST -0.109 0.000 -0.045 0.054
SIZE -0.852 0.000 -0.871 0.000
NEGATIVE -0.091 0.227 -0.036 0.766
SURP -0.250 0.574 -0.776 0.293
PRICEINV -2.280 0.122 -2.024 0.240
TURN -0.087 0.005 -0.099 0.004
Firm effects Yes Yes
Chi-sq of difference POST: 0.000
Adj. R2 0.96 0.96
Obs. 1,122 772
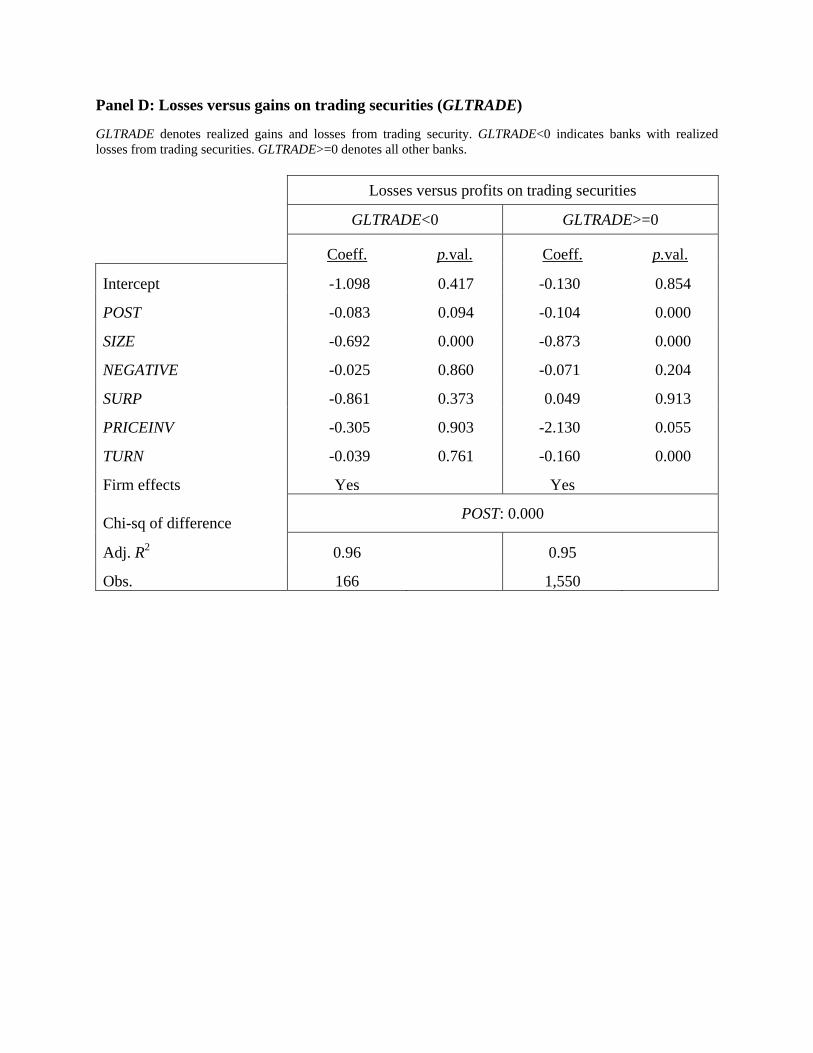
Panel D: Losses versus gains on trading securities (GLTRADE) GLTRADE denotes realized gains and losses from trading security. GLTRADE<0 indicates banks with realized losses from trading securities. GLTRADE>=0 denotes all other banks. Losses versus profits on trading securities GLTRADE<0 GLTRADE>=0 Coeff. p.val. Coeff. p.val.
Intercept -1.098 0.417 -0.130 0.854
POST -0.083 0.094 -0.104 0.000
SIZE -0.692 0.000 -0.873 0.000
NEGATIVE -0.025 0.860 -0.071 0.204
SURP -0.861 0.373 0.049 0.913
PRICEINV -0.305 0.903 -2.130 0.055
TURN -0.039 0.761 -0.160 0.000
Firm effects Yes Yes
Chi-sq of difference POST: 0.000
Adj. R2 0.96 0.95
Obs. 166 1,550

Panel E: Realized gains and losses on AFS securities (LOSSAFS) RGLAFS denotes realized gains and losses from available for sale securities. RGLAFS<0 indicates banks with realized losses from available for sale securities. RGLAFS>=0 denotes all other banks. Losses versus profits on AFS securities RGLAFS<0 RGLAFS>=0 Coeff. p.val. Coeff. p.val.
Intercept -0.366 0.816 -0.798 0.267
POST -0.114 0.001 -0.098 0.000
SIZE -0.816 0.001 -0.763 0.000
NEGATIVE -0.194 0.088 -0.010 0.887
SURP 0.423 0.521 0.139 0.829
PRICEINV -3.119 0.173 -1.062 0.404
TURN -0.135 0.026 -0.145 0.000
Firm effects Yes Yes
Chi-sq of difference POST: 0.000
Adj. R2 0.96 0.95
Obs. 166 1,348
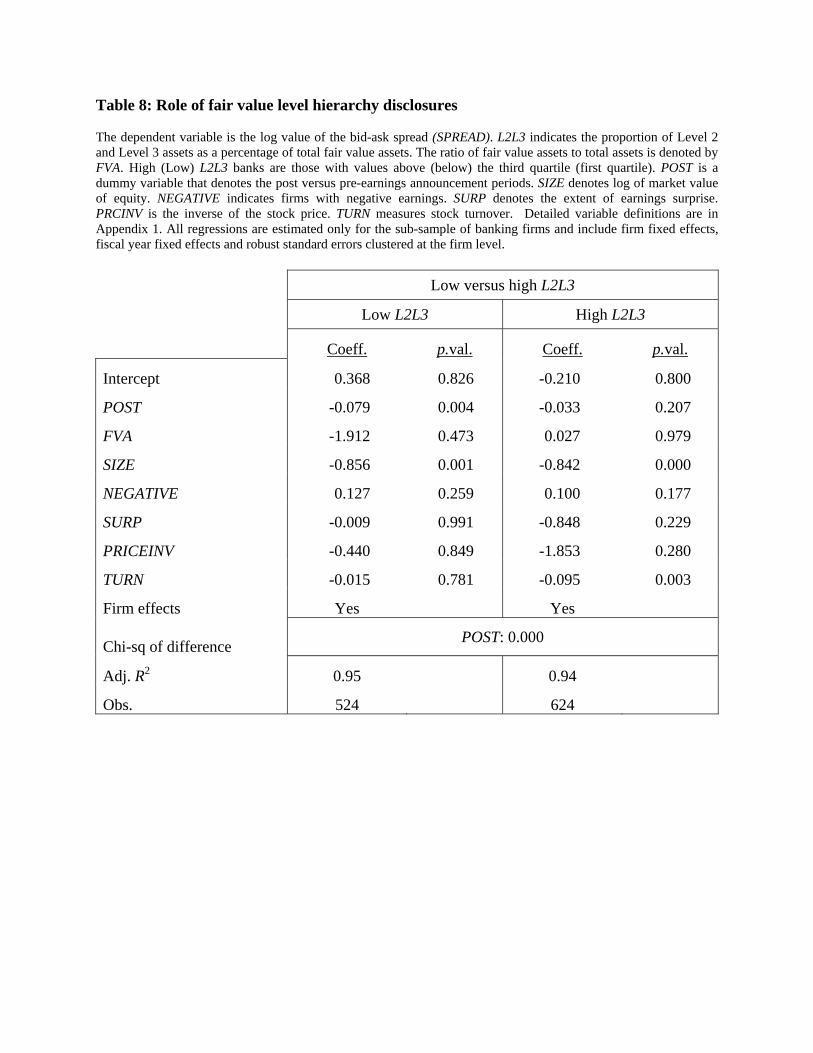
Table 8: Role of fair value level hierarchy disclosures The dependent variable is the log value of the bid-ask spread (SPREAD). L2L3 indicates the proportion of Level 2 and Level 3 assets as a percentage of total fair value assets. The ratio of fair value assets to total assets is denoted by FVA. High (Low) L2L3 banks are those with values above (below) the third quartile (first quartile). POST is a dummy variable that denotes the post versus pre-earnings announcement periods. SIZE denotes log of market value of equity. NEGATIVE indicates firms with negative earnings. SURP denotes the extent of earnings surprise. PRCINV is the inverse of the stock price. TURN measures stock turnover. Detailed variable definitions are in Appendix 1. All regressions are estimated only for the sub-sample of banking firms and include firm fixed effects, fiscal year fixed effects and robust standard errors clustered at the firm level. Low versus high L2L3 Low L2L3 High L2L3 Coeff. p.val. Coeff. p.val.
Intercept 0.368 0.826 -0.210 0.800
POST -0.079 0.004 -0.033 0.207
FVA -1.912 0.473 0.027 0.979
SIZE -0.856 0.001 -0.842 0.000
NEGATIVE 0.127 0.259 0.100 0.177
SURP -0.009 0.991 -0.848 0.229
PRICEINV -0.440 0.849 -1.853 0.280
TURN -0.015 0.781 -0.095 0.003
Firm effects Yes Yes
Chi-sq of difference POST: 0.000
Adj. R2 0.95 0.94
Obs. 524 624

Figure 1: Bid-ask spread in the pre and post earnings announcement period by year SPREAD indicates the log value of the bid-ask spread. The x-axis plots each year in the sample the y-axis plots the mean SPREAD that corresponds to each year.