Embed Size (px)
Citation preview

Policy Research Working Paper 6794
The Impact of Early Childhood Education on Early Achievement Gaps
Evidence from the Indonesia Early Childhood Education and Development (ECED) Project
Haeil JungAmer Hasan
The World BankEast Asia and the Pacific RegionEducation Sector UnitFebruary 2014
WPS6794P
ublic
Dis
clos
ure
Aut
horiz
edP
ublic
Dis
clos
ure
Aut
horiz
edP
ublic
Dis
clos
ure
Aut
horiz
edP
ublic
Dis
clos
ure
Aut
horiz
ed
Produced by the Research Support Team
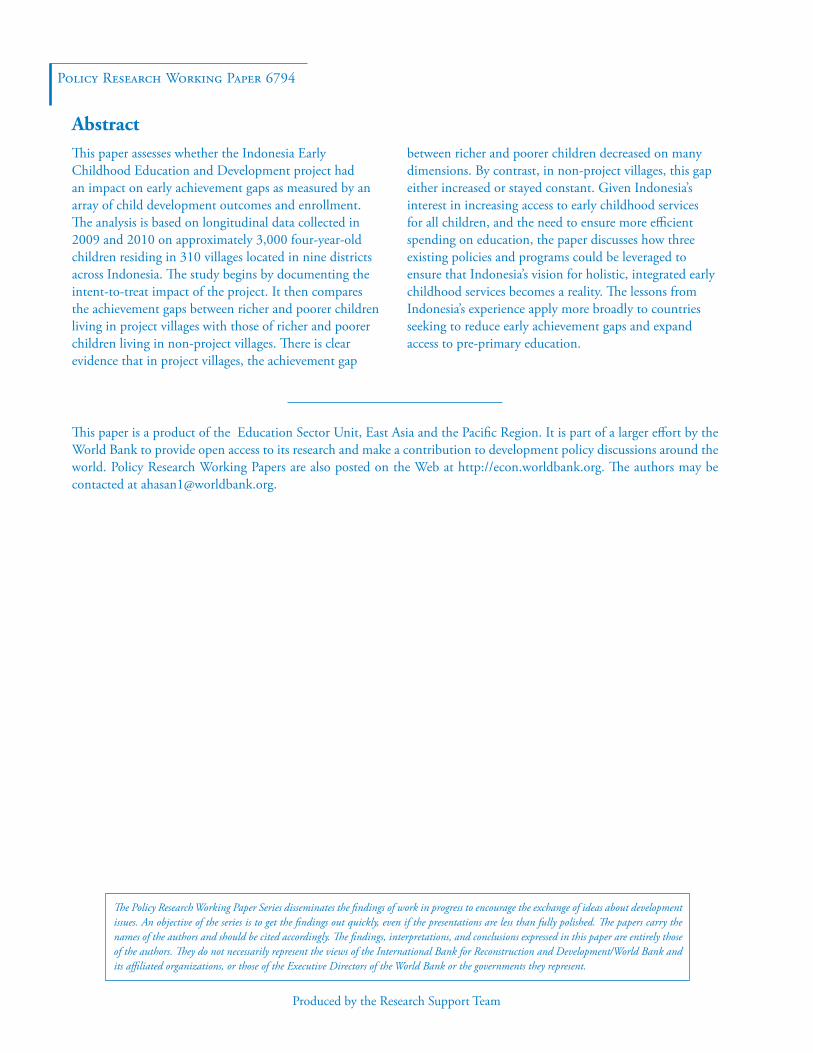
Abstract
The Policy Research Working Paper Series disseminates the findings of work in progress to encourage the exchange of ideas about development issues. An objective of the series is to get the findings out quickly, even if the presentations are less than fully polished. The papers carry the names of the authors and should be cited accordingly. The findings, interpretations, and conclusions expressed in this paper are entirely those of the authors. They do not necessarily represent the views of the International Bank for Reconstruction and Development/World Bank and its affiliated organizations, or those of the Executive Directors of the World Bank or the governments they represent.
Policy Research Working Paper 6794
This paper assesses whether the Indonesia Early Childhood Education and Development project had an impact on early achievement gaps as measured by an array of child development outcomes and enrollment. The analysis is based on longitudinal data collected in 2009 and 2010 on approximately 3,000 four-year-old children residing in 310 villages located in nine districts across Indonesia. The study begins by documenting the intent-to-treat impact of the project. It then compares the achievement gaps between richer and poorer children living in project villages with those of richer and poorer children living in non-project villages. There is clear evidence that in project villages, the achievement gap
This paper is a product of the Education Sector Unit, East Asia and the Pacific Region. It is part of a larger effort by the World Bank to provide open access to its research and make a contribution to development policy discussions around the world. Policy Research Working Papers are also posted on the Web at http://econ.worldbank.org. The authors may be contacted at [email protected].
between richer and poorer children decreased on many dimensions. By contrast, in non-project villages, this gap either increased or stayed constant. Given Indonesia’s interest in increasing access to early childhood services for all children, and the need to ensure more efficient spending on education, the paper discusses how three existing policies and programs could be leveraged to ensure that Indonesia’s vision for holistic, integrated early childhood services becomes a reality. The lessons from Indonesia’s experience apply more broadly to countries seeking to reduce early achievement gaps and expand access to pre-primary education.
The Impact of Early Childhood Education on Early Achievement Gaps: Evidence from the
Indonesia Early Childhood Education and Development (ECED) Project∗
Haeil Jung
Indiana University Bloomington
Amer Hasan
World Bank
World Bank Sector Board: EDU
JEL Classifications: I21; I25; I28
∗ This paper builds on joint work with Sally Brinkman, Marilou Hyson, Angela Kinnell, and Menno Pradhan presented in Hasan, Hyson and Chang, (eds.), 2013. The registration number of the trial on which this paper is based is ISRCTN76061874. Preparation of this document received partial funding from the Government of the Kingdom of the Netherlands through the Dutch Basic Education Support Program. We would like to thank Luis Benveniste, Marilou Hyson, Menno Pradhan, Samer Al-Samarrai and Heather Tomlinson for detailed feedback on an earlier version of this paper. All errors are our own. The findings, interpretations, and conclusions expressed in this paper are entirely those of the authors. They do not necessarily represent the views of the International Bank for Reconstruction and Development/World Bank and its affiliated organizations, or those of the Executive Directors of the World Bank or the governments they represent.
2
Introduction
In 2002, Indonesia made a clear commitment to education – passing a constitutional
mandate to allocate at least 20 percent of the total government budget to education. This has led
to a large increase in resources, more than doubling education spending in real terms. Despite
such substantial financial commitments to education as a whole, a number of challenges persist.
In particular, ensuring equitable access to early childhood education and development (ECED)
services has historically been a challenge in Indonesia.
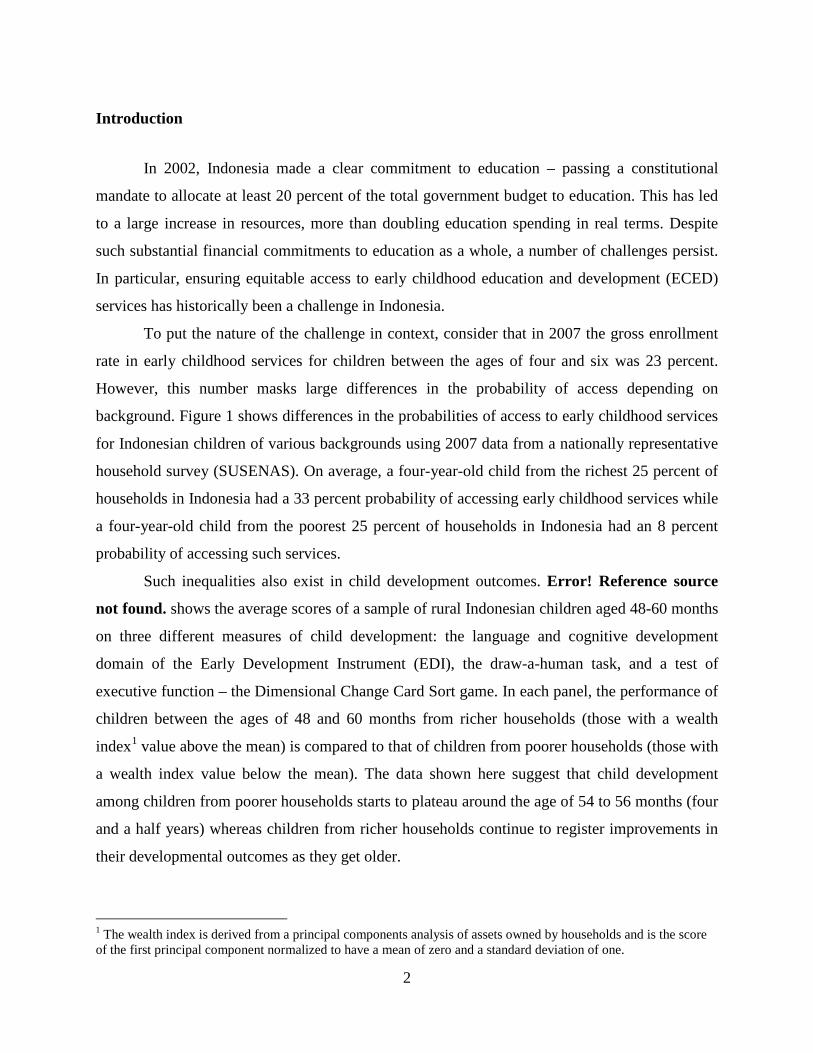
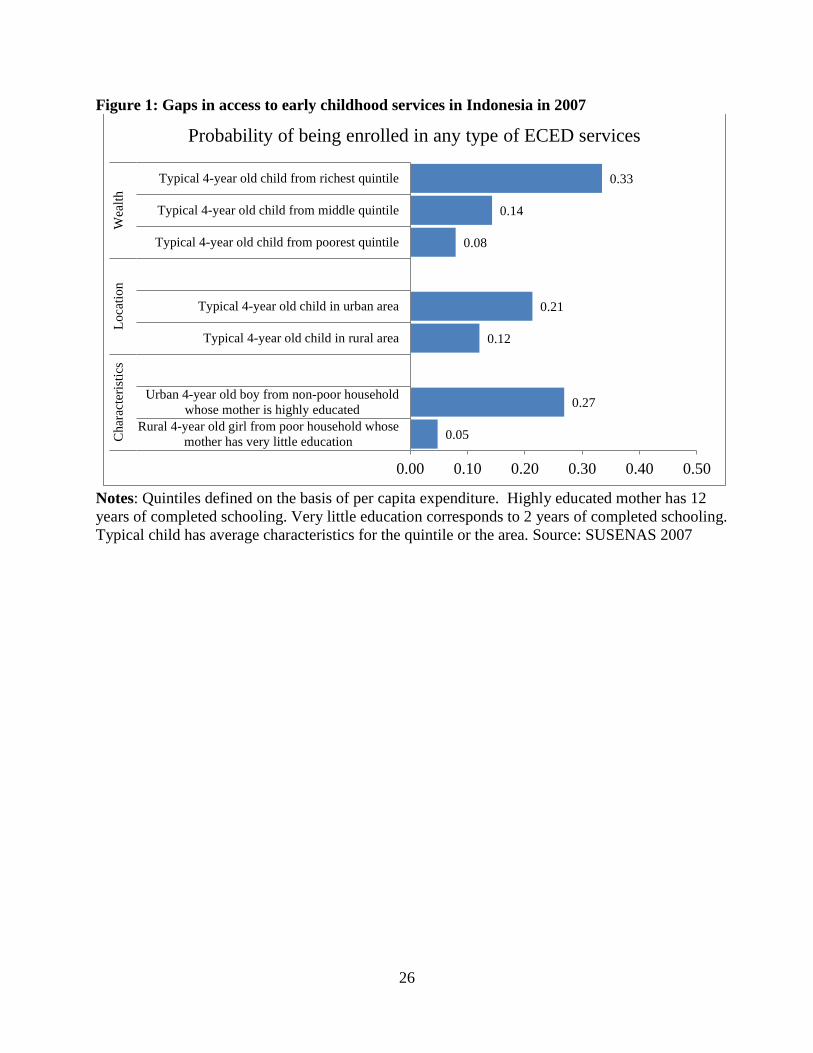
To put the nature of the challenge in context, consider that in 2007 the gross enrollment
rate in early childhood services for children between the ages of four and six was 23 percent.
However, this number masks large differences in the probability of access depending on
background. Figure 1 shows differences in the probabilities of access to early childhood services
for Indonesian children of various backgrounds using 2007 data from a nationally representative
household survey (SUSENAS). On average, a four-year-old child from the richest 25 percent of
households in Indonesia had a 33 percent probability of accessing early childhood services while
a four-year-old child from the poorest 25 percent of households in Indonesia had an 8 percent
probability of accessing such services.
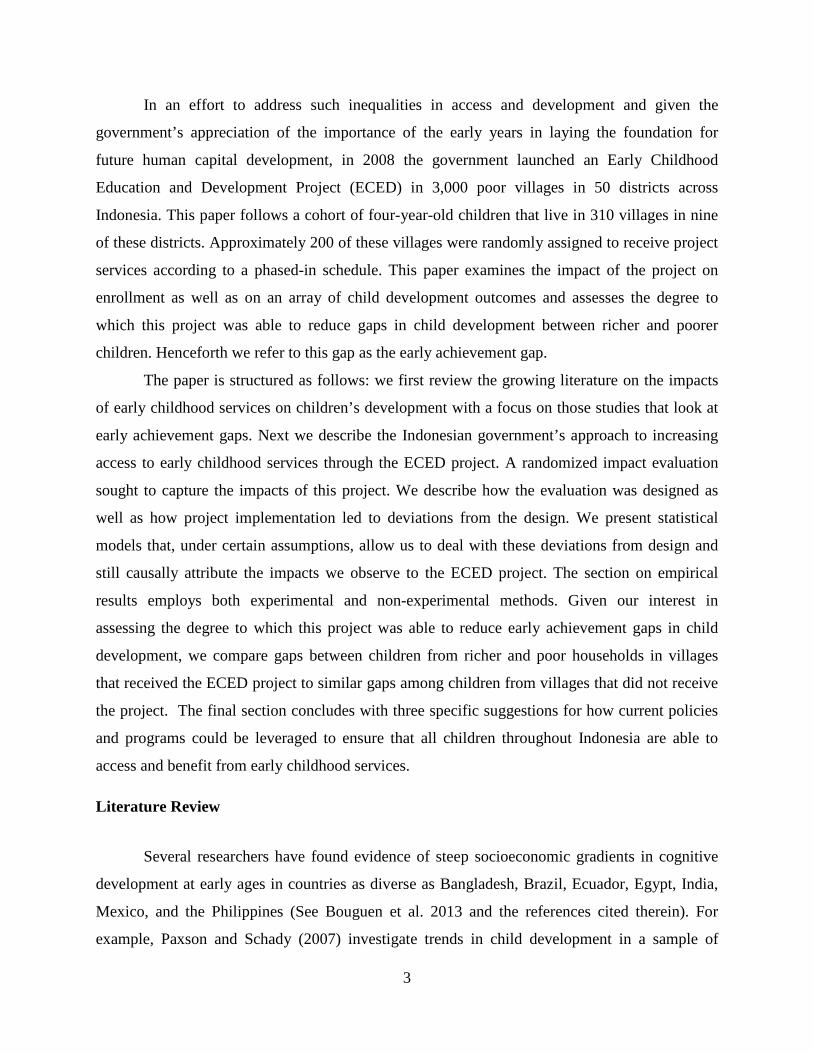
Such inequalities also exist in child development outcomes. Error! Reference source
not found. shows the average scores of a sample of rural Indonesian children aged 48-60 months
on three different measures of child development: the language and cognitive development
domain of the Early Development Instrument (EDI), the draw-a-human task, and a test of
executive function – the Dimensional Change Card Sort game. In each panel, the performance of
children between the ages of 48 and 60 months from richer households (those with a wealth
index1 value above the mean) is compared to that of children from poorer households (those with
a wealth index value below the mean). The data shown here suggest that child development
among children from poorer households starts to plateau around the age of 54 to 56 months (four
and a half years) whereas children from richer households continue to register improvements in
their developmental outcomes as they get older.
1 The wealth index is derived from a principal components analysis of assets owned by households and is the score of the first principal component normalized to have a mean of zero and a standard deviation of one.
3
In an effort to address such inequalities in access and development and given the
government’s appreciation of the importance of the early years in laying the foundation for
future human capital development, in 2008 the government launched an Early Childhood
Education and Development Project (ECED) in 3,000 poor villages in 50 districts across
Indonesia. This paper follows a cohort of four-year-old children that live in 310 villages in nine
of these districts. Approximately 200 of these villages were randomly assigned to receive project
services according to a phased-in schedule. This paper examines the impact of the project on
enrollment as well as on an array of child development outcomes and assesses the degree to
which this project was able to reduce gaps in child development between richer and poorer
children. Henceforth we refer to this gap as the early achievement gap.
The paper is structured as follows: we first review the growing literature on the impacts
of early childhood services on children’s development with a focus on those studies that look at
early achievement gaps. Next we describe the Indonesian government’s approach to increasing
access to early childhood services through the ECED project. A randomized impact evaluation
sought to capture the impacts of this project. We describe how the evaluation was designed as
well as how project implementation led to deviations from the design. We present statistical
models that, under certain assumptions, allow us to deal with these deviations from design and
still causally attribute the impacts we observe to the ECED project. The section on empirical
results employs both experimental and non-experimental methods. Given our interest in
assessing the degree to which this project was able to reduce early achievement gaps in child
development, we compare gaps between children from richer and poor households in villages
that received the ECED project to similar gaps among children from villages that did not receive
the project. The final section concludes with three specific suggestions for how current policies
and programs could be leveraged to ensure that all children throughout Indonesia are able to
access and benefit from early childhood services.
Literature Review
Several researchers have found evidence of steep socioeconomic gradients in cognitive
development at early ages in countries as diverse as Bangladesh, Brazil, Ecuador, Egypt, India,
Mexico, and the Philippines (See Bouguen et al. 2013 and the references cited therein). For
example, Paxson and Schady (2007) investigate trends in child development in a sample of
4
disadvantaged Ecuadorian children using the Peabody Picture Vocabulary Test to show that
while the differences in age-adjusted scores of three-year-old children are generally small, by age
six children in the poorest 25 percent of households have fallen far behind children in the richest
25 percent of households. Berlinski, Galiani, and Manacorda (2008) also note that the impact of
preschool attendance was largest for those children from households with less education.
Most of the studies we reviewed have documented the impact of an early intervention on
child development but few assessed the degree to which such interventions had differing impacts
on children from different socio-economic backgrounds. Burger (2010) is an exception in this
regard but even his focus is largely on examples from the US, Canada and Europe.2 He analyzes
the impacts of early interventions on cognitive development – one of several indicators of
successful child development – and attempts to categorize programs by whether or not they had
differential effects on children from different backgrounds.
While Cunha and Heckman (2007) and Heckman and Masterov (2007) have underscored
the fact that early interventions not only promote economic efficiency but reduce lifetime
inequality, few papers have systematically documented whether early childhood interventions in
developing country settings are able to reduce early achievement gaps.
In this paper, we assess whether a large community-driven program in a middle-income
country which aimed to increase access to early childhood education and development services
in rural areas was effective in reducing early achievement gaps. In doing so, this paper
contributes to the rapidly growing literature that has documented the benefits of intervening early
in life to improve health and education outcomes and attempts to add to the literature on
inequality in early childhood.
Evidence from around the world has shown that the programs most successful at
improving outcomes share several common features which include beginning at birth, involving
families, and targeting the poorest children (Naudeau et. al., 2011a; Naudeau et al., 2001b).
Intensive interventions which are long-lasting and holistic in that they include health, nutrition,
and parenting services in addition to education have been shown to have the largest and most
long-lasting impacts.
In the U.S. this evidence draws on the experiences of programs such as Perry Preschool
(a half-day preschool program which children attended for two years), the Abecedarian project (a
2 The Vietnam case in his study did not allow for sub-group comparisons.
5
full-day, year-round, center-based care from infancy until kindergarten entry) and Head Start.
Each of these programs targets poor families and varies in their modes of delivery and intensity.
The programs generally show positive effects, but not for all outcomes at all stages. For instance,
Currie and Thomas (2000) found that children who participated in Head Start did better in school
than their siblings who did not – a finding replicated in Deming (2009) as well as Carneiro and
Ginha (2009). However, for longer term outcomes such as employment the evidence is more
mixed.3
In developing countries, a variety of center-based early childhood education and
development services have been introduced in a multitude of contexts. Evaluations have found
mixed evidence on the benefits of these services. For example, an evaluation from Rio Grande
do Sul in Brazil (Young, 2012) compared children before and after entry into the program and
showed significant cognitive, social, and motor development. Likewise, a comparison between
children in the same communities who participated in the program with those that did not
showed strong gains in all of these dimensions (Primeira Infância Melhor, 2011). In
Mozambique, Martinez, Naudeau and Pereira (2011) found improvements in primary school
enrollment rates, hours per week spent on homework as well as in a number of child
development outcomes as a result of preschool attendance over a two-year period. In contrast, a
study on the impacts of alternative types of ECD provision in Cambodia (Bouguen et al., 2013)
found little difference in development outcomes when comparing outcomes over a three-year
period. More comprehensive reviews of evidence from low-income (Engle et al., 2007) and
middle-income (Vegas and Santibáñez 2010) settings exist and underscore the variety of results
reported here.
The Indonesia Early Childhood Education and Development (ECED) Project
Background
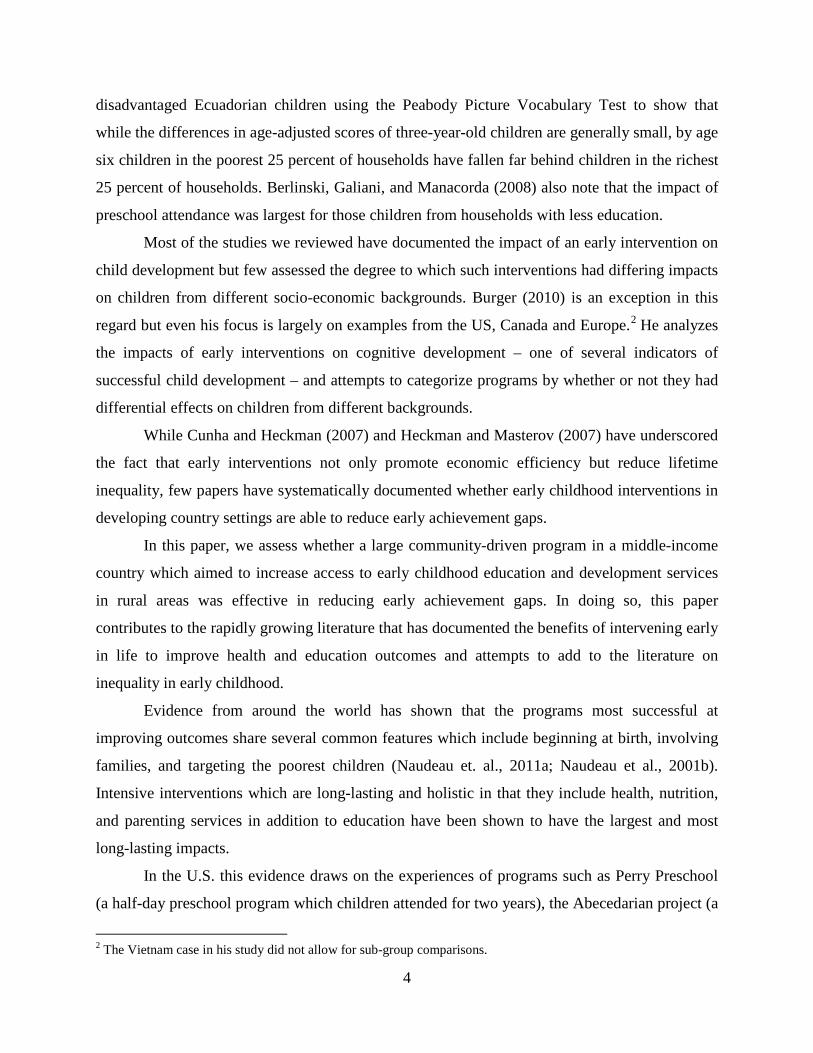
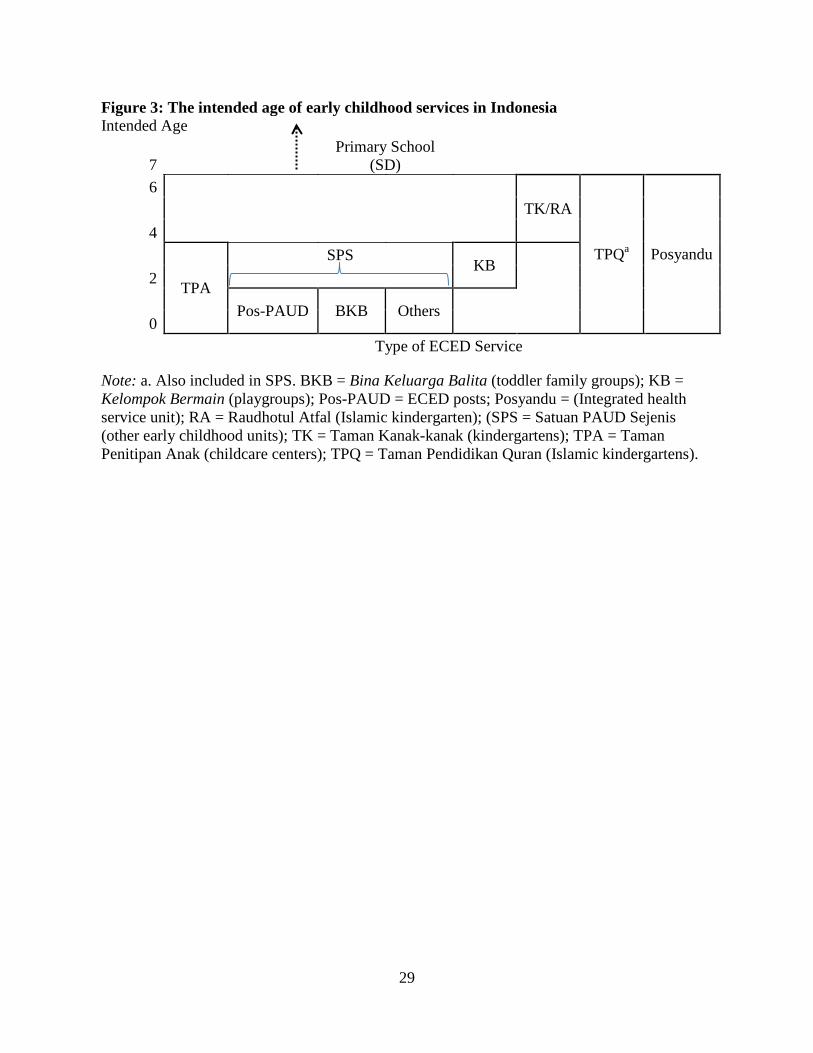
ECED services in Indonesia are intended to cater to children from birth to age six. As
such, they take up a variety of forms and are overseen by various ministries (Table 1).
Kindergartens are regulated either by the Ministry of Education and Culture (MoEC) or by the
Ministry of Religious Affairs (MoRA) depending on whether they are regular (TK) or Islamic
3 See the summary of various papers presented in Table 4.1 of Alderman, 2011.

6
kindergartens (RA). MoEC regulates Playgroups (KB) while Toddler Family Groups (BKB) are
overseen by the National Family Planning Board. Day care centers (TPA) are also overseen by
MoEC and are largely urban phenomena. Children up to the age of five generally go to an
integrated health service unit called a Posyandu, some of which provide a preschool program
(Pos-PAUD). Once children have reached the age of seven, they are expected to begin primary
school.
Historically, there has been a distinction drawn between formal and non-formal early
childhood services. Since 2010, this distinction has been done away with at MoEC (at least on
paper). Now all early childhood services are under the purview of one Directorate General at the
Ministry of Education and Culture. In practice, however, the distinction between formal and non-
formal services continues with different types of services and teachers eligible for different
forms and levels of support from the government.
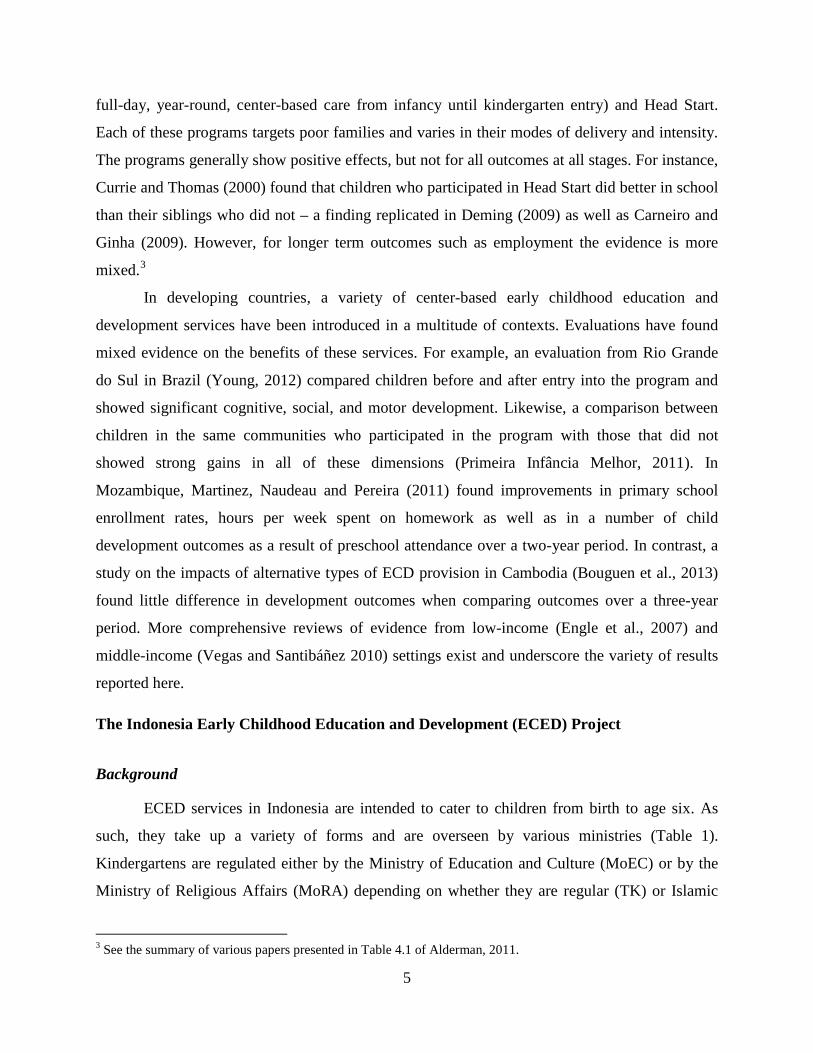
Each type of early childhood service is intended to cater to children of a specific age
(Error! Reference source not found.). In practice, these age cut-offs are hard to enforce. Some
children may continue in playgroups past the intended age of 4 and others may enroll in primary
school at the age of six or even five. The incentive to do so is strong since attending kindergarten
is not mandatory and most kindergartens charge fees while primary school is compulsory and
free.
While there are a variety of early childhood services in Indonesia, the provision of these
services has historically been characterized by: 1) low levels of coverage overall and especially
for children from birth to age three; 2) largely private provision of services in the face of low
levels of public investment; and 3) volunteer teachers with little or no training since very few
institutions provided training for early childhood teachers.
The Scope of the Project: Selecting the Districts
In an effort to address some of these challenges, the government of Indonesia in
partnership with the World Bank and the Dutch government developed the ECED project. The
goals of the project were to increase access to early childhood services and increase children’s
readiness for school in relatively poor districts with generally low ECED participation. Under
this project, districts were selected on the basis of a composite score based on poverty rates,
gross enrollment rates, Human Development Index (HDI) rankings, geographical remoteness,
7
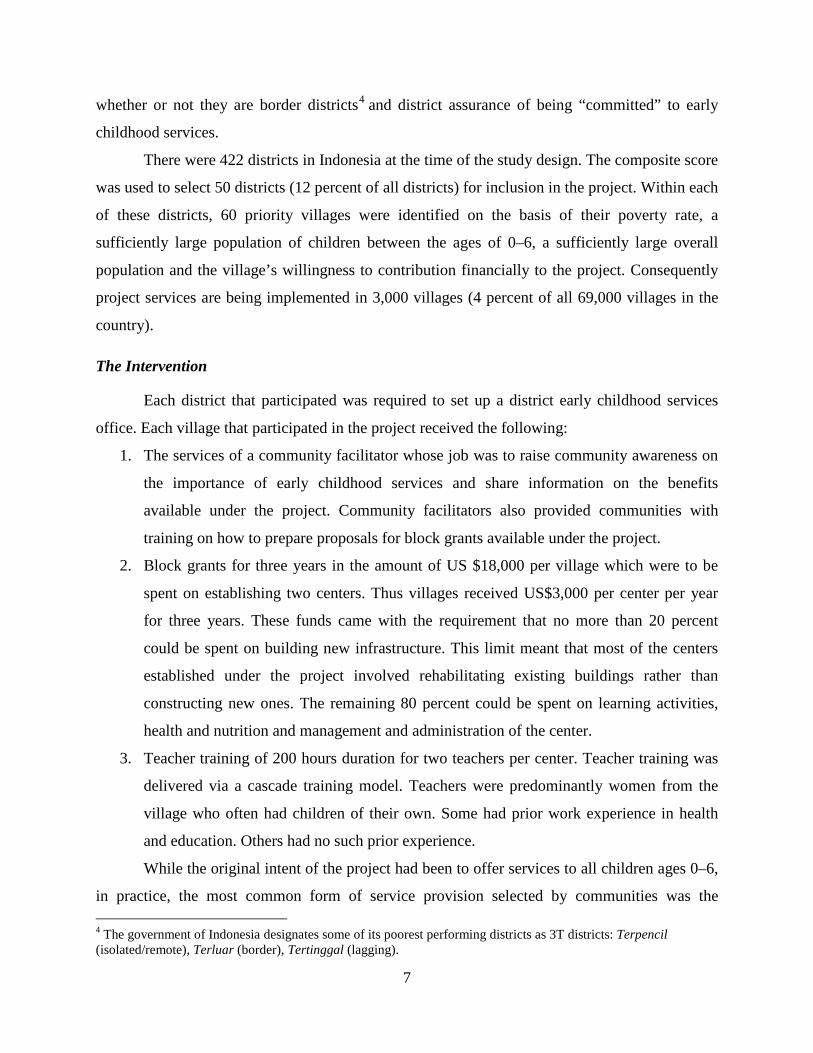
whether or not they are border districts4 and district assurance of being “committed” to early
childhood services.
There were 422 districts in Indonesia at the time of the study design. The composite score
was used to select 50 districts (12 percent of all districts) for inclusion in the project. Within each
of these districts, 60 priority villages were identified on the basis of their poverty rate, a
sufficiently large population of children between the ages of 0–6, a sufficiently large overall
population and the village’s willingness to contribution financially to the project. Consequently
project services are being implemented in 3,000 villages (4 percent of all 69,000 villages in the
country).
The Intervention
Each district that participated was required to set up a district early childhood services
office. Each village that participated in the project received the following:
1. The services of a community facilitator whose job was to raise community awareness on
the importance of early childhood services and share information on the benefits
available under the project. Community facilitators also provided communities with
training on how to prepare proposals for block grants available under the project.
2. Block grants for three years in the amount of US $18,000 per village which were to be
spent on establishing two centers. Thus villages received US$3,000 per center per year
for three years. These funds came with the requirement that no more than 20 percent
could be spent on building new infrastructure. This limit meant that most of the centers
established under the project involved rehabilitating existing buildings rather than
constructing new ones. The remaining 80 percent could be spent on learning activities,
health and nutrition and management and administration of the center.
3. Teacher training of 200 hours duration for two teachers per center. Teacher training was
delivered via a cascade training model. Teachers were predominantly women from the
village who often had children of their own. Some had prior work experience in health
and education. Others had no such prior experience.
While the original intent of the project had been to offer services to all children ages 0–6,
in practice, the most common form of service provision selected by communities was the 4 The government of Indonesia designates some of its poorest performing districts as 3T districts: Terpencil (isolated/remote), Terluar (border), Tertinggal (lagging).

8
establishment of a playgroup for four to six-year-olds, typically offered two hours a day, three
times a week. This package (community facilitation, block grants, teacher training and
playgroups) is effectively the intervention evaluated in this paper.
The Evaluation Design
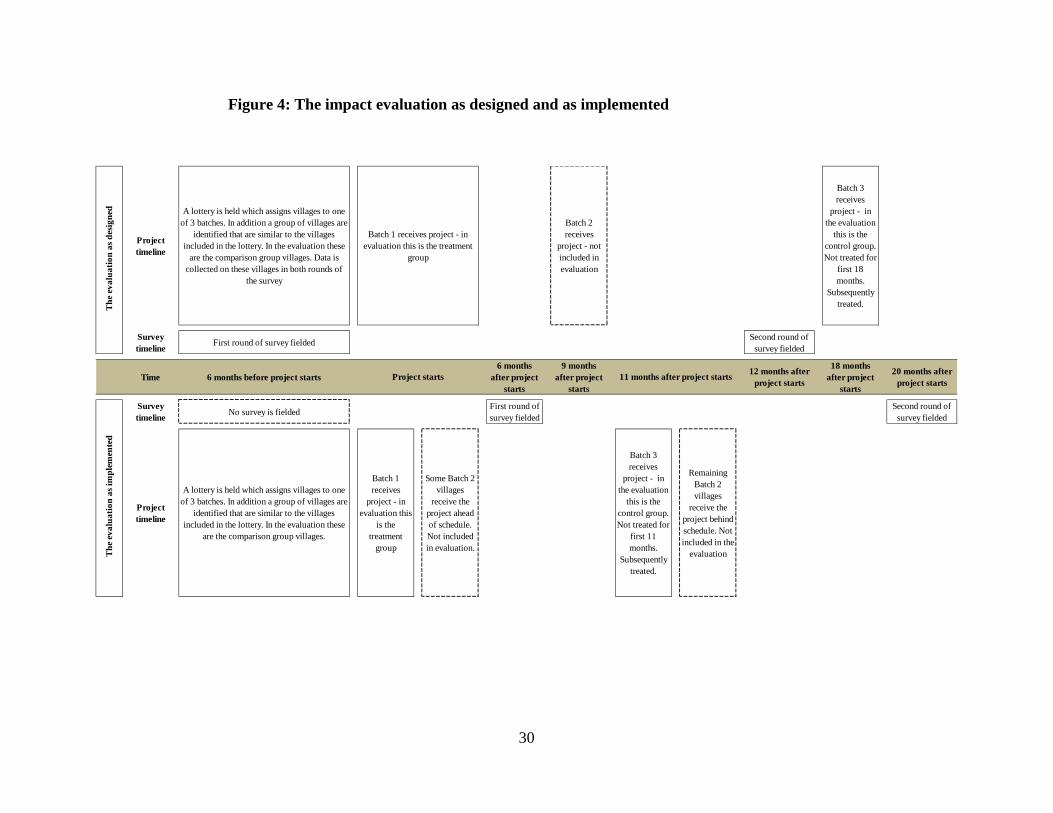
Given the scope of the project, the government originally decided to roll out
implementation in three batches roughly nine months apart. Thus during the design of the
evaluation the decision was made to randomly assign villages to planned phases of the project.
Analysts worked with the government to hold a public lottery and assign some villages randomly
to the first batch - batch 1 (100 villages) and some villages to the last batch - batch 3 (120
villages). Villages in the second batch (batch 2) were not included in the evaluation since it was
felt that nine months was too little time to gauge the impact of such an intervention. Thus
according to this design some villages were randomly assigned to control group status but only
for 18 months. At the end of this period, batch 3 villages also received the intervention. Given
that after this period, there would be no villages without the intervention, analysts also collected
information on a group of villages that would never receive the project (90 villages). These
villages were not randomly selected. Instead they were identified by government officials as
being similar to the villages that had been randomly assigned to batches 1 and 3. Together these
three groups of villages (batch 1, batch 3 and villages that never received the project) constitute
the source of the data used in the impact evaluation.
The Evaluation in Practice
Due to issues with timing of budget disbursements, in reality the design above was not
adhered to. In reality the government rolled out the program in two phases. The first roll-out
comprised what was originally referred to as batch 1 and roughly half of batch 2. The second
roll-out comprised the remaining half of batch 2 and batch 3. Given that project implementation
deviated from its original design, for the purposes of this evaluation, we use actual date of funds
disbursal to confirm when villages actually received the project. As a result, we end up with 105
villages in batch 1 and 112 villages in batch 3. The remaining 93 villages never received the
project. Thus the evaluation in practice only has small deviations from the evaluation in design.5
5 See tests of balance between original and actual batches as reported in Hasan, Hyson and Chang (eds.), 2013.

9
Error! Reference source not found. depicts the evaluation as it was designed and as it was
implemented.
The Data: The Surveys, the Measures Collected, and the Children
The Timing of Survey Data Collection
The analysis in this paper is based on two rounds of data – a baseline survey which was
conducted from March to June 2009 and a follow-up survey which was conducted approximately
14 months later from July to August 2010. There were discrepancies between the timing of the
surveys and project implementation – these are depicted in Figure 4. As a result, villages in batch
1 had already implemented the ECED project for about 6 months by the time the baseline survey
was fielded. Likewise, villages in batch 3 (which had not received the ECED project at baseline)
started implementation about nine months before the follow-up survey was fielded. Villages
without the project had no services provided through the project either at baseline or at follow-up.
In each village, data were collected on households, caregivers and the development of two
cohorts of children.
The Measures
Child development was assessed using an extensive array of internationally-validated and
locally-adapted6 child development measures including:
1. The short version of the Early Development Instrument (EDI)
2. The Strengths and Difficulties Questionnaire (SDQ)
3. Height and weight measurements
4. Demonstrations of child skills (and mother reports of these skills), drawing on a study
conducted by the University of San Carlos Office of Population Studies
5. Tests of executive function using the Dimensional Change Card Sorting (DCCS) game
6. Drawing tasks (based on the Draw-a-Man test)
7. Expressive and receptive language tasks
Several of the measures above assess multiple domains of child development. A higher score is
better for all measures except for the Strengths and Difficulties Questionnaire (SDQ) where
lower scores are better and represent fewer difficulties.7 6 For details on how instruments were adapted and tested, see Pradhan et. al. (2013).
10
The Children
The original raw data contain information on two cohorts of children in these 310 villages:
children who were one year old and those who were four years old in 2009 (when baseline data
were collected). These children were followed and re-observed in 2010 when they were two and
five years old, respectively. Given the project’s focus on children between birth and the age of
six, analysts considered that following these children would allow us to understand the trajectory
of child development in the age range of interest: 0–6.
This paper focuses on whether the package of interventions (community facilitation,
block grants, teacher training and playgroups) introduced by the government had any impact on
children’s development and whether it helped reduce early achievement gaps between children
from richer and poorer households. Consequently, we exclude from our analysis the one-year-old
children as they were too young to have attended the playgroups. Thus, we form our analysis
sample consisting of children who were four years old in 2009 (baseline year) and likely to have
attended playgroups. In the sample of four-year-old children in the baseline survey, we have
1,109 children in batch 1 villages, 1,184 children in batch 3 villages, and 940 children in villages
that never received the project. 49.7 percent of these children are girls and have an average age
of 53 months when they are first observed. Their caregivers are on average 32 years of age and
on average report being the primary caregiver for four children.
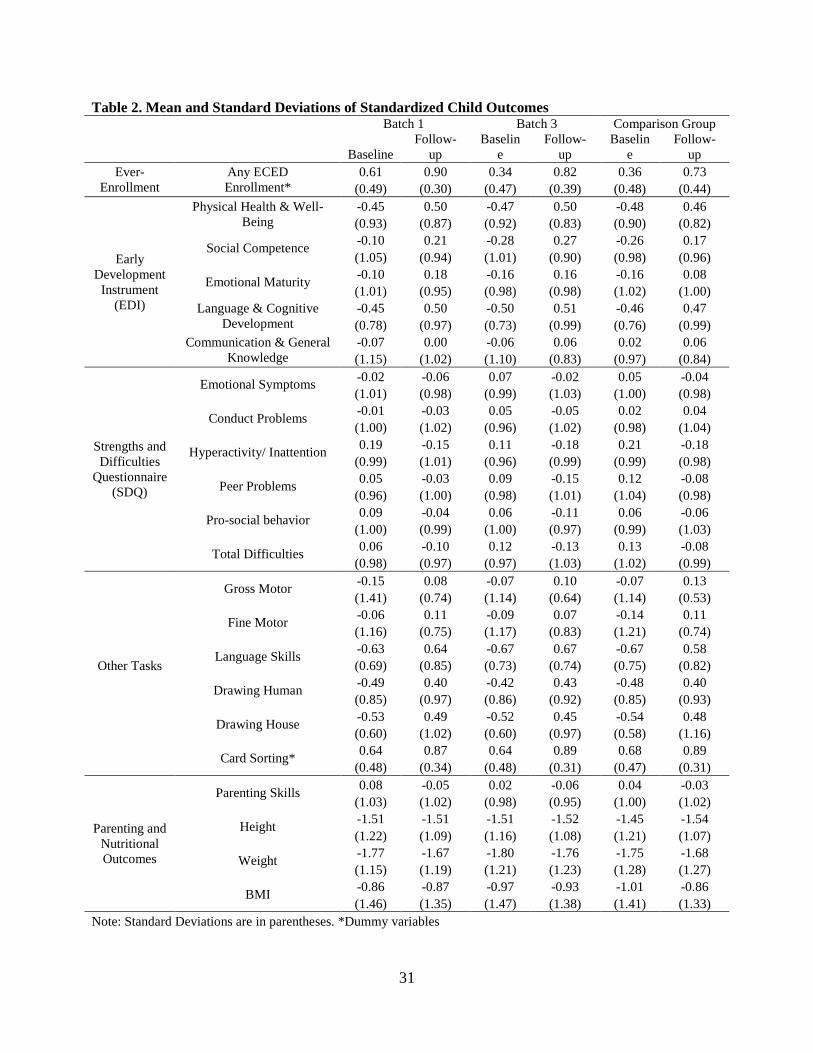
Table 2 shows the descriptive statistics for enrollment and child development outcomes.
We organize table into columns showing the means and standard deviations for each group of
villages: batch 1, batch 3 and villages without the project (henceforth the comparison group) and
by baseline and follow-up for each group to examine their similarities and differences. Our
ECED enrollment variable is set to 1 if children had enrolled in any ECED service at baseline or
follow-up. Otherwise, it is set to 0. We standardize most child development outcomes with mean
0 and standard deviation 1 among all children across baseline and follow-up. This allows us to
interpret the progress in different child outcomes as a result of the ECED project in the same
metric. The only exception is the test of executive function which required children to play a
three-stage Dimensional Change Card Sorting game. This card sorting game is scored as 1 if the
7 This is true of all SDQ domains. Typically one domain is reverse-scored but in this paper, we have aligned all SDQ domains in the same direction for ease of interpretation. Appendix Table 1 provides details on each of these measures of development.
11
children pass at least one stage and 0 otherwise. Thus ECED enrollment and the test of executive
function are measured in percentage points while all other outcomes are measured in standard
deviation units. The visible patterns are as follows.
First, at baseline most of the outcomes for children in batch 1 villages are better than
those for children in batch 3 villages and for children in villages without the project. This is to be
expected because batch 1 villages had been receiving the ECED project services for about 6
months at baseline. Baseline ECED enrollment for batch 1 children is 61% - much higher than
for batch 3 children (34%) and children in villages without the project (36%).
Second, at baseline most outcomes for children in batch 3 villages are similar to those for
children in villages without the project. As we discussed earlier, a group of villages was
identified by government officials to make a comparison group for batches 1 and 3. Because of
the early implementation of the program in batch 1, we cannot compare batch 1 villages with this
comparison group of villages. However, we can check whether batch 3 villages are comparable
to these villages without the project in terms of enrollment and child outcomes. We find that they
are very similar to each other at baseline. None of the outcomes are statistically different
between two groups. The ECED enrollment at baseline is 34% and 36% for batch 3 villages and
those without the project, respectively and other child outcomes are also very similar. The close
comparability of these two groups of villages is highly encouraging for us to use a difference-in-
differences (DiD) approach to examine the impact of the ECED project on enrollment and child
outcomes.
Third, for children in all batches most outcomes show improvements during the time that
elapsed between baseline and follow-up. In other words, children grew up and measures of their
development improved even in the absence of the project. ECED enrollment also increases over
time, even for villages that did not receive the ECED project. This reminds us that we need to
control for improvements in outcomes driven only by aging. Therefore, we have a time dummy
in the DiD model to control for the effect of age. Our DiD estimators yield the exclusive impact
of the ECED project after accounting for the effect of age on child development.
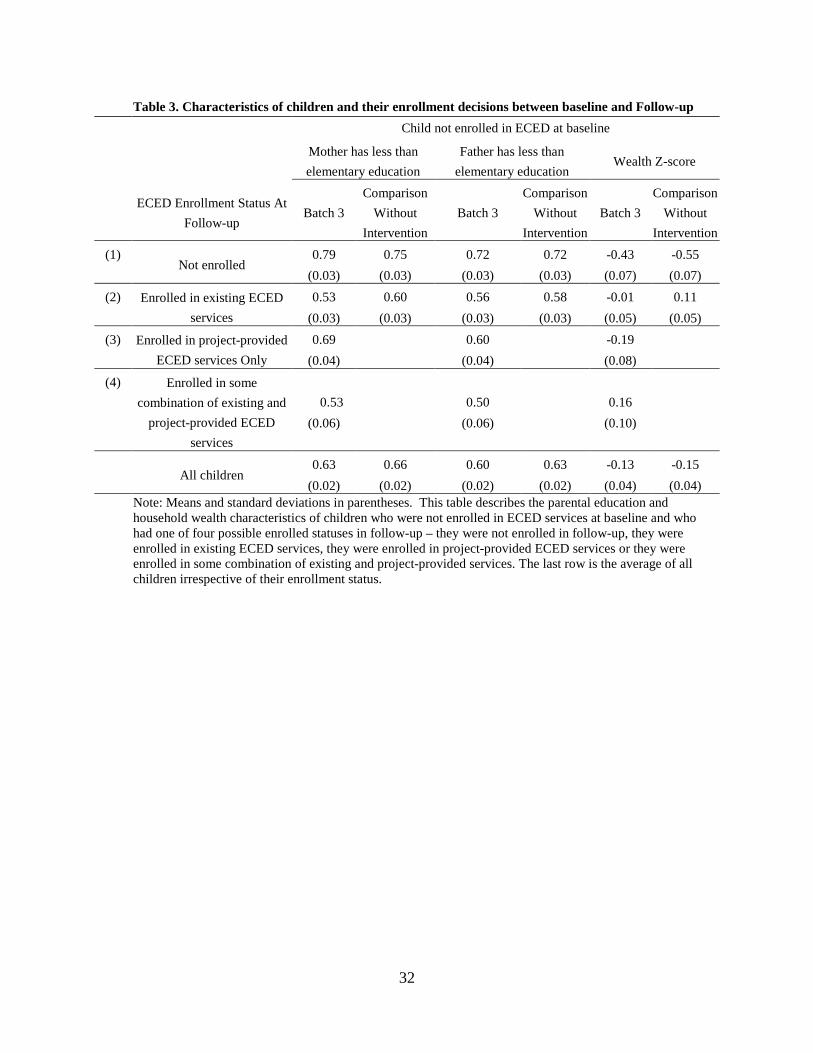
In Table 3, we compare key characteristics of children who were not enrolled in ECED
services at baseline depending on whether they live in project villages or non-project villages and
examine their families’ enrollment decisions at the time of the follow-up. We note that at
baseline, children who did not enroll in ECED services have very similar levels of low parental
12
education and household wealth irrespective of which village they live in (last row). Two-thirds
of these children have mothers and fathers with less than an elementary education and their
household wealth is below average. Next, we examine the enrollment status of these children at
follow-up. In non-project villages, parents only have two choices – continue to keep their
children un-enrolled or enroll them in an existing ECED service. In project villages there are
three choices– continue to keep children un-enrolled, enroll them in an existing ECED service or
enroll them in a project-provided ECED service. Looking at the average characteristics of
children who were not enrolled in baseline (last row), those who were never enrolled in either
baseline or follow-up (row 1) and those that chose to enroll at follow-up in a project-provided
ECD service (row 3) suggests that those who attended project services are poorer (their wealth z-
score is -0.19) than the average child who was not attending at baseline (their wealth z-score is -
0.13), but not as poor as the child who never enrolls (their wealth z-score is -0.43). Similarly,
children who decide to enroll in existing ECED services in non-project villages are much better
off (their wealth z-score is 0.11). Taken together, the evidence in Table 3 seems to suggest that
project-provided services do a better job of reaching the moderate poor than non-project
provided services. However, there is little indication that the extreme poor are being adequately
reached.
Statistical Model
We use two main analyses in evaluating the impact of the ECED project on child
outcomes. First, using batch 3 children as the treatment group and children in non-project
villages as the comparison group, we estimate the impact of the ECED project using the
Difference-in-Differences (DiD) method. The basic idea of the DiD method is to follow two
groups that are similar at baseline and to estimate the difference in outcomes at follow-up after
an intervention on one group and no intervention on the other. We take advantage of the fact that
batch 3 children had no intervention at baseline, but had nine months of intervention at follow-up,
while villages without the project had no intervention either at baseline or at follow-up.
The regression model is as follows.
(1) 𝑦𝑖𝑡 = 𝛽0 + 𝐷𝑖𝛿1+𝑇𝑡𝛿2 + 𝐷𝑖𝑇𝑡𝛿3 + 𝑥𝑖𝛽 + 𝑢𝑖𝑡.
𝑦𝑖𝑡 is enrollment (1 if ever-enrolled and 0 if never-enrolled) or child development outcomes at
baseline (t=1) and follow-up (t=2) for a child i. 𝐷𝑖 is the dummy variable indicating 1 for batch 3
13
and 0 for the comparison group while 𝑇𝑡 is the dummy variable indicating 1 for baseline and 0
for follow-up. Thus, 𝛿1 captures the difference between batch 3 and villages without the project
at the baseline. If villages in the comparison group are comparable with those from batch 3 in
terms of child development outcomes and ECED enrollment, this estimate should be close to 0.
On the other hand, 𝛿2captures the age effect on child outcomes, which includes the advancement
of children’s outcomes and ECED enrollment as they get older regardless of the ECED project.
The time difference is about 14 months. 𝐷𝑖𝑇𝑡 is the interaction term between the intervention
group dummy and the time dummy. Thus, 𝛿3 indicates the impact of the ECED project. 𝑥𝑖 is a
vector of explanatory variables that include caregiver, household, and child characteristics.8 The
estimated impact of the project is not on children who are necessarily enrolled in the project-
provided services but rather it is on children who were offered the chance to enroll in the project-
provided services. This estimated impact is more relevant for policy makers since most social
programs are based on voluntary participation of eligible individuals. We use robust standard
errors clustered at the village level. The key identification assumption is that at the time of
follow-up differences in outcomes between villages that received the project in batch 3 and the
comparison group should be the same as those at baseline if there is no ECED intervention or if
the intervention has no effect. We also run a fixed effects model on regression (2), which
controls for all observed and unobserved time-invariant child characteristics.
Second, we use the random assignment of villages into the treatment (batch 1) and
control (batch 3) groups to estimate the impact of different intervention durations on child
outcomes. At the time of the baseline survey, children in batch 1 villages had already received
the treatment for about 6 months and children in batch 3 villages had not yet received treatment.
However, at the time of the follow-up survey, batch 1 villages had been running the new ECED
services for about 20 months and batch 3 villages had been running them for about nine months.
Taking advantage of the different timing of program implementation and survey, we estimate the
impact after six months of project implementation using batches 1 and 3 at baseline and estimate
the impact of nine months versus 20 months of the project implementation using batches 1 and 3
at follow-up.
8 We control for caregiver, household, and child characteristics as follows; sex, age, education, health, literacy, and number of children of a caregiver; sex, age, education, literacy, and health of a household head and wealth, neighborhood, marital status, religion, and social integration of a household; sex, health, and age in months of a child.
14
The OLS regression model in these cases is as follows:
(2) 𝑦𝑖 = 𝛽0 + 𝐷𝑖𝛿 + 𝑥𝑖𝛽 + 𝑢𝑖.
𝑦𝑖 is enrollment (1 if ever-enrolled and 0 if never-enrolled) or child development
outcomes at baseline or follow-up for a child i. 𝐷𝑖 is the dummy variable indicating 1 for batch 1
and 0 for batch 3. We run this model for baseline and follow-up separately. Assuming that the
randomization is valid, the estimated 𝛿 yields the unbiased impact after six months of project
implementation at baseline and the unbiased impact of nine months versus 20 months of the
project implementation at follow-up. 𝑥𝑖 is a vector of explanatory variables that include caregiver,
household, and child characteristics.9 Again, the estimated impact of the ECED project is not on
children who enrolled in project-provided services but on children who were offered the chance
to do so. We use robust standard errors clustered at the village level.
Using these two analytical methods, we examine changes in enrollment and child
outcomes for all children who were four years old at baseline (age five at follow-up). We then
examine two subgroups of interest, (a) children from poor households whose wealth is less than
the average at baseline and (b) children who never enrolled in any existing ECED services at
baseline.
In the difference-in-differences approach we examine how the development of children
who live in project villages (specifically batch 3 villages) differs from children in non-project
villages as they go from age four to age five. In the simple difference approach relying on the
randomized assignment of villages to batch 1 or batch 3, at baseline we are comparing the
differences in development of four-year-olds when some villages have received an ECED
intervention for six months while others have not. Likewise at follow-up we are comparing the
differences in development of five-year-olds when some villages have received an ECED
intervention for 20 months while others have received it for nine months.
9 We control for caregiver, household, and child characteristics as follows; sex, age, education, health, literacy, and number of children of a caregiver; sex, age, education, literacy, and health of a household head and wealth, neighborhood, marital status, religion, and social integration of a household; sex, health, and age in months of a child.
15
Empirical Results
DiD Estimation Results Using Batch 3 Villages and Those without the Project
Figure 5 and 6 summarize our significant findings from the DiD estimators using a fixed effects
model. 10 We present the impact of the ECED project on enrollment in any early childhood
services as well as on eight other child development outcomes (social competence, language and
cognitive development, communication and general knowledge, language tasks, draw-a-house
task, test of executive function using the dimensional change card sort game, conduct problems,
and pro-social behavior). We only include noticeable and statistically significant findings.11 We
present results for (a) all children (regardless of whether they were enrolled in any ECED service
at baseline), (b) children who were not enrolled in pre-existing ECED services at baseline, and (c)
children from poorer households – those households that report below average wealth.12
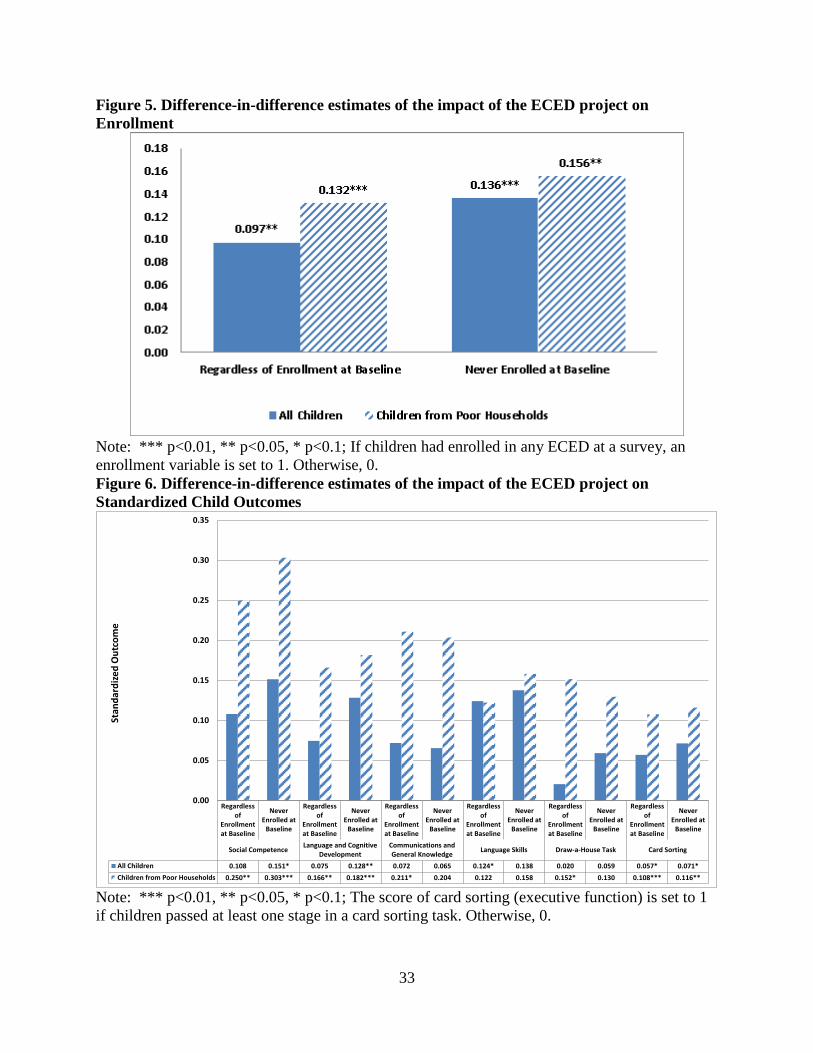
Enrollment
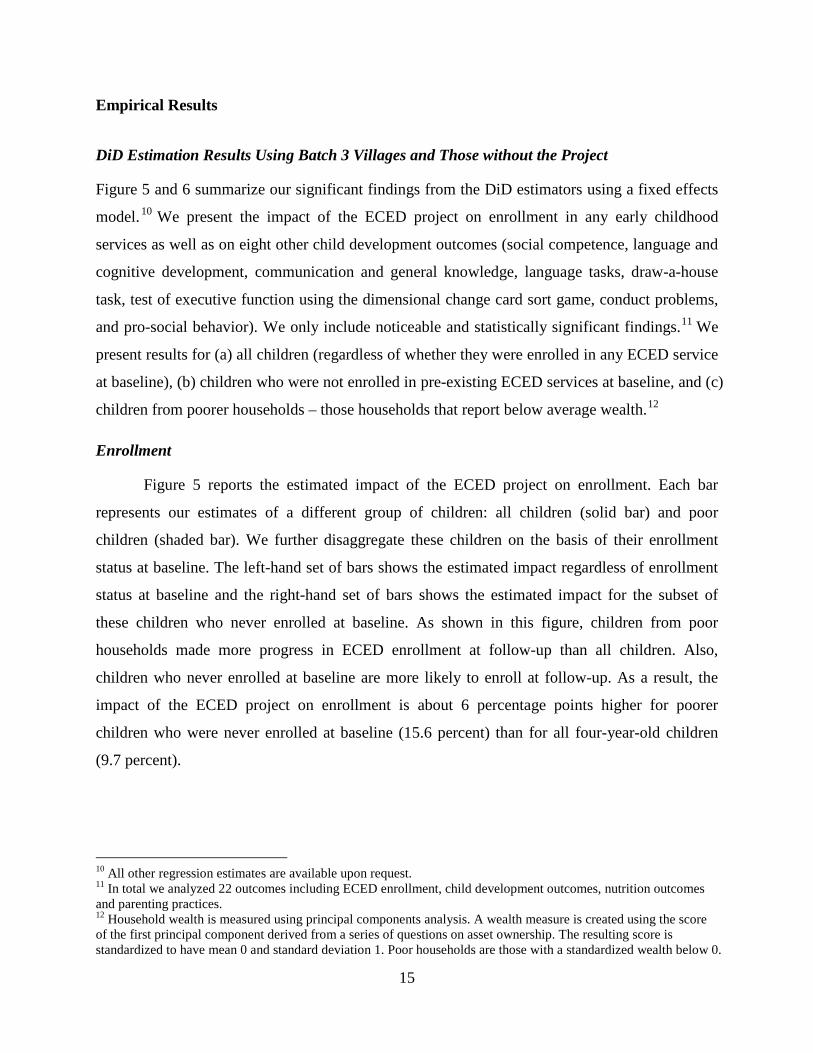
Figure 5 reports the estimated impact of the ECED project on enrollment. Each bar
represents our estimates of a different group of children: all children (solid bar) and poor
children (shaded bar). We further disaggregate these children on the basis of their enrollment
status at baseline. The left-hand set of bars shows the estimated impact regardless of enrollment
status at baseline and the right-hand set of bars shows the estimated impact for the subset of
these children who never enrolled at baseline. As shown in this figure, children from poor
households made more progress in ECED enrollment at follow-up than all children. Also,
children who never enrolled at baseline are more likely to enroll at follow-up. As a result, the
impact of the ECED project on enrollment is about 6 percentage points higher for poorer
children who were never enrolled at baseline (15.6 percent) than for all four-year-old children
(9.7 percent).
10 All other regression estimates are available upon request. 11 In total we analyzed 22 outcomes including ECED enrollment, child development outcomes, nutrition outcomes and parenting practices. 12 Household wealth is measured using principal components analysis. A wealth measure is created using the score of the first principal component derived from a series of questions on asset ownership. The resulting score is standardized to have mean 0 and standard deviation 1. Poor households are those with a standardized wealth below 0.

16
Child Development Outcomes
In Figure 6, we present the estimated impact of the ECED project on six child outcomes.
Each child outcome has estimates for four groups as in Figure 5 based on ECED enrollment at
baseline and household wealth. For the domains of social competence, language and cognitive
development, and executive function (card sorting), we see a greater impact of the ECED project
on children who were not enrolled at baseline or those who are from poor households when
compared to all four-year-olds. For example, the impact of the ECED project on social
competence is about 0.2 standard deviations larger for children who never enrolled and are from
poor households than the impact for all four-year-old children. Children who never enrolled or
are from poor households also have significant and considerable improvements as a result of the
ECED project in communication and general knowledge, language tasks, and the draw-a-house
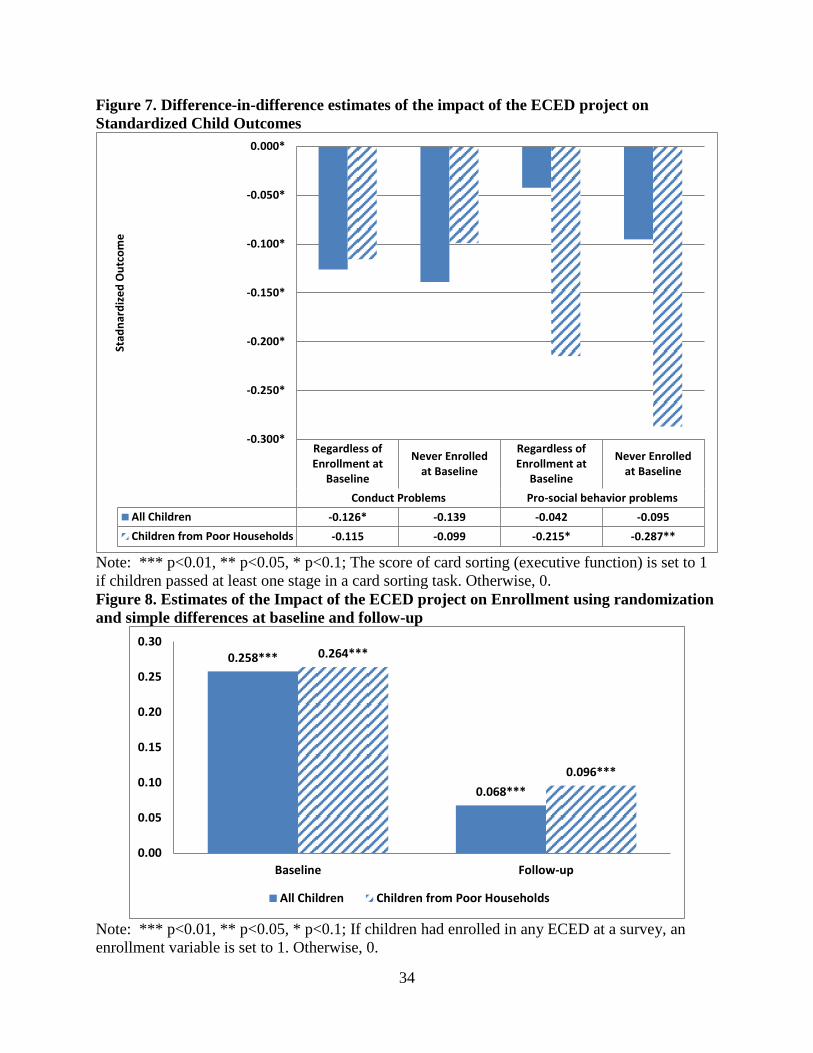
task. Figure 7 presents two domains of the SDQ: conduct problems and pro-social behavior. As
we mentioned earlier, negative scores in these domains indicate fewer difficulties and therefore
improvements in child development. The ECED project has little impact on pro-social behavior
for all four-year-old children but it greatly reduces pro-social behavior problems of children from
poor households (-0.215 standard deviations). The reduction in pro-social behavior problems of
poor children who were not enrolled at baseline is even larger (-0.287 standard deviations).
Corroborating Estimation Results Using Randomized Assignment of Batches 1 and 3
In Figure 8, 9 and 10 we present the estimated impact of the ECED project on enrollment
and child development outcomes using the randomization used to assign villages to batch 1 and
batch 3. These estimates corroborate our difference-in-difference findings. We only include
noticeable and statistically significant findings. 13 As we mentioned earlier, we estimate the
difference between batches 1 and 3 controlling for household, caregiver and child characteristics
at baseline and follow-up. At baseline, batch 1 had implemented the ECED project for six
months and batch 3 had not started their program yet. At follow-up, batch 1 had implemented the
ECED project for about 20 months and batch 3 had implemented the ECED project for about
nine months. As a result, the estimated difference between the two batches at baseline indicates
the estimated impact of six months of the ECED project and the estimate difference between the
two batches at follow-up indicates the estimated impact of nine months versus 20 months of
13 All other regression estimates are available upon request.

17
project implementation. The estimated differences between the two batches at baseline and
follow-up are reported side by side for all children and poor children. It is not possible to present
results for never-enrolled children because the intervention had already happened in batch 1
villages for six months at time of the baseline.
Consequently, as shown in Figure 8, at baseline, the differences in enrollment between
the two batches are about 25 to 26 percentage points for all children and poor children,
respectively. This represents the impact of 6 months of implementation of the ECED project. It is
larger than the estimated impact using the DiD estimators, which was about 10 to 20 percentage
points and represented the difference between villages that had received the project for nine
months when compared to villages that had not received the project. The estimated impact after
the first six months is slightly larger for poorer subgroups of children than all children in general.
At follow-up, the difference between batches 1 and 3 is much smaller - about 6 to 10 percentage
points. This appears to be driven by the different durations of program implementation, nine
months versus 20 months.
Figure 9 reports the impact of the ECED project on standardized child outcomes in a
manner similar to Figure 6. The only statistically significant estimates of impact are in the social
competence domain. At baseline, the estimated impact on social competence is about 0.13 and
0.20 standard deviations for all children and poor children, respectively. This is the impact of six
months of implementation in batch 1 villages. This is compatible with the estimated impacts on
social competence reported in Figure 6. However, the estimated difference is negative or close to
0 at follow-up for both groups - though they are relatively small and statistically not significant.
Similarly, we have a small negative impact of the ECED project on communication and general
knowledge at follow-up. This implies that at follow-up children in batch 3 villages are doing
better in terms of communications and general knowledge than children in batch 1 villages.
Figure 10 presents the impact on two domains under the SDQ, conduct problems and pro-social
behavior, as in Figure 7. There are no statistically significant differences between batch 1 and
batch 3 villages either at baseline or at follow-up.
Overall the results obtained using experimental methods (i.e. by comparing children in
batch 1 and batch 3 villages at baseline and then again at follow-up) corroborate the findings of
the non-experimental methods (comparing the progress of children in batch 3 villages between
baseline and follow-up with the progress of children in comparison group villages).

18
Having established that this intervention was able to register an impact on enrollment and
children’s development, we turn next to the question of whether this impact was sufficiently
large to help narrow early achievement gaps between richer and poorer children.
The ECED Project and Early Achievement Gaps between Richer and Poorer Children
Our findings in the previous sections suggest that children from poorer households make more
progress in a number of child outcomes compared to all children. Thus, in order to examine the
extent to which the ECED project is able to reduce early achievement gaps, we investigate
whether the project narrows the gap in child outcomes between children from richer households
(those with a wealth Z-score ≥ 0) and poorer households (those with a wealth Z-score <0).14 We
modify our DiD model to estimate the progress made by poor children in batch 3 villages
compared to those in the comparison group without the ECED project. We interact the DiD
variables with an indicator variable for poorer children as follows:
(3) 𝑦𝑖𝑡 = 𝛽0 + 𝐷𝑖𝛿1+𝑇𝑡𝛿2 + 𝑃𝑖𝛿3 + 𝐷𝑖𝑇𝑡𝛿4 + 𝑃𝑖𝑇𝑡𝛿5 + 𝐷𝑖𝑃𝑡𝛿6 + 𝐷𝑖𝑇𝑡𝑃𝑖𝛿7 + 𝑥𝑖𝛽 + 𝑢𝑖𝑡.
As in equation (1), 𝑦𝑖𝑡 is enrollment (1 if ever-enrolled and 0 if never-enrolled) or child
development outcomes at baseline (t=1) and follow-up (t=2) for a child i. 𝐷𝑖 is the dummy
variable indicating 1 for batch 3 and 0 for the comparison group while 𝑇𝑡 is the dummy variable
indicating 1 for baseline and 0 for follow-up. 𝑃𝑖 is the dummy variable indicating 1 for poorer
children and 0 for richer children. Thus, 𝛿1 represents the difference between batch 3 and the
comparison group, 𝛿2 represents the progress due to age, 𝛿3 represents the difference between
poor and rich children at the baseline in the comparison group, and their interactions are captured
in 𝛿4 to 𝛿6. In this regression model, 𝛿7 captures the progress made by poor children in batch 3
because they were exposed to the ECED project.
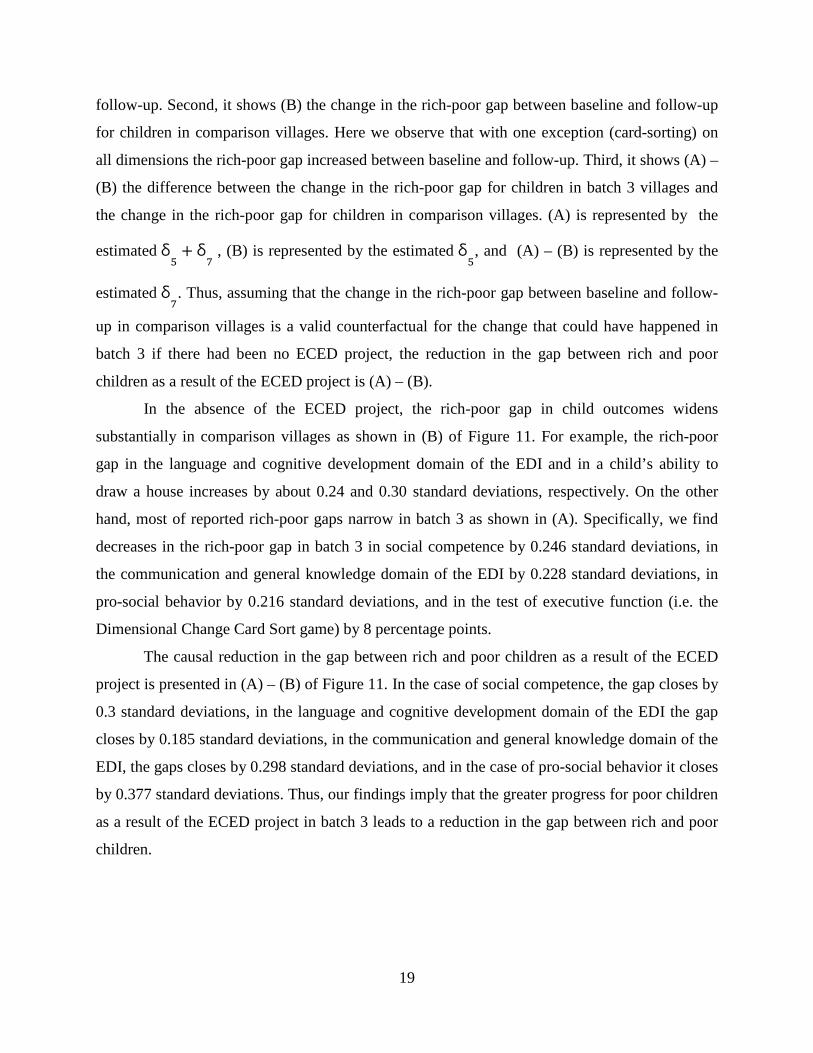
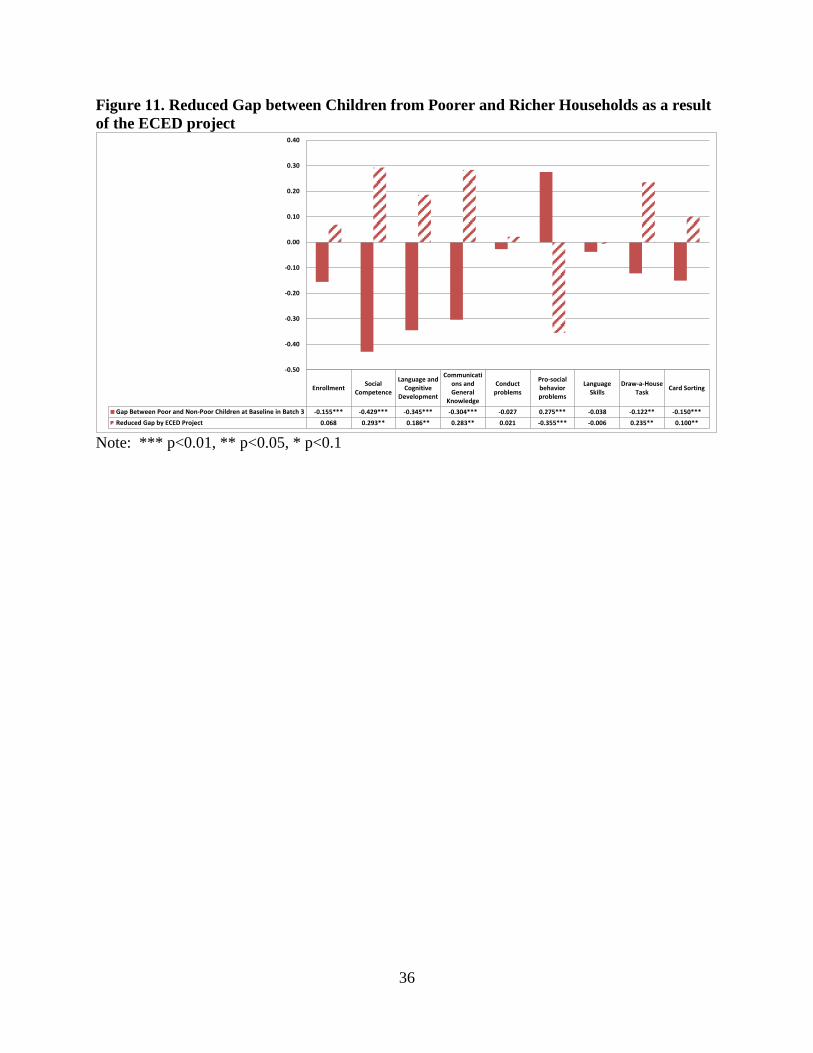
Figure 11 depicts several observations from such an analysis. First, it shows (A) the
change in the rich-poor gap in child outcomes between baseline and follow-up for children in
batch 3 villages. This gap decreases for enrollment and most child outcome measures. More
specifically, for children in batch 3 villages, the rich-poor gap in social competence,
communications and general knowledge and pro-social behavior decreases between baseline and 14 Throughout this paper – rich or poor should be read as relatively richer and poorer. All households in this sample are rural Indonesian households and are broadly representative of the typical rural Indonesian household which is not rich by most definitions. However, within these rural households there are those that are relatively richer and those that are relatively poorer.
19
follow-up. Second, it shows (B) the change in the rich-poor gap between baseline and follow-up
for children in comparison villages. Here we observe that with one exception (card-sorting) on
all dimensions the rich-poor gap increased between baseline and follow-up. Third, it shows (A) –
(B) the difference between the change in the rich-poor gap for children in batch 3 villages and
the change in the rich-poor gap for children in comparison villages. (A) is represented by the
estimated δ5
+ δ7 , (B) is represented by the estimated δ
5, and (A) – (B) is represented by the
estimated δ7. Thus, assuming that the change in the rich-poor gap between baseline and follow-
up in comparison villages is a valid counterfactual for the change that could have happened in
batch 3 if there had been no ECED project, the reduction in the gap between rich and poor
children as a result of the ECED project is (A) – (B).
In the absence of the ECED project, the rich-poor gap in child outcomes widens
substantially in comparison villages as shown in (B) of Figure 11. For example, the rich-poor
gap in the language and cognitive development domain of the EDI and in a child’s ability to
draw a house increases by about 0.24 and 0.30 standard deviations, respectively. On the other
hand, most of reported rich-poor gaps narrow in batch 3 as shown in (A). Specifically, we find
decreases in the rich-poor gap in batch 3 in social competence by 0.246 standard deviations, in
the communication and general knowledge domain of the EDI by 0.228 standard deviations, in
pro-social behavior by 0.216 standard deviations, and in the test of executive function (i.e. the
Dimensional Change Card Sort game) by 8 percentage points.
The causal reduction in the gap between rich and poor children as a result of the ECED
project is presented in (A) – (B) of Figure 11. In the case of social competence, the gap closes by
0.3 standard deviations, in the language and cognitive development domain of the EDI the gap
closes by 0.185 standard deviations, in the communication and general knowledge domain of the
EDI, the gaps closes by 0.298 standard deviations, and in the case of pro-social behavior it closes
by 0.377 standard deviations. Thus, our findings imply that the greater progress for poor children
as a result of the ECED project in batch 3 leads to a reduction in the gap between rich and poor
children.

20
Policy Implications
As this paper has shown, it is possible for well-designed early childhood services in rural
areas to narrow (and in some cases close) early achievement gaps. The results reported here are
consistent across a number of domains. For most outcomes studied in this paper the early
achievement gap decreased for children from project villages. In particular, in project villages,
the early achievement gap in social competence and in communication and general knowledge
decreased significantly as did the early achievement gap in pro-social behavior problems. In
contrast, there was no change in the early achievement gap on these dimensions among children
from non-project villages. For other outcomes, such as the draw-a-house task – the early
achievement gap increased in both project and non-project villages. However, the increase in the
gap was twice as large in non-project villages as in project villages suggesting that the ECED
project may have prevented even more adverse outcomes from materializing.
As Indonesia pursues its vision to ensure that all children have access to holistic,
integrated early childhood education and development services, a number of programs and
policies could be leveraged to ensure that this vision becomes a reality. For the specific case of
Indonesia, we discuss three programs where the potential synergies between government
priorities for HI-ECED and program objectives seem greatest. However, similar programs exist
in many low- and middle-income countries. Thus the opportunities described here could also be
explored elsewhere as well.
Link Conditional Cash Transfers (CCTs) to ECED Attendance
Like many other conditional cash transfer (CCT) programs, the Indonesian CCT
program, Program Keluarga Harapan, (PKH) seeks to reduce poverty and improve people’s
welfare by providing cash transfers to families if they comply with a number of conditions
relating to health and education, such as going to well-baby check-ups or ensuring children
attend school. In its present form, PKH provides families with a cash incentive to ensure that
children attend primary school. There is no condition or transfer related explicitly to ECED
attendance though a number of conditions are focused on improving early health outcomes.15
15 A key motivation behind the ECED project was the fact that children’s school readiness needs to be improved and that ECED services are key in doing so.
21
To better align the government’s flagship poverty reduction program with its own vision
to ensure that all children have access to ECED services, the government could add a condition
whereby families with younger children (less than primary school age) would receive conditional
cash transfers if they attended an ECED service.
Leverage Existing Community-Driven Development Platforms
The country’s community-driven development program – Program Nasional
Pemberdayaan Masyarakat (PNPM) – provides incentives not directly to families, but to
communities – if they meet or exceed thresholds of primary and junior secondary school
enrollment. For many years now, most PNPM communities have exceeded those enrollment
thresholds. One way to align government priorities with community incentives would be to
include ECED enrollment or access thresholds in the PNPM program. Thus communities which
meet or exceed certain pre-specified ECED enrollment thresholds would be eligible to receive
incentives as well.
Ensure Sustainability of Existing Services
A third option would be to reassess the Bantuan Operasional PAUD (BOP) program, in
which the government provides a cash transfer to some ECED services on a per-child basis. In
2012, this program provided certain ECED services with Rp. 240,000 per student per year
(approximately US$25 / student / year) for up to 25 students. In its 2013 manifestation BOP has
been transformed into a flat transfer of Rp. 7,200,000 per institution per year (approximately
US$720 / institution / year). This is the amount if there are more than 26 students per institution.
For an institution with up to 25 students the transfer is Rp. 5 million and for an institution with
up to 15 students the size of the BOP transfer is 3.6 million. In rural communities where
institutions are much more likely to have more than 26 students than in urban areas this means
that BOP is a smaller per student transfer. As suggested in our findings, children in rural areas
are more likely to benefit from having access to ECED services. Thus, there is scope to improve
the benefit-incidence of BOP and make it a more progressive transfer.

22
Conclusion
Our present findings underscore the importance of increasing access to ECED services
particularly to children from poorer backgrounds. It remains to be seen whether the kinds of
gains found in our study persist beyond the short term analyzed here. It will also be important to
gauge whether the government is able to ensure the sustainability of these services and expand
them to reach other children in similar districts.
23
References
Ackerman, D. J. 2004. Getting Teachers from Here to There: Examining Issues Related to an Early Care and Education Teach Policy. Early Childhood Research and Practice, 7(1).
Alderman, H. (Ed.). 2011. No Small Matter: The Impact of Poverty, Shocks, and Human Capital
Investments in Early Childhood Development. Washington DC, USA: The World Bank. Almond, D., and J. Currie. 2010. “Human Capital Development before Age Five.” NBER
Working Paper No. 15827, National Bureau of Economic Research, Cambridge, MA. Berlinski, S., S. Galiani, and M. Manacorda. 2008. “Giving Children a Better Start: Preschool
Attendance and School-Age Profiles.” Journal of Public Economics 92: 1416–40. Bouguen, A., D. Filmer, K. Macours, S. Naudeau. 2013. Impact Evaluation of Three Types of
Early Childhood Development Interventions in Cambodia. Washington, DC: World Bank Policy Research Working Paper Series 6540.
Burger, K. 2010. “How does early childhood care and education affect cognitive development?
An international review of the effects of early interventions for children from different social backgrounds.” Early Childhood Research Quarterly 25 (2010): 140–165.
Carneiro, P, and R. Ginha. 2009. “Preventing Behavior Problems in Childhood and Adolescence:
Evidence from Head Start.” University College London, London. https://docs.google.com/leaf?id=0BxhB_zZedpE8NWJmZGM5ZmMtMjlhNy00MzQ1LTg2ODYtODc0NGRmYTUwMzc5&hl=en&authkey=CLyn17kE&pli=1.
Cunha, F. and J. J. Heckman. 2007. The technology of skill formation. American Economic
Review 97(2), 31–47. May. Currie, J., and D. Thomas. 2000. “School Quality and the Longer-Term Effects of Head Start.”
Journal of Human Resources 35 (4): 755–74. Deming, D.. 2009. “Early Childhood Intervention and Life-Cycle Skill Development: Evidence
from Head Start.” American Economic Journal: Applied Economics 1 (3): 111–34. Engle, P. L., M. M. Black, J. R. Behrman, M. C. de Mello, P. J. Gertler, L. Kapiriri, R. Martorell,
M. E. Young, and the International Child Development Steering Group. 2007. “Strategies to Avoid the Loss of Developmental Potential in More Than 200 Million Children in the Developing World.” Lancet 369 (9557): 229–42.
Heckman, J. J. 2006. Skill formation and the economics of investing in disadvantaged children.
Science, 312(5782), 1900-1902. Heckman, J. J. 2008. Schools, skills and synapses. Economic Inquiry, 289-324.
24
Heckman, J. J. and D. V. Masterov. 2007. The productivity argument for investing in young children. Review of Agricultural Economics 29(3), 446–493.
Heckman, J., R. Lalonde, and J. Smith. 1999. The Economics and Econometrics of Active Labor
Market Programs, Handbook of Labor Economics, 3. Hyson, M. C. 2004. The emotional development of young children: Building an emotion-
centered curriculum. 2nd ed. New York: Teacher College Press. Irwin, L. G., Siddiqi, A., and Hertzman, C. 2007. Early Child Development: A Powerful
Equalizer. Final Report for the World Health Organization's Commission of the Social Determinants of Health. In U. o. B. Columbia (Series Ed.) Retrieved from http://whqlibdoc.who.int/hq/2007/a91213.pdf
Janus, M., Brinkman, S., Duku, E., Hertzman, C., Santos, R., and Sayers, M. 2007. The Early
Development Instrument: A population-based measure for communities. A handbook on development, properties and use. Hamilton, Ontario, Canada: Offord Centre for Child Studies.
Janus, M., and Offord, D. 2007. Development and psychometric properties of the Early
Development Instrument (EDI): A measure of children's school readiness. Canadian Journal of Behavioural Science, 39, 1-22.
Martinez, S., S. Naudeau and V. Pereira. 2011. The Promise of Preschool in Africa: A
Randomised Impact Evaluation of Early Childhood Development in Rural Mozambique. http://www.3ieimpact.org/media/filer/2013/04/11/3ie_mozambique_ie001.pdf. (Accessed on May 14, 2013.)
Naudeau, S., Kataoka, N., Valerio, A., Neuman, M. J., & Elder, L. K. 2011. Investing in Young
Children: An Early Childhood Development Guide for Policy Dialogue and Project Preparation. Washington, D.C: The World Bank.
Naudeau, S., S. Martinez, P. Premand, and D. Filmer. 2011. Cognitive Development among
Young Children in Low-Income Countries. In H. Alderman (Ed.), No Small Matter: The Impact of Poverty, Shocks, and Human Capital Investments in Early Childhood Development. Washington DC, USA: The World Bank.
Ounce of Prevention Fund. 2012. “Why Investments in Early Childhood Work.”
http://www.ounceofprevention.org/about/why-early-childhood-investments-work.php. Paxson, C., and N. Schady. 2007. “Cognitive Development among Young Children in Ecuador:
The Roles of Wealth, Health, and Parenting.” Journal of Human Resources 42 (1): 49–84.
25
Pradhan, M., S. A. Brinkman, A. Beatty, A. Maika, E. Satriawan, J. DeRee and A. Hasan. 2013. “Evaluating a community-based early childhood education and development program in Indonesia: study protocol for a pragmatic cluster randomized controlled trial with supplementary matched control group.” Trials, 14:259. http://www.trialsjournal.com/content/14/1/259
Primeira Infância Melhor. PIM-Programa Primeira Infância Melhor-Noticiário. February 3, 2011.
http://www.pim.saude.rs.gov.br/a_PIM/php/pagina-Noticiario.php?n=63 (Accessed on May 14, 2013.)
Vegas, E., and L. Santibáñez. 2010. The Promise of Early Child Development in Latin America
and the Caribbean. Washington, DC: World Bank. Young, M. E.. 2012. Supporting parents in Early Child Development Programs – examples of
Jamaica and Brazil. Conference presentation. International Early Childhood Care and Development Conference: “Supporting Children’s Learning and Development: Homes, Communities and Schools.” Sponsored by Asia-Pacific Regional Network on Early Childhood (ARNEC), Indonesia ECCD National Coalition and World Bank. Jakarta, Indonesia. November 6, 2012.
26
Figure 1: Gaps in access to early childhood services in Indonesia in 2007
Notes: Quintiles defined on the basis of per capita expenditure. Highly educated mother has 12 years of completed schooling. Very little education corresponds to 2 years of completed schooling. Typical child has average characteristics for the quintile or the area. Source: SUSENAS 2007
0.05
0.27
0.12
0.21
0.08
0.14
0.33
0.00 0.10 0.20 0.30 0.40 0.50
Rural 4-year old girl from poor household whosemother has very little education
Urban 4-year old boy from non-poor householdwhose mother is highly educated
Typical 4-year old child in rural area
Typical 4-year old child in urban area
Typical 4-year old child from poorest quintile
Typical 4-year old child from middle quintile
Typical 4-year old child from richest quintile
Cha
ract
eris
tics
Loca
tion
Wea
lthProbability of being enrolled in any type of ECED services

27
Figure 2: Gaps between rich and poor in language and cognitive development
Source: ECED project baseline data from batch 3 and comparison villages. Rich have an asset index greater than or equal to 0. Poor have an asset index less than 0. Only children between the ages of 48 and 60 months are included.
22.
53
3.5
44.
55
Ave
rage
Sco
re
48 49 50 51 52 53 54 55 56 57 58 59 60Age of child (months)
PoorRich
Language and Cognitive Development Domain
23
45
67
8N
umbe
r of f
eatu
res
draw
n
48 49 50 51 52 53 54 55 56 57 58 59 60Age of child (months)
PoorRich
Drawing a Human
.5.6
.7.8
.91
Frac
tion
pass
ing
Sta
ge 1
48 49 50 51 52 53 54 55 56 57 58 59 60Age of child (months)
PoorRich
Test of executive functionDimensional Change Card Sort

28
Table 1: Different kinds of ECED services are overseen by different ministries
Ministry of Education and
Culture
Ministry of Religious Affairs
Ministry of Home Affairs
with Ministry of Health Staff
National Family
Planning Board
Formal Kindergartens
(Taman Kanak-kanak, TK)
Islamic Kindergarten (Raudhotul Atfal, RA)
Non-formal
Playgroups (Kelompok
Bermain, KB)
Islamic Kindergarten
(Taman Pendidikan
Quran TPQ)
Integrated Health Service
Unit (Posyandu)
Toddler Family
Groups (Bina Keluarga
Balita, BKB) ECED Posts (Pos-
Paud)
Childcare centers (Taman Penitipan
Anak, TPA)
Other early childhood units (Satuan PAUD Sejenis, SPS)
29
Figure 3: The intended age of early childhood services in Indonesia Intended Age
7
Primary School (SD)
6 TK/RA
TPQa Posyandu
4
TPA
SPS KB 2 Pos-PAUD BKB Others 0
Type of ECED Service
Note: a. Also included in SPS. BKB = Bina Keluarga Balita (toddler family groups); KB = Kelompok Bermain (playgroups); Pos-PAUD = ECED posts; Posyandu = (Integrated health service unit); RA = Raudhotul Atfal (Islamic kindergarten); (SPS = Satuan PAUD Sejenis (other early childhood units); TK = Taman Kanak-kanak (kindergartens); TPA = Taman Penitipan Anak (childcare centers); TPQ = Taman Pendidikan Quran (Islamic kindergartens).
30
Figure 4: The impact evaluation as designed and as implemented
Project timeline
A lottery is held which assigns villages to one of 3 batches. In addition a group of villages are
identified that are similar to the villages included in the lottery. In the evaluation these
are the comparison group villages. Data is collected on these villages in both rounds of
the survey
Batch 2 receives
project - not included in evaluation
Batch 3 receives
project - in the evaluation
this is the control group. Not treated for
first 18 months.
Subsequently treated.
Survey timeline
First round of survey fielded Second round of survey fielded
Time 6 months before project starts6 months
after project starts
9 months after project
starts
12 months after project starts
18 months after project
starts
20 months after project starts
Survey timeline No survey is fielded
First round of survey fielded
Second round of survey fielded
Project timeline
A lottery is held which assigns villages to one of 3 batches. In addition a group of villages are
identified that are similar to the villages included in the lottery. In the evaluation these
are the comparison group villages.
Batch 1 receives
project - in evaluation this
is the treatment
group
Some Batch 2 villages
receive the project ahead of schedule. Not included in evaluation.
Batch 3 receives
project - in the evaluation
this is the control group. Not treated for
first 11 months.
Subsequently treated.
Remaining Batch 2 villages
receive the project behind schedule. Not included in the
evaluation
The
eva
luat
ion
as d
esig
ned
The
eva
luat
ion
as im
plem
ente
d
Batch 1 receives project - in evaluation this is the treatment
group
Project starts 11 months after project starts
31
Table 2. Mean and Standard Deviations of Standardized Child Outcomes Batch 1 Batch 3 Comparison Group
Baseline Follow-
up Baselin
e Follow-
up Baselin
e Follow-
up Ever-
Enrollment Any ECED Enrollment*
0.61 0.90 0.34 0.82 0.36 0.73 (0.49) (0.30) (0.47) (0.39) (0.48) (0.44)
Early Development
Instrument (EDI)
Physical Health & Well-Being
-0.45 0.50 -0.47 0.50 -0.48 0.46 (0.93) (0.87) (0.92) (0.83) (0.90) (0.82)
Social Competence -0.10 0.21 -0.28 0.27 -0.26 0.17 (1.05) (0.94) (1.01) (0.90) (0.98) (0.96)
Emotional Maturity -0.10 0.18 -0.16 0.16 -0.16 0.08 (1.01) (0.95) (0.98) (0.98) (1.02) (1.00)
Language & Cognitive Development
-0.45 0.50 -0.50 0.51 -0.46 0.47 (0.78) (0.97) (0.73) (0.99) (0.76) (0.99)
Communication & General Knowledge
-0.07 0.00 -0.06 0.06 0.02 0.06 (1.15) (1.02) (1.10) (0.83) (0.97) (0.84)
Strengths and Difficulties
Questionnaire (SDQ)
Emotional Symptoms -0.02 -0.06 0.07 -0.02 0.05 -0.04 (1.01) (0.98) (0.99) (1.03) (1.00) (0.98)
Conduct Problems -0.01 -0.03 0.05 -0.05 0.02 0.04 (1.00) (1.02) (0.96) (1.02) (0.98) (1.04)
Hyperactivity/ Inattention 0.19 -0.15 0.11 -0.18 0.21 -0.18 (0.99) (1.01) (0.96) (0.99) (0.99) (0.98)
Peer Problems 0.05 -0.03 0.09 -0.15 0.12 -0.08 (0.96) (1.00) (0.98) (1.01) (1.04) (0.98)
Pro-social behavior 0.09 -0.04 0.06 -0.11 0.06 -0.06 (1.00) (0.99) (1.00) (0.97) (0.99) (1.03)
Total Difficulties 0.06 -0.10 0.12 -0.13 0.13 -0.08 (0.98) (0.97) (0.97) (1.03) (1.02) (0.99)
Other Tasks
Gross Motor -0.15 0.08 -0.07 0.10 -0.07 0.13 (1.41) (0.74) (1.14) (0.64) (1.14) (0.53)
Fine Motor -0.06 0.11 -0.09 0.07 -0.14 0.11 (1.16) (0.75) (1.17) (0.83) (1.21) (0.74)
Language Skills -0.63 0.64 -0.67 0.67 -0.67 0.58 (0.69) (0.85) (0.73) (0.74) (0.75) (0.82)
Drawing Human -0.49 0.40 -0.42 0.43 -0.48 0.40 (0.85) (0.97) (0.86) (0.92) (0.85) (0.93)
Drawing House -0.53 0.49 -0.52 0.45 -0.54 0.48 (0.60) (1.02) (0.60) (0.97) (0.58) (1.16)
Card Sorting* 0.64 0.87 0.64 0.89 0.68 0.89 (0.48) (0.34) (0.48) (0.31) (0.47) (0.31)
Parenting and Nutritional Outcomes
Parenting Skills 0.08 -0.05 0.02 -0.06 0.04 -0.03 (1.03) (1.02) (0.98) (0.95) (1.00) (1.02)
Height -1.51 -1.51 -1.51 -1.52 -1.45 -1.54 (1.22) (1.09) (1.16) (1.08) (1.21) (1.07)
Weight -1.77 -1.67 -1.80 -1.76 -1.75 -1.68 (1.15) (1.19) (1.21) (1.23) (1.28) (1.27)
BMI -0.86 -0.87 -0.97 -0.93 -1.01 -0.86 (1.46) (1.35) (1.47) (1.38) (1.41) (1.33)
Note: Standard Deviations are in parentheses. *Dummy variables
32
Table 3. Characteristics of children and their enrollment decisions between baseline and Follow-up Child not enrolled in ECED at baseline
Mother has less than elementary education
Father has less than elementary education
Wealth Z-score
ECED Enrollment Status At
Follow-up Batch 3
Comparison Without
Intervention Batch 3
Comparison Without
Intervention Batch 3
Comparison Without
Intervention (1)
Not enrolled 0.79 0.75 0.72 0.72 -0.43 -0.55
(0.03) (0.03) (0.03) (0.03) (0.07) (0.07) (2) Enrolled in existing ECED
services 0.53 0.60 0.56 0.58 -0.01 0.11
(0.03) (0.03) (0.03) (0.03) (0.05) (0.05) (3) Enrolled in project-provided
ECED services Only 0.69 0.60 -0.19
(0.04) (0.04) (0.08)
(4) Enrolled in some combination of existing and
project-provided ECED services
0.53
0.50
0.16
(0.06)
(0.06)
(0.10)
All children
0.63 0.66 0.60 0.63 -0.13 -0.15 (0.02) (0.02) (0.02) (0.02) (0.04) (0.04)
Note: Means and standard deviations in parentheses. This table describes the parental education and household wealth characteristics of children who were not enrolled in ECED services at baseline and who had one of four possible enrolled statuses in follow-up – they were not enrolled in follow-up, they were enrolled in existing ECED services, they were enrolled in project-provided ECED services or they were enrolled in some combination of existing and project-provided services. The last row is the average of all children irrespective of their enrollment status.
33
Figure 5. Difference-in-difference estimates of the impact of the ECED project on Enrollment
Note: *** p<0.01, ** p<0.05, * p<0.1; If children had enrolled in any ECED at a survey, an enrollment variable is set to 1. Otherwise, 0. Figure 6. Difference-in-difference estimates of the impact of the ECED project on Standardized Child Outcomes
Note: *** p<0.01, ** p<0.05, * p<0.1; The score of card sorting (executive function) is set to 1 if children passed at least one stage in a card sorting task. Otherwise, 0.
Regardlessof
Enrollmentat Baseline
NeverEnrolled at
Baseline
Regardlessof
Enrollmentat Baseline
NeverEnrolled at
Baseline
Regardlessof
Enrollmentat Baseline
NeverEnrolled at
Baseline
Regardlessof
Enrollmentat Baseline
NeverEnrolled at
Baseline
Regardlessof
Enrollmentat Baseline
NeverEnrolled at
Baseline
Regardlessof
Enrollmentat Baseline
NeverEnrolled at
Baseline
Social Competence Language and CognitiveDevelopment
Communications andGeneral Knowledge Language Skills Draw-a-House Task Card Sorting
All Children 0.108 0.151* 0.075 0.128** 0.072 0.065 0.124* 0.138 0.020 0.059 0.057* 0.071*Children from Poor Households 0.250** 0.303*** 0.166** 0.182*** 0.211* 0.204 0.122 0.158 0.152* 0.130 0.108*** 0.116**
0.00
0.05
0.10
0.15
0.20
0.25
0.30
0.35
Stan
dard
ized
Out
com
e
34
Figure 7. Difference-in-difference estimates of the impact of the ECED project on Standardized Child Outcomes
Note: *** p<0.01, ** p<0.05, * p<0.1; The score of card sorting (executive function) is set to 1 if children passed at least one stage in a card sorting task. Otherwise, 0. Figure 8. Estimates of the Impact of the ECED project on Enrollment using randomization and simple differences at baseline and follow-up
Note: *** p<0.01, ** p<0.05, * p<0.1; If children had enrolled in any ECED at a survey, an enrollment variable is set to 1. Otherwise, 0.
Regardless ofEnrollment at
Baseline
Never Enrolledat Baseline
Regardless ofEnrollment at
Baseline
Never Enrolledat Baseline
Conduct Problems Pro-social behavior problemsAll Children -0.126* -0.139 -0.042 -0.095Children from Poor Households -0.115 -0.099 -0.215* -0.287**
-0.300*
-0.250*
-0.200*
-0.150*
-0.100*
-0.050*
0.000*
Stad
nard
ized
Out
com
e
0.258***
0.068***
0.264***
0.096***
0.00
0.05
0.10
0.15
0.20
0.25
0.30
Baseline Follow-up
All Children Children from Poor Households

35
Figure 9. The Impact of The ECED project on Standardized Child Outcomes using randomization and simple differences at baseline and follow-up
Note: *** p<0.01, ** p<0.05, * p<0.1; The score of card sorting (executive function) is set to 1 if children passed at least one stage in a card sorting task. Otherwise, 0. Figure 10. The Impact of The ECED project on Standardized Child Outcomes using randomization and simple differences at baseline and follow-up
Note: *** p<0.01, ** p<0.05, * p<0.1; The score of card sorting (executive function) is set to 1 if children passed at least one stage in a card sorting task. Otherwise, 0.
Baseline Follow-up Baseline Follow-
up Baseline Follow-up Baseline Follow-
up Baseline Follow-up Baseline Follow-
up
SocialCompetence
Language andCognitive
Development
Communicationsand GeneralKnowledge
Language Skills Draw-a-HouseTask Card Sorting
All Children 0.128*** -0.076 0.033 -0.020 -0.046 -0.085* 0.053 -0.025 0.008 0.051 -0.006 -0.022Children from Poor Households 0.198*** 0.002 0.042 -0.005 0.089 -0.011 0.111 -0.062 0.012 0.018 -0.015 -0.020
-0.10
-0.05
0.00
0.05
0.10
0.15
0.20
Stan
dard
ized
Out
com
e
Baseline Follow-up Baseline Follow-up
Conduct Problems Pro-social behaviorproblems
All Children -0.037 0.027 0.050 0.069Children from Poor Households 0.032 0.046 0.023 0.051
-0.06
-0.04
-0.02
0.00
0.02
0.04
0.06
0.08
Stan
dard
ized
Out
com
e
36
Figure 11. Reduced Gap between Children from Poorer and Richer Households as a result of the ECED project
Note: *** p<0.01, ** p<0.05, * p<0.1
Enrollment SocialCompetence
Language andCognitive
Development
Communications andGeneral
Knowledge
Conductproblems
Pro-socialbehaviorproblems
LanguageSkills
Draw-a-HouseTask Card Sorting
Gap Between Poor and Non-Poor Children at Baseline in Batch 3 -0.155*** -0.429*** -0.345*** -0.304*** -0.027 0.275*** -0.038 -0.122** -0.150***Reduced Gap by ECED Project 0.068 0.293** 0.186** 0.283** 0.021 -0.355*** -0.006 0.235** 0.100**
-0.50
-0.40
-0.30
-0.20
-0.10
0.00
0.10
0.20
0.30
0.40

37
Appendix Table 1. A Closer Look at the Child Development Measures
Measure Objective Background and uses
Height and weight measurements
To measure children’s height and weight by age to determine extent and severity of stunting, wasting, or underweight conditions
Measures of height for age, weight for age and body mass index (BMI) were constructed using these measures to assess stunting, wasting, and long-run nutritional challenges.
Early Development Instrument (EDI) short version)a
To measure children’s school readiness in five major developmental domains:
1. Physical health and well-being
2. Social competence 3. Emotional maturity 4. Language and
cognitive development 5. Communication skills
and general knowledge
The Early Development Instrument (EDI) was developed at the Offord Centre for Child Studies in Canadab and has been used extensively in many countries such as the Philippines and Jordan. In some countries, such as Canada and Australia, the EDI is used as a national monitoring tool for all children in their first year of full time schooling. In Indonesia a 47-item short version was used instead of the standard 104-item version.
Strengths and Difficulties Questionnaire (SDQ)c
To identify possible social and emotional difficulties as shown in reports of emotional symptoms, conduct problems, hyperactivity/inattention, and peer-relation problems; also to identify strengths in prosocial behavior (sharing, helping)
The SDQd is a behavioral checklist designed to be completed by teachers or mothers/family caregivers for children between 3 and 16 years of age. The SDQ uses 5 scales, each scored from 1 to 10, and made up of five items: emotional symptoms, conduct problems, hyperactivity/inattention, peer relationship problems, and prosocial behavior. In this book all scales have been coded identically, so that for all scales, the higher the score, the more concern about possible social or emotional difficulties.
Demonstrations of child skills (and mother reports of these skills), drawing on a study conducted by the University of San Carlos Office of
To directly observe (or, with younger or reluctant children, to learn from the mother) children’s gross and fine motor skills, language, cognitive and socio-emotional development
In one set of questions, children were asked to demonstrate their ability to perform a specified skill. When the child did not want to demonstrate this skill, the mother was asked if the child is usually able to do it. In another set of questions, the mother
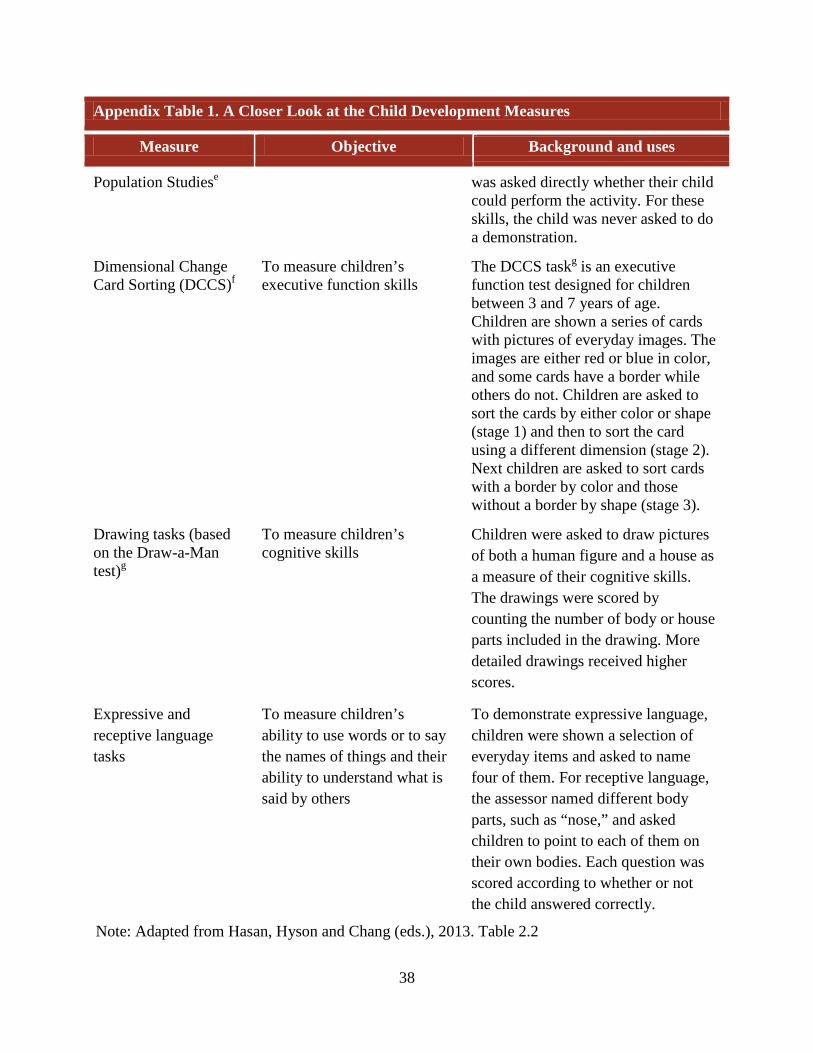
38
Appendix Table 1. A Closer Look at the Child Development Measures
Measure Objective Background and uses
Population Studiese
was asked directly whether their child could perform the activity. For these skills, the child was never asked to do a demonstration.
Dimensional Change Card Sorting (DCCS)f
To measure children’s executive function skills
The DCCS taskg is an executive function test designed for children between 3 and 7 years of age. Children are shown a series of cards with pictures of everyday images. The images are either red or blue in color, and some cards have a border while others do not. Children are asked to sort the cards by either color or shape (stage 1) and then to sort the card using a different dimension (stage 2). Next children are asked to sort cards with a border by color and those without a border by shape (stage 3).
Drawing tasks (based on the Draw-a-Man test)g
To measure children’s cognitive skills
Children were asked to draw pictures of both a human figure and a house as a measure of their cognitive skills. The drawings were scored by counting the number of body or house parts included in the drawing. More detailed drawings received higher scores.
Expressive and receptive language tasks
To measure children’s ability to use words or to say the names of things and their ability to understand what is said by others
To demonstrate expressive language, children were shown a selection of everyday items and asked to name four of them. For receptive language, the assessor named different body parts, such as “nose,” and asked children to point to each of them on their own bodies. Each question was scored according to whether or not the child answered correctly.
Note: Adapted from Hasan, Hyson and Chang (eds.), 2013. Table 2.2