Embed Size (px)
Citation preview
THE IMPACT OF COOPERATION ON R&D, INNOVATION AND PRODUCTIVITY: An analysis of Spanish manufacturing and Service Firms. Segarra.A, García-Quevedo.J, Teruel.M
DOCUMENT DE TREBALL
XREAP2013-08
The Impact of Cooperation on R&D, Innovation andProductivity: an Analysis of Spanish Manufacturing and Services Firms
Verónica Fernández Gual (GRIT, XREAP)
Agustí Segarra Blasco (GRIT, XREAP)
The Impact of Cooperation on R&D, Innovation and
Productivity: an Analysis of Spanish Manufacturing
and Services Firms.
Veronica Fernandez Gual∗, Agustı Segarra Blasco
Department of Economics, Universitat Rovira i Virgili
CREIP, XREAP, Industry and Territory Research Group,
Reus, Spain
Abstract
This paper investigates relationships between cooperation, R&D, innovation and pro-
ductivity in Spanish firms. It uses a large sample of firm-level micro-data and applies an
extended structural model that aims to explain the effects of cooperation on R&D invest-
ment, of R&D investment on output innovation, and of innovation on firms’ productivity
levels. It also analyses the determinants of R&D cooperation. Firms’ technology level is
taken into account in order to analyse the differences between high-tech and low-tech firms,
both in the industrial and service sectors. The database used was the Technological Inno-
vation Panel (PITEC) for the period 2004-2010. Empirical results show that firms which
cooperate in innovative activities are more likely to invest in R&D in subsequent years. As
expected, R&D investment has a positive impact on the probability of generating an inno-
vation, in terms of both product and process, for manufacturing firms. Finally, innovation
output has a positive impact on firms’ productivity, being greater in process innovations.
Keywords: innovation sources; productivity; R&D Cooperation
∗Corresponding author. Email: [email protected]
1
1 Introduction
In recent years it has been concluded that innovation is a key element of productivity growth.
The seminal contribution was provided by Griliches (1979), who showed that a single equation
model was too simple for the analysis of innovation processes. This type of literature focuses
on analysing the impact of technological innovations. The recent literature on industrial orga-
nizations concentrates more on strategic interactions between firms rather than on transaction
costs and policy strategies. It focuses on the effects that come with business strategies. The
main purpose of firms when innovating is to develop new products and processes which will
enable them to increase their business share and thus be more competitive. Recently, there has
been a third alternative for generating technology improvements: in addition to being able to
develop through R&D activities conducted by the company itself and external R&D generated
by external entities, firms are able to generate technological improvements through R&D coop-
eration. This R&D cooperation can develop between firms or between firms and institutions.
According to the Oslo Manual (2005), cooperation in innovation involves active participation
in joint innovation projects with other organizations. As shown by the OECD (2002), techno-
logical cooperation has been one of the main instruments used by companies when conducting
R&D in the last 20 years.
Many articles investigating R&D cooperation try to explain the factors that affect the deci-
sion to cooperate, showing that the main determinants are spillovers (Cassiman and Veugelers,
2002), size (Dutta and Weiss, 1997), or the technological or commercial objectives of the firm
(Bayona et. al 2001; Tether, 2002; Miotti and Schwald, 2003 and Becker and Dietz, 2004).
However, few studies analysed the impact of technological cooperation on R&D intensity, inno-
vation and business development.
When measuring the impact of technological cooperation on innovative output, the literature
relates R&D cooperation with the role of knowledge sharing between R&D cooperation part-
ners. Many empirical studies of existing side effects have focused mainly on the impact of
involuntary knowledge flows on performance, which are caused by lack of cooperation, which
increases competitors’ stock of knowledge and can weaken the firm’s position in the market in
question. The existence of this kind of involuntary leakage reduces the efficiency of firms’ R&D
2
efforts as they cannot appropriate all the benefits, and this results in lower R&D investment
levels. However, R&D cooperation enables firms to internalize knowledge externalities and
eliminate the deterrent effect of spillovers on R&D (e.g. Amir, 2003; De Bondt, 1996; Kamien
et al. 1992, and Suzumura, 1992). Firms have incentives to manage the flow of surplus and
from competitors, trying to maximize the incoming spillovers through R&D collaboration, while
minimizing side effects projections through investment in protecting knowledge (Cassiman et
al. 2002 and Amir et al. 2003).
The work undertaken by Cassiman and Veugelers (2002) distinguishes two kinds of externali-
ties: firstly, the indirect entry effect, which affects the rate of a firm’s innovation, generally in
the public domain, and its use for the firm, depends on the firm’s capacity to create information
flows from this public knowledge; and secondly, appropriation, which affects the firm’s ability to
appropriate the benefits of innovations. With regard to the issue of the appropriation of R&D
cooperation, Cassiman and Veugelers (2002) found that the firms which were better able to ap-
propriate the results of innovation were more likely to cooperate with clients or suppliers, but
this did not affect cooperation agreements with research institutes. In the case of Spanish firms,
Lopez (2008) confirms that the main determinants of cooperation include publicly-accessible
information that is introduced by side effects and the efficacy of the protection of intellectual
property rights. This type of study is mainly characterized by the heterogeneity of existing
models. Therefore, cooperation produces complementarities between a firm’s internal and ex-
ternal resources which can help the partners to obtain innovative results (Miotti and Schwald,
2003 and Cassiman and Veugelers, 2002).
Another relevant factor for cooperative strategies in R&D is the absorption capacity. This
notion was introduced by Cohen and Levinthal (1989). The concept was defined as technolog-
ical opportunities, and was subsequently developed theoretically by Kamien and Zang (2000),
in which they stressed the importance of a prior stock of knowledge for effectively absorbing
spillovers while cooperating. As a result, by Bayonne et al. (2001), Fritsch and Lukas (2001),
Schwald and Miotti (2003) and Belderbos et al. (2004), a firm’s absorption capacity is listed as
one of the main features of firms that cooperate. These authors concluded that firms in sectors
with high technological opportunities are more willing to cooperate.
3
In general, the literature confirms the existence of a positive relationship between R&D co-
operation and innovative results, but the effect on economic performance is not so evident.
Therefore, the main objective of this paper is to analyse the impact of cooperation projects
on the input and output innovations of Spanish firms. Innovation input is measured by the
intensity of R&D expenditure, while innovation output is measured by the knowledge function;
finally, the impact of innovation output on the production function can be observed. This pa-
per aims to show the effect of having to make a cooperation agreement on future investment in
R&D on the generation of knowledge and hence the firm’s productivity level.
This study used the structural model developed by Crepon, Duguet and Mairesse (1998), re-
ferred to henceforth as the CDM model, involving four stages: (i) the determinants of coop-
eration projects, (ii) the firm’s decision to engage in sufficient effort to result in observable
R&D investment and the intensity with which the firm undertakes R&D, (iii) the innovation
or knowledge production function, where the knowledge takes two different forms - process and
product innovations, and (iv) the output production function, where knowledge is an input.
Due to the increasing availability of micro-level innovation survey data, many authors rely
on the CDM model to analyse the impact of innovation on the productivity of firms, e.g. Janz
et al., 2004 in the case of Germany and Sweden; Loof and Heshmati, 2006 for Sweden; Be-
navente, 2006 for Chile; Jefferson et al., 2006 for China; Mohen et al., 2006 for seven European
countries; Griffith et al., 2006, which makes a comparative study of four countries; and, more
recently, Segarra-Blasco, 2010 and Segarra-Blasco and Teruel, 2011 for Catalonia and Mairesse
et al, 2012 for China.
This paper aims to cover at least two key aspects. Firstly, it analyses the reasons that drive
firms to reach cooperation agreements. In this respect it answers questions such as what kind
of companies decide to reach a cooperation agreement, whether it affects the operating sector,
whether the technological intensity of the firm is an important factor, if it is relevant that the
company operates internationally or exports, or whether the company has already cooperated
in the past or not. Secondly, it analyses what impact this decision has on the firm’s future
4
strategies. In this case, it aims to answer questions such as: How does a cooperation agreement
affect the firm’s behaviour in terms of its R&D decisions? What is the relationship between
cooperation and innovation? What impact does innovation have on a firm’s productivity?
The study was conducted using the Technological Innovation Panel (PITEC) database for the
period 2004-2010. In order to avoid endogeneity problems, all the variables were lagged by one
period when estimating the cooperation equation.
The rest of the paper is structured as follows: Section 2 presents the theoretical mode; Section
3 describes the database; Section 4 presents the empirical implementation and the results ob-
tained; and finally, Section 5 sets out the conclusions.
2 Model
This paper used a structural model whereby firms first decided whether to cooperate in in-
novation activities; it was then observed how these cooperation agreements affected R&D,
innovation and productivity. This model is based on five equations: (i) the determinants of
cooperation projects, (ii) the firm’s decision to engage in sufficient effort to result in observable
R&D investment and the intensity with which the firm undertakes R&D, (iii) the innovation
or knowledge production function where the knowledge takes two different forms - process and
product innovations, and (iv) the output production function, where knowledge is an input.
This model is a modified version of the model by Crepon, Duguet and Mairesse (CDM, 1998).
The original model was also extended by introducing measures of the cooperation agreements
as a first stage of the firm’s decision to cooperate or not in R&D.
2.1 R&D Cooperation
In formal terms, the model can be expressed as follows. Let i=1,...,N index firms. The equation
explains the determinants of cooperating in innovative activities:
5
coop =
1 if c∗i = δXi + µi
0 in other case,(1)
where coop is a latent dependent variable corresponding to firms that decide to reach a cooper-
ation agreement, Xi is a vector of explanatory variables of participation in cooperation projects
on innovative activities, δ represents the parameters of interest to estimate and µi is the error
term.
2.2 The research equation
The second step concerns a firm’s research activities, modelling the process that leads the firm
to decide whether or not to undertake these research projects and how much to invest in them.
However, the intensity of R&D investment can be observed if, and only if, firms actually choose
to spend on R&D. Therefore the second equation is a selection equation indicating whether the
firm performs R&D activities or not, and can be specified as:
rdi =
1 if rd∗i = αcoopi + βW′i + εi > b
0 if rd∗i = αcoopi + βW′i + εi ≤ b,
(2)
where rdi is the observed binary endogenous variable that takes the value 1 if firm i has positive
R&D expenditures, rd∗i is a corresponding latent variable whereby firms decide to do (and/or
report) R&D if it is above a certain threshold level, b, where coopi is the predicted explanatory
variable of cooperation, W ′i is a set of explanatory variables and εi is the error term.
The third equation represents innovation intensity, specified as:
ri =
r∗i = θicoopi + βZ′i + ei if rd∗i = 1
0 if rd∗i = 0,(3)
where r∗i is the unobserved latent variable accounting for a firm’s innovative effort measured as
the logarithm of R&D expenditure per employee, coopi is the predicted explanatory variable of
cooperation, Z ′i is a set of explanatory variables and ei is the error term.
6
2.3 The innovation equation
The third stage links the research activities above to innovation output measures. Thus, the
fourth equation is the innovation production function:
gi = γir∗i + δX ′i + µi, (4)
where gi is innovation output proxied by both product and process innovation indicators,and
where the latent innovation effort r∗i is an explanatory variable, X ′i is a vector of other deter-
minants of knowledge production and µi is the error term.
2.4 The productivity equation
Finally, the last step is modelled by an augmented Cobb-Douglas production function:
yi = π1ki + π2gi + π3hi + π4Xi + vi, (5)
where yi is labour productivity, ki is physical capital per employee, gi is innovation output, hi
is human capital, Xi is a vector of additional control variables and vi is the error term.
This analysis includes the human capital factor because as workers become more highly trained
and acquire more skills they are able to carry out their tasks more efficiently.
3 Data
The data used is from the Spanish Technological Innovation Panel (henceforth, PITEC), which
provides information on the technological innovation activities of Spanish firms for the period
2003-2011. PITEC was set up by the Spanish Foundation for Science and Technology (FE-
CYT), the National Institute of Statistics (INE) and the COTEC Foundation with the purpose
of providing data from the Community Innovation Survey (CIS). CIS is formed by the European
Commission, the OECD and the European Economic Area (EEA) Member States and one of
its objectives is to create a database on technological innovation.
7
The PITEC panel’s data is based on a representative selection of firms which allows more
accurate estimates and analyses to be made through repeated observations of economic units.
It allows researchers to observe the evolution of R&D, determine the impact of innovation,
and analyse the different strategies adopted by firms in the introduction of innovations in their
business. The panel consists of four essential samples: (i) firms with 200 or more employees,
(ii) firms with internal expenditure on R&D, (iii) firms with fewer than 200 employees with
external R&D expenditures but no internal R&D, and (iv) firms with fewer than 200 workers
with no innovation expenditures.
The filtering process 1 only considered the industrial and service sectors and firms with twenty
or more employees. Thus the final sample consisted of 37,991 observations for the period 2004
- 2010.
In order to determine whether the effects of cooperation on innovation and productivity vary
with the technology level, we used the Eurostat classification to separate firms by the technol-
ogy level in the sector in which each firm operates. This classification grouped the firms by
sectors as follows: (i) High and medium-high-tech industries (HTI), (ii) Medium-low and low-
tech industries (LTI), (iii) Knowledge-intensive services (KIS) and (iv) Non knowledge-intensive
services (Non-KIS).
4 Empirical Implementation
4.1 Empirical model
In the first stage, the cooperation equation was estimated using a Probit model of the maximum
likelihood, using delayed explanatory variables for one time period. The estimated predicted
value was then taken to estimate the research equations.1This filtering process also involved eliminating observations that included some kind of incident (problems
of confidentiality or takeovers and mergers, etc.) and those with an obvious anomaly (such as null sales).
8
The determinants of a firm’s cooperation in innovative activities are: firm size, belonging to a
group, R&D expenditure, a dummy variable indicating whether the firm received public funding
for R&D activities, a dummy variable for foreign firms, a dummy variable indicating whether
the firm protected its innovations, a dummy variable indicating whether the firm exports, a
dummy variable indicating whether the firm has cooperated in the past, and a set of dummy
variables.
In the second stage, the system of research equations was estimated as a generalized Tobit
model in a two-step process using the Heckman procedure; thus it is assumed that the corre-
lated error ei and εi are jointly normally distributed.
The determinants of a firm’s engagement in R&D activities are: firm size, belonging to a group,
investment intensity per employee, dummy variables indicating whether the firm received public
funding for R&D activities, a dummy variable for foreign firms, a dummy variable indicating
whether the firm protected its innovations, a dummy variable indicating whether the firm ex-
ports, and market share. The explanatory variables of R&D intensity are the same as for the
engagement in R&D equation and also add a set of dummy variables for factors hampering in-
novations, a set of dummy variables for the different sources of information, and the predicted
value of cooperation 2 obtained in equation (1) as a proxy of the probability of cooperating in
innovative activities.
In the third stage, two kinds of innovation output were distinguished: process and product
innovation. Each was measured by a dummy variable equal to 1 if the firm introduced at least
one process (product) innovation. Thus, the innovation production function was estimated
using a bivariate probit 3 by maximum likelihood, assuming both variables to be highly corre-
lated. The determinants included the predicted value of R&D intensity obtained in equation
(3) as a proxy for innovative effort (r∗i ) and a set of variables (Xi): firm size, belonging to
a group, protection methods used, export activity, a dummy variable indicating whether the
firm received public funding for R&D activities, investment intensity, market share, sources of2The cooperation variable is only available for innovative firms, which is why it could not be included in the
equation (2).3In this regard, the process followed recent literature such as Hall et al. (2009), Masso and Valther (2008)
and Piga and Vivarelli (2002).
9
information, and factors hampering innovations.
In the final stage, the labour production function was estimated using a fixed effect model
for panel data. Labour productivity depends on the innovation output (process and product
innovation) predicted in equation (4), investment intensity, human capital and firm size.A con-
trol was also established for unobserved manufacturing characteristics and for firm size in all
the equations.
In the econometric analysis, the CDM model provides a solution for the problems of biases
of selectivity and endogeneity. In the case of selectivity, it would be inappropriate to consider
innovative firms alone because the firms are not randomly drawn from the population and a
selection bias may thus arise. The CDM model takes this situation into account by including a
selection equation in the second step. In the case of endogeneity, using predicted values instead
of the realized values is a way of dealing with this potential bias in the various stages of the
process. It is possible that unobservable firm characteristics can affect both their innovative
effort (R&D expenditure) and their efficiency in producing innovations.
4.2 Descriptive statistics
Table 1 shows the descriptive statistics for the main variables in the model across the different
technology sectors.
Firstly, it can be seen that the proportion of firms which decide to cooperate in innovative
activities is higher in high-tech firms than it is in low-tech firms, both in the manufacturing
and service sectors, especially in knowledge-intensive services (52%) and in high-tech industries
(approximately 40%). It is also noticeable that firms continuous cooperation in R&D activi-
ties for at least in four years is greater in the more advanced firms in both sectors. In both
variables, service sector firms show more cooperation and persistence than manufacturing firms.
Productivity is similar among high-tech and low-tech manufacturers, and is the same for the
service sector. Investment intensity is higher in high-tech firms than it is in low-tech firms for
both the manufacturing and service sectors. In the case of human capital, the average percent-
10
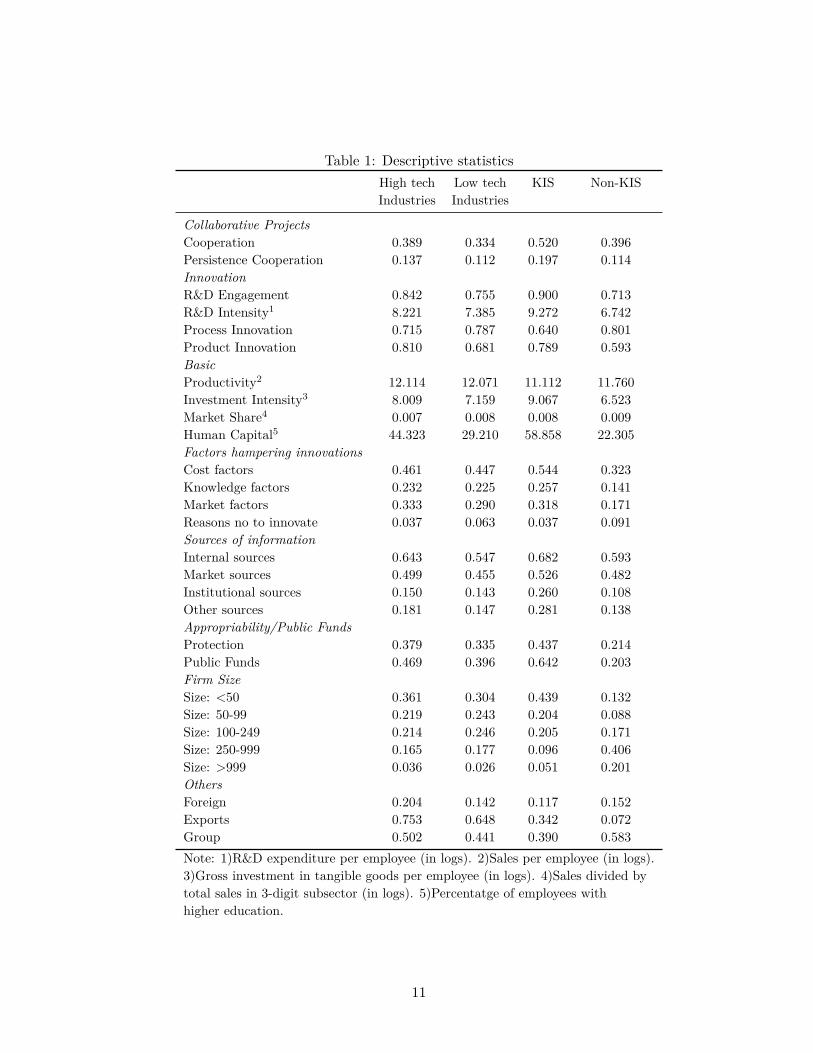
Table 1: Descriptive statisticsHigh tech Low tech KIS Non-KISIndustries Industries
Collaborative ProjectsCooperation 0.389 0.334 0.520 0.396Persistence Cooperation 0.137 0.112 0.197 0.114InnovationR&D Engagement 0.842 0.755 0.900 0.713R&D Intensity1 8.221 7.385 9.272 6.742Process Innovation 0.715 0.787 0.640 0.801Product Innovation 0.810 0.681 0.789 0.593BasicProductivity2 12.114 12.071 11.112 11.760Investment Intensity3 8.009 7.159 9.067 6.523Market Share4 0.007 0.008 0.008 0.009Human Capital5 44.323 29.210 58.858 22.305Factors hampering innovationsCost factors 0.461 0.447 0.544 0.323Knowledge factors 0.232 0.225 0.257 0.141Market factors 0.333 0.290 0.318 0.171Reasons no to innovate 0.037 0.063 0.037 0.091Sources of informationInternal sources 0.643 0.547 0.682 0.593Market sources 0.499 0.455 0.526 0.482Institutional sources 0.150 0.143 0.260 0.108Other sources 0.181 0.147 0.281 0.138Appropriability/Public FundsProtection 0.379 0.335 0.437 0.214Public Funds 0.469 0.396 0.642 0.203Firm SizeSize: <50 0.361 0.304 0.439 0.132Size: 50-99 0.219 0.243 0.204 0.088Size: 100-249 0.214 0.246 0.205 0.171Size: 250-999 0.165 0.177 0.096 0.406Size: >999 0.036 0.026 0.051 0.201OthersForeign 0.204 0.142 0.117 0.152Exports 0.753 0.648 0.342 0.072Group 0.502 0.441 0.390 0.583Note: 1)R&D expenditure per employee (in logs). 2)Sales per employee (in logs).3)Gross investment in tangible goods per employee (in logs). 4)Sales divided bytotal sales in 3-digit subsector (in logs). 5)Percentatge of employees withhigher education.
11
age of employees with higher education is much higher in high-tech firms than it is in low-tech
firms in both manufacturing and service sectors. Specifically, in knowledge-intensive services
(high-tech industries), approximately 59% (44%) of employees have higher education.
The decision to engage in R&D activities is higher in high-tech firms than it is in low-tech
firms. In particular, in knowledge-intensive services 90% of firms decide to engage in R&D
activities. The R&D intensity is also greater in high-tech than it is in low-tech firms. It can
be seen that the firms with more product innovations are the more advanced firms; however,
in the case of process innovations the figure is highest for low-tech firms.
With regard to the protection methods used, it seems that this factor is similar across all tech-
nology levels, with the exception of the knowledge-intensive service sector where it is higher.
In terms of public funding, the number of firms that receive public support is much higher in
high-tech sectors. Internal and market sources of information are the most important sources
of information for innovation activities across all technology levels. Among the factors that
hamper innovation, the most important are cost and market factors.
With regard to firm size, it can be seen that the manufacturing and knowledge-intensive service
sectors are dominated by small firms (firms with fewer than 50 employees), followed by firms
with between 100 and 249 employees.
4.3 Results
4.3.1 Cooperation
Table 2 presents the results of the estimated equations of cooperation in innovative activi-
ties. The results are presented for each technology sector in order to observe any differences.
The numbers reported are the marginal effects of the variables considered as determinants
of cooperation agreements. Almost all the variables are dummies except for R&D intensity.
Thus they take the value 1 when the factor is important to the firm and the value zero if it is
unimportant. Therefore, the marginal effect is that of changing the dummy variable from 0 to 1.
12
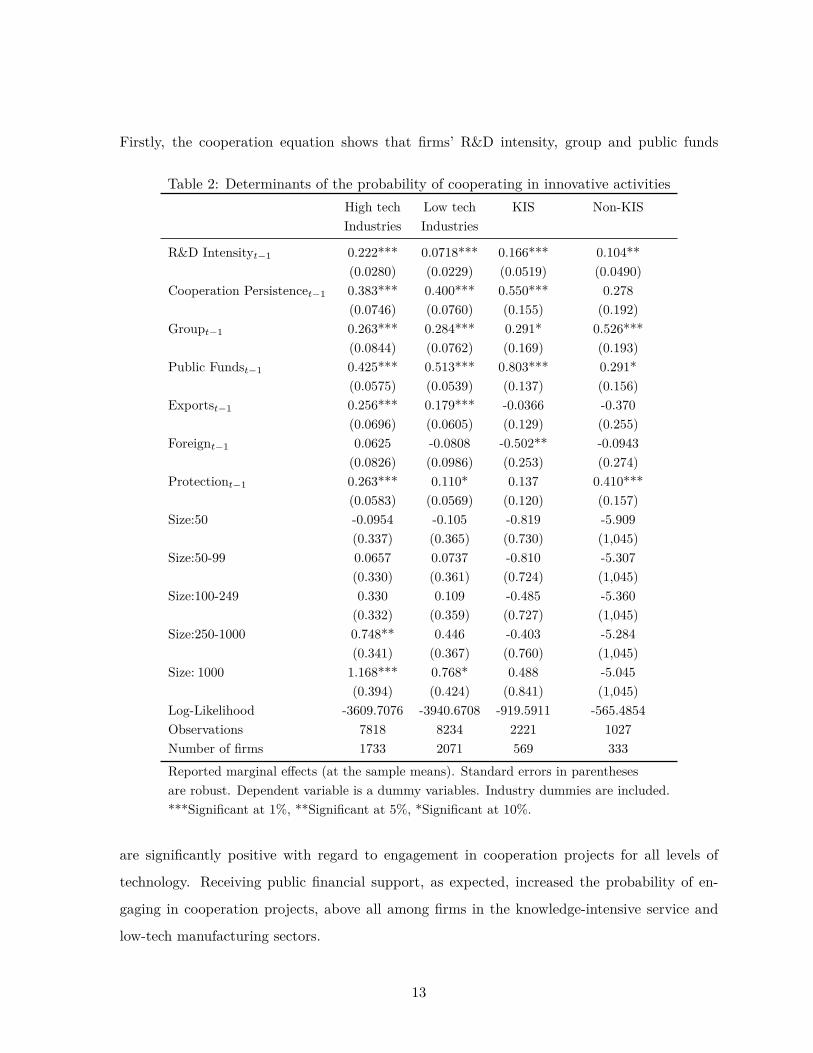
Firstly, the cooperation equation shows that firms’ R&D intensity, group and public funds
Table 2: Determinants of the probability of cooperating in innovative activitiesHigh tech Low tech KIS Non-KISIndustries Industries
R&D Intensityt−1 0.222*** 0.0718*** 0.166*** 0.104**(0.0280) (0.0229) (0.0519) (0.0490)
Cooperation Persistencet−1 0.383*** 0.400*** 0.550*** 0.278(0.0746) (0.0760) (0.155) (0.192)
Groupt−1 0.263*** 0.284*** 0.291* 0.526***(0.0844) (0.0762) (0.169) (0.193)
Public Fundst−1 0.425*** 0.513*** 0.803*** 0.291*(0.0575) (0.0539) (0.137) (0.156)
Exportst−1 0.256*** 0.179*** -0.0366 -0.370(0.0696) (0.0605) (0.129) (0.255)
Foreignt−1 0.0625 -0.0808 -0.502** -0.0943(0.0826) (0.0986) (0.253) (0.274)
Protectiont−1 0.263*** 0.110* 0.137 0.410***(0.0583) (0.0569) (0.120) (0.157)
Size:50 -0.0954 -0.105 -0.819 -5.909(0.337) (0.365) (0.730) (1,045)
Size:50-99 0.0657 0.0737 -0.810 -5.307(0.330) (0.361) (0.724) (1,045)
Size:100-249 0.330 0.109 -0.485 -5.360(0.332) (0.359) (0.727) (1,045)
Size:250-1000 0.748** 0.446 -0.403 -5.284(0.341) (0.367) (0.760) (1,045)
Size: 1000 1.168*** 0.768* 0.488 -5.045(0.394) (0.424) (0.841) (1,045)
Log-Likelihood -3609.7076 -3940.6708 -919.5911 -565.4854Observations 7818 8234 2221 1027Number of firms 1733 2071 569 333Reported marginal effects (at the sample means). Standard errors in parenthesesare robust. Dependent variable is a dummy variables. Industry dummies are included.***Significant at 1%, **Significant at 5%, *Significant at 10%.
are significantly positive with regard to engagement in cooperation projects for all levels of
technology. Receiving public financial support, as expected, increased the probability of en-
gaging in cooperation projects, above all among firms in the knowledge-intensive service and
low-tech manufacturing sectors.
13
These results show that protecting innovative output is associated with a higher probabil-
ity of cooperation, except in the case of knowledge-intensive service sectors. Also, the effect of
prior experience in cooperation projects in the last three years is positive in all levels of tech-
nology, except in non-knowledge-intensive service sectors. To define the competitive position
of a firm, the fact of having a foreign market is taken into account, which has a significantly
positive effect on engagement in cooperation projects for knowledge-intensive service firms only.
The effect on participation in cooperation projects depends on the size of firm to which they
belong. Being a high-tech manufacturing firm with 250 or more employees or being a low-
tech manufacturing firm with 1,000 or more employees has a significantly positive effect on
cooperation.
4.3.2 Research
Table 3 presents the results for equations (2) and (3). This table show the estimates of the
determinants of whether a firm engages in R&D activities and the intensity of R&D investment,
conditional upon a firm engaging in R&D. The results are presented for each technology sector
in order to observe any differences.
The numbers reported in table 3 are marginal effects. Almost all the variables are dummies
except for capital intensity and market share. Thus they take the value 1 when the factor is
important to the firm and the value zero if it is unimportant. Therefore the marginal effect is
that of changing the dummy variable from 0 to 1.
Considering the coefficient of the predicted value of cooperation, it shows that fifty per cent
of the manufacturing firms which cooperate are more likely to report engaging in R&D than
firms which do not cooperate. Group membership does not seem to influence the decision to
engage in R&D activities, but it is a significant factor in terms of R&D intensity, especially in
manufacturing firms.
Public funding for innovation activities only shows an impact on the decision to engage in
R&D activities for knowledge-intensive service firms, with a positive impact. For instance,
14
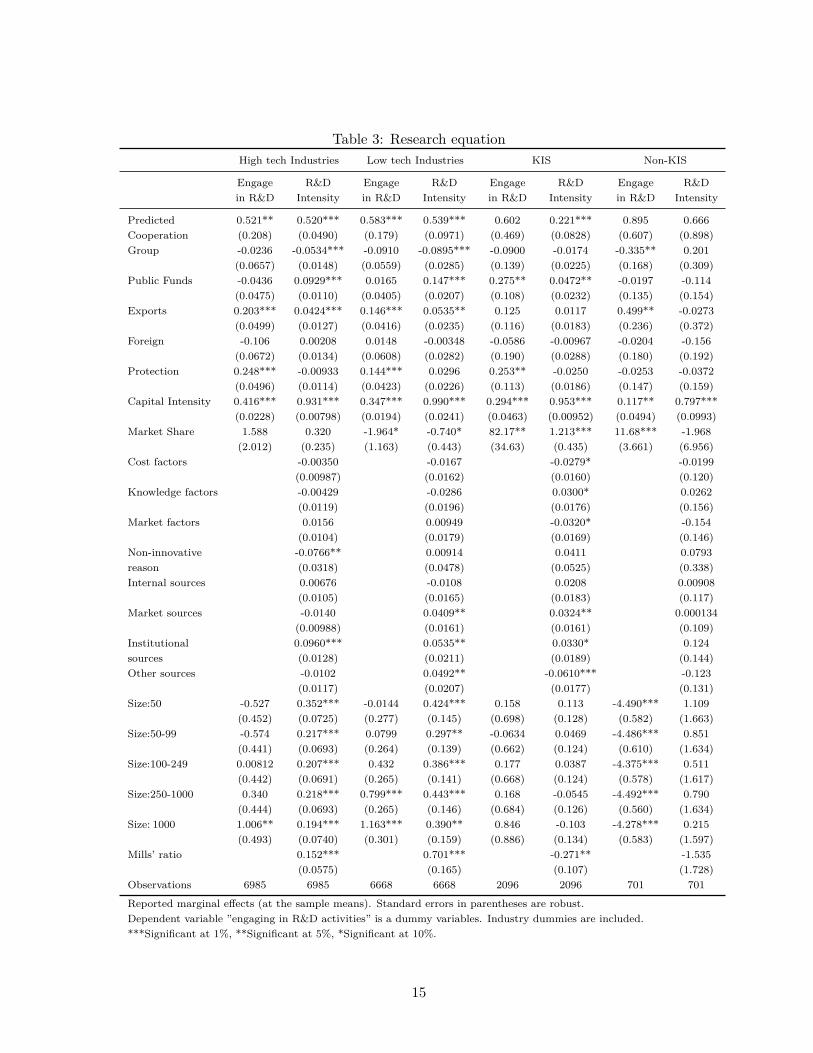
Table 3: Research equationHigh tech Industries Low tech Industries KIS Non-KIS
Engage R&D Engage R&D Engage R&D Engage R&Din R&D Intensity in R&D Intensity in R&D Intensity in R&D Intensity
Predicted 0.521** 0.520*** 0.583*** 0.539*** 0.602 0.221*** 0.895 0.666Cooperation (0.208) (0.0490) (0.179) (0.0971) (0.469) (0.0828) (0.607) (0.898)Group -0.0236 -0.0534*** -0.0910 -0.0895*** -0.0900 -0.0174 -0.335** 0.201
(0.0657) (0.0148) (0.0559) (0.0285) (0.139) (0.0225) (0.168) (0.309)Public Funds -0.0436 0.0929*** 0.0165 0.147*** 0.275** 0.0472** -0.0197 -0.114
(0.0475) (0.0110) (0.0405) (0.0207) (0.108) (0.0232) (0.135) (0.154)Exports 0.203*** 0.0424*** 0.146*** 0.0535** 0.125 0.0117 0.499** -0.0273
(0.0499) (0.0127) (0.0416) (0.0235) (0.116) (0.0183) (0.236) (0.372)Foreign -0.106 0.00208 0.0148 -0.00348 -0.0586 -0.00967 -0.0204 -0.156
(0.0672) (0.0134) (0.0608) (0.0282) (0.190) (0.0288) (0.180) (0.192)Protection 0.248*** -0.00933 0.144*** 0.0296 0.253** -0.0250 -0.0253 -0.0372
(0.0496) (0.0114) (0.0423) (0.0226) (0.113) (0.0186) (0.147) (0.159)Capital Intensity 0.416*** 0.931*** 0.347*** 0.990*** 0.294*** 0.953*** 0.117** 0.797***
(0.0228) (0.00798) (0.0194) (0.0241) (0.0463) (0.00952) (0.0494) (0.0993)Market Share 1.588 0.320 -1.964* -0.740* 82.17** 1.213*** 11.68*** -1.968
(2.012) (0.235) (1.163) (0.443) (34.63) (0.435) (3.661) (6.956)Cost factors -0.00350 -0.0167 -0.0279* -0.0199
(0.00987) (0.0162) (0.0160) (0.120)Knowledge factors -0.00429 -0.0286 0.0300* 0.0262
(0.0119) (0.0196) (0.0176) (0.156)Market factors 0.0156 0.00949 -0.0320* -0.154
(0.0104) (0.0179) (0.0169) (0.146)Non-innovative -0.0766** 0.00914 0.0411 0.0793reason (0.0318) (0.0478) (0.0525) (0.338)Internal sources 0.00676 -0.0108 0.0208 0.00908
(0.0105) (0.0165) (0.0183) (0.117)Market sources -0.0140 0.0409** 0.0324** 0.000134
(0.00988) (0.0161) (0.0161) (0.109)Institutional 0.0960*** 0.0535** 0.0330* 0.124sources (0.0128) (0.0211) (0.0189) (0.144)Other sources -0.0102 0.0492** -0.0610*** -0.123
(0.0117) (0.0207) (0.0177) (0.131)Size:50 -0.527 0.352*** -0.0144 0.424*** 0.158 0.113 -4.490*** 1.109
(0.452) (0.0725) (0.277) (0.145) (0.698) (0.128) (0.582) (1.663)Size:50-99 -0.574 0.217*** 0.0799 0.297** -0.0634 0.0469 -4.486*** 0.851
(0.441) (0.0693) (0.264) (0.139) (0.662) (0.124) (0.610) (1.634)Size:100-249 0.00812 0.207*** 0.432 0.386*** 0.177 0.0387 -4.375*** 0.511
(0.442) (0.0691) (0.265) (0.141) (0.668) (0.124) (0.578) (1.617)Size:250-1000 0.340 0.218*** 0.799*** 0.443*** 0.168 -0.0545 -4.492*** 0.790
(0.444) (0.0693) (0.265) (0.146) (0.684) (0.126) (0.560) (1.634)Size: 1000 1.006** 0.194*** 1.163*** 0.390** 0.846 -0.103 -4.278*** 0.215
(0.493) (0.0740) (0.301) (0.159) (0.886) (0.134) (0.583) (1.597)Mills’ ratio 0.152*** 0.701*** -0.271** -1.535
(0.0575) (0.165) (0.107) (1.728)Observations 6985 6985 6668 6668 2096 2096 701 701
Reported marginal effects (at the sample means). Standard errors in parentheses are robust.Dependent variable ”engaging in R&D activities” is a dummy variables. Industry dummies are included.***Significant at 1%, **Significant at 5%, *Significant at 10%.
15
knowledge-intensive service firms that received public funding were approximately 30% more
likely to engage in R&D than firms that did not receive public subsidies. Public funding, in
manufacturing and knowledge-intensive service firms, also has a positive impact on R&D in-
tensity. It shows that low-tech industries spend more on R&D if they receive public funding.
Manufacturing firms that operate in international markets are more likely to engage in R&D,
with a positive impact on R&D intensity. Also, manufacturing firms that export are more likely
to engage and invest in R&D.
All firms, except non-knowledge-intensive service firms, that use methods to protect innovations
are more likely to engage in R&D, but it does not seem to influence their R&D intensity.
The most important sources of information on R&D intensity are universities, public research
organizations and technology centres. Their impact is more positive for manufacturing firms
than for service firms. Market and other sources also show a positive impact on R&D intensity
for low-tech industries and knowledge-intensive service firms.
The results in relation to investment intensity show a positive impact on the decision to engage
in R&D, and a very positive impact on R&D intensity. The size of manufacturing firms also
has a positive effect on participation in R&D, with larger firms being more likely to engage and
invest in R&D.
4.3.3 Innovation
Table 4 shows the estimates of the knowledge production function. The first four columns show
the results for product innovation and the last four columns those for process innovation. The
numbers reported are again marginal effects evaluated at the sample means.
All of the variables, except predicted R&D intensity, capital intensity and market share, are
dummies; thus the coefficients show the effect of changing the dummy variable from 0 to 1.
16
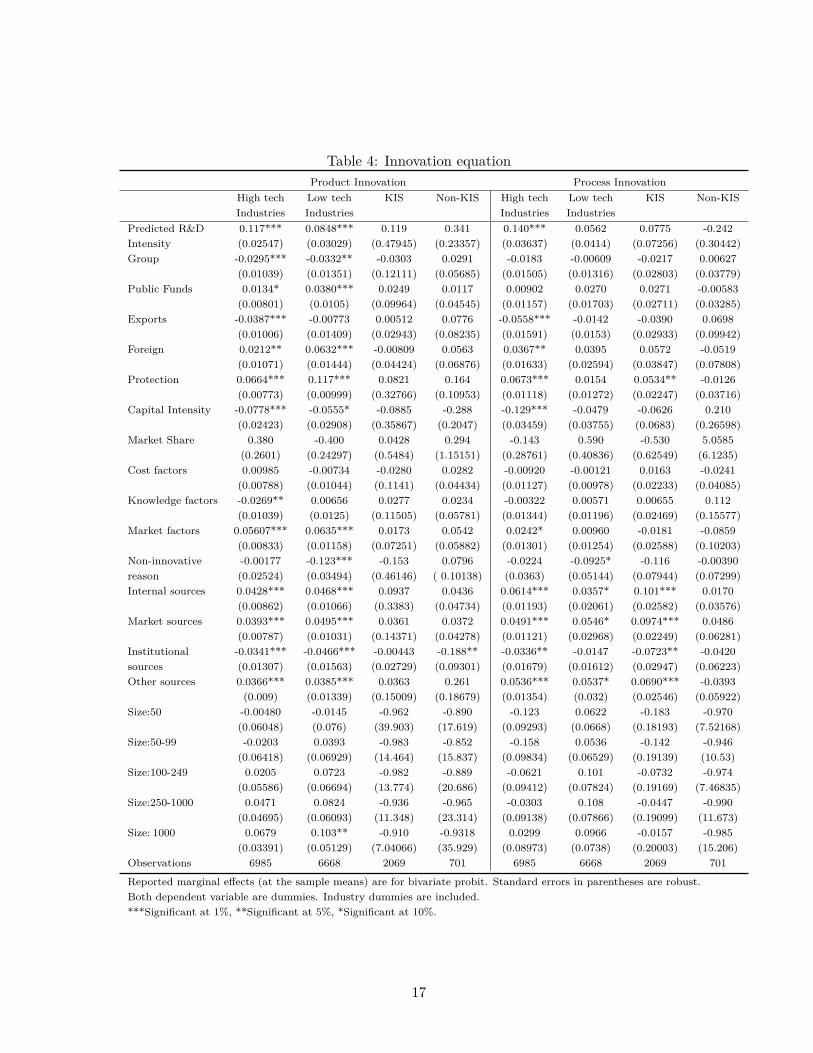
Table 4: Innovation equationProduct Innovation Process Innovation
High tech Low tech KIS Non-KIS High tech Low tech KIS Non-KISIndustries Industries Industries Industries
Predicted R&D 0.117*** 0.0848*** 0.119 0.341 0.140*** 0.0562 0.0775 -0.242Intensity (0.02547) (0.03029) (0.47945) (0.23357) (0.03637) (0.0414) (0.07256) (0.30442)Group -0.0295*** -0.0332** -0.0303 0.0291 -0.0183 -0.00609 -0.0217 0.00627
(0.01039) (0.01351) (0.12111) (0.05685) (0.01505) (0.01316) (0.02803) (0.03779)Public Funds 0.0134* 0.0380*** 0.0249 0.0117 0.00902 0.0270 0.0271 -0.00583
(0.00801) (0.0105) (0.09964) (0.04545) (0.01157) (0.01703) (0.02711) (0.03285)Exports -0.0387*** -0.00773 0.00512 0.0776 -0.0558*** -0.0142 -0.0390 0.0698
(0.01006) (0.01409) (0.02943) (0.08235) (0.01591) (0.0153) (0.02933) (0.09942)Foreign 0.0212** 0.0632*** -0.00809 0.0563 0.0367** 0.0395 0.0572 -0.0519
(0.01071) (0.01444) (0.04424) (0.06876) (0.01633) (0.02594) (0.03847) (0.07808)Protection 0.0664*** 0.117*** 0.0821 0.164 0.0673*** 0.0154 0.0534** -0.0126
(0.00773) (0.00999) (0.32766) (0.10953) (0.01118) (0.01272) (0.02247) (0.03716)Capital Intensity -0.0778*** -0.0555* -0.0885 -0.288 -0.129*** -0.0479 -0.0626 0.210
(0.02423) (0.02908) (0.35867) (0.2047) (0.03459) (0.03755) (0.0683) (0.26598)Market Share 0.380 -0.400 0.0428 0.294 -0.143 0.590 -0.530 5.0585
(0.2601) (0.24297) (0.5484) (1.15151) (0.28761) (0.40836) (0.62549) (6.1235)Cost factors 0.00985 -0.00734 -0.0280 0.0282 -0.00920 -0.00121 0.0163 -0.0241
(0.00788) (0.01044) (0.1141) (0.04434) (0.01127) (0.00978) (0.02233) (0.04085)Knowledge factors -0.0269** 0.00656 0.0277 0.0234 -0.00322 0.00571 0.00655 0.112
(0.01039) (0.0125) (0.11505) (0.05781) (0.01344) (0.01196) (0.02469) (0.15577)Market factors 0.05607*** 0.0635*** 0.0173 0.0542 0.0242* 0.00960 -0.0181 -0.0859
(0.00833) (0.01158) (0.07251) (0.05882) (0.01301) (0.01254) (0.02588) (0.10203)Non-innovative -0.00177 -0.123*** -0.153 0.0796 -0.0224 -0.0925* -0.116 -0.00390reason (0.02524) (0.03494) (0.46146) ( 0.10138) (0.0363) (0.05144) (0.07944) (0.07299)Internal sources 0.0428*** 0.0468*** 0.0937 0.0436 0.0614*** 0.0357* 0.101*** 0.0170
(0.00862) (0.01066) (0.3383) (0.04734) (0.01193) (0.02061) (0.02582) (0.03576)Market sources 0.0393*** 0.0495*** 0.0361 0.0372 0.0491*** 0.0546* 0.0974*** 0.0486
(0.00787) (0.01031) (0.14371) (0.04278) (0.01121) (0.02968) (0.02249) (0.06281)Institutional -0.0341*** -0.0466*** -0.00443 -0.188** -0.0336** -0.0147 -0.0723** -0.0420sources (0.01307) (0.01563) (0.02729) (0.09301) (0.01679) (0.01612) (0.02947) (0.06223)Other sources 0.0366*** 0.0385*** 0.0363 0.261 0.0536*** 0.0537* 0.0690*** -0.0393
(0.009) (0.01339) (0.15009) (0.18679) (0.01354) (0.032) (0.02546) (0.05922)Size:50 -0.00480 -0.0145 -0.962 -0.890 -0.123 0.0622 -0.183 -0.970
(0.06048) (0.076) (39.903) (17.619) (0.09293) (0.0668) (0.18193) (7.52168)Size:50-99 -0.0203 0.0393 -0.983 -0.852 -0.158 0.0536 -0.142 -0.946
(0.06418) (0.06929) (14.464) (15.837) (0.09834) (0.06529) (0.19139) (10.53)Size:100-249 0.0205 0.0723 -0.982 -0.889 -0.0621 0.101 -0.0732 -0.974
(0.05586) (0.06694) (13.774) (20.686) (0.09412) (0.07824) (0.19169) (7.46835)Size:250-1000 0.0471 0.0824 -0.936 -0.965 -0.0303 0.108 -0.0447 -0.990
(0.04695) (0.06093) (11.348) (23.314) (0.09138) (0.07866) (0.19099) (11.673)Size: 1000 0.0679 0.103** -0.910 -0.9318 0.0299 0.0966 -0.0157 -0.985
(0.03391) (0.05129) (7.04066) (35.929) (0.08973) (0.0738) (0.20003) (15.206)Observations 6985 6668 2069 701 6985 6668 2069 701
Reported marginal effects (at the sample means) are for bivariate probit. Standard errors in parentheses are robust.Both dependent variable are dummies. Industry dummies are included.***Significant at 1%, **Significant at 5%, *Significant at 10%.
17
On analysing the results, it can be observed that the R&D intensity predicted by the previous
equation has a positive and significant impact for high-tech manufacturing firms on product
and process innovations and for low-tech manufacturing firms on product innovations only. If
the differences between product and process innovations are analysed, it can be seen that the
effect is higher for process innovations in high-tech industries. If a comparison is made between
technology levels, it can be seen that, in the manufacturing sector, high-tech firms are more
likely than low-tech firms to report an innovation, given their R&D intensity. In the case of the
service sector, the results have a positive impact but are not significant for knowledge-intensive
service firms.
Manufacturing firms that operate in international markets are likely to generate product in-
novations. Group membership and firms that export have a negative and significant impact
for manufacturing firms, and protection methods and subsidies are influential in obtaining a
product innovation for manufacturing firms.
As expected, the most important sources of information for both types of innovation are internal
(i.e. within the firm or group). Market and other information sources also have a positive and
significant impact, but less so than internal sources. Sources of information from universities,
public research organizations and technology centres have a negative and significant impact on
both kinds of innovation.
4.3.4 Productivity
Table 5 shows the estimates of the production function equation. This analysed the effect of
innovation on a firm’s productivity. In this case, the coefficients are elasticities, because the de-
pendent variable being analysed is the logarithm of sales per employee. The first four columns
report the results when the predicted values of product are included, while the last four columns
show the result for process innovations.
The findings show that both types of innovation have a positive effect on productivity for
all technology levels, except the non-knowledge-intensive service sectors. It was also observed
18
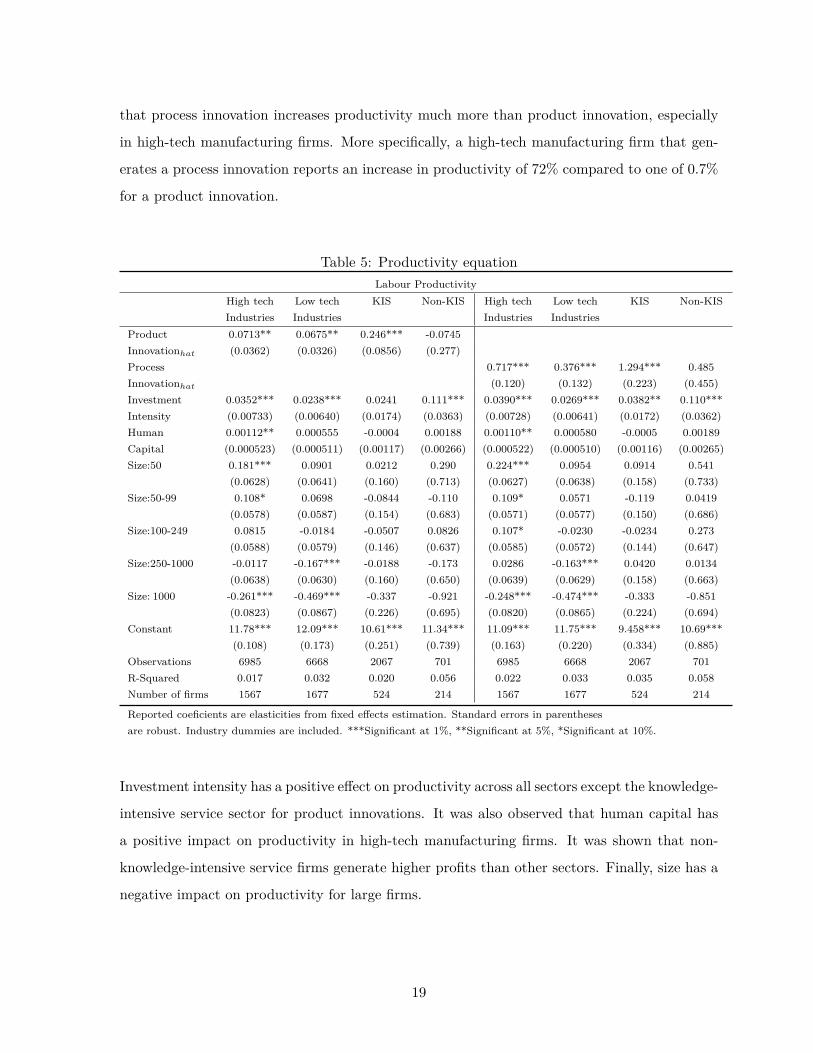
that process innovation increases productivity much more than product innovation, especially
in high-tech manufacturing firms. More specifically, a high-tech manufacturing firm that gen-
erates a process innovation reports an increase in productivity of 72% compared to one of 0.7%
for a product innovation.
Table 5: Productivity equationLabour Productivity
High tech Low tech KIS Non-KIS High tech Low tech KIS Non-KISIndustries Industries Industries Industries
Product 0.0713** 0.0675** 0.246*** -0.0745Innovationhat (0.0362) (0.0326) (0.0856) (0.277)Process 0.717*** 0.376*** 1.294*** 0.485Innovationhat (0.120) (0.132) (0.223) (0.455)Investment 0.0352*** 0.0238*** 0.0241 0.111*** 0.0390*** 0.0269*** 0.0382** 0.110***Intensity (0.00733) (0.00640) (0.0174) (0.0363) (0.00728) (0.00641) (0.0172) (0.0362)Human 0.00112** 0.000555 -0.0004 0.00188 0.00110** 0.000580 -0.0005 0.00189Capital (0.000523) (0.000511) (0.00117) (0.00266) (0.000522) (0.000510) (0.00116) (0.00265)Size:50 0.181*** 0.0901 0.0212 0.290 0.224*** 0.0954 0.0914 0.541
(0.0628) (0.0641) (0.160) (0.713) (0.0627) (0.0638) (0.158) (0.733)Size:50-99 0.108* 0.0698 -0.0844 -0.110 0.109* 0.0571 -0.119 0.0419
(0.0578) (0.0587) (0.154) (0.683) (0.0571) (0.0577) (0.150) (0.686)Size:100-249 0.0815 -0.0184 -0.0507 0.0826 0.107* -0.0230 -0.0234 0.273
(0.0588) (0.0579) (0.146) (0.637) (0.0585) (0.0572) (0.144) (0.647)Size:250-1000 -0.0117 -0.167*** -0.0188 -0.173 0.0286 -0.163*** 0.0420 0.0134
(0.0638) (0.0630) (0.160) (0.650) (0.0639) (0.0629) (0.158) (0.663)Size: 1000 -0.261*** -0.469*** -0.337 -0.921 -0.248*** -0.474*** -0.333 -0.851
(0.0823) (0.0867) (0.226) (0.695) (0.0820) (0.0865) (0.224) (0.694)Constant 11.78*** 12.09*** 10.61*** 11.34*** 11.09*** 11.75*** 9.458*** 10.69***
(0.108) (0.173) (0.251) (0.739) (0.163) (0.220) (0.334) (0.885)Observations 6985 6668 2067 701 6985 6668 2067 701R-Squared 0.017 0.032 0.020 0.056 0.022 0.033 0.035 0.058Number of firms 1567 1677 524 214 1567 1677 524 214
Reported coeficients are elasticities from fixed effects estimation. Standard errors in parenthesesare robust. Industry dummies are included. ***Significant at 1%, **Significant at 5%, *Significant at 10%.
Investment intensity has a positive effect on productivity across all sectors except the knowledge-
intensive service sector for product innovations. It was also observed that human capital has
a positive impact on productivity in high-tech manufacturing firms. It was shown that non-
knowledge-intensive service firms generate higher profits than other sectors. Finally, size has a
negative impact on productivity for large firms.
19
5 Conclusions
This paper has investigated the causes of innovation and how they affect productivity at a cor-
porate level using the extended CDM model. The first goal was to determine the factors that
affect a firm’s decision to engage in cooperation projects and how this cooperation affects fu-
ture R&D expenditure. The second goal was to determine the relationship between innovation
and its productivity, comparing the technology level of the firm. For this paper, the PITEC
database for the period 2004-2010 was used and the sample was divided into four subsamples
depending on the technology level of the firm.
The structural model describes the link between the determinants of probability of partici-
pation in cooperation agreements, R&D expenditure, innovation output (product and process)
and productivity. In this particular case, it can be demonstrated that firms which decided to
cooperate spent more on R&D, that this investment in R&D affected innovation output and
that, in turn, this output had a positive impact on the firm’s productivity.
The results are consistent with other studies and show that the main determinants of co-
operation in innovative activities are public funding, whether the firm has already cooperated
in the last four years, and the use of protection methods.
Cooperation has a clearly positive effect on the decision to engage in R&D activities for man-
ufacturing and knowledge-intensive service firms; therefore, collaboration projects increase the
probability of participating in R&D activities. These findings answer the main question of the
paper, the conclusion being that cooperation agreements generate continuous investments in
R&D. The main determinants that have a positive impact on engagement in R&D activities
are the use of protection methods, export activities by manufacturing firms, and investment
intensity. After a firm decides to participate in R&D projects, the intensity of these activities
has a positive impact on investment intensity for all sectors, subsidies for all sectors except non-
knowledge-intensive service sectors, and exports for all sectors apart from knowledge-intensive
service sectors. Additionally, market share has a positive impact on R&D expenditure for low-
tech manufacturing and knowledge-intensive service sectors.
20
As expected, manufacturing firms that spend more on R&D per employee are more likely to
generate innovations. However, in contrast to previous studies, the impact is greater in relation
to process innovation than it is to product innovation.
In the case of productivity, the results show that generating a product or process innovation has
a positive effect on productivity for all technology levels except for the non-knowledge-intensive
service sector. Specifically, process innovation increases productivity much more than product
innovation, especially in high-tech manufacturing firms.
21
6 References
Amir,R.; Evstigneev,I.; and Wooders, J. (2003). NonCooperative versus cooperative R&D with
endogenous spillover rates. Games and Economic Behaviour. 42 (2), 183207.
Bayona, C.; Garcıa-Marco, T.; and Huerta, E. (2001). Firm’s motivations for cooperative R&D:
an empirical analysis of Spanish firms. Research Policy. 30 (8), 12891307.
Becker, W. and Dietz, J. (2004). R&D Cooperation and Innovation Activities of Firms -
Evidence for the German Manufacturing Industry -. Research Policy. 33 (2), 209223.
Belderbos,R.; Carree,M. and Lokshin,B. (2004). Cooperative R&D and firm performance.
Research Policy. 33 (10), 14771492.
Benavente, J.M. (2006). The role of research and innovation in promoting productivity in chile,
Economics of Innovation and New Technology, Taylor and Francis Journals, vol. 15(4-5), pages
301-315.
Cassiman, B. and Veugelers, R. (2002). R&D Cooperation and Spillovers: Some Empirical
Evidence from Belgium. The American Economic Review. 92 (4), 11691184.
Cohen, W.M. and Levinthal, D.A (1989). Innovation and Learning: The two faces of R&D.
Research Policy. 37 (8), 128331295.
Crepon,B.; Duguet, E.; and Mairesse,J. (1998). Research, Innovation and Productivity: An
econometric analysis at the firm level. National Bureau of Economic Research. Working Paper,
6696.
De Bondt, R. (1996). Spillovers and Innovative Activities. International Journal of Industrial
Organization. 15, 128.
Dutta, S. and Weiss A.M. (1997). The relationship between a Firm’s Level of Technological
Innovativeness and Its Pattern of Partnership Agreements. Management Science. 43 (3), 343-
356.
Fritsch,M. and Lukas, R. (2001). Who cooperates on R&D?. Research Policy. 30 (2), 297-
312.
Griliches,Z. (1998). Issues in Assessing the Contribution of Research and Development to
22
Productivity Growth. R&D and Productivity: The Econometric Evidence. National Bureau of
Economic Research, Inc. 1745.
Griffith, R.; Harrison, R. and Simpson, H. (2006). The link between product market reform, in-
novation and EU macroeconomic performance. European Economy - Economic Papers 243, Di-
rectorate General Economic and Monetary Affairs (DG ECFIN), European Commission.
Janz, N.; Loof, H. and Peters, B. (2004). Firm Level Innovation and Productivity - Is there
a Common Story Across Countries?, Working Paper Series in Economics and Institutions of
Innovation 24, Royal Institute of Technology, CESIS - Centre of Excellence for Science and
Innovation Studies.
Jefferson G., B. Huamao, G. Xiaojing and Y. Xiaoyun, (2006). R and D Performance in Chinese
Industry. Economics of Innovation and New Technology 15(4/5) pp.345-366.
Kamien, M.I.; Muller, E; and Zang,I. (1992). Research Joint Ventures and R&D Cartels. The
American Economic Review. 82 (5), 12931306.
Kamien, M.I. and Zang, I. (2000). Meet me halfway: research joint ventures and absorptive
capacity. International Journal of Industrial Organization. 18 (7), 9951012.
Loof, H. and Heshmati, A. (2006). On the relationship between innovation and performance:
A sensitivity analysis. Economics of Innovation and New Technology, Taylor and Francis
Journals, vol. 15(4-5), pages 317-344.
Lopez,A. (2008). Determinants of R&D cooperation: Evidence from Spanish manufacturing
firms. International Journal of Industrial Organization. 26 (1), 113136.
Lundvall, B. and Johnson, B. (1994). The Learning Economy. Journal of Industry Studies. 1
(2), 2342.
Mairesse, J.; Mohnen, P.; Zhao, Y. and Zhen, F. (2012). Globalization, Innovation and Produc-
tivity in Manufacturing Firms: A Study of Four Sectors of China. Working Papers DP-2012-10,
Economic Research Institute for ASEAN and East Asia (ERIA).
Miotti, L. and Schwald, F. (2003). Co-operative R&D: Why and with Whom? An Integrated
Framework of Analysis. Research Policy. 32 (8), 14891499.
OECD. (2002). Bencchmarking Industry-Science Relationships. OECD, Publications.
23
OECD. (2005). Oslo Manual: Guidelines for Collecting and Interpreting Innovation.3rd Edition
OECD, Publications
Segarra-Blasco, A. (2010): Innovation and productivity in manufacturing and service firms
in Catalonia: a regional approach, Economics of Innovation and New Technology, 19:3, 233-
258.
Segarra-Blasco, A. and Teruel, M. (2011): Productivity and Rsources: evidence for Catalan
firms, Economics of Innovation and New Technology, 20:8, 727-748
Suzumura, K.(1992). Cooperative and Noncooperative R&D in an Oligopoly with Spillovers.
The American Economic Review. 82 (5), 13071320.
Tether, B.S. (2002). Who co-operates for innovation, and why: An empirical analysis. Research
Policy. 31 (6), 947967.
24
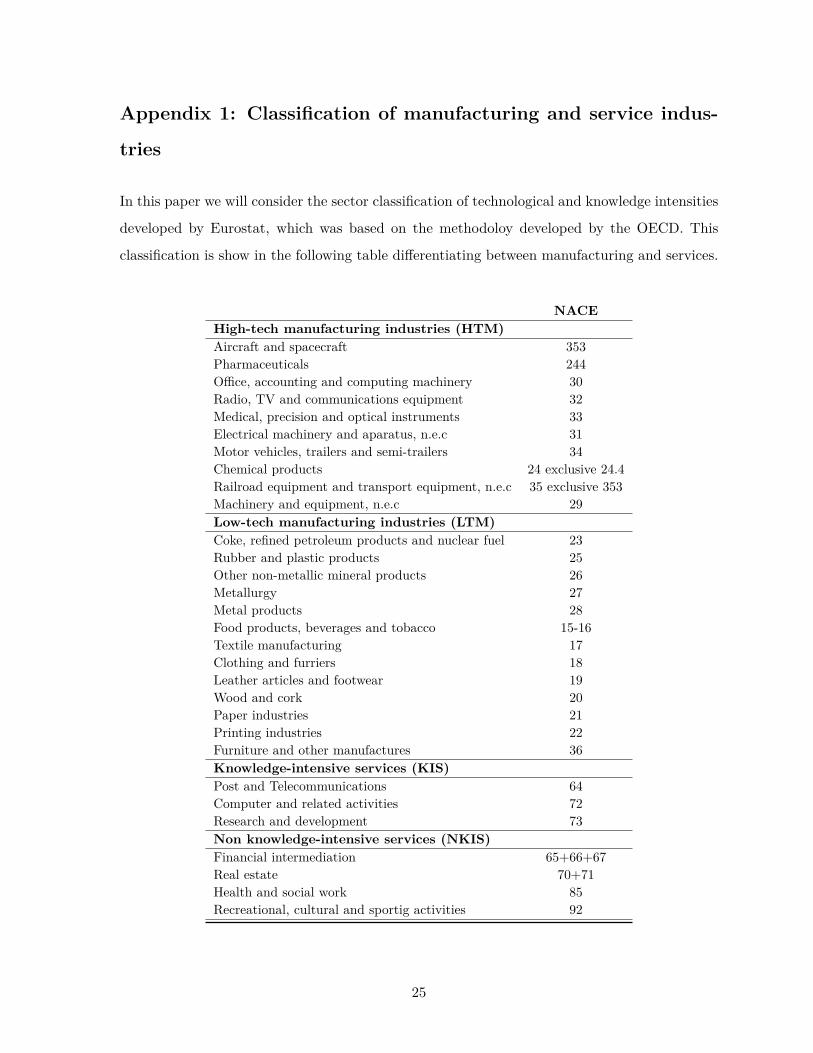
Appendix 1: Classification of manufacturing and service indus-
tries
In this paper we will consider the sector classification of technological and knowledge intensities
developed by Eurostat, which was based on the methodoloy developed by the OECD. This
classification is show in the following table differentiating between manufacturing and services.
NACEHigh-tech manufacturing industries (HTM)Aircraft and spacecraft 353Pharmaceuticals 244Office, accounting and computing machinery 30Radio, TV and communications equipment 32Medical, precision and optical instruments 33Electrical machinery and aparatus, n.e.c 31Motor vehicles, trailers and semi-trailers 34Chemical products 24 exclusive 24.4Railroad equipment and transport equipment, n.e.c 35 exclusive 353Machinery and equipment, n.e.c 29Low-tech manufacturing industries (LTM)Coke, refined petroleum products and nuclear fuel 23Rubber and plastic products 25Other non-metallic mineral products 26Metallurgy 27Metal products 28Food products, beverages and tobacco 15-16Textile manufacturing 17Clothing and furriers 18Leather articles and footwear 19Wood and cork 20Paper industries 21Printing industries 22Furniture and other manufactures 36Knowledge-intensive services (KIS)Post and Telecommunications 64Computer and related activities 72Research and development 73Non knowledge-intensive services (NKIS)Financial intermediation 65+66+67Real estate 70+71Health and social work 85Recreational, cultural and sportig activities 92
25
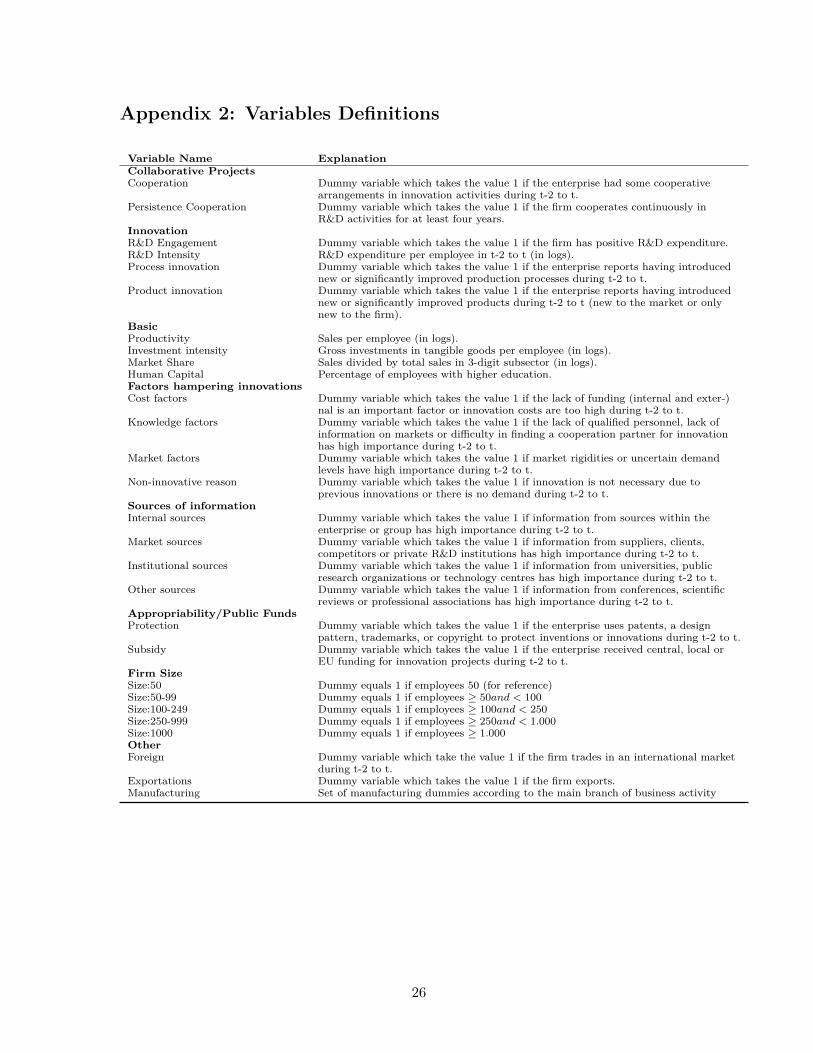
Appendix 2: Variables Definitions
Variable Name ExplanationCollaborative ProjectsCooperation Dummy variable which takes the value 1 if the enterprise had some cooperative
arrangements in innovation activities during t-2 to t.Persistence Cooperation Dummy variable which takes the value 1 if the firm cooperates continuously in
R&D activities for at least four years.InnovationR&D Engagement Dummy variable which takes the value 1 if the firm has positive R&D expenditure.R&D Intensity R&D expenditure per employee in t-2 to t (in logs).Process innovation Dummy variable which takes the value 1 if the enterprise reports having introduced
new or significantly improved production processes during t-2 to t.Product innovation Dummy variable which takes the value 1 if the enterprise reports having introduced
new or significantly improved products during t-2 to t (new to the market or onlynew to the firm).
BasicProductivity Sales per employee (in logs).Investment intensity Gross investments in tangible goods per employee (in logs).Market Share Sales divided by total sales in 3-digit subsector (in logs).Human Capital Percentage of employees with higher education.Factors hampering innovationsCost factors Dummy variable which takes the value 1 if the lack of funding (internal and exter-)
nal is an important factor or innovation costs are too high during t-2 to t.Knowledge factors Dummy variable which takes the value 1 if the lack of qualified personnel, lack of
information on markets or difficulty in finding a cooperation partner for innovationhas high importance during t-2 to t.
Market factors Dummy variable which takes the value 1 if market rigidities or uncertain demandlevels have high importance during t-2 to t.
Non-innovative reason Dummy variable which takes the value 1 if innovation is not necessary due toprevious innovations or there is no demand during t-2 to t.
Sources of informationInternal sources Dummy variable which takes the value 1 if information from sources within the
enterprise or group has high importance during t-2 to t.Market sources Dummy variable which takes the value 1 if information from suppliers, clients,
competitors or private R&D institutions has high importance during t-2 to t.Institutional sources Dummy variable which takes the value 1 if information from universities, public
research organizations or technology centres has high importance during t-2 to t.Other sources Dummy variable which takes the value 1 if information from conferences, scientific
reviews or professional associations has high importance during t-2 to t.Appropriability/Public FundsProtection Dummy variable which takes the value 1 if the enterprise uses patents, a design
pattern, trademarks, or copyright to protect inventions or innovations during t-2 to t.Subsidy Dummy variable which takes the value 1 if the enterprise received central, local or
EU funding for innovation projects during t-2 to t.Firm SizeSize:50 Dummy equals 1 if employees 50 (for reference)Size:50-99 Dummy equals 1 if employees ≥ 50and < 100Size:100-249 Dummy equals 1 if employees ≥ 100and < 250Size:250-999 Dummy equals 1 if employees ≥ 250and < 1.000Size:1000 Dummy equals 1 if employees ≥ 1.000OtherForeign Dummy variable which take the value 1 if the firm trades in an international market
during t-2 to t.Exportations Dummy variable which takes the value 1 if the firm exports.Manufacturing Set of manufacturing dummies according to the main branch of business activity
26
SÈRIE DE DOCUMENTS DE TREBALL DE LA XREAP
2006 CREAP2006-01 Matas, A. (GEAP); Raymond, J.Ll. (GEAP) "Economic development and changes in car ownership patterns" (Juny 2006) CREAP2006-02 Trillas, F. (IEB); Montolio, D. (IEB); Duch, N. (IEB) "Productive efficiency and regulatory reform: The case of Vehicle Inspection Services" (Setembre 2006) CREAP2006-03 Bel, G. (PPRE-IREA); Fageda, X. (PPRE-IREA) "Factors explaining local privatization: A meta-regression analysis" (Octubre 2006) CREAP2006-04 Fernàndez-Villadangos, L. (PPRE-IREA) "Are two-part tariffs efficient when consumers plan ahead?: An empirical study" (Octubre 2006) CREAP2006-05 Artís, M. (AQR-IREA); Ramos, R. (AQR-IREA); Suriñach, J. (AQR-IREA) "Job losses, outsourcing and relocation: Empirical evidence using microdata" (Octubre 2006) CREAP2006-06 Alcañiz, M. (RISC-IREA); Costa, A.; Guillén, M. (RISC-IREA); Luna, C.; Rovira, C. "Calculation of the variance in surveys of the economic climate” (Novembre 2006) CREAP2006-07 Albalate, D. (PPRE-IREA) "Lowering blood alcohol content levels to save lives: The European Experience” (Desembre 2006) CREAP2006-08 Garrido, A. (IEB); Arqué, P. (IEB) “The choice of banking firm: Are the interest rate a significant criteria?” (Desembre 2006) CREAP2006-09 Segarra, A. (GRIT); Teruel-Carrizosa, M. (GRIT) "Productivity growth and competition in spanish manufacturing firms: What has happened in recent years?” (Desembre 2006) CREAP2006-10 Andonova, V.; Díaz-Serrano, Luis. (CREB) "Political institutions and the development of telecommunications” (Desembre 2006) CREAP2006-11 Raymond, J.L.(GEAP); Roig, J.L.. (GEAP) "Capital humano: un análisis comparativo Catalunya-España” (Desembre 2006) CREAP2006-12 Rodríguez, M.(CREB); Stoyanova, A. (CREB) "Changes in the demand for private medical insurance following a shift in tax incentives” (Desembre 2006)
SÈRIE DE DOCUMENTS DE TREBALL DE LA XREAP
CREAP2006-13 Royuela, V. (AQR-IREA); Lambiri, D.; Biagi, B. "Economía urbana y calidad de vida. Una revisión del estado del conocimiento en España” (Desembre 2006) CREAP2006-14 Camarero, M.; Carrion-i-Silvestre, J.LL. (AQR-IREA).;Tamarit, C. "New evidence of the real interest rate parity for OECD countries using panel unit root tests with breaks” (Desembre 2006) CREAP2006-15 Karanassou, M.; Sala, H. (GEAP).;Snower , D. J. "The macroeconomics of the labor market: Three fundamental views” (Desembre 2006) 2007 XREAP2007-01 Castany, L (AQR-IREA); López-Bazo, E. (AQR-IREA).;Moreno , R. (AQR-IREA) "Decomposing differences in total factor productivity across firm size” (Març 2007) XREAP2007-02 Raymond, J. Ll. (GEAP); Roig, J. Ll. (GEAP) “Una propuesta de evaluación de las externalidades de capital humano en la empresa" (Abril 2007) XREAP2007-03 Durán, J. M. (IEB); Esteller, A. (IEB) “An empirical analysis of wealth taxation: Equity vs. Tax compliance” (Juny 2007) XREAP2007-04 Matas, A. (GEAP); Raymond, J.Ll. (GEAP) “Cross-section data, disequilibrium situations and estimated coefficients: evidence from car ownership demand” (Juny 2007) XREAP2007-05 Jofre-Montseny, J. (IEB); Solé-Ollé, A. (IEB) “Tax differentials and agglomeration economies in intraregional firm location” (Juny 2007) XREAP2007-06 Álvarez-Albelo, C. (CREB); Hernández-Martín, R. “Explaining high economic growth in small tourism countries with a dynamic general equilibrium model” (Juliol 2007) XREAP2007-07 Duch, N. (IEB); Montolio, D. (IEB); Mediavilla, M. “Evaluating the impact of public subsidies on a firm’s performance: a quasi-experimental approach” (Juliol 2007) XREAP2007-08 Segarra-Blasco, A. (GRIT) “Innovation sources and productivity: a quantile regression analysis” (Octubre 2007) XREAP2007-09 Albalate, D. (PPRE-IREA) “Shifting death to their Alternatives: The case of Toll Motorways” (Octubre 2007) XREAP2007-10 Segarra-Blasco, A. (GRIT); Garcia-Quevedo, J. (IEB); Teruel-Carrizosa, M. (GRIT) “Barriers to innovation and public policy in catalonia” (Novembre 2007)

SÈRIE DE DOCUMENTS DE TREBALL DE LA XREAP
XREAP2007-11 Bel, G. (PPRE-IREA); Foote, J. “Comparison of recent toll road concession transactions in the United States and France” (Novembre 2007) XREAP2007-12 Segarra-Blasco, A. (GRIT); “Innovation, R&D spillovers and productivity: the role of knowledge-intensive services” (Novembre 2007) XREAP2007-13 Bermúdez Morata, Ll. (RFA-IREA); Guillén Estany, M. (RFA-IREA), Solé Auró, A. (RFA-IREA) “Impacto de la inmigración sobre la esperanza de vida en salud y en discapacidad de la población española” (Novembre 2007) XREAP2007-14 Calaeys, P. (AQR-IREA); Ramos, R. (AQR-IREA), Suriñach, J. (AQR-IREA) “Fiscal sustainability across government tiers” (Desembre 2007) XREAP2007-15 Sánchez Hugalbe, A. (IEB) “Influencia de la inmigración en la elección escolar” (Desembre 2007) 2008 XREAP2008-01 Durán Weitkamp, C. (GRIT); Martín Bofarull, M. (GRIT) ; Pablo Martí, F. “Economic effects of road accessibility in the Pyrenees: User perspective” (Gener 2008) XREAP2008-02 Díaz-Serrano, L.; Stoyanova, A. P. (CREB) “The Causal Relationship between Individual’s Choice Behavior and Self-Reported Satisfaction: the Case of Residential Mobility in the EU” (Març 2008) XREAP2008-03 Matas, A. (GEAP); Raymond, J. L. (GEAP); Roig, J. L. (GEAP) “Car ownership and access to jobs in Spain” (Abril 2008) XREAP2008-04 Bel, G. (PPRE-IREA) ; Fageda, X. (PPRE-IREA) “Privatization and competition in the delivery of local services: An empirical examination of the dual market hypothesis” (Abril 2008) XREAP2008-05 Matas, A. (GEAP); Raymond, J. L. (GEAP); Roig, J. L. (GEAP) “Job accessibility and employment probability” (Maig 2008) XREAP2008-06 Basher, S. A.; Carrión, J. Ll. (AQR-IREA) Deconstructing Shocks and Persistence in OECD Real Exchange Rates (Juny 2008) XREAP2008-07 Sanromá, E. (IEB); Ramos, R. (AQR-IREA); Simón, H. Portabilidad del capital humano y asimilación de los inmigrantes. Evidencia para España (Juliol 2008) XREAP2008-08 Basher, S. A.; Carrión, J. Ll. (AQR-IREA) Price level convergence, purchasing power parity and multiple structural breaks: An application to US cities (Juliol 2008)
SÈRIE DE DOCUMENTS DE TREBALL DE LA XREAP
XREAP2008-09 Bermúdez, Ll. (RFA-IREA) A priori ratemaking using bivariate poisson regression models (Juliol 2008) XREAP2008-10 Solé-Ollé, A. (IEB), Hortas Rico, M. (IEB) Does urban sprawl increase the costs of providing local public services? Evidence from Spanish municipalities (Novembre 2008) XREAP2008-11 Teruel-Carrizosa, M. (GRIT), Segarra-Blasco, A. (GRIT) Immigration and Firm Growth: Evidence from Spanish cities (Novembre 2008) XREAP2008-12 Duch-Brown, N. (IEB), García-Quevedo, J. (IEB), Montolio, D. (IEB) Assessing the assignation of public subsidies: Do the experts choose the most efficient R&D projects? (Novembre 2008) XREAP2008-13 Bilotkach, V., Fageda, X. (PPRE-IREA), Flores-Fillol, R. Scheduled service versus personal transportation: the role of distance (Desembre 2008) XREAP2008-14 Albalate, D. (PPRE-IREA), Gel, G. (PPRE-IREA) Tourism and urban transport: Holding demand pressure under supply constraints (Desembre 2008) 2009 XREAP2009-01 Calonge, S. (CREB); Tejada, O. “A theoretical and practical study on linear reforms of dual taxes” (Febrer 2009) XREAP2009-02 Albalate, D. (PPRE-IREA); Fernández-Villadangos, L. (PPRE-IREA) “Exploring Determinants of Urban Motorcycle Accident Severity: The Case of Barcelona” (Març 2009) XREAP2009-03 Borrell, J. R. (PPRE-IREA); Fernández-Villadangos, L. (PPRE-IREA) “Assessing excess profits from different entry regulations” (Abril 2009) XREAP2009-04 Sanromá, E. (IEB); Ramos, R. (AQR-IREA), Simon, H. “Los salarios de los inmigrantes en el mercado de trabajo español. ¿Importa el origen del capital humano?” (Abril 2009) XREAP2009-05 Jiménez, J. L.; Perdiguero, J. (PPRE-IREA) “(No)competition in the Spanish retailing gasoline market: a variance filter approach” (Maig 2009) XREAP2009-06 Álvarez-Albelo,C. D. (CREB), Manresa, A. (CREB), Pigem-Vigo, M. (CREB) “International trade as the sole engine of growth for an economy” (Juny 2009) XREAP2009-07 Callejón, M. (PPRE-IREA), Ortún V, M. “The Black Box of Business Dynamics” (Setembre 2009)
SÈRIE DE DOCUMENTS DE TREBALL DE LA XREAP
XREAP2009-08 Lucena, A. (CREB) “The antecedents and innovation consequences of organizational search: empirical evidence for Spain” (Octubre 2009) XREAP2009-09 Domènech Campmajó, L. (PPRE-IREA) “Competition between TV Platforms” (Octubre 2009) XREAP2009-10 Solé-Auró, A. (RFA-IREA),Guillén, M. (RFA-IREA), Crimmins, E. M. “Health care utilization among immigrants and native-born populations in 11 European countries. Results from the Survey of Health, Ageing and Retirement in Europe” (Octubre 2009) XREAP2009-11 Segarra, A. (GRIT), Teruel, M. (GRIT) “Small firms, growth and financial constraints” (Octubre 2009) XREAP2009-12 Matas, A. (GEAP), Raymond, J.Ll. (GEAP), Ruiz, A. (GEAP) “Traffic forecasts under uncertainty and capacity constraints” (Novembre 2009) XREAP2009-13 Sole-Ollé, A. (IEB) “Inter-regional redistribution through infrastructure investment: tactical or programmatic?” (Novembre 2009) XREAP2009-14 Del Barrio-Castro, T., García-Quevedo, J. (IEB) “The determinants of university patenting: Do incentives matter?” (Novembre 2009) XREAP2009-15 Ramos, R. (AQR-IREA), Suriñach, J. (AQR-IREA), Artís, M. (AQR-IREA) “Human capital spillovers, productivity and regional convergence in Spain” (Novembre 2009) XREAP2009-16 Álvarez-Albelo, C. D. (CREB), Hernández-Martín, R. “The commons and anti-commons problems in the tourism economy” (Desembre 2009) 2010 XREAP2010-01 García-López, M. A. (GEAP) “The Accessibility City. When Transport Infrastructure Matters in Urban Spatial Structure” (Febrer 2010) XREAP2010-02 García-Quevedo, J. (IEB), Mas-Verdú, F. (IEB), Polo-Otero, J. (IEB) “Which firms want PhDs? The effect of the university-industry relationship on the PhD labour market” (Març 2010) XREAP2010-03 Pitt, D., Guillén, M. (RFA-IREA) “An introduction to parametric and non-parametric models for bivariate positive insurance claim severity distributions” (Març 2010)
SÈRIE DE DOCUMENTS DE TREBALL DE LA XREAP
XREAP2010-04 Bermúdez, Ll. (RFA-IREA), Karlis, D. “Modelling dependence in a ratemaking procedure with multivariate Poisson regression models” (Abril 2010) XREAP2010-05 Di Paolo, A. (IEB) “Parental education and family characteristics: educational opportunities across cohorts in Italy and Spain” (Maig 2010) XREAP2010-06 Simón, H. (IEB), Ramos, R. (AQR-IREA), Sanromá, E. (IEB) “Movilidad ocupacional de los inmigrantes en una economía de bajas cualificaciones. El caso de España” (Juny 2010) XREAP2010-07 Di Paolo, A. (GEAP & IEB), Raymond, J. Ll. (GEAP & IEB) “Language knowledge and earnings in Catalonia” (Juliol 2010) XREAP2010-08 Bolancé, C. (RFA-IREA), Alemany, R. (RFA-IREA), Guillén, M. (RFA-IREA) “Prediction of the economic cost of individual long-term care in the Spanish population” (Setembre 2010) XREAP2010-09 Di Paolo, A. (GEAP & IEB) “Knowledge of catalan, public/private sector choice and earnings: Evidence from a double sample selection model” (Setembre 2010) XREAP2010-10 Coad, A., Segarra, A. (GRIT), Teruel, M. (GRIT) “Like milk or wine: Does firm performance improve with age?” (Setembre 2010) XREAP2010-11 Di Paolo, A. (GEAP & IEB), Raymond, J. Ll. (GEAP & IEB), Calero, J. (IEB) “Exploring educational mobility in Europe” (Octubre 2010) XREAP2010-12 Borrell, A. (GiM-IREA), Fernández-Villadangos, L. (GiM-IREA) “Clustering or scattering: the underlying reason for regulating distance among retail outlets” (Desembre 2010) XREAP2010-13 Di Paolo, A. (GEAP & IEB) “School composition effects in Spain” (Desembre 2010) XREAP2010-14 Fageda, X. (GiM-IREA), Flores-Fillol, R. “Technology, Business Models and Network Structure in the Airline Industry” (Desembre 2010) XREAP2010-15 Albalate, D. (GiM-IREA), Bel, G. (GiM-IREA), Fageda, X. (GiM-IREA) “Is it Redistribution or Centralization? On the Determinants of Government Investment in Infrastructure” (Desembre 2010) XREAP2010-16 Oppedisano, V., Turati, G. “What are the causes of educational inequalities and of their evolution over time in Europe? Evidence from PISA” (Desembre 2010)
SÈRIE DE DOCUMENTS DE TREBALL DE LA XREAP
XREAP2010-17 Canova, L., Vaglio, A. “Why do educated mothers matter? A model of parental help” (Desembre 2010) 2011 XREAP2011-01 Fageda, X. (GiM-IREA), Perdiguero, J. (GiM-IREA) “An empirical analysis of a merger between a network and low-cost airlines” (Maig 2011) XREAP2011-02 Moreno-Torres, I. (ACCO, CRES & GiM-IREA) “What if there was a stronger pharmaceutical price competition in Spain? When regulation has a similar effect to collusion” (Maig 2011) XREAP2011-03 Miguélez, E. (AQR-IREA); Gómez-Miguélez, I. “Singling out individual inventors from patent data” (Maig 2011) XREAP2011-04 Moreno-Torres, I. (ACCO, CRES & GiM-IREA) “Generic drugs in Spain: price competition vs. moral hazard” (Maig 2011) XREAP2011-05 Nieto, S. (AQR-IREA), Ramos, R. (AQR-IREA) “¿Afecta la sobreeducación de los padres al rendimiento académico de sus hijos?” (Maig 2011) XREAP2011-06 Pitt, D., Guillén, M. (RFA-IREA), Bolancé, C. (RFA-IREA) “Estimation of Parametric and Nonparametric Models for Univariate Claim Severity Distributions - an approach using R” (Juny 2011) XREAP2011-07 Guillén, M. (RFA-IREA), Comas-Herrera, A. “How much risk is mitigated by LTC Insurance? A case study of the public system in Spain” (Juny 2011) XREAP2011-08 Ayuso, M. (RFA-IREA), Guillén, M. (RFA-IREA), Bolancé, C. (RFA-IREA) “Loss risk through fraud in car insurance” (Juny 2011) XREAP2011-09 Duch-Brown, N. (IEB), García-Quevedo, J. (IEB), Montolio, D. (IEB) “The link between public support and private R&D effort: What is the optimal subsidy?” (Juny 2011) XREAP2011-10 Bermúdez, Ll. (RFA-IREA), Karlis, D. “Mixture of bivariate Poisson regression models with an application to insurance” (Juliol 2011) XREAP2011-11 Varela-Irimia, X-L. (GRIT) “Age effects, unobserved characteristics and hedonic price indexes: The Spanish car market in the 1990s” (Agost 2011) XREAP2011-12 Bermúdez, Ll. (RFA-IREA), Ferri, A. (RFA-IREA), Guillén, M. (RFA-IREA) “A correlation sensitivity analysis of non-life underwriting risk in solvency capital requirement estimation” (Setembre 2011)
SÈRIE DE DOCUMENTS DE TREBALL DE LA XREAP
XREAP2011-13 Guillén, M. (RFA-IREA), Pérez-Marín, A. (RFA-IREA), Alcañiz, M. (RFA-IREA) “A logistic regression approach to estimating customer profit loss due to lapses in insurance” (Octubre 2011) XREAP2011-14 Jiménez, J. L., Perdiguero, J. (GiM-IREA), García, C. “Evaluation of subsidies programs to sell green cars: Impact on prices, quantities and efficiency” (Octubre 2011) XREAP2011-15 Arespa, M. (CREB) “A New Open Economy Macroeconomic Model with Endogenous Portfolio Diversification and Firms Entry” (Octubre 2011) XREAP2011-16 Matas, A. (GEAP), Raymond, J. L. (GEAP), Roig, J.L. (GEAP) “The impact of agglomeration effects and accessibility on wages” (Novembre 2011) XREAP2011-17 Segarra, A. (GRIT) “R&D cooperation between Spanish firms and scientific partners: what is the role of tertiary education?” (Novembre 2011) XREAP2011-18 García-Pérez, J. I.; Hidalgo-Hidalgo, M.; Robles-Zurita, J. A. “Does grade retention affect achievement? Some evidence from PISA” (Novembre 2011) XREAP2011-19 Arespa, M. (CREB) “Macroeconomics of extensive margins: a simple model” (Novembre 2011) XREAP2011-20 García-Quevedo, J. (IEB), Pellegrino, G. (IEB), Vivarelli, M. “The determinants of YICs’ R&D activity” (Desembre 2011) XREAP2011-21 González-Val, R. (IEB), Olmo, J. “Growth in a Cross-Section of Cities: Location, Increasing Returns or Random Growth?” (Desembre 2011) XREAP2011-22 Gombau, V. (GRIT), Segarra, A. (GRIT) “The Innovation and Imitation Dichotomy in Spanish firms: do absorptive capacity and the technological frontier matter?” (Desembre 2011) 2012 XREAP2012-01 Borrell, J. R. (GiM-IREA), Jiménez, J. L., García, C. “Evaluating Antitrust Leniency Programs” (Gener 2012) XREAP2012-02 Ferri, A. (RFA-IREA), Guillén, M. (RFA-IREA), Bermúdez, Ll. (RFA-IREA) “Solvency capital estimation and risk measures” (Gener 2012) XREAP2012-03 Ferri, A. (RFA-IREA), Bermúdez, Ll. (RFA-IREA), Guillén, M. (RFA-IREA) “How to use the standard model with own data” (Febrer 2012)
SÈRIE DE DOCUMENTS DE TREBALL DE LA XREAP
XREAP2012-04 Perdiguero, J. (GiM-IREA), Borrell, J.R. (GiM-IREA) “Driving competition in local gasoline markets” (Març 2012) XREAP2012-05 D’Amico, G., Guillen, M. (RFA-IREA), Manca, R. “Discrete time Non-homogeneous Semi-Markov Processes applied to Models for Disability Insurance” (Març 2012) XREAP2012-06 Bové-Sans, M. A. (GRIT), Laguado-Ramírez, R. “Quantitative analysis of image factors in a cultural heritage tourist destination” (Abril 2012) XREAP2012-07 Tello, C. (AQR-IREA), Ramos, R. (AQR-IREA), Artís, M. (AQR-IREA) “Changes in wage structure in Mexico going beyond the mean: An analysis of differences in distribution, 1987-2008” (Maig 2012) XREAP2012-08 Jofre-Monseny, J. (IEB), Marín-López, R. (IEB), Viladecans-Marsal, E. (IEB) “What underlies localization and urbanization economies? Evidence from the location of new firms” (Maig 2012) XREAP2012-09 Muñiz, I. (GEAP), Calatayud, D., Dobaño, R. “Los límites de la compacidad urbana como instrumento a favor de la sostenibilidad. La hipótesis de la compensación en Barcelona medida a través de la huella ecológica de la movilidad y la vivienda” (Maig 2012) XREAP2012-10 Arqué-Castells, P. (GEAP), Mohnen, P. “Sunk costs, extensive R&D subsidies and permanent inducement effects” (Maig 2012) XREAP2012-11 Boj, E. (CREB), Delicado, P., Fortiana, J., Esteve, A., Caballé, A. “Local Distance-Based Generalized Linear Models using the dbstats package for R” (Maig 2012) XREAP2012-12 Royuela, V. (AQR-IREA) “What about people in European Regional Science?” (Maig 2012) XREAP2012-13 Osorio A. M. (RFA-IREA), Bolancé, C. (RFA-IREA), Madise, N. “Intermediary and structural determinants of early childhood health in Colombia: exploring the role of communities” (Juny 2012) XREAP2012-14 Miguelez. E. (AQR-IREA), Moreno, R. (AQR-IREA) “Do labour mobility and networks foster geographical knowledge diffusion? The case of European regions” (Juliol 2012) XREAP2012-15 Teixidó-Figueras, J. (GRIT), Duró, J. A. (GRIT) “Ecological Footprint Inequality: A methodological review and some results” (Setembre 2012) XREAP2012-16 Varela-Irimia, X-L. (GRIT) “Profitability, uncertainty and multi-product firm product proliferation: The Spanish car industry” (Setembre 2012)
SÈRIE DE DOCUMENTS DE TREBALL DE LA XREAP
XREAP2012-17 Duró, J. A. (GRIT), Teixidó-Figueras, J. (GRIT) “Ecological Footprint Inequality across countries: the role of environment intensity, income and interaction effects” (Octubre 2012) XREAP2012-18 Manresa, A. (CREB), Sancho, F. “Leontief versus Ghosh: two faces of the same coin” (Octubre 2012) XREAP2012-19 Alemany, R. (RFA-IREA), Bolancé, C. (RFA-IREA), Guillén, M. (RFA-IREA) “Nonparametric estimation of Value-at-Risk” (Octubre 2012) XREAP2012-20 Herrera-Idárraga, P. (AQR-IREA), López-Bazo, E. (AQR-IREA), Motellón, E. (AQR-IREA) “Informality and overeducation in the labor market of a developing country” (Novembre 2012) XREAP2012-21 Di Paolo, A. (AQR-IREA) “(Endogenous) occupational choices and job satisfaction among recent PhD recipients: evidence from Catalonia” (Desembre 2012) 2013 XREAP2013-01 Segarra, A. (GRIT), García-Quevedo, J. (IEB), Teruel, M. (GRIT) “Financial constraints and the failure of innovation projects” (Març 2013) XREAP2013-02 Osorio, A. M. (RFA-IREA), Bolancé, C. (RFA-IREA), Madise, N., Rathmann, K. “Social Determinants of Child Health in Colombia: Can Community Education Moderate the Effect of Family Characteristics?” (Març 2013) XREAP2013-03 Teixidó-Figueras, J. (GRIT), Duró, J. A. (GRIT) “The building blocks of international ecological footprint inequality: a regression-based decomposition” (Abril 2013) XREAP2013-04 Salcedo-Sanz, S., Carro-Calvo, L., Claramunt, M. (CREB), Castañer, A. (CREB), Marmol, M. (CREB) “An Analysis of Black-box Optimization Problems in Reinsurance: Evolutionary-based Approaches” (Maig 2013) XREAP2013-05 Alcañiz, M. (RFA), Guillén, M. (RFA), Sánchez-Moscona, D. (RFA), Santolino, M. (RFA), Llatje, O., Ramon, Ll. “Prevalence of alcohol-impaired drivers based on random breath tests in a roadside survey” (Juliol 2013) XREAP2013-06 Matas, A. (GEAP & IEB), Raymond, J. Ll. (GEAP & IEB), Roig, J. L. (GEAP) “How market access shapes human capital investment in a peripheral country” (Octubre 2013) XREAP2013-07 Di Paolo, A. (AQR-IREA), Tansel, A. “Returns to Foreign Language Skills in a Developing Country: The Case of Turkey” (Novembre 2013) XREAP2013-08 Fernández Gual, V. (GRIT), Segarra, A. (GRIT) “The Impact of Cooperation on R&D, Innovation andProductivity: an Analysis of Spanish Manufacturing and Services Firms” (Novembre 2013)