Embed Size (px)
Citation preview
The Impact of City Connects: Student Outcomes
Progress Report 2016
City Connects Progress Report 2016 1
ACKNOWLEDGEMENTSCity Connects gratefully acknowledges the support of the public and private school districts with whom we partner in Boston and Springfield, Massachusetts; Dayton and Springfield, Ohio; New York, New York; Minneapolis, Minnesota; and Hartford, Connecticut. We thank the superintendents, data liaisons, and student support professionals who have helped introduce and support City Connects in their districts. The work of City Connects would not be possible without the unwavering support of the principals, teachers, staff, and students in our partner schools. Finally, we thank the Lynch School of Education, Boston College, and our funders for their generous support of – and belief in – City Connects.
FOUNDATION SUPPORTAmelia Peabody Foundation Barr Foundation The Better Way Foundation Boston College Catholic Schools Foundation The Charles Hayden Foundation Eastern Bank Charitable Foundation GHR Foundation The Herman and Frieda L. Miller Foundation I. A. O’Shaughnessy Foundation The Ludcke Foundation The Mathile Family Foundation The New Balance Foundation The Philanthropic Initiative Strategic Grant Partners
GOVERNMENT SUPPORTMassachusetts Department of Elementary and Secondary Education Boston Public Schools Springfield Public Schools Hartford Public Schools

©2016 Trustees of Boston College, Chestnut Hill, Massachusetts2
ó ó ó

City Connects Progress Report 2016 3
Table of ContentsIntroduction.............................................................................
Robustness across methods......................................................
Robustness across samples.......................................................
Robustness across sites.............................................................
City Connects effects are consistent with causality...................
Benefits of City Connects outweigh costs ...............................
Conclusions..............................................................................
References...............................................................................
City Connects staff....................................................................
4
7
16
21
31
32
35
36
40
©2016 Trustees of Boston College, Chestnut Hill, Massachusetts4
IntroductionIn high-poverty urban school districts across America, many children face challenges outside of school that impede their success inside of school and in life. In the 1960s, the Coleman Report and others concluded that socioeconomic background is a significant factor affecting students’ academic achievement (Harrington, 1962; Coleman, et al., 1966). Current research confirms that contexts beyond the school are critical, accounting for up to two-thirds of the variance in student achievement (Phillips, et al., 1998; Rothstein, 2010).
Poverty’s harmful influence on students’ lives outside of school contributes to inequality in educational outcomes; in fact, Berliner (2013) has identified poverty as the single most critical factor to address in education reform. The achievement gap related to income has grown as the divide between the income levels of rich and poor families has widened (Duncan & Murnane, 2011; Reardon, 2011). Collectively, this work points to a straightforward conclusion: schools cannot close the achievement gap without a systemic approach to addressing out-of-school disadvantage (Bryk, Sebring, Allensworth, Luppescu, & Easton, 2010; Walsh & Murphy, 2003). Yet, as noted by Carter and Reardon (2014), while much research has been dedicated to documenting the consequences of inequality, less has focused on what can be done to reduce inequality.
City Connects began in 2001 in response to the need for a systemic approach to addressing the out-of-school factors that may seriously impede students’ ability to benefit from instruction (Walsh & Brabeck, 2006). Its mission is to help children succeed and thrive—promoting their academic, social-emotional, and physical well-being – by connecting each student in a school with a tailored set of prevention, intervention and enrichment services in the community. With City Connects, effective student support becomes central to the school’s educational mission and to the way a school operates. The array of services and enrichments in the urban community also become central to the school’s role in supporting students and evidence becomes available for evaluating effectiveness. Starting more than fifteen years ago in a single school, the partnership among Boston College, school districts and community agencies has grown one small group of schools
City Connects Progress Report 2016 5
at a time, in response to local needs. As of the 2015-16 school year, City Connects was in 79 high-poverty urban public, Catholic, and charter schools in Boston and Springfield, MA; New York City (in partnership with the Children’s Aid Society); Dayton and Springfield, OH; Minneapolis, MN; and Hartford, CT.
The ongoing evaluation of City Connects uses multiple methods and measures to assess the impact of the intervention on students, teachers, principals, families and the school district. A consistent set of earlier findings across a variety of outcomes demonstrates that being in a City Connects school makes a difference:
• Despite starting with lower report card scores in first grade, students in City Connects schools demonstrated significantly higher scores than those in comparison schools in reading, writing, and math by the end of fifth grade. The magnitude of these positive effects was as large as the negative effects of poverty (City Connects, 2010).
• English language learners (ELL) experienced significantly larger treatment benefits on literacy outcomes than non-ELL students. By third grade, ELL students in City Connects schools demonstrated similar reading report card scores to those proficient in English in comparison schools, thereby eliminating the achievement gap in reading between ELL and non-ELL students (City Connects, 2010).
• After leaving the intervention and moving on to middle school, students from City Connects schools scored higher on statewide math and English language arts tests than comparison peers who were never enrolled in a City Connects school (Walsh et al., 2014).
• City Connects students at greatest educational risk demonstrated lower rates of retention (being held back in grade) than comparable students never enrolled in City Connects (City Connects, 2012).
• Students enrolled in City Connects elementary schools demonstrated lower rates of chronic absenteeism in middle and high school (defined as being absent from school 10% of days or more) than students in comparison schools (City Connects, 2014).
©2016 Trustees of Boston College, Chestnut Hill, Massachusetts6
• Once they reached high school, students previously enrolled in a City Connects school from kindergarten through grade 5 dropped out of school at about half the rate of students enrolled in non-City Connects schools at the same time (City Connects, 2014).
• Immigrant students who experienced City Connects significantly outperformed immigrant students who never experienced the intervention on both reading and math achievement test scores. City Connects also narrowed achievement gaps between immigrant students and their English-proficient peers (Dearing et al., 2016).
In this report, we present a set of new studies focused on demonstrating robustness of the evidence base supporting the claim that City Connects benefits students. The studies presented here extend evidence of robustness across methods, adding a difference-in-differences approach and a natural experiment. A further methodological advance provides evidence that school-level characteristics independent of City Connects (such as qualities of the school principal or technology resources) cannot account for the beneficial outcomes. The studies in this report also provide evidence of robustness across samples, demonstrating that beneficial effects of City Connects seen previously for Boston Public Schools students endure when new cohorts of Boston students are included in analyses. Finally, this report extends evidence of robustness across sites, showing that students in districts beyond Boston Public Schools, including Springfield, MA, and Boston Catholic Schools, also outperform comparison peers on measures of academic achievement.
In demonstrating replication of results across methods, samples, and sites, the findings presented in this report strengthen the case for causal impact—that is, the case that City Connects is not merely associated with, but rather helps bring about, positive outcomes for students.
City Connects Progress Report 2016 7
Robustness across methodsImproving elementary school report card scores over time
Past analyses have demonstrated a significant positive effect of City Connects on student report cards scores in elementary school (Walsh, et al., 2014). Here we present results from an extension of that quasi-experimental research with an approach that provides stronger opportunities for causal inference by reducing some of the threats to internal validity (Shadish et al., 2002): a “difference-in-differences” (DID) analysis of City Connects effects on report card scores.
Difference-in-differences research designs can be used to estimate the causal effects of policy and practice changes (Lechner, 2010; Wong, Cook, and Steiner, 2015). In this approach, trends in scores over time – for example, the years before and after City Connects was implemented in a school – are examined for students who experienced the program implementation and for students who did not; comparison students represent what would have been expected from the treatment group in the absence of the intervention. That is, the change observed in the comparison group from pre- to post-intervention is compared to changes in treatment group. This approach is considered to take into account bias from unobserved student characteristics that often can be a challenge to quasi-experimental research designs (Buckley & Shang, 2003; Angrist & Pischke, 2010; Lechner, 2010).
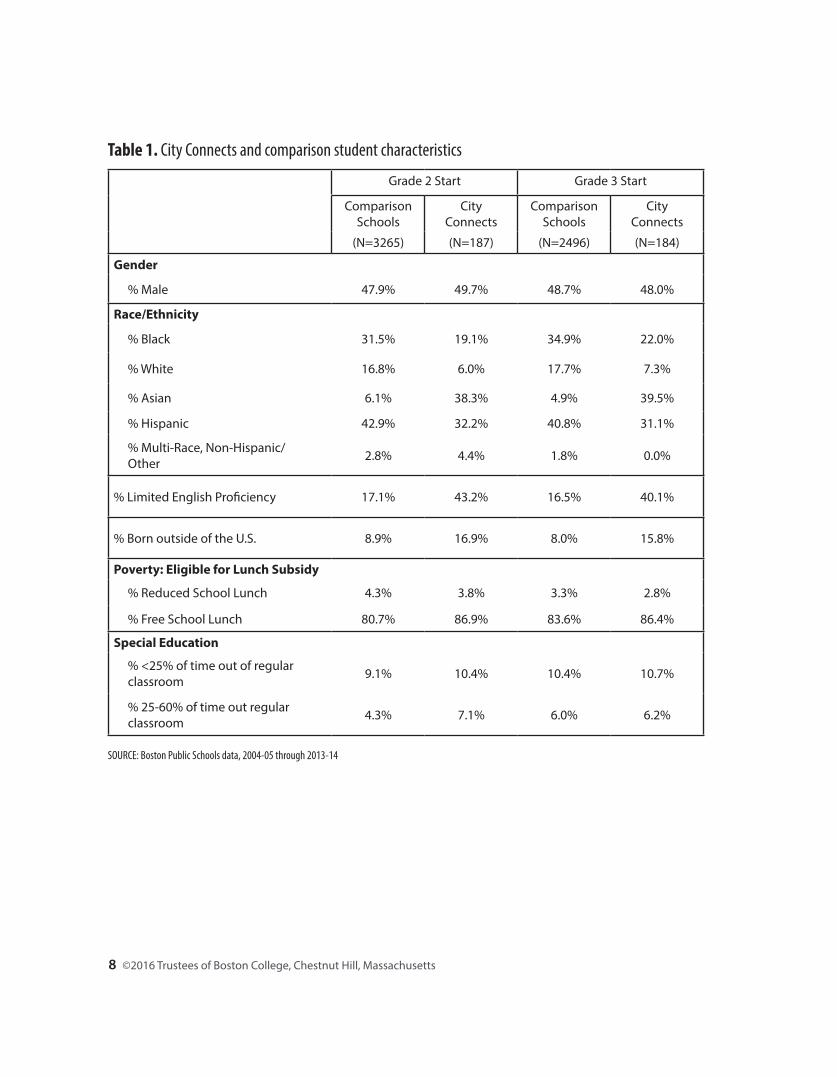
Students included in the analysis. This analysis drew on longitudinal data from Boston Public Schools (BPS) for school years 2004-05 through 2013-14. For a student to be included in the analysis, they must have remained in the same elementary school for grades 1 through 5. In one group, the treatment group, students’ schools started implementing City Connects when students were in second or third grade. In the other group, City Connects was not implemented in schools at all during the time of the study. See Table 1 for a summary of student characteristics.
©2016 Trustees of Boston College, Chestnut Hill, Massachusetts8
Table 1. City Connects and comparison student characteristics
SOURCE: Boston Public Schools data, 2004-05 through 2013-14
Grade 2 Start Grade 3 Start
Comparison Schools
City Connects
Comparison Schools
City Connects
(N=3265) (N=187) (N=2496) (N=184)
Gender
% Male 47.9% 49.7% 48.7% 48.0%
Race/Ethnicity
% Black 31.5% 19.1% 34.9% 22.0%
% White 16.8% 6.0% 17.7% 7.3%
% Asian 6.1% 38.3% 4.9% 39.5%
% Hispanic 42.9% 32.2% 40.8% 31.1%
% Multi-Race, Non-Hispanic/ Other 2.8% 4.4% 1.8% 0.0%
% Limited English Proficiency 17.1% 43.2% 16.5% 40.1%
% Born outside of the U.S. 8.9% 16.9% 8.0% 15.8%
Poverty: Eligible for Lunch Subsidy
% Reduced School Lunch 4.3% 3.8% 3.3% 2.8%
% Free School Lunch 80.7% 86.9% 83.6% 86.4%
Special Education
% <25% of time out of regular classroom 9.1% 10.4% 10.4% 10.7%
% 25-60% of time out regular classroom 4.3% 7.1% 6.0% 6.2%
City Connects Progress Report 2016 9
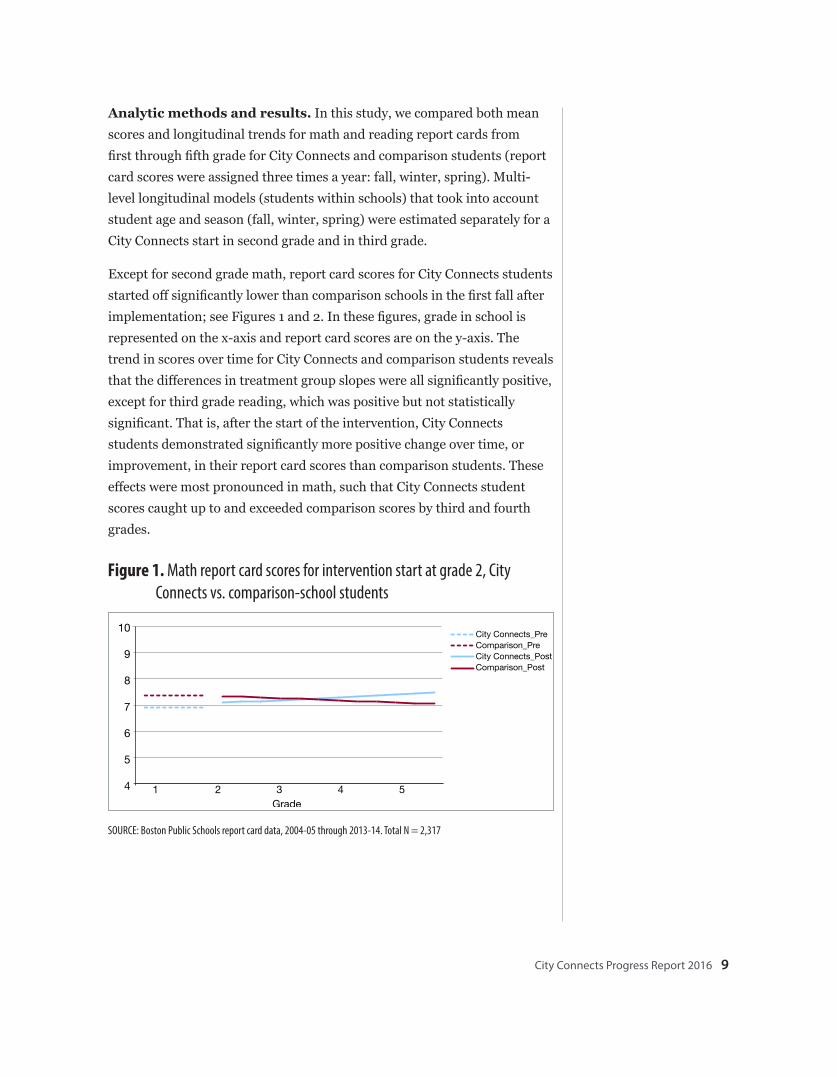
Analytic methods and results. In this study, we compared both mean scores and longitudinal trends for math and reading report cards from first through fifth grade for City Connects and comparison students (report card scores were assigned three times a year: fall, winter, spring). Multi-level longitudinal models (students within schools) that took into account student age and season (fall, winter, spring) were estimated separately for a City Connects start in second grade and in third grade.
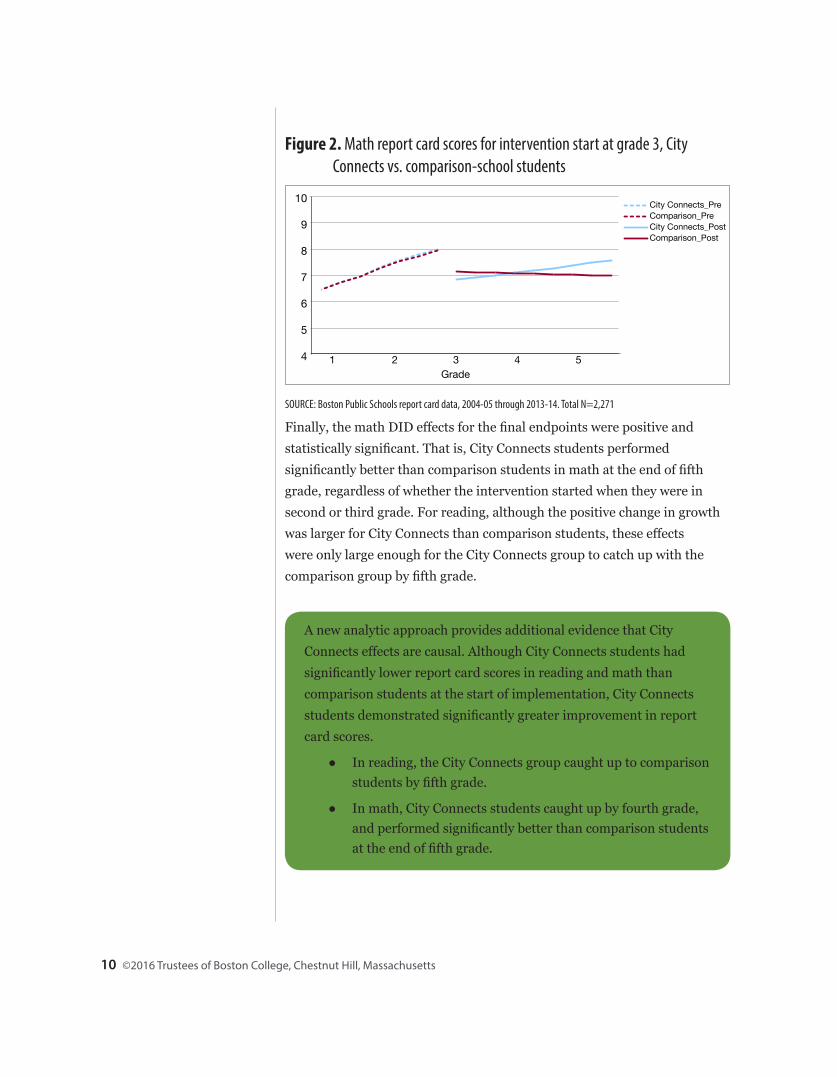
Except for second grade math, report card scores for City Connects students started off significantly lower than comparison schools in the first fall after implementation; see Figures 1 and 2. In these figures, grade in school is represented on the x-axis and report card scores are on the y-axis. The trend in scores over time for City Connects and comparison students reveals that the differences in treatment group slopes were all significantly positive, except for third grade reading, which was positive but not statistically significant. That is, after the start of the intervention, City Connects students demonstrated significantly more positive change over time, or improvement, in their report card scores than comparison students. These effects were most pronounced in math, such that City Connects student scores caught up to and exceeded comparison scores by third and fourth grades.
4
5
6
7
8
9
10
Grade1 2 3 4 5
Comparison_PostCity Connects_PostComparison_PreCity Connects_Pre
Figure 1. Math report card scores for intervention start at grade 2, City Connects vs. comparison-school students
SOURCE: Boston Public Schools report card data, 2004-05 through 2013-14. Total N = 2,317
©2016 Trustees of Boston College, Chestnut Hill, Massachusetts10
Figure 2. Math report card scores for intervention start at grade 3, City Connects vs. comparison-school students
4
5
6
7
8
9
10
Grade1 2 3 4 5
Comparison_PostCity Connects_PostComparison_PreCity Connects_Pre
SOURCE: Boston Public Schools report card data, 2004-05 through 2013-14. Total N=2,271
A new analytic approach provides additional evidence that City Connects effects are causal. Although City Connects students had significantly lower report card scores in reading and math than comparison students at the start of implementation, City Connects students demonstrated significantly greater improvement in report card scores.
● In reading, the City Connects group caught up to comparison students by fifth grade.
● In math, City Connects students caught up by fourth grade, and performed significantly better than comparison students at the end of fifth grade.
Finally, the math DID effects for the final endpoints were positive and statistically significant. That is, City Connects students performed significantly better than comparison students in math at the end of fifth grade, regardless of whether the intervention started when they were in second or third grade. For reading, although the positive change in growth was larger for City Connects than comparison students, these effects were only large enough for the City Connects group to catch up with the comparison group by fifth grade.
City Connects Progress Report 2016 11
Improving statewide test scores in elementary school
Previous studies have demonstrated positive outcomes on standardized achievement test scores for students enrolled in City Connects elementary schools (Walsh et al., 2014; City Connects, 2014). We turn now to findings in which a natural experiment revealed positive outcomes for elementary school statewide test scores.
This natural experiment resulted from school enrollment policy in Boston Public Schools and its intersection with the launch of City Connects in a new school. In Boston, during the years of this study, to enroll in kindergarten, a student must have turned 5 by August 31. This means that September 1 is a cut-off date; students born on or after this date were assigned to kindergarten a full year later than those born just before this date. For the purposes of our study, this difference is interesting in relation to the start of the City Connects intervention at a school. For example, if City Connects began in school year 2007-08, students who were born before the cut-off in 2006-07 would have entered kindergarten before City Connects’ first year in the school, whereas those born after the cut-off would begin kindergarten with City Connects in 2007-08. So, at any particular grade in school, such as third grade, when state tests are administered, students born after the cut-off would have received a full additional year of the intervention compared to those born before.
Students on either side of such a cut-off can be directly compared (Angrist & Psichke, 2010). A complication is that although they would have experienced a year more of City Connects, the students born after the cut-off date were also a year older at the time of any given grade-level test. To address this complication, the study estimated the impact of age on test scores by adding comparison groups of students who experienced the same date-of-birth cut-off but who were never enrolled in City Connects schools.1
Students included in the analysis. The analysis drew on students from eleven Boston Public schools that began implementing City Connects in either 2007-08 or 2010-11 and comparison students enrolled in non-City Connects BPS schools during the same years. Four groups of students
1 In essence, this study employs a regression discontinuity design with adjustments for differences in child age. Regression discontinuity studies can produce results that are comparable to causal estimates from experiments (Cook, Shadish, & Wong, 2008; What Works Clearinghouse; McCartney, Bub, & Burchinal, 2006).
©2016 Trustees of Boston College, Chestnut Hill, Massachusetts12
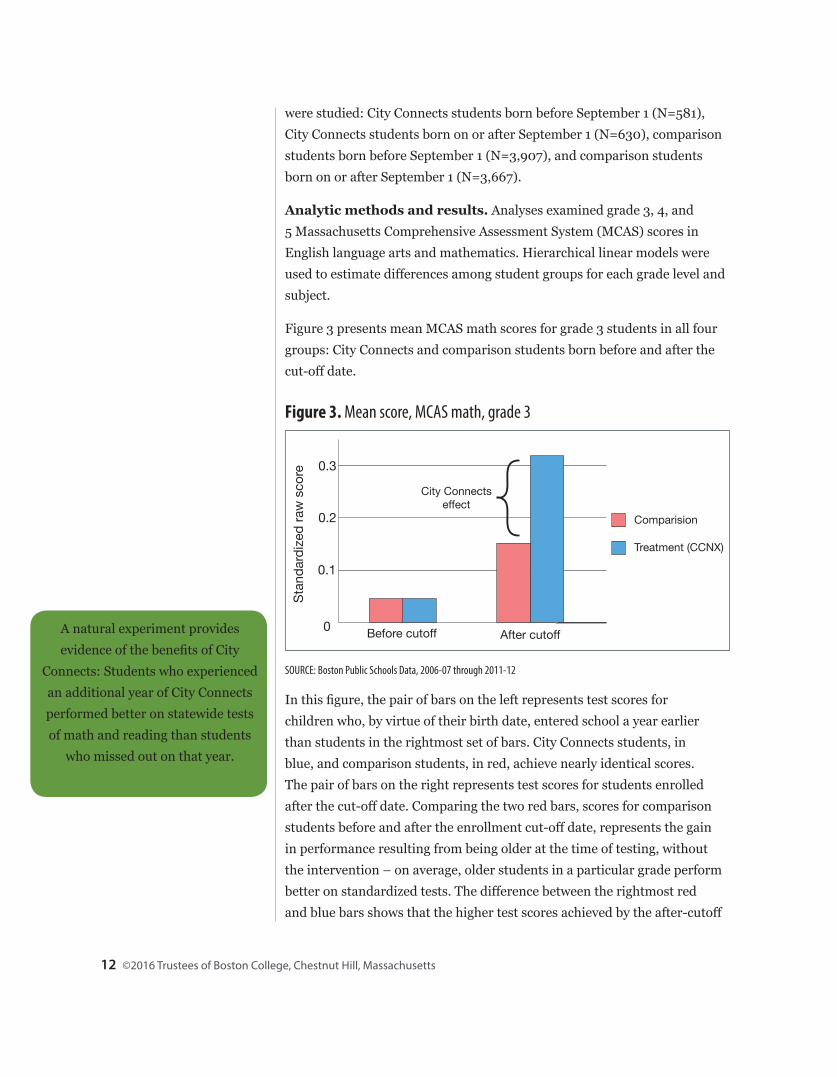
were studied: City Connects students born before September 1 (N=581), City Connects students born on or after September 1 (N=630), comparison students born before September 1 (N=3,907), and comparison students born on or after September 1 (N=3,667).
Analytic methods and results. Analyses examined grade 3, 4, and 5 Massachusetts Comprehensive Assessment System (MCAS) scores in English language arts and mathematics. Hierarchical linear models were used to estimate differences among student groups for each grade level and subject.
Figure 3 presents mean MCAS math scores for grade 3 students in all four groups: City Connects and comparison students born before and after the cut-off date.
A natural experiment provides evidence of the benefits of City
Connects: Students who experienced an additional year of City Connects performed better on statewide tests of math and reading than students
who missed out on that year.
0
0.1
0.2
0.3
Before cutoff
Stan
dard
ized
raw
sco
re
After cutoff
Comparision
Treatment (CCNX)
City Connectseffect
Figure 3. Mean score, MCAS math, grade 3
SOURCE: Boston Public Schools Data, 2006-07 through 2011-12
In this figure, the pair of bars on the left represents test scores for children who, by virtue of their birth date, entered school a year earlier than students in the rightmost set of bars. City Connects students, in blue, and comparison students, in red, achieve nearly identical scores. The pair of bars on the right represents test scores for students enrolled after the cut-off date. Comparing the two red bars, scores for comparison students before and after the enrollment cut-off date, represents the gain in performance resulting from being older at the time of testing, without the intervention – on average, older students in a particular grade perform better on standardized tests. The difference between the rightmost red and blue bars shows that the higher test scores achieved by the after-cutoff
City Connects Progress Report 2016 13
City Connects students are not due merely to maturity, but also reflect the incremental advantage of being enrolled in City Connects. That is, these analyses demonstrate a positive effect of City Connects on math test scores, even after taking into account the maturational effect of taking the test at an older age.
Similar significant, positive, “adjusted” treatment effects (effect after removing the expected maturation effect) were found not only for third grade mathematics MCAS scores, but also for fifth grade mathematics and English language arts scores.
Improving middle school outcomes for students previously enrolled in City Connects elementary schools
Past analyses demonstrating positive effects of City Connects on academic performance have focused on outcomes at the student level, while taking into account the fact that students are nested within schools (e.g., Walsh et al., 2014). However, because the City Connects intervention is applied at the school-level – all students in a school participate – it is optimal for the impact of City Connects to be measured as a school-level variable. A recent analysis (An, 2015) extended earlier studies by focusing on treatment assignment as a school-level indicator and including a range of school-level characteristics to potentially better control for selection bias.
Like previous studies (Walsh et al., 2014), the analysis sought to assess the impact of participating in City Connects during elementary school on middle school achievement as measured by standardized test scores (MCAS) and report card scores (GPA). In addition to expanding the range of methodologies used to study City Connects, this study added three cohorts of students from the same district and included a more comprehensive comparison group (the full sample of all non-treatment students in the district rather than those in the seven comparable schools studied by Walsh et al., 2014).
Students included in the analysis. Analyses included students who attended kindergarten in years 2000-01 to 2006-07 and reached grade 6 by the 2012-13 school year, a total of 1,791 students from 15 City Connects elementary schools and 9,260 students from 78 non-City Connects schools.
©2016 Trustees of Boston College, Chestnut Hill, Massachusetts14
Analytic method and results. This study used multi-level models to estimate the impact of attending a City Connects elementary school on middle school test scores and GPA. The study controlled for student characteristics, including gender, race, English language learner status, free or reduced-price lunch eligibility status, special education status, and school mobility. Propensity score weights based on student demographic and academic characteristics were applied to models to make the two groups approximately equivalent at baseline. To address potential differences in middle school effectiveness, An (2015) applied a middle school achievement “adjustment score” at the student level.
First, the treatment effect on student academic achievement in middle school was estimated, after taking into account student baseline characteristics, differential middle school effectiveness and most recent elementary school attended. Then, school-level measures, including whether or not the school was a K-8 school, student-teacher ratio, school size, average class size, students per computer, and percentages of students of color and low-income students were added to examine the extent to which effects could be accounted for by school characteristics other than City Connects treatment.
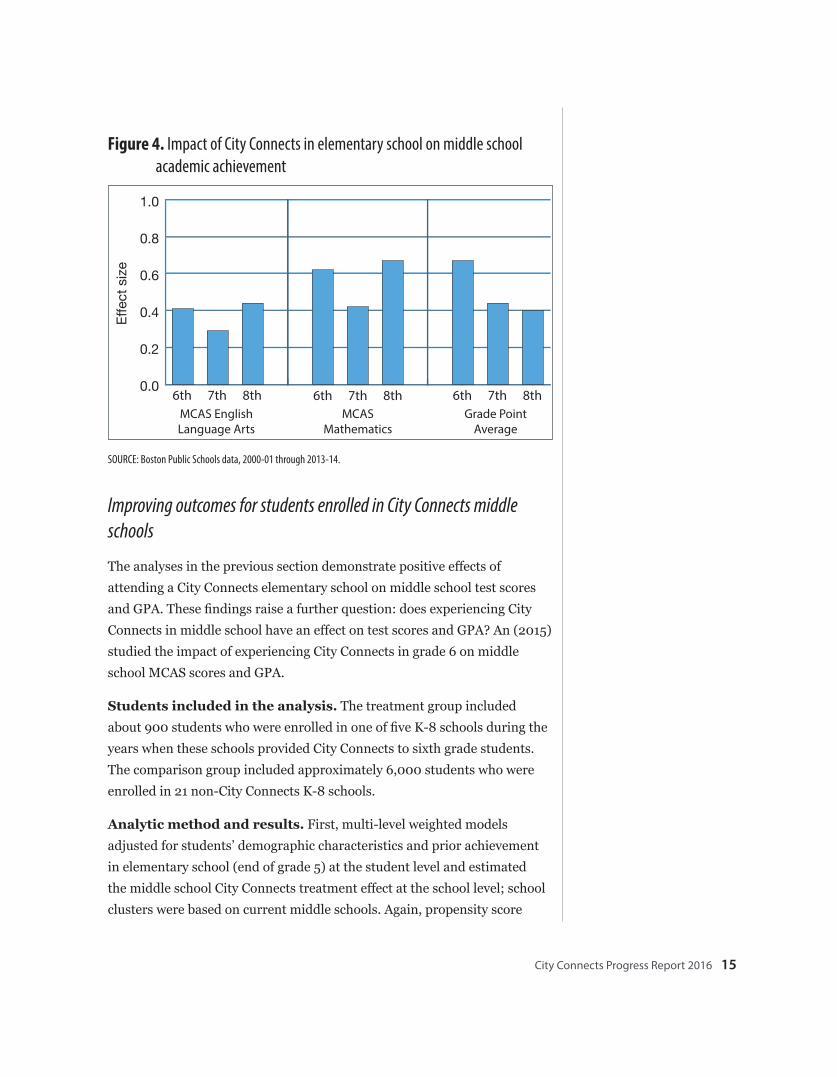
After controlling for school and student characteristics as well as pre-existing academic achievement differences, analyses showed that students who experienced City Connects in elementary school significantly outperformed comparison peers on grade 6, 7, and 8 academic achievement. As shown in Figure 4, effect sizes were quite large, ranging from 0.29 to 0.67 for MCAS measures and 0.40 to 0.67 for GPA. This range of effect sizes demonstrates that findings were not only statistically significant but also practically significant, with an impact of one third of a standard deviation or more on all measures, larger effects than reported in Walsh, 2014. The significant, positive impact on students’ academic achievement was seen even after taking into account differences in school composition and resources.
● Students who experienced City Connects in elementary school significantly outperformed comparison peers on measures of academic achievement in grades 6, 7, and 8 (statewide test scores in English and Mathematics and grade point average).
● These beneficial effects were not only statistically significant but also practically significant, with effect sizes ranging from 0.29 to 0.67.
● The methodological improvements reflected in these analyses uncovered larger effect sizes than were seen in earlier work.
City Connects Progress Report 2016 15
Improving outcomes for students enrolled in City Connects middle schools
The analyses in the previous section demonstrate positive effects of attending a City Connects elementary school on middle school test scores and GPA. These findings raise a further question: does experiencing City Connects in middle school have an effect on test scores and GPA? An (2015) studied the impact of experiencing City Connects in grade 6 on middle school MCAS scores and GPA.
Students included in the analysis. The treatment group included about 900 students who were enrolled in one of five K-8 schools during the years when these schools provided City Connects to sixth grade students. The comparison group included approximately 6,000 students who were enrolled in 21 non-City Connects K-8 schools.
Analytic method and results. First, multi-level weighted models adjusted for students’ demographic characteristics and prior achievement in elementary school (end of grade 5) at the student level and estimated the middle school City Connects treatment effect at the school level; school clusters were based on current middle schools. Again, propensity score
Figure 4. Impact of City Connects in elementary school on middle school academic achievement
0.0
0.2
0.4
0.6
0.8
1.0
8th7th6th8th7th6th 8th7th6th
Effe
ct s
ize
MCAS EnglishLanguage Arts
MCASMathematics
Grade PointAverage
SOURCE: Boston Public Schools data, 2000-01 through 2013-14.
©2016 Trustees of Boston College, Chestnut Hill, Massachusetts16
weights based on prior (grade 5) achievement and baseline demographic characteristics were applied at the student level to address possible pre-intervention differences. Whether or not a student had experienced City Connects in elementary school also was taken into account in these models. Second, school-level variables that might account for school differences were included in a follow-up step.
In the first models, attending a City Connects school in sixth grade did not lead to significant improvements in sixth grade academic achievement beyond the positive effect of having attended a City Connects elementary school. (Note that students included in these models received City Connects for only one year by the end of grade 6. As students’ exposure to City Connects in middle schools extends beyond one year, it is plausible that the impact will manifest more strongly.) In the follow-up analyses adding school characteristics, City Connects treatment effects became significant for mathematics MCAS scores and GPA (p<.001). That is, experiencing City Connects in sixth grade did have a significant, positive, independent impact on MCAS mathematics and GPA when some differences in school composition and resources were taken into account. Influential indicators at the school level that were positively associated with achievement included: more computers per student, lower percentage of students whose first language was not English, and lower student-teacher ratio.
Experiencing City Connects in sixth grade led to significant gains in middle school academic achievement (beyond the positive effect of attending a City Connects middle school) when school characteristics were taken into account.
Robustness across samplesNarrowing the gap between Turnaround City Connects schools and comparison schools in Boston, MA
In the summer of 2010, seven elementary and K-8 schools received “Turnaround” (i.e., consistently low-performing) designation in the Boston Public School system and began to implement City Connects as part of their redesign activities during the 2010-11 school year. Expansion of City Connects to these new schools in Boston allows City Connects to extend
City Connects Progress Report 2016 17
its analyses to a new sample of students. An analysis was completed to examine the City Connects treatment effect on statewide (MCAS) test scores in these Boston Turnaround schools across grades 3, 4, and 5 and across four academic years, 2010-11 through 2013-14. This summary reports effects for students in City Connects Turnaround schools relative to students who attended schools that were not designated as failing, and were not implementing City Connects, across five successive time points using multi-level linear regression modeling.
Given these schools’ failing status, the aim of these analyses was to determine whether City Connects helped schools narrow the gap in performance between the Turnaround schools and other schools in Boston.
Students included in the analysis. Students attending third through fifth grade in the Boston Public Schools during the 2007-08 through 2013-14 academic years were eligible for the study sample. The sample excluded students with severe special needs who required instruction in substantially separate classrooms. Treatment students attended one of the seven Boston Public Turnaround schools that began implementing City Connects during 2010-11. The comparison group included students enrolled in all Boston Public Schools that were neither designated as failing schools by No Child Left Behind standards nor implementing City Connects.
Analytic methods and results. Analyses examined MCAS scores in both English language arts (ELA) and mathematics in grades 3, 4, and 5. This assessment was administered in the spring of each school year for the target grades.
Baseline estimates were formed by aggregating data from the three years prior to Turnaround designation and the introduction of City Connects, 2007-08, 2008-09, and 2009-10. 2010-11 marked the first school year of Turnaround designation as well as the first year of City Connects implementation for the seven Boston City Connects Turnaround schools; 2011-12 marks the second year, and so on. Thus, school-level intervention effects were estimated for City Connects Turnaround schools versus comparison schools at five time points: the baseline aggregate, and Years 1, 2, 3, and 4 of Turnaround and City Connects implementation. Separate multi-level linear regression models were estimated for each grade and
©2016 Trustees of Boston College, Chestnut Hill, Massachusetts18
-0.8
-0.6
-0.4
-0.2
0.0
0.2
0.4
0.6
13-1412-1311-1210-1109-1008-0907-08
Academic Year
Mea
n st
anda
rdize
d ra
w s
core
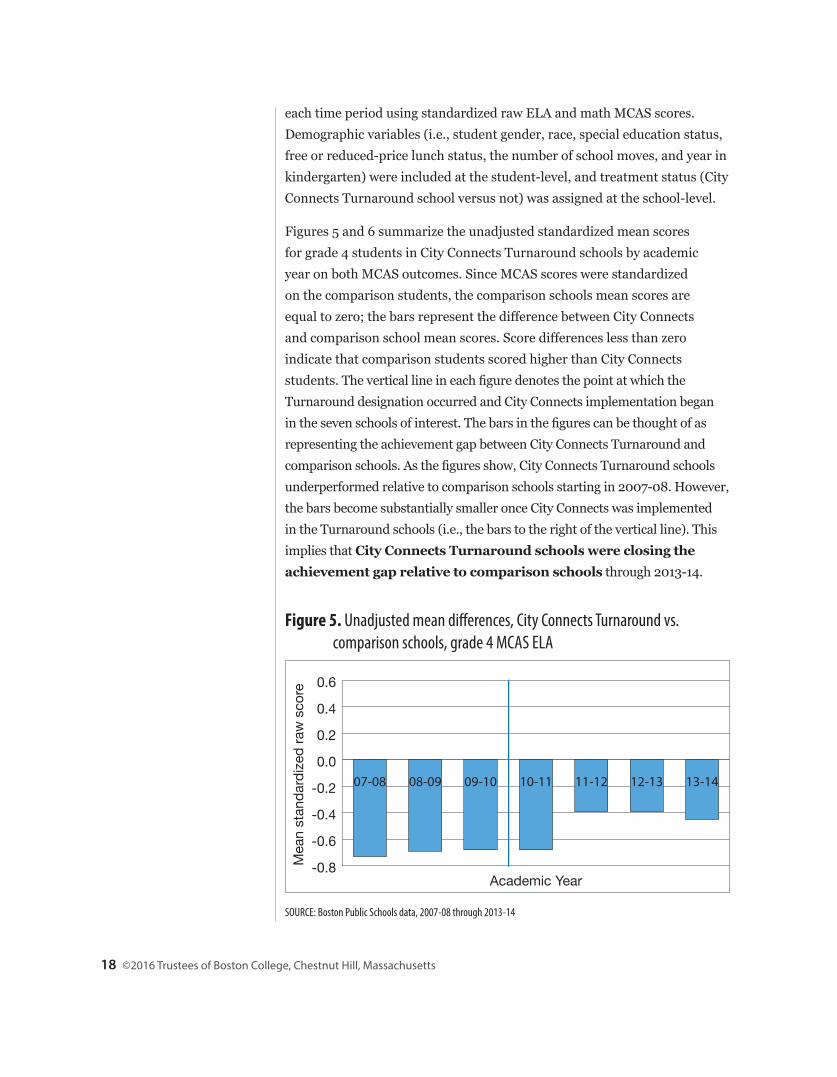
Figure 5. Unadjusted mean differences, City Connects Turnaround vs. comparison schools, grade 4 MCAS ELA
SOURCE: Boston Public Schools data, 2007-08 through 2013-14
each time period using standardized raw ELA and math MCAS scores. Demographic variables (i.e., student gender, race, special education status, free or reduced-price lunch status, the number of school moves, and year in kindergarten) were included at the student-level, and treatment status (City Connects Turnaround school versus not) was assigned at the school-level.
Figures 5 and 6 summarize the unadjusted standardized mean scores for grade 4 students in City Connects Turnaround schools by academic year on both MCAS outcomes. Since MCAS scores were standardized on the comparison students, the comparison schools mean scores are equal to zero; the bars represent the difference between City Connects and comparison school mean scores. Score differences less than zero indicate that comparison students scored higher than City Connects students. The vertical line in each figure denotes the point at which the Turnaround designation occurred and City Connects implementation began in the seven schools of interest. The bars in the figures can be thought of as representing the achievement gap between City Connects Turnaround and comparison schools. As the figures show, City Connects Turnaround schools underperformed relative to comparison schools starting in 2007-08. However, the bars become substantially smaller once City Connects was implemented in the Turnaround schools (i.e., the bars to the right of the vertical line). This implies that City Connects Turnaround schools were closing the achievement gap relative to comparison schools through 2013-14.
City Connects Progress Report 2016 19
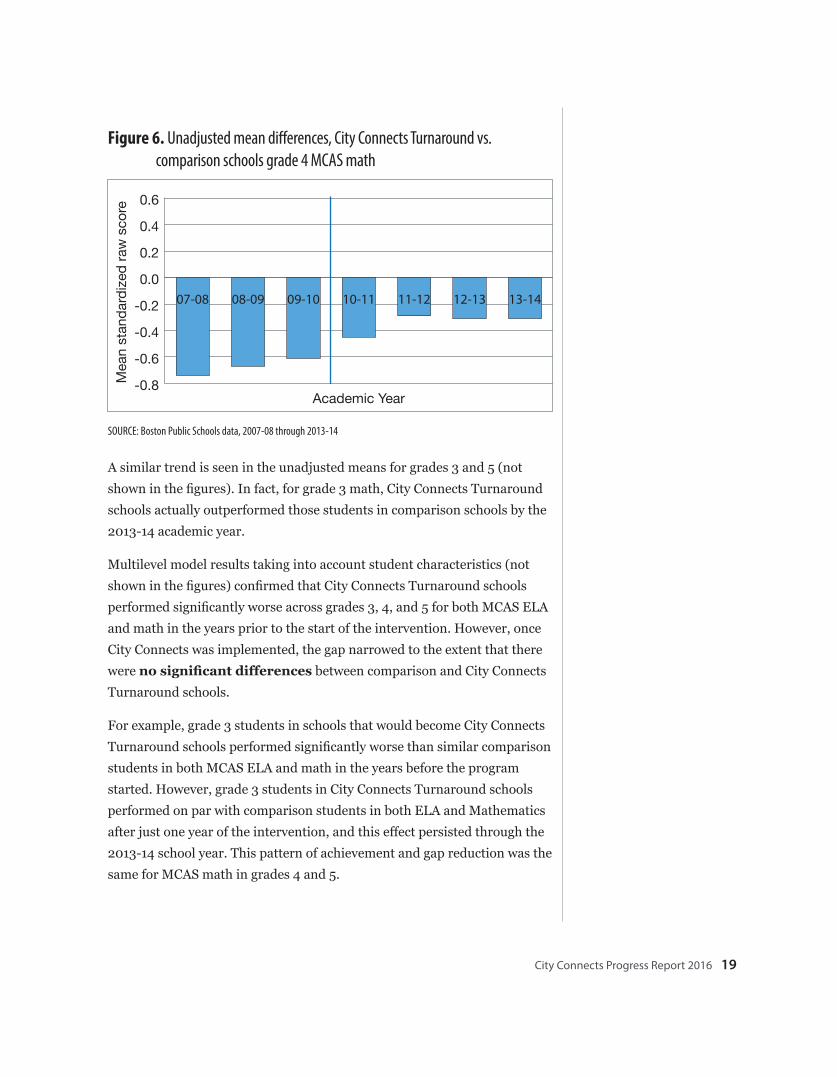
Figure 6. Unadjusted mean differences, City Connects Turnaround vs. comparison schools grade 4 MCAS math
-0.8
-0.6
-0.4
-0.2
0.0
0.2
0.4
0.6
13-1412-1311-1210-1109-1008-0907-08
Academic Year
Mea
n st
anda
rdize
d ra
w s
core
SOURCE: Boston Public Schools data, 2007-08 through 2013-14
A similar trend is seen in the unadjusted means for grades 3 and 5 (not shown in the figures). In fact, for grade 3 math, City Connects Turnaround schools actually outperformed those students in comparison schools by the 2013-14 academic year.
Multilevel model results taking into account student characteristics (not shown in the figures) confirmed that City Connects Turnaround schools performed significantly worse across grades 3, 4, and 5 for both MCAS ELA and math in the years prior to the start of the intervention. However, once City Connects was implemented, the gap narrowed to the extent that there were no significant differences between comparison and City Connects Turnaround schools.
For example, grade 3 students in schools that would become City Connects Turnaround schools performed significantly worse than similar comparison students in both MCAS ELA and math in the years before the program started. However, grade 3 students in City Connects Turnaround schools performed on par with comparison students in both ELA and Mathematics after just one year of the intervention, and this effect persisted through the 2013-14 school year. This pattern of achievement and gap reduction was the same for MCAS math in grades 4 and 5.
©2016 Trustees of Boston College, Chestnut Hill, Massachusetts20
Before the Turnaround designation in Boston, failing schools that would later become City Connects schools performed significantly worse than the comparison schools in both MCAS ELA and math.
However, the gaps in test score performance narrowed after the launch of City Connects in these Turnaround schools.
● For grade 3 ELA and math, grade 4 math, and grade 5 math, gaps in student performance between City Connects Turnaround schools and comparison schools were narrowed to insignificant levels after just one year.
● For grade 4 and 5 ELA, the gap narrowed to insignificant levels after two years of City Connects.
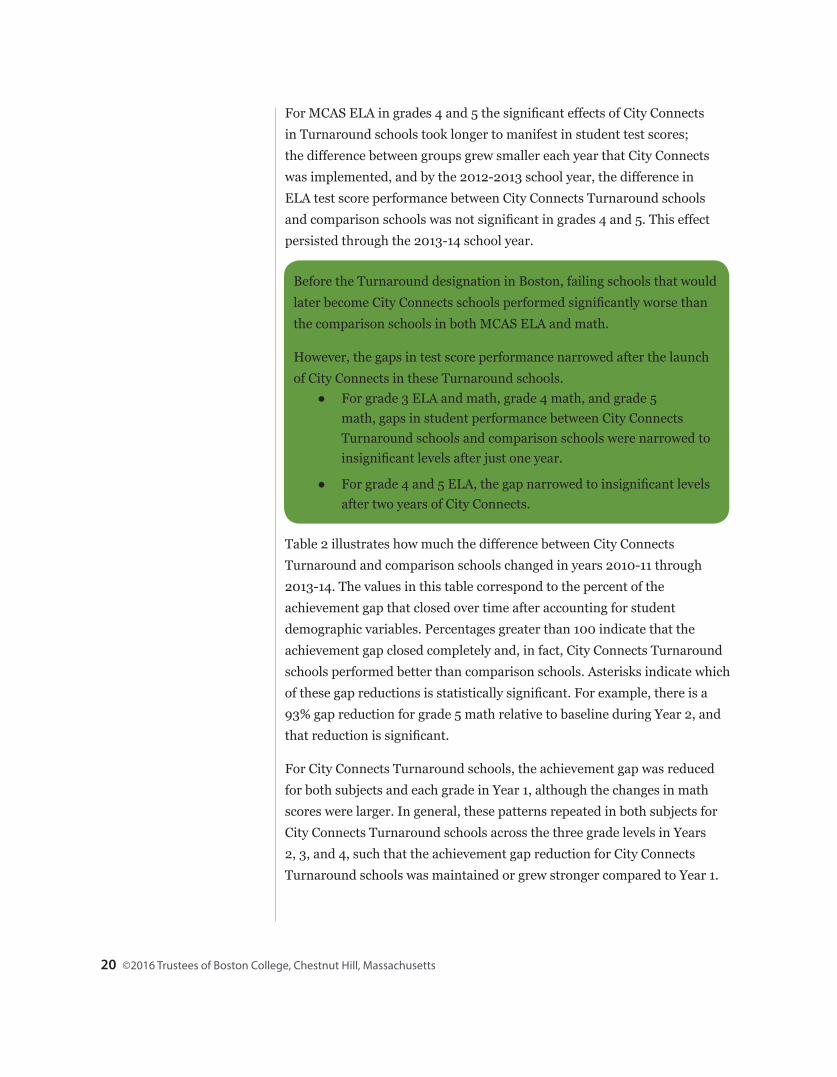
Table 2 illustrates how much the difference between City Connects Turnaround and comparison schools changed in years 2010-11 through 2013-14. The values in this table correspond to the percent of the achievement gap that closed over time after accounting for student demographic variables. Percentages greater than 100 indicate that the achievement gap closed completely and, in fact, City Connects Turnaround schools performed better than comparison schools. Asterisks indicate which of these gap reductions is statistically significant. For example, there is a 93% gap reduction for grade 5 math relative to baseline during Year 2, and that reduction is significant.
For City Connects Turnaround schools, the achievement gap was reduced for both subjects and each grade in Year 1, although the changes in math scores were larger. In general, these patterns repeated in both subjects for City Connects Turnaround schools across the three grade levels in Years 2, 3, and 4, such that the achievement gap reduction for City Connects Turnaround schools was maintained or grew stronger compared to Year 1.
For MCAS ELA in grades 4 and 5 the significant effects of City Connects in Turnaround schools took longer to manifest in student test scores; the difference between groups grew smaller each year that City Connects was implemented, and by the 2012-2013 school year, the difference in ELA test score performance between City Connects Turnaround schools and comparison schools was not significant in grades 4 and 5. This effect persisted through the 2013-14 school year.
City Connects Progress Report 2016 21
Year 1 (2010-11) Year 2 (2011-12) Year 3 (2012-13) Year 4 (2013-14)
ELA Math ELA Math ELA Math ELA Math
Grade 3 52% 224%* 81% 122% 63% 119% 52% 202%
Grade 4 19% 46% 64%** 70% 70% 68% 47% 58%
Grade 5 23% 81% 54%* 93%** 51% 66% 50% 90%
Table 2. Percent reduction in City Connects Turnaround versus comparison school achievement gap relative to baseline aggregate
SOURCE: Boston Public Schools data, 2010-11 through 2013-15 ** significant gap reduction relative to baseline, p< .05 * significant gap reduction relative to baseline, p< .10
Robustness across sitesNarrowing the gap between Transformation City Connects schools and comparison schools in Springfield, MA
In 2011-12, City Connects began implementation in five elementary schools designated as “Transformation” schools, a reform model for consistently low-performing schools like the Turnaround model, in Springfield, MA. This expansion was the first implementation of City Connects in public schools outside of Boston, MA. Implementation extended in 2013-14 to a sixth Springfield elementary school that was designated as a Turnaround school in 2012 (City Connects also started in three Springfield middle schools in 2012-13 and two additional middle schools in 2013-14). Given that these schools were designated as underperforming schools—i.e., there is a gap in statewide test score performance between these schools and others in the district —analyses focused on whether this gap had been reduced.
This section of the report summarizes the results from an analysis of statewide (MCAS) test scores in English language arts (ELA) and mathematics prior to the implementation of City Connects in the district (2010-11) and in the years with available data during which City Connects has been implemented (2011-12 through 2013-14). Grade 3, 4, and 5 MCAS scores for students attending the City Connects Transformation schools
©2016 Trustees of Boston College, Chestnut Hill, Massachusetts22
were compared to those for all students at the same grade in non-City Connects schools in the district.
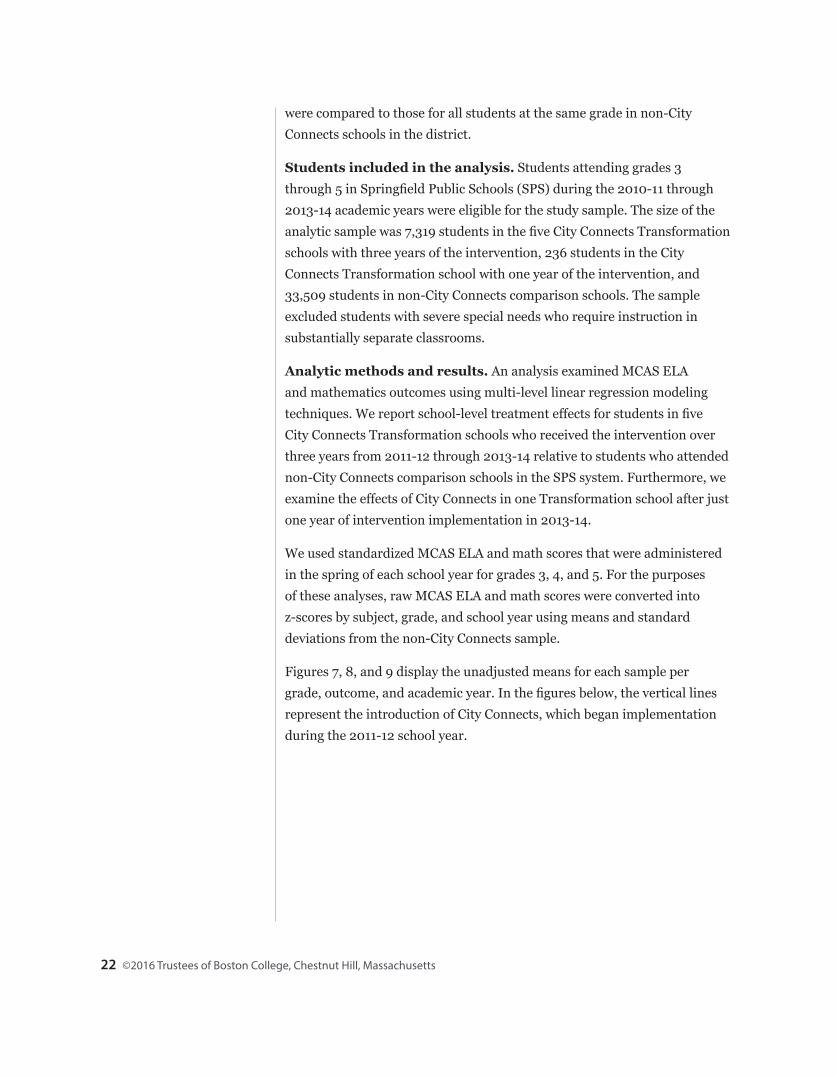
Students included in the analysis. Students attending grades 3 through 5 in Springfield Public Schools (SPS) during the 2010-11 through 2013-14 academic years were eligible for the study sample. The size of the analytic sample was 7,319 students in the five City Connects Transformation schools with three years of the intervention, 236 students in the City Connects Transformation school with one year of the intervention, and 33,509 students in non-City Connects comparison schools. The sample excluded students with severe special needs who require instruction in substantially separate classrooms.
Analytic methods and results. An analysis examined MCAS ELA and mathematics outcomes using multi-level linear regression modeling techniques. We report school-level treatment effects for students in five City Connects Transformation schools who received the intervention over three years from 2011-12 through 2013-14 relative to students who attended non-City Connects comparison schools in the SPS system. Furthermore, we examine the effects of City Connects in one Transformation school after just one year of intervention implementation in 2013-14.
We used standardized MCAS ELA and math scores that were administered in the spring of each school year for grades 3, 4, and 5. For the purposes of these analyses, raw MCAS ELA and math scores were converted into z-scores by subject, grade, and school year using means and standard deviations from the non-City Connects sample.
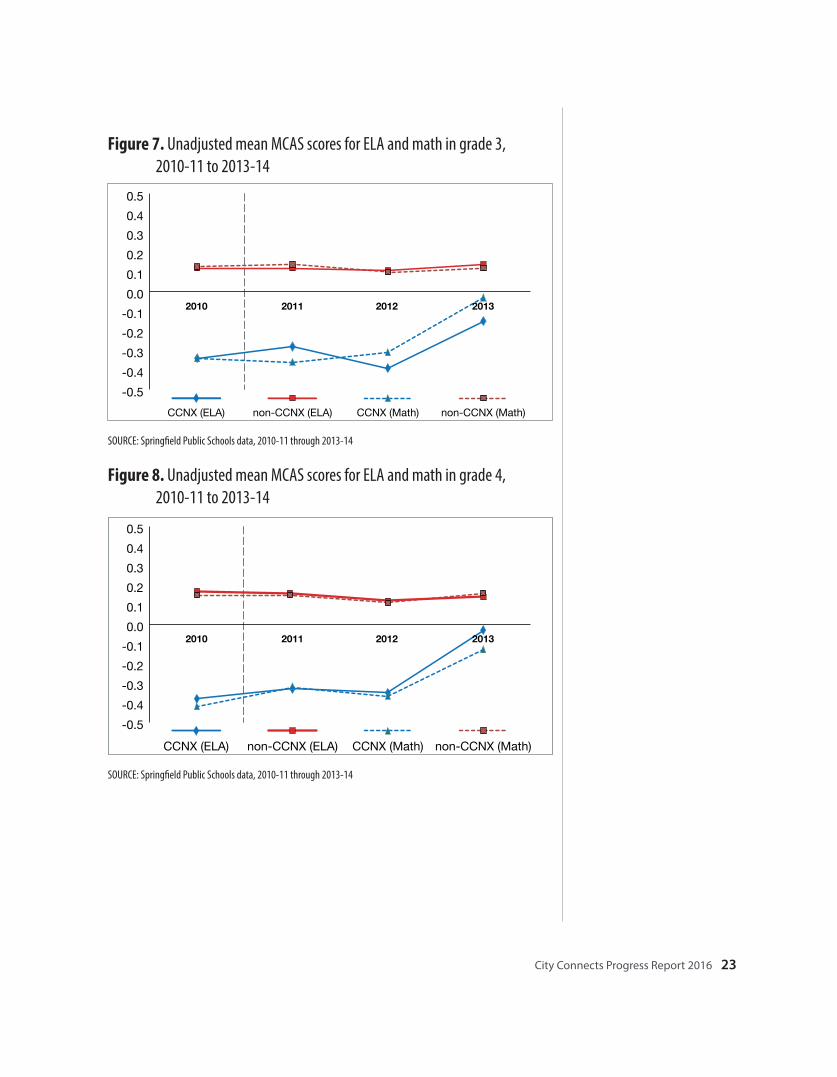
Figures 7, 8, and 9 display the unadjusted means for each sample per grade, outcome, and academic year. In the figures below, the vertical lines represent the introduction of City Connects, which began implementation during the 2011-12 school year.
City Connects Progress Report 2016 23
Figure 7. Unadjusted mean MCAS scores for ELA and math in grade 3, 2010-11 to 2013-14
-0.5-0.4-0.3-0.2-0.10.00.10.20.30.40.5
non-CCNX (Math)CCNX (Math)non-CCNX (ELA)CCNX (ELA)
2010 2011 2012 2013
Figure 8. Unadjusted mean MCAS scores for ELA and math in grade 4, 2010-11 to 2013-14
-0.5-0.4-0.3-0.2-0.10.00.10.20.30.40.5
non-CCNX (Math)CCNX (Math)non-CCNX (ELA)CCNX (ELA)
2010 2011 2012 2013
SOURCE: Springfield Public Schools data, 2010-11 through 2013-14
SOURCE: Springfield Public Schools data, 2010-11 through 2013-14
©2016 Trustees of Boston College, Chestnut Hill, Massachusetts24
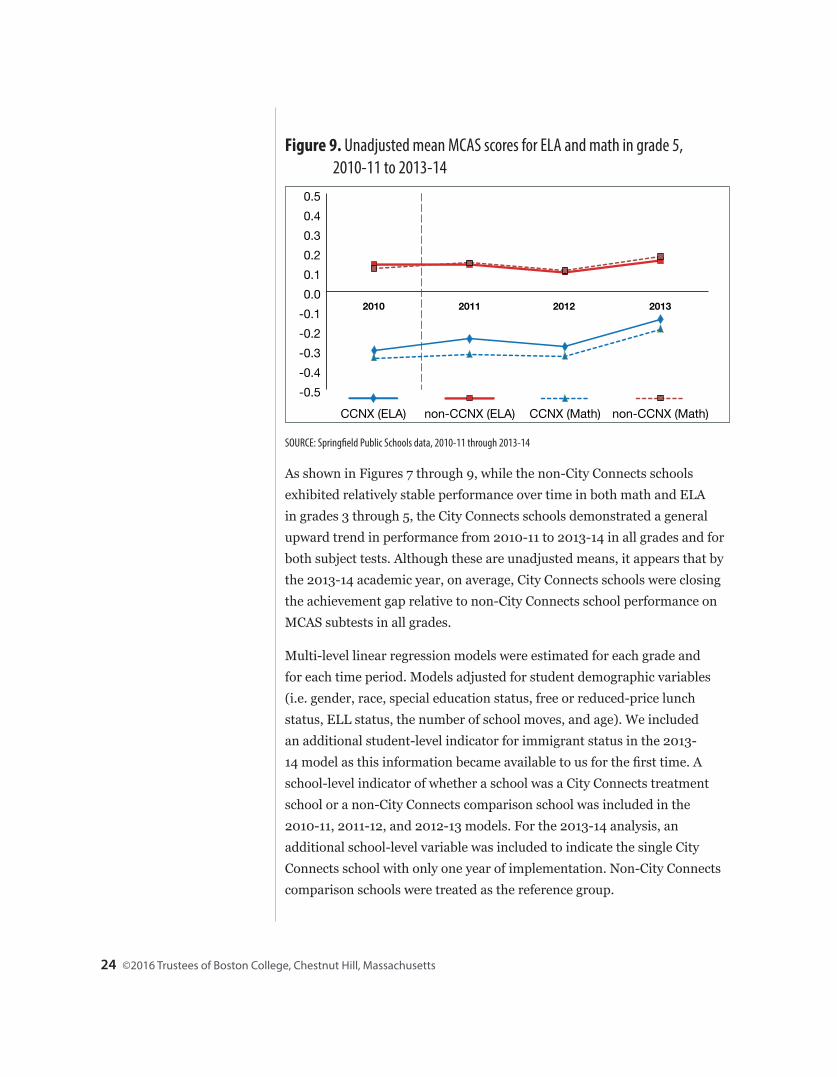
Figure 9. Unadjusted mean MCAS scores for ELA and math in grade 5, 2010-11 to 2013-14
-0.5-0.4-0.3-0.2-0.10.00.10.20.30.40.5
non-CCNX (Math)CCNX (Math)non-CCNX (ELA)CCNX (ELA)
2010 2011 2012 2013
SOURCE: Springfield Public Schools data, 2010-11 through 2013-14
As shown in Figures 7 through 9, while the non-City Connects schools exhibited relatively stable performance over time in both math and ELA in grades 3 through 5, the City Connects schools demonstrated a general upward trend in performance from 2010-11 to 2013-14 in all grades and for both subject tests. Although these are unadjusted means, it appears that by the 2013-14 academic year, on average, City Connects schools were closing the achievement gap relative to non-City Connects school performance on MCAS subtests in all grades.
Multi-level linear regression models were estimated for each grade and for each time period. Models adjusted for student demographic variables (i.e. gender, race, special education status, free or reduced-price lunch status, ELL status, the number of school moves, and age). We included an additional student-level indicator for immigrant status in the 2013-14 model as this information became available to us for the first time. A school-level indicator of whether a school was a City Connects treatment school or a non-City Connects comparison school was included in the 2010-11, 2011-12, and 2012-13 models. For the 2013-14 analysis, an additional school-level variable was included to indicate the single City Connects school with only one year of implementation. Non-City Connects comparison schools were treated as the reference group.
City Connects Progress Report 2016 25
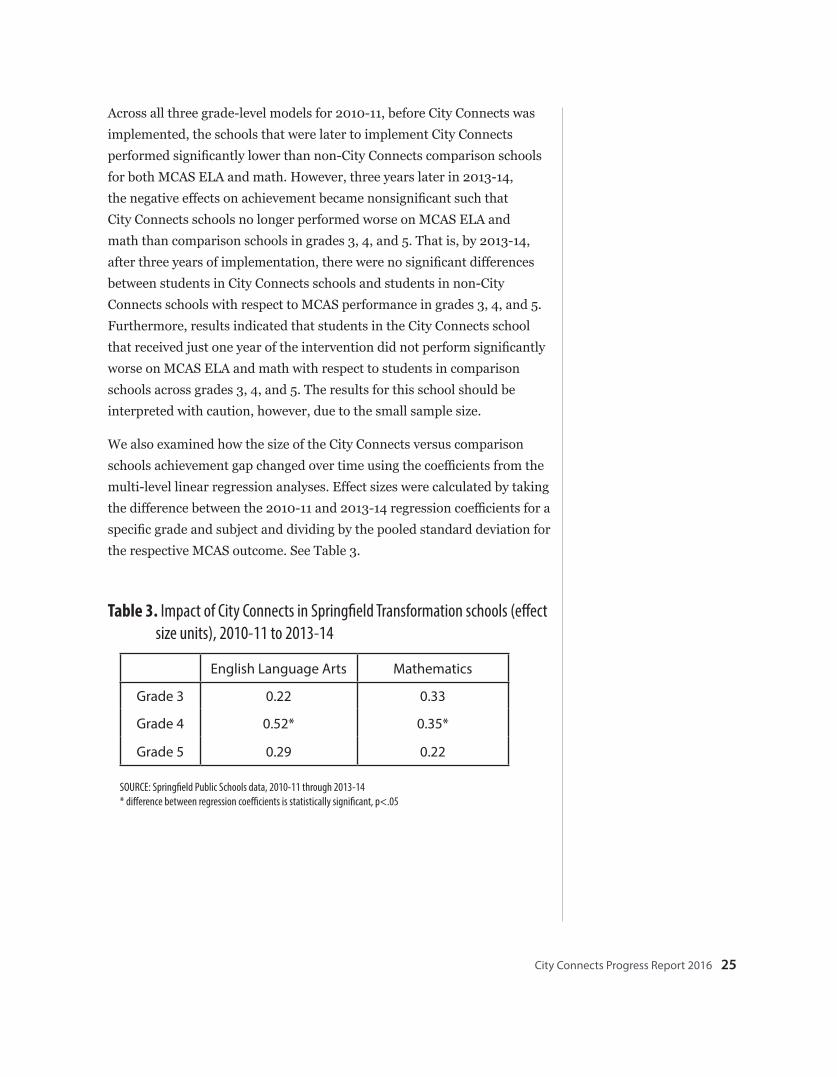
Across all three grade-level models for 2010-11, before City Connects was implemented, the schools that were later to implement City Connects performed significantly lower than non-City Connects comparison schools for both MCAS ELA and math. However, three years later in 2013-14, the negative effects on achievement became nonsignificant such that City Connects schools no longer performed worse on MCAS ELA and math than comparison schools in grades 3, 4, and 5. That is, by 2013-14, after three years of implementation, there were no significant differences between students in City Connects schools and students in non-City Connects schools with respect to MCAS performance in grades 3, 4, and 5. Furthermore, results indicated that students in the City Connects school that received just one year of the intervention did not perform significantly worse on MCAS ELA and math with respect to students in comparison schools across grades 3, 4, and 5. The results for this school should be interpreted with caution, however, due to the small sample size.
We also examined how the size of the City Connects versus comparison schools achievement gap changed over time using the coefficients from the multi-level linear regression analyses. Effect sizes were calculated by taking the difference between the 2010-11 and 2013-14 regression coefficients for a specific grade and subject and dividing by the pooled standard deviation for the respective MCAS outcome. See Table 3.
Table 3. Impact of City Connects in Springfield Transformation schools (effect size units), 2010-11 to 2013-14
English Language Arts Mathematics
Grade 3 0.22 0.33
Grade 4 0.52* 0.35*
Grade 5 0.29 0.22
SOURCE: Springfield Public Schools data, 2010-11 through 2013-14 * difference between regression coefficients is statistically significant, p<.05
©2016 Trustees of Boston College, Chestnut Hill, Massachusetts26
The reduction over time in the achievement gap between City Connects and non-City Connects schools is statistically significant in grade 4 ELA and math. Under What Works Clearinghouse (WWC) guidelines, all but two of the effect size differences reported in Table 3 are also practically significant: WWC (2014) states that effect sizes of .25 or greater are practically important regardless of statistical significance.
Before the Transformation school designation, failing schools in Springfield that would later become City Connects schools performed significantly worse than the comparison schools in both MCAS ELA and math. However, the gaps in test score performance narrowed after the launch of City Connects in these Transformation schools.
● By 2013-14, after three years of implementation, there were no significant differences between students in City Connects schools and students in non-City Connects comparison schools with respect to MCAS performance in grades 3, 4, and 5.
● For grade 3 math, grade 4 ELA and math, and grade 5 ELA, these gap reductions exceeded What Works Clearinghouse standards for substantively important effect sizes.
Improving standardized test scores in Boston Catholic Schools
Urban Catholic schools serve relatively high percentages of low-income students who face many of the same barriers as their neighbors attending public schools (O’Keefe & Scheopner, 2009). City Connects has been implemented in Boston Catholic schools since 2008. While the Boston Catholic schools are situated in some of the same geographic areas of the city as the Boston Public schools, they constitute a distinct site of implementation because of their different context.
In public schools, standardized test scores (such as the MCAS in Massachusetts) are commonly used to evaluate City Connects academic outcomes, as are report cards when their grading schemes are standardized across the district. Although MCAS is not administered in Boston Catholic schools, the Archdiocese of Boston began administering a standardized achievement measure, the Stanford 10 Achievement Test (SAT-10) in grades 2 through 8 during the 2009-10 school year. This is a norm-referenced assessment of student academic achievement including
City Connects Progress Report 2016 27
multiple-choice tests in math, language, reading, science, and social science. Here, we present an analysis comparing City Connects students’ performance on SAT-10 mathematics, reading, and language tests with the performance of students in similar schools that never experienced City Connects (Shields, Walsh & Lee-St. John, 2016).
Students included in the analysis. This study included 3,628 students from 17 Boston Catholic schools receiving the City Connects intervention, and 3,323 students from a comparison set of 10 Catholic elementary schools not implementing City Connects.2 The ten comparison schools were selected from a set of over 60 schools that did not receive City Connects based on similarity in geographic and demographic characteristics to treatment schools. Students who moved from intervention schools to or from comparison schools were excluded from the analysis (3% of the sample).
Four years of data were used (2009-10 through 2012-13) for students in grades 2 through 8. Although data were included in the analysis for seventh and eighth grades, sixth grade was chosen as the endpoint for the cross-sectional analysis because fewer schools offered upper grades, yielding a relatively small number of student records.
Analytic method and results. Multi-level longitudinal growth models were used to compare SAT-10 math, reading, and language scores for City Connects and comparison Catholic school students. These models were designed to account for multiple years of achievement data over time for each student, as well as for the grouping of students within schools. Student-level covariates included gender, race, special educational needs status, and eligibility for free or reduced-price lunch. An indicator for treatment status (City Connects school vs. not) was assigned at the school-level.
Sixth grade math scores were significantly higher for students in City Connects than for those in comparison schools after controlling for demographics. The difference was large, more than one third greater than the size of the achievement gap associated with eligibility for free or reduced-price lunch estimated in this analysis. Students in City Connects also had a significantly greater rate of achievement growth than students in comparison schools. Finally, students who were enrolled for more years in City Connects were more likely to experience additional achievement
©2016 Trustees of Boston College, Chestnut Hill, Massachusetts28
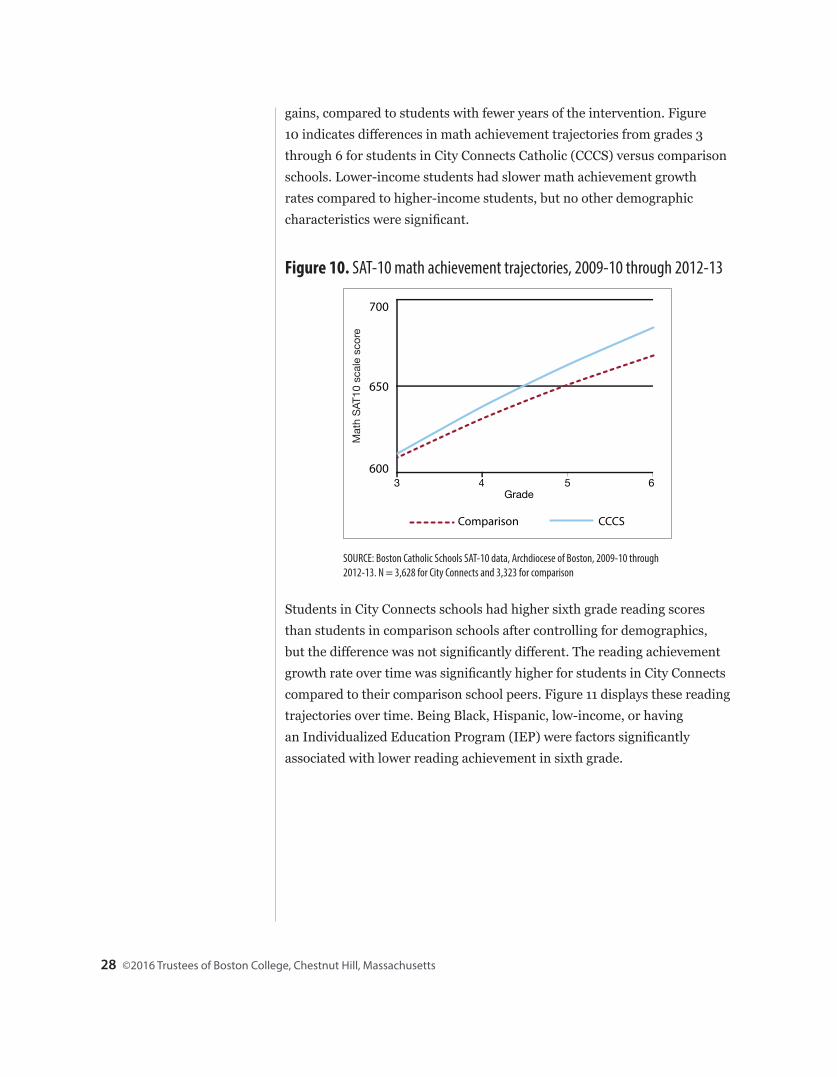
gains, compared to students with fewer years of the intervention. Figure 10 indicates differences in math achievement trajectories from grades 3 through 6 for students in City Connects Catholic (CCCS) versus comparison schools. Lower-income students had slower math achievement growth rates compared to higher-income students, but no other demographic characteristics were significant.
Figure 10. SAT-10 math achievement trajectories, 2009-10 through 2012-13
Grade
600
650
700
CCCSComparison
3 4 5 6
Mat
h SA
T10
scal
e sc
ore
SOURCE: Boston Catholic Schools SAT-10 data, Archdiocese of Boston, 2009-10 through 2012-13. N = 3,628 for City Connects and 3,323 for comparison
Students in City Connects schools had higher sixth grade reading scores than students in comparison schools after controlling for demographics, but the difference was not significantly different. The reading achievement growth rate over time was significantly higher for students in City Connects compared to their comparison school peers. Figure 11 displays these reading trajectories over time. Being Black, Hispanic, low-income, or having an Individualized Education Program (IEP) were factors significantly associated with lower reading achievement in sixth grade.
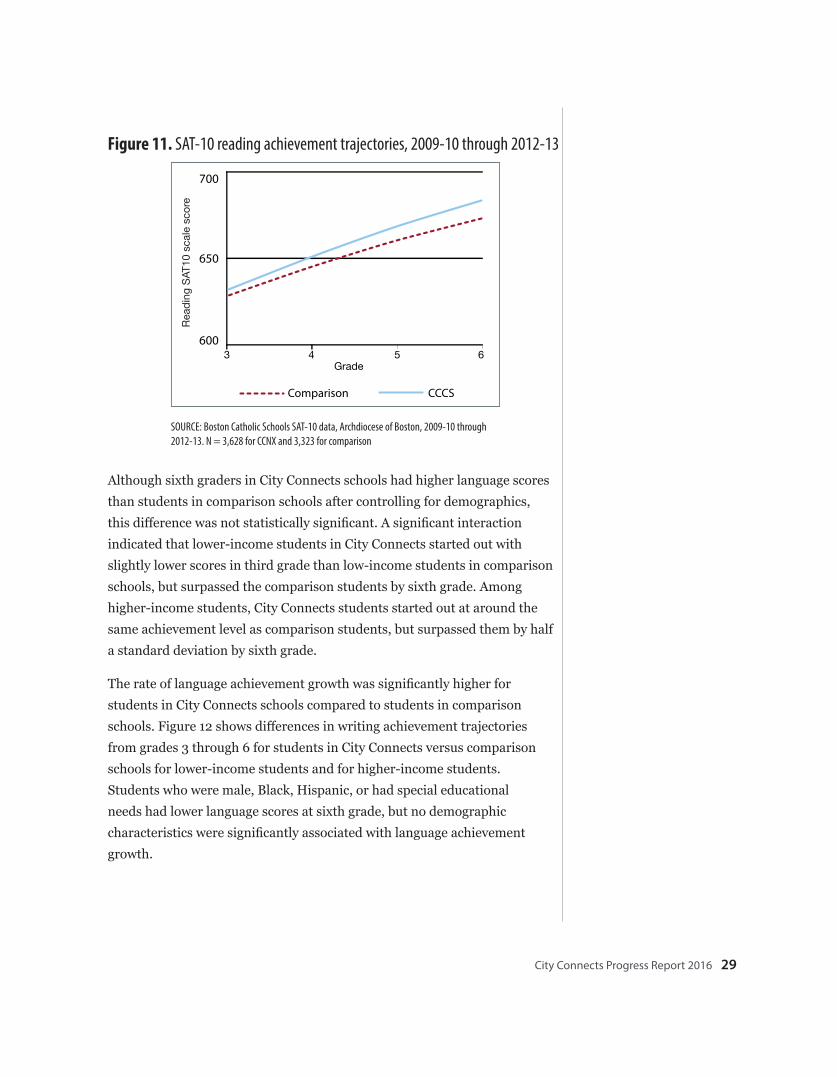
City Connects Progress Report 2016 29
Figure 11. SAT-10 reading achievement trajectories, 2009-10 through 2012-13
Grade
600
650
700
CCCSComparison
3 4 5 6
Read
ing
SAT1
0 sc
ale
scor
e
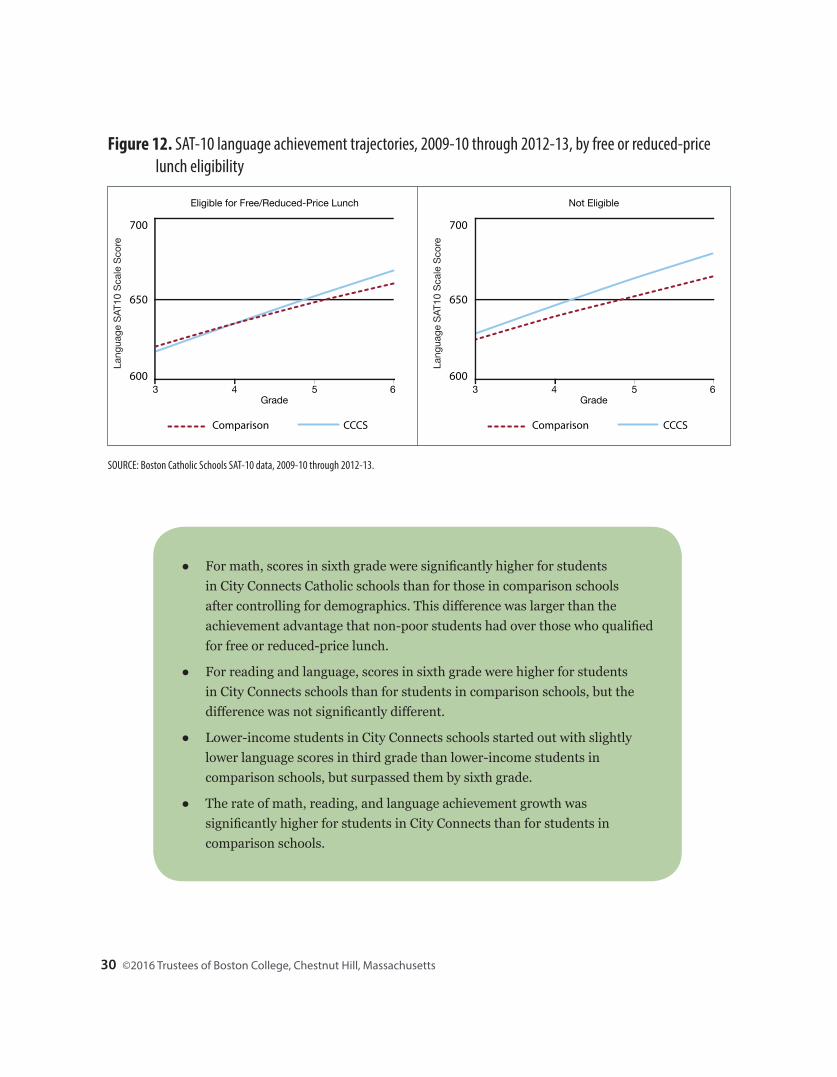
Although sixth graders in City Connects schools had higher language scores than students in comparison schools after controlling for demographics, this difference was not statistically significant. A significant interaction indicated that lower-income students in City Connects started out with slightly lower scores in third grade than low-income students in comparison schools, but surpassed the comparison students by sixth grade. Among higher-income students, City Connects students started out at around the same achievement level as comparison students, but surpassed them by half a standard deviation by sixth grade.
The rate of language achievement growth was significantly higher for students in City Connects schools compared to students in comparison schools. Figure 12 shows differences in writing achievement trajectories from grades 3 through 6 for students in City Connects versus comparison schools for lower-income students and for higher-income students. Students who were male, Black, Hispanic, or had special educational needs had lower language scores at sixth grade, but no demographic characteristics were significantly associated with language achievement growth.
SOURCE: Boston Catholic Schools SAT-10 data, Archdiocese of Boston, 2009-10 through 2012-13. N = 3,628 for CCNX and 3,323 for comparison
©2016 Trustees of Boston College, Chestnut Hill, Massachusetts30
Figure 12. SAT-10 language achievement trajectories, 2009-10 through 2012-13, by free or reduced-price lunch eligibility
Grade
600
650
700
CCCSComparison
Comparison N=228; CCCS N=1,005 Comparison N=2,175; CCCS N=2,211
Eligible for Free/Reduced-Price Lunch Not Eligible
Lang
uage
SAT
10 S
cale
Sco
re
3 4 5 6Grade
600
650
700
CCCSComparisonLa
ngua
ge S
AT10
Sca
le S
core
3 4 5 6
SOURCE: Boston Catholic Schools SAT-10 data, 2009-10 through 2012-13.
● For math, scores in sixth grade were significantly higher for students in City Connects Catholic schools than for those in comparison schools after controlling for demographics. This difference was larger than the achievement advantage that non-poor students had over those who qualified for free or reduced-price lunch.
● For reading and language, scores in sixth grade were higher for students in City Connects schools than for students in comparison schools, but the difference was not significantly different.
● Lower-income students in City Connects schools started out with slightly lower language scores in third grade than lower-income students in comparison schools, but surpassed them by sixth grade.
● The rate of math, reading, and language achievement growth was significantly higher for students in City Connects than for students in comparison schools.
City Connects Progress Report 2016 31
City Connects effects are consistent with causalityHaving observed robust, positive effects associated with City Connects across multiple methods, samples, and sites, we need to consider whether the effects are caused by the intervention. Evaluation designs incorporating random assignment of participants into treatment and comparison groups are optimal for making strong conclusions regarding intervention effects. Such experiments minimize threats to internal validity such as selection bias by using random assignment to ensure that participant characteristics are equivalent prior to treatment. With the organic growth of City Connects over time, it has not been possible to implement a randomized controlled trial. Further, since this school-level intervention serves every student in a school and is directed to each child in a unique way, incorporating a student-level randomized design presents challenges.
In the absence of randomized design, we have pursued the best possible evidence for the effectiveness of City Connects through the use of statistical solutions and high-quality data to rule out alternative hypotheses. Starting with basic inferential methods such as ordinary least-squares regression and moving to more complex modeling techniques, we continue to see consistent results across a variety of domains. Past analyses have employed complementary methods, such as longitudinal growth curve analysis (City Connects, 2012), propensity score matching (City Connects, 2012, 2014; Walsh et al., 2014), partitioning analysis (City Connects, 2010), and school-level fixed effects models (Dearing et al., 2016). Consistently, across methods, City Connects students are seen to significantly outperform comparison-school peers on a variety of measures of academic achievement and thriving.
Findings are consistent with what we would expect if City Connects were causing the outcomes.
● We would expect to see dosage effects. When we study the number of years a student has been in City Connects, we find that positive effects on report card grades are greatest for students spending the most time in the intervention. Also, students who had previously spent the most time in City Connects in elementary school experienced greater benefits on statewide test scores in
©2016 Trustees of Boston College, Chestnut Hill, Massachusetts32
middle school. Even in the real-world setting of Boston Public Schools, we see the same thing over and over: more time in the program is associated with more improvement in outcomes.
● The threat of selection bias has been addressed. Multiple analytic approaches were implemented to address selection threats to internal validity. For example, the difference-in-differences approach reported here addresses selection bias by using within-district comparison schools that are similar to treatment schools in the same years such that common trends affect both groups. In analyses that used propensity score approaches, covariate balance met What Works Clearinghouse standards for baseline equivalence between treatment and comparison groups after weighting. (While we included a range of school and student variables in propensity score models and as outcome model covariates, propensity score methods do not take unmeasured characteristics into account.) Additionally, we hypothesize that because districts chose to implement City Connects in schools identified as being in greater need, treatment schools started at a disadvantage in terms of academics relative to comparison schools; if anything, selection effects would not favor treatment schools.
● We expect that the intervention will achieve what it was designed to do. City Connects is achieving what it was designed to do: help children thrive and achieve in school. City Connects children are doing better in school, as measured by report card grades; on important tests, as measured by MCAS scores; and in indicators of life chances.
● We expect to see results replicate. The results of our evaluative review demonstrate the positive effects of City Connects repeatedly. The replication of these results is consistent with what we would see if the treatment program caused the effects.
Benefits of City Connects outweigh costsThere is now converging evidence that City Connects makes a difference for students’ academic achievement (as reflected in report card scores and standardized test scores) and life chances (as reflected in lower rates of chronic absenteeism from school and lower rates of school dropout). With the effectiveness of the intervention well supported by evidence from
City Connects Progress Report 2016 33
multiple studies, City Connects sought to understand how efficient the intervention is. In other words, what is the benefit relative to the cost?
An independent study by the Center for Benefit-Cost Studies of Education (CBCSE) at Columbia University demonstrated that the economic benefits of City Connects are larger than the costs. Over several decades, the CBCSE has developed and refined an approach to estimating both the costs and the economic benefits of educational interventions (Levin, 1975, Belfield, 2015). At a time when resources to invest in education are scarce, understanding cost-effectiveness is essential to making wise investments in education at the local, state or national level (Levin & McEwan, 2002).
For its cost calculations, the CBCSE used its “ingredients” approach, which estimates the contribution of resources such as personnel salaries, space, materials, and the value of volunteer time. For the City Connects study, the researchers estimated all costs, whether they were incurred by the City Connects central program, the school where the intervention was implemented, or a community partner that delivered services for students. The study recognized the need to calculate a “business as usual” cost for schools not implementing City Connects. In this calculation, the study considered a variety of assumptions about how comparison schools might differ (or not differ) in the costs of community partner services provided to their students.
The study estimated the benefits to society as reflected in higher test scores (Walsh et al., 2014) and lower rates of high school dropout (City Connects, 2014). These studies reported benefits experienced by students enrolled in City Connects during elementary school relative to those who never experienced City Connects. Improvements in achievement and lower dropout translate to such benefits as higher lifetime earnings, lower rates of incarceration, and lower dependence on public assistance.
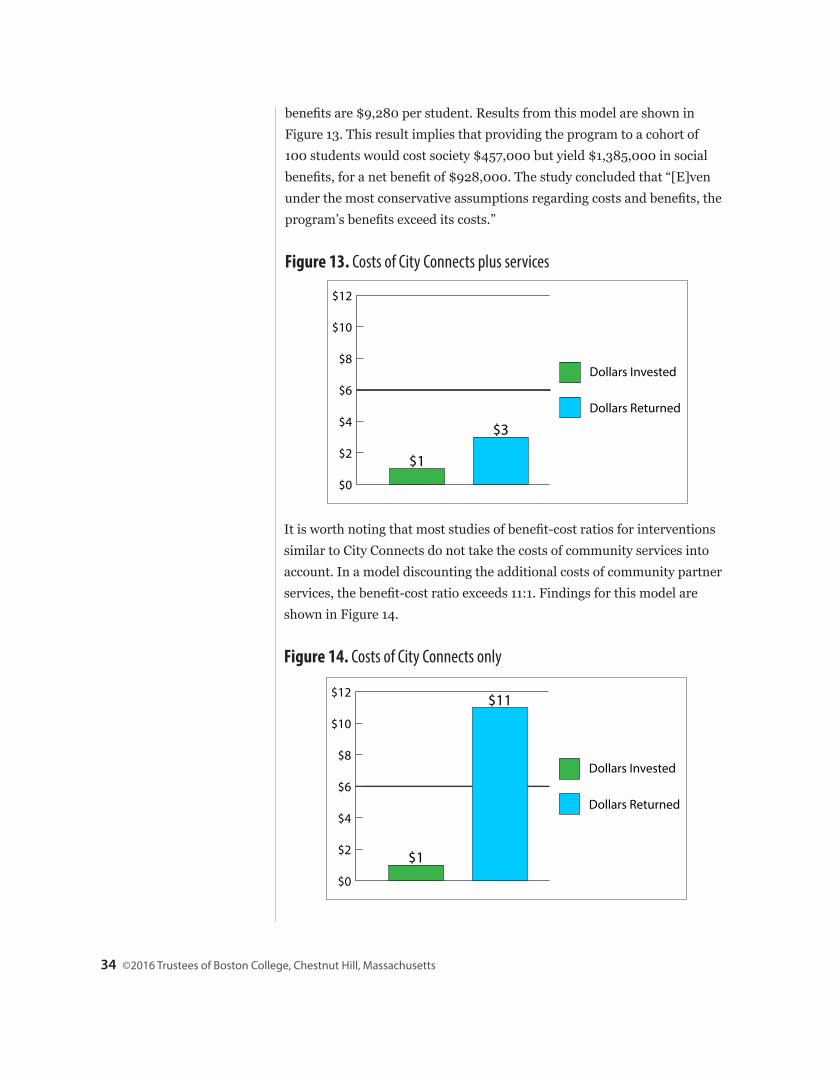
The results showed that the total cost of six years of City Connects (the dosage under which effects were measured) is $4,570 per student (that is, $762 per year per student), which includes a portion of the costs of the community partner services received by the students in City Connects schools. Depending on what share of the community partner services are considered to be above and beyond the baseline level, the total cost estimate can range from $1,540 to $9,320 per student. Under the model that best fits with data on implementation, the benefit-cost ratio is 3.0 and the net
©2016 Trustees of Boston College, Chestnut Hill, Massachusetts34
benefits are $9,280 per student. Results from this model are shown in Figure 13. This result implies that providing the program to a cohort of 100 students would cost society $457,000 but yield $1,385,000 in social benefits, for a net benefit of $928,000. The study concluded that “[E]ven under the most conservative assumptions regarding costs and benefits, the program’s benefits exceed its costs.”
Figure 13. Costs of City Connects plus services
$0
$2
$4
$6
$8
$10
$12
$3
$1
Dollars Returned
Dollars Invested
$0
$2
$4
$6
$8
$10
$12
Dollars Returned
$11
$1
Dollars Invested
It is worth noting that most studies of benefit-cost ratios for interventions similar to City Connects do not take the costs of community services into account. In a model discounting the additional costs of community partner services, the benefit-cost ratio exceeds 11:1. Findings for this model are shown in Figure 14.
Figure 14. Costs of City Connects only
City Connects Progress Report 2016 35
ConclusionsThe findings summarized in this report converge: student support in schools can be delivered in a high-impact way. With City Connects, teachers collaborate to consider the strengths and needs of every student, every year. An individualized plan of supports and services from the school and community is put in place, with tracking and follow-up. This approach is cost-effective, returning a benefit to society that far exceeds the initial investment.
The robustness of findings on student outcomes across methods, samples, and sites strengthens the evidence that addressing out-of-school factors promotes students’ achievement and life chances. Careful attention to the unique skills, talents, and needs of each student makes a difference.
©2016 Trustees of Boston College, Chestnut Hill, Massachusetts36
ReferencesAn, C. (2015). Estimating the effectiveness of City Connects on middle
school outcomes. Doctoral dissertation, Boston College.
Angrist, J. D. & Pischke, J. (2010). The credibility revolution in empirical economics: How better research design is taking the con out of econometrics. Journal of Economic Perspectives 24(2), 3-30.
Belfield, C.R. (2015). Cost-benefit analysis and cost-effectiveness analysis. In H.F. Ladd & M.E. Goertz (Eds.), Handbook of research in education finance and policy (pp. 141-156). 2nd ed. Routledge.
Berliner, D. (2013). Effects of inequality and poverty vs. teachers and schooling on America’s youth. Teacher’s College Record 115(12), 1-26.
Bowden, A.B., Belfield, C.R., Levin, H.M., Shand, R., Wang, A. & Morales, M. (2015). A benefit-cost analysis of City Connects. Center for Benefit-Cost Studies of Education, Teachers College, Columbia University. Available: cbcse.org
Bryk, A. S., Sebring, P. B., Allensworth, E., Luppescu, S. & Easton, J. Q. (2010). Organizing schools for improvement: Lessons from Chicago. Chicago, IL: University of Chicago Press.
Buckley, J. & Shang, Y. (2003). Estimating policy and program effects with observational data: the “differences-in-differences” estimator. Practical Assessment, Research, and Evaluation, 8(24). Available: http://PAREonline.net/getvn.asp?v=8&n=24
Carter, P. L. & Reardon, S. F. (2014). Inequality matters. New York: William T. Grant Foundation.
City Connects (2014). The impact of City Connects: Progress report 2014. Chestnut Hill, MA: Center for Optimized Student Support. Available: http://www.bc.edu/content/dam/cityconnects/Publications/CityConnects_ProgressReport_2014.pdf
City Connects Progress Report 2016 37
City Connects. (2012). The impact of City Connects: Progress report 2012. Available: http://www.bc.edu/content/dam/files/schools/lsoe/cityconnects/pdf/CityConnects_ProgressReport_2012.pdf
City Connects (2010). The impact of City Connects: Annual report 2010. Chestnut Hill, MA: Center for Optimized Student Support, Lynch School of Education, Boston College. Available: www.bc.edu/content/dam/files/schools/lsoe/cityconnects/pdf/ CityConnects_AnnualReport_2010_web.pdf
Coleman, J. S., Campbell, E. Q., Hobson, C. J., McPartland, J., Mood, A. M., Weinfeld, F. D. & York, R. L. (1966). Equality of educational opportunity. Washington, DC: US Department of Health, Education, and Welfare, Office of Education.
Cook, T. D., Shadish, W. R. & Wong, V. C. (2008). Three conditions under which experiments and observational studies produce comparable causal estimates: New findings from within-study comparisons. Journal of Policy Analysis and Management 27(4), 724-750.
Dearing, E., Walsh, M., Sibley, E., Lee-St. John, T., Foley, C. & Raczek, A. (2016). Can community and school-based supports improve the achievement of first-generation immigrant children attending high-poverty schools? Child Development 87(3), 883-897.
Duncan, G.J. & Murnane, R.J. (2011). Whither opportunity? Rising inequality, schools, and children’s life chances. New York: Russell Sage.
Harrington, M. (1962). The other America: Poverty in the United States. New York, NY: Simon & Schuster.
Lechner, M., (2010). The estimation of causal effects by difference-in-difference methods. Foundations and Trends in Econometrics 4(3), 165-224.
Levin, H. M. (1975). Cost-effectiveness analysis in evaluation research. In M. Guttentag & E.L. Struening (Eds.), Handbook of evaluation research (pp. 89-122). Volume 2. London: Sage.
©2016 Trustees of Boston College, Chestnut Hill, Massachusetts38
Levin, H. M. & McEwan, P.J. (2002). Cost-effectiveness analysis and educational policy. In H. M. Levin & P. J. McEwan (Eds.), Cost-effectiveness and educational policy: 2002 yearbook of the American Education Finance Association (pp. 1-17). Larchmont, NY: Eye on Education.
McCartney, K., Bub, K. L. & Burchinal, M. R. (2006). VI. Selection, detection, and reflection. In K. McCartney, M. Burchinal & K.L. Bub (Eds.), Best practices in quantitative methods for developmentalists. Monographs of the Society for Research in Child Development 71 (3), 105-126.
O’Keefe, J. M. & Scheopner, A. J. (2009). Bridging the gap: Urban Catholic schools addressing educational achievement and opportunity gaps in the United States. International Studies in Catholic Education 1, 15-29.
Phillips, M., Brooks-Gunn, J., Duncan, G., Klebanov, P. & Crane, J. (1998). Family background, parenting practices, and the black–white test score gap. In C. Jencks & M. Phillips (Eds.), The black-white test score gap (pp. 103-145). Washington, D.C.: Brookings Institution Press.
Reardon, S. F. (2011). The widening academic achievement gap between the rich and the poor: New evidence and possible explanations. In G. Duncan & R. Murnane (Eds.), Whither opportunity? Rising inequality, schools, and children’s life chances (pp. 91–115). New York, NY: Russell Sage Foundation Press.
Rothstein, R. (2010). How to fix our schools. Issue Brief #286. Washington, DC: Economic Policy Institute, October 14, 2010. Available: www.epi.org.
Shadish, W.R., Cook, T.D. & Campbell, D.T. (2002). Experimental and quasi-experimental designs for generalized causal inference. Belmont, CA: Wadsworth.
Shields, K.A., Walsh, M.E. & Lee-St. John, T.J. (2016). The relationship of a systemic student support intervention to academic achievement in urban Catholic schools. Journal of Catholic Education 19 (3), 116-141.
City Connects Progress Report 2016 39
Walsh, M. E. & Brabeck, M. M. (2006). Resilience and risk in learning: Complex interactions and comprehensive interventions. In R. J. Sternberg & R. F. Subotnik (Eds.), Optimizing student success in school with the other three Rs: Reasoning, resilience, and responsibility (pp. 113–142). Greenwich, CT: Information Age Publishing.
Walsh, M. E., Madaus, G. F., Raczek, A. E., Dearing, E., Foley, C., An, C. Lee-St. John, T. & Beaton, A. (2014). A new model for student support in high-poverty urban elementary schools: effects on elementary and middle school academic outcomes. American Educational Research Journal 51(4), 704-737.
Walsh, M. E. & Murphy, J. (2003). Children, health, and learning: A guide to the issues. Westport, CT: Praeger.
What Works Clearinghouse (2014). What Works Clearinghouse. Available: http://ies.ed.gov/ncee/wwc/
Wong, M., Cook, T. D. & Steiner, P. M (2015). Adding design elements to improve time series designs: No Child Left Behind as an example of causal pattern-matching. Journal of Research on Educational Effectiveness 8(2), 245-279.
©2016 Trustees of Boston College, Chestnut Hill, Massachusetts40
City Connects StaffMary E. Walsh, Ph.D.
Executive Director, City Connects Kearns Professor, Department of Counseling, Developmental, and Educational Psychology, Lynch School of Education, Boston College Director of the Boston College Center for Optimized Student Support
Claire Foley, Ph.D. Associate Director and Director of Research Reports Visiting Professor in Linguistics, Boston College
Jennifer Coyle, M.A. Manager of Special Projects
Patrice DiNatale, M.Ed. Director of New Practice
Samuel Hay, M.A. Learning and Development Manager
Rebecca Ledford, M.A. Systems Coordinator
Emily Raviola, M.P.H. Director of Operations and Project Management
Christine Spindler Administrative Officer
Lynne Sullivan, M.B.A. Director of Implementation
Brian Ward, M.A. Technology Coordinator
Joan Wasser Gish, J.D., M.A. Director of Strategic Initiatives, Center for Optimized Student Support
City Connects Progress Report 2016 41
Research Staff
George Madaus, Ed.D. Director of Evaluation, Emeritus Boisi Professor Emeritus, Department of Educational Research, Measurement and Evaluation, Lynch School of Education, Boston College Founding Director, Boston College Center for Testing, Evaluation, and Educational Policy
Anastasia Raczek, M.Ed. Associate Director of Evaluation
Terrence Lee-St. John, Ph.D. Quantitative Research Associate (2013-15)
Diego Luna Bazaldua, Ph.D. Quantitative Research Associate
Jessica Petrie, Ph.D. Continuous Improvement Specialist
Erin Sibley, Ph.D. Qualitative and Quantitative Research Associate
Consultants (2009-present)
Henry Braun, Ph.D. Boisi Professor, Department of Educational Research, Measurement and Evaluation, Lynch School of Education, Boston College Director, Boston College Center for Testing, Evaluation and Educational Policy
Eric Dearing, Ph.D. Associate Professor, Department of Counseling, Developmental, and Educational Psychology, Lynch School of Education, Boston College
Maureen Kenny, Ph.D. Professor, Department of Counseling, Developmental, and Educational Psychology, Lynch School of Education, Boston College
Laura O’Dwyer, Ph.D. Associate Professor, Department of Educational Research, Measurement and Evaluation, Lynch School of Education, Boston College
©2016 Trustees of Boston College, Chestnut Hill, Massachusetts42
Graduate Research Assistants (2014-2015)Bercem Akbayin, M.Ed.Chen An, M.Ed.Samuel HayElizabeth HerbAlyssa KendallJordan LawsonEvan Michel, M.A.Rebecca NelsonKirsten ReneAli SwendsenMaria Theodorakakis, M.A.
Graduate Research Assistants (2015-2016)Wen-Chia Claire Chang, M.A.Agnes Chung, M.S.Ed., M.Phil.Ed.Chelsea HancockAlyssa KendallJordan Lawson, M.A.Rebecca NelsonJames ParkKirsten Rene, M.A.Maria Theodorakakis, M.A.Caroline Vuilleumier, M.Ed.
External Evaluators (2009-present)
Albert Beaton, Ed.D. Former Augustus Long Professor Education, Lynch School of Education, Boston College Director of design, research, and data analysis for the National Assessment of Educational Progress (NAEP) Chairman of IEA’s Technical Advisory Committee (1989-1993)
City Connects Progress Report 2016 43
Clive Belfield, Ph.D. Principal Economist, Center for Benefit-Cost Studies of Education, Teachers College, Columbia University Associate Professor of Economics at Queens College, City University of New York
Brooks Bowden, Ph.D. Associate Director and Senior Research Scientist, Center for Benefit-Cost Studies of Education, Teachers College, Columbia University
Jennifer Hebert-Beirne, Ph.D. Vice President of Research and Development, Women’s Health Foundation, Chicago Former policy planner and analyst, Chicago Department of Public Health
Paul Holland, Ph.D. Professor Emeritus at the Graduate School of Education and Department of Statistics, University of California, Berkeley Fellow of the American Educational Research Association
Thomas Kellaghan, Ph.D. Director, Educational Research Centre, St. Patrick’s College, Dublin Fellow of the International Academy of Education President, International Association for Educational Assessment (1997-2001)
Henry M. Levin, Ph.D. William H. Kilpatrick Professor of Economics & Education Director, Center for Benefit-Cost Studies of Education, Teachers College, Columbia University David Jacks Professor of Higher Education and Economics, Emeritus, Stanford University
Patrick McEwan, Ph.D. Whitehead Associate Professor of Critical Thought, Department of Economics, Wellesley College
Elizabeth Reisner, M.Ed. Founder and Manager, Policy Studies Associates, Inc., Washington D.C.
Peter Steiner, Ph.D. Assistant Professor of Educational Psychology, University of Wisconsin-Madison

©2016 Trustees of Boston College, Chestnut Hill, Massachusetts44
Implementation TeamProgram Managers
Sara Davey, M.S.W. Program Manager, Boston Public Schools
Joseph King, M.Ed. Program Manager, Boston Public Schools and Ohio Elementary and Middle Schools
Torylee Cigna, M.Ed. Program Manager, Boston Catholic Schools
Julie Donovan, M.S.W. Program Manager, Springfield Public Schools
Ron Cope, M.A.S. Program Manager, New York City Public Schools
Laurie Acker, M.S. Program Manager, Minneapolis Catholic Schools
Charlene Perez Program Manager, Hartford Public Schools
City Connects Coordinators (2015-2016)
Boston Public SchoolsMorgan Atkins, M.Ed., Eliot K-8 SchoolHollie Badger, M.S.W., Dever Elementary SchoolCourtney Bruno, M.S., Mission Hill SchoolKatie Chung, M.Ed., M.S.W., S. Greenwood K-8 SchoolVictoria Eells, M.S.W., John F. Kennedy Elementary SchoolKristina Gregory, M.S., Jackson Mann K-8 SchoolMark Griffin, M.A., Edison K-8 SchoolMelissa Hambley, M.Ed., Quincy Upper SchoolJulia MacEwan, M.S.W., Mason Elementary SchoolValia Markaki, M.S., Quincy Elementary SchoolEllena McFarland, M.S.W., Mendell Elementary SchoolDanielle Morrissey, M.S.W., Kenny Elementary School
City Connects Progress Report 2016 45
Molly O’Connor, M.S.W., M.A., Gardner Pilot AcademyWill Osier, M.Ed., Chittick Elementary SchoolElise Powers, M.Ed., Shaw Elementary SchoolAdam Prisby, M.Ed., Bates Elementary SchoolShelby Riley, M.S.W., Edison K-8 SchoolKate Rossi, M.S.W., Jackson Mann K-8 SchoolHarold Rudolph, M.A., Orchard Gardens K-8 SchoolJaymie Silverman, M.S.W., Winthrop Elementary SchoolLauren Smith, M.A., Clap Innovation SchoolLunhide Smith, M.S.W., Orchard Gardens K-8 SchoolSarah Walls, M.S.W., Winship Elementary SchoolAnne Young, M.S.W., Holmes Elementary SchoolTammy Yeung, M.S., Quincy Elementary School
Boston Catholic SchoolsSabrina Alampi, M.S.W., Sacred Heart SchoolKercine Elie, M.S., Trinity Catholic AcademyPeyton Grant, M.S., Pope John Paul II Catholic Academy Mattapan CampusKristen Lacourciere, M.Ed., South Boston Catholic AcademyJuliana Machado, M.S., East Boston Central Catholic School and Saint John
SchoolPeter MacNeil, M.Ed., Saint Rose SchoolCelia Meegan, M.Ed., Mission Grammar SchoolKirby Morrison, M.S., Pope John Paul II Catholic Academy Neponset
CampusBarbara Reed, M.A., Pope John Paul II Catholic Academy Lower Mills
CampusTara Senarian, Laboure Childcare CenterLindsey Warner, M.A., Saint Columbkille Partnership SchoolJessica Whelan, M.Ed., Pope John Paul II Catholic Academy Columbia
Campus
Brockton Public SchoolsElizabeth O’Brien, M.Ed., Angelo Elementary School
©2016 Trustees of Boston College, Chestnut Hill, Massachusetts46
Springfield Public SchoolsElizabeth Antaya-Izoita, M.S.W., Gerena Community SchoolRoxanne Atterbury-Whyne, M.Ed., Gerena Community SchoolMaggie Cahillane, M.A., White Street Elementary SchoolLindsay Cuadras, M.Ed., South End Middle SchoolMichael Feinberg, M.Ed., Duggan Middle SchoolLeia Georgeopolus, M.Ed., Kiley Middle SchoolJennifer Hill, M.Ed., Brookings Elementary SchoolMichelle Ledoux, M.S.W., Ed.D., Early Childhood Education CenterEnelida Mantilla, M.S.W., Commerce High School Jennifer Murray, M.S.W., Milton Bradley SchoolJaime Perez-Aponte, M.S.W., Brightwood Elementary SchoolMichelle Polimeni, M.Ed., DeBerry Elementary SchoolMelissa Weiner, M.S.W., Indian Orchard Elementary SchoolHeidi Wilcox, M.Ed., Zanetti Montessori Magnet School
New York City Public SchoolsStudent Resource Coordinators Implementing City ConnectsJacqueline Brimmage-Manuel, M.S.W., P.S. 152 Dyckman Valley SchoolPaola Gonzalez, M.S.W., M.S. 324 Patria Mirabal SchoolLupe Guevara, M.S.W., I.S. 219 New Venture SchoolYozmine Modeste, M.A., Curtis High SchoolMaria Panora, M.A., C.S. 61 Francisco Oller SchoolSandra Romero, M.S.W., C.S. 211 The Bilingual Magnet SchoolEvelyn Rubio, M.S.W., P.S. 008 Luis Belliard SchoolSeema Sagar, M.S.W., M.S. 301 Paul L. Dunbar SchoolKayan Tyus, M.A., P.S. 50/M.S. 50 Vito Marcantonio School
Ohio Public and Catholic SchoolsJama Badinghaus, M.Ed., Chaminade Julienne High SchoolMegan Bettelon, M.S.W., Our Lady of the Rosary SchoolSusan Eichenauer, M.A., Chaminade Julienne High SchoolAmanda Jane Grimm, M.Ed., Chaminade Julienne High SchoolAdairia Kelly, M.S.W., DECA Prep Elementary School
City Connects Progress Report 2016 47
Andrea Migliozzi, M.S.W., Catholic Central Middle/High SchoolJosh Richardt, M.S.E., Catholic Central Elementary SchoolKristen Scharf, M.S.E., Catholic Central Elementary School
Minneapolis Catholic SchoolsBreanna Freundschuh, Blessed Trinity SchoolCaroline McGowan, M.A., Ascension SchoolLindsay O’Keefe, M.Ed., Risen Christ SchoolMegan Palmer, M.Ed., Pope John Paul II School and St. Helena SchoolLori Skarupa, M.Ed., Saint Jerome School and Saint Pascal School
Hartford Public SchoolsTamara Acosta, M.S.W., Burns Latino Studies AcademyBobby Casiano, M.S., M.S.W., Burr Elementary SchoolLisette Cobb, M.S., Wish Elementary SchoolDoreen Marshall, M.S.W., M.L. King Elementary SchoolAmy Ramirez, M.S.W., Clark Elementary & Middle SchoolJulia Samuels, M.S.W., Milner Elementary School
Information Technology SupportBarry Schaudt, Ph.D.
Director, Research Services, Boston College
City Connects is based at theCenter for Optimized Student Support at
the Lynch School of Education, Boston College.
Please direct all inquiries regarding this report to: Mary E. Walsh, Ph.D.
Campion Hall, Room 305D140 Commonwealth Ave.Chestnut Hill, MA 02467
www.CityConnects.org@CityConnects