Embed Size (px)
Citation preview

Atmos. Meas. Tech., 8, 3087–3106, 2015
www.atmos-meas-tech.net/8/3087/2015/
doi:10.5194/amt-8-3087-2015
© Author(s) 2015. CC Attribution 3.0 License.
The Ice Selective Inlet: a novel technique for exclusive extraction of
pristine ice crystals in mixed-phase clouds
P. Kupiszewski1, E. Weingartner1,a, P. Vochezer2, M. Schnaiter2, A. Bigi3, M. Gysel1, B. Rosati1, E. Toprak2,
S. Mertes4, and U. Baltensperger1
1Laboratory of Atmospheric Chemistry, Paul Scherrer Institute, Villigen PSI, Switzerland2Institute for Meteorology and Climate Research, Karlsruhe Institute of Technology, Karlsruhe, Germany3Department of Engineering “Enzo Ferrari”, University of Modena and Reggio Emilia, Modena, Italy4Leibniz Institute for Tropospheric Research, Leipzig, Germanyanow at: Institute for Aerosol and Sensor Technology, University of Applied Sciences, Windisch, Switzerland
Correspondence to: E. Weingartner ([email protected])
Received: 19 November 2014 – Published in Atmos. Meas. Tech. Discuss.: 12 December 2014
Revised: 8 June 2015 – Accepted: 20 July 2015 – Published: 3 August 2015
Abstract. Climate predictions are affected by high uncer-
tainties partially due to an insufficient knowledge of aerosol–
cloud interactions. One of the poorly understood processes is
formation of mixed-phase clouds (MPCs) via heterogeneous
ice nucleation. Field measurements of the atmospheric ice
phase in MPCs are challenging due to the presence of much
more numerous liquid droplets. The Ice Selective Inlet (ISI),
presented in this paper, is a novel inlet designed to selec-
tively sample pristine ice crystals in mixed-phase clouds and
extract the ice residual particles contained within the crystals
for physical and chemical characterization. Using a modular
setup composed of a cyclone impactor, droplet evaporation
unit and pumped counterflow virtual impactor (PCVI), the
ISI segregates particles based on their inertia and phase, ex-
clusively extracting small ice particles between 5 and 20 µm
in diameter. The setup also includes optical particle spec-
trometers for analysis of the number size distribution and
shape of the sampled hydrometeors.
The novelty of the ISI is a droplet evaporation unit, which
separates liquid droplets and ice crystals in the airborne state,
thus avoiding physical impaction of the hydrometeors and
limiting potential artefacts. The design and validation of the
droplet evaporation unit is based on modelling studies of
droplet evaporation rates and computational fluid dynamics
simulations of gas and particle flows through the unit. Prior
to deployment in the field, an inter-comparison of the opti-
cal particle size spectrometers and a characterization of the
transmission efficiency of the PCVI was conducted in the
laboratory. The ISI was subsequently deployed during the
Cloud and Aerosol Characterization Experiment (CLACE)
2013 and 2014 – two extensive international field campaigns
encompassing comprehensive measurements of cloud micro-
physics, as well as bulk aerosol, ice residual and ice nu-
clei properties. The campaigns provided an important op-
portunity for a proof of concept of the inlet design. In this
work we present the setup of the ISI, including the modelling
and laboratory characterization of its components, as well as
field measurements demonstrating the ISI performance and
validating the working principle of the inlet. Finally, mea-
surements of biological aerosol during a Saharan dust event
(SDE) are presented, showing a first indication of enrichment
of bio-material in sub-2 µm ice residuals.
1 Introduction
High uncertainties in future climate predictions arise from in-
sufficient knowledge of the interaction of clouds with visible
(solar) and infrared (terrestrial) radiation. The optical prop-
erties, cloud lifetime and cloud cover are strongly influenced
by the ability of atmospheric aerosol particles to act as cloud
condensation nuclei (CCN) or ice nuclei (IN) (Lohmann and
Feichter, 2005; Penner, 2004). These aerosol–cloud interac-
tions have been recognized as the greatest sources of uncer-
tainty in the anthropogenic effective radiative forcing (Myhre
et al., 2013) and, thus, in assessing human impact on cli-
Published by Copernicus Publications on behalf of the European Geosciences Union.
3088 P. Kupiszewski et al.: The Ice Selective Inlet
mate. Up to now, the climate-relevant properties of clouds
and their formation processes are still poorly understood,
particularly those of mixed-phase clouds where supercooled
liquid droplets and ice crystals coexist. Previous research
has found that the cloud radiative properties strongly de-
pend on the cloud ice mass fraction (Sun and Shine, 1994),
which is influenced by the abundance of IN. Increased IN
concentrations are also thought to enhance precipitation in
mixed-phase clouds (Pruppacher and Klett, 1997), thus caus-
ing a decrease in cloud lifetime and cloud cover, and affect-
ing the radiative budget of the atmosphere (Lohmann and Fe-
ichter, 2005). Meanwhile, the physical and chemical proper-
ties of atmospherically relevant IN are not well known. For
example, it is unclear whether anthropogenic emissions of
black carbon (BC) contribute significantly to IN number, in
addition to natural IN such as mineral dust or bacteria. Field
measurements have not been conclusive as to the role of BC.
For example, based on measurements at the high-altitude re-
search station Jungfraujoch, Cozic et al. (2008) found enrich-
ment of BC in ice residuals (IRs) extracted from small ice
crystals, while Chou et al. (2011) found no correlation be-
tween IN number concentration and BC mass concentration.
Should BC be an atmospherically important IN, the increase
in aerosol concentrations since pre-industrial times would be
responsible for a glaciation indirect effect on clouds. Cloud
glaciation would be more frequent in the present day, result-
ing in a higher precipitation probability of a cloud (due to
the rapid growth of ice crystals at the expense of supercooled
droplets via the Wegener–Bergeron–Findeisen process). This
in turn could have reduced the cloud fraction, thus leading
to an increase in absorption of shortwave radiation by the
Earth–atmosphere system (Lohmann, 2002).
The interaction between aerosols and mixed-phase clouds
(MPCs) is presently poorly understood, and field studies on
the physical and chemical characteristics of IN are sparse
(Cantrell and Heymsfield, 2005). A number of studies on IR
properties have been conducted in high-altitude ice clouds
using a counterflow virtual impactor (CVI) to separate in-
terstitial aerosol particles and ice crystals (e.g. Cziczo et al.,
2013; Prenni et al., 2007; Twohy and Poellot, 2005). How-
ever, field measurements of ice residuals in mixed-phase
clouds are hampered by difficulties with extracting the rel-
atively few ice crystals found in MPCs and separating them
from the much more numerous supercooled liquid droplets.
This challenge is further exacerbated by the fact that small,
freshly nucleated ice crystals have similar aerodynamic di-
ameters to the liquid cloud droplets and thus cannot be sepa-
rated using conventional impactor techniques. To the best of
the authors’ knowledge, prior to this work only one ground-
based inlet for sampling ice crystals in MPCs had been suc-
cessfully operated and described in the literature. This so-
called Ice Counterflow Virtual Impactor (Ice-CVI) (Mertes
et al., 2007) employs a series of modules to remove pre-
cipitating particles, particles larger than 20 µm, supercooled
droplets and interstitial particles. Separation of the liquid and
ice phases is achieved using a two-stage impactor consisting
of cool plates on which hydrometeors are impinged. Upon
impact the droplets freeze on the surface of the plate, while
the ice crystals bounce off.
In view of the difficulties in measurements of the ice phase
in MPCs, the paucity of inlet systems suitable for MPC char-
acterization, and the resulting scarcity of data from the field,
there is a great need for development of novel instrumenta-
tion. In this paper we describe the Ice Selective Inlet (ISI),
which was designed and developed to extract ice crystals in
MPCs and is conceptually inspired by the Ice-CVI (Mertes
et al., 2007). The ISI separates small pristine ice particles
(their residuals are considered representative of the origi-
nal IN) from supercooled liquid droplets, interstitial parti-
cles and potentially contaminated large ice crystals, and it
extracts the ice residuals contained within the small ice crys-
tals for physical and chemical characterization. The inlet rep-
resents a novel tool for the in situ investigation of MPCs,
and the optical particle spectrometers contained within the
inlet deliver information that is not available by means of any
other existing inlet. The ISI was successfully deployed and
tested in the field for the first time as part of the Cloud and
Aerosol Characterization Experiment (CLACE) 2013 – an
international campaign encompassing comprehensive mea-
surements of cloud microphysics, as well as bulk aerosol, ice
residual and ice nuclei properties (Lloyd et al., 2015; Schenk
et al., 2014; Schmidt et al., 2015; Vochezer et al., 2015; Wor-
ringen et al., 2015). The ISI was modified following CLACE
2013 and subsequently re-deployed during CLACE 2014. In
this work we present the setup of the ISI, including the mod-
elling and laboratory characterization of its components, as
well as measurements from the CLACE 2013 and 2014 field
campaigns, validating the operating principle of the ISI. Fi-
nally, an analysis of bioaerosol measurements during a Sa-
haran dust event (SDE) is presented, showing enrichment of
bio-material in sub-2 µm ice residuals.
2 Setup and characterization of the Ice Selective Inlet
and additional instrumentation
2.1 Ice Selective Inlet setup
The design of the Ice Selective Inlet (Fig. 1) is inspired by
the Ice-CVI inlet (Mertes et al., 2007), albeit with some key
differences. Foremost amongst these is the technique used
to separate ice crystals from supercooled droplets. In the ISI
the separation takes place in the airborne state, as opposed
to physical impaction on cool plates, thus limiting potential
artefacts, e.g. from ice crystal break-up or abrasion of the
inlet surface coating. The working principle of the droplet
evaporation unit, which is used to remove supercooled liquid
droplets sampled by the ISI, is described in detail in Sect. 2.4.
The purpose of the ISI is to extract small (5–20 µm) ice crys-
tals from mixed-phase clouds. These crystals are assumed to
Atmos. Meas. Tech., 8, 3087–3106, 2015 www.atmos-meas-tech.net/8/3087/2015/
P. Kupiszewski et al.: The Ice Selective Inlet 3089
Lower WELAS
Cyclone (D50 ≈ 20 µm)
Pumped counterflow virtual impactor (D50 ≈ 4.9 µm)
Droplet evaporation unit
Omnidirectional inlet
Heating (transfer into laboratory)
Optical detection (counting and sizing) of all hydrometeors
Optical detection (counting) of ice crystals
Small ice particles Supercooled droplets Interstitial aerosol
Small ice particles Residuals of droplets Interstitial aerosol
Detection of the scattering pattern
Small ice particles
Large ice crystals (>20μm)
Small ice particles (<20μm)
Supercooled droplets (>5μm)
Interstitial aerosol (<2 μm)
Upper WELAS
PPD-2K
Ice residuals
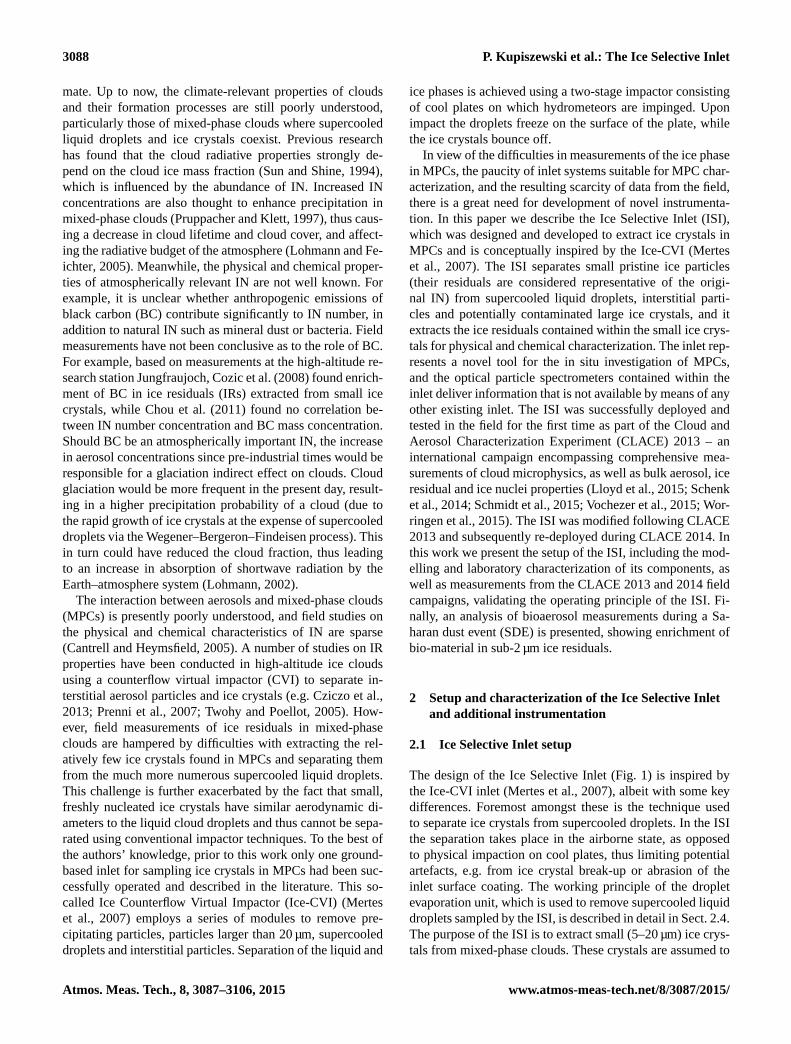
Figure 1. Sketch of the Ice Selective Inlet. The particulate matter contained within the sample flow is visualized on the left-hand side of the
figure.
have formed via heterogeneous nucleation and, subsequently,
to have grown via vapour diffusion. The ice residuals con-
tained within can thus be considered representative of the
original ice nuclei.
Sampling by the ISI can be divided into the following
steps: cloud air is aspirated through the ISI at a flow rate
of 7 Lmin−1. An omnidirectional inlet, shielded from above
and a custom-made Sharp Cut Cyclone (BGI Inc., USA),
with a D50 (i.e. the aerodynamic diameter at which 50 %
of the particles are removed from the sample flow and 50 %
are transmitted) of 20 µm ensure that precipitating particles
and ice crystals larger than 20 µm in aerodynamic diameter
are removed from the sample flow. It is important to remove
the larger ice particles because the residuals contained within
larger ice crystals may be unrepresentative of the original
ice nuclei. The larger ice crystals have not necessarily grown
by water vapour diffusion, as is assumed for small ice crys-
tals; instead they may have grown by riming (i.e. capture and
freezing of supercooled liquid droplets on falling ice crys-
tals; Mosimann et al., 1994), and thus they could also con-
tain CCN from the captured droplets. Furthermore, uptake of
gases on ice crystals may take place (e.g. Kärcher and Basko,
2004; Marécal et al., 2010), thus contaminating the ice resid-
uals. Larger, more-aged ice particles would be more suscep-
tible to contamination via this pathway than small, fresh ice
crystals. The performance characteristics of the omnidirec-
tional inlet and cyclone are presented in Sect. 2.3.
Hydrometeor number size distributions are measured up-
stream and downstream of the droplet evaporation unit us-
ing two WELAS 2500 aerosol sensor systems (white-light
aerosol spectrometer; Palas GmbH, Germany). Each sensor
system contains a WELAS 2500 sensor and a Promo 2000
control unit. The latter houses the white light source and
a photomultiplier tube (PMT) where the light scattered at
an angle of 78–102◦ by particles passing through the sens-
ing volume is measured. Optical fibres are used to transmit
light between the Promo 2000 and the WELAS 2500. The
use of white light is important in helping to circumvent diffi-
culties in unambiguous particle sizing which arise when us-
ing a laser spectrometer due to the strongly non-monotonic
relationship between the intensity of scattered light and parti-
cle diameter (Heim et al., 2008). Furthermore, decoupling of
the light source and scattered light detector from the measur-
ing volume using optical fibres is an important feature which
prevents heat transfer to the ISI system. For an in-depth and
extensive description of the measurement principle of WE-
LAS sensors the reader is referred to Heim et al. (2008) and
Rosati et al. (2015).
Downstream of the WELAS sensors the PPD-2K, a modi-
fied version of the Particle Phase Discriminator (Kaye et al.,
2008), custom-built and adapted for use within the ISI inlet,
is mounted. The modifications of the PPD-2K compared to
the instrument described in Kaye et al. (2008) are the replace-
ment of the in-board PC by an external laptop and the use of
www.atmos-meas-tech.net/8/3087/2015/ Atmos. Meas. Tech., 8, 3087–3106, 2015

3090 P. Kupiszewski et al.: The Ice Selective Inlet
polyether ether ketone (PEEK) encapsulations for the inlet
and outlet nozzle of the instrument. With these modifications
the heat transfer to the sample flow is minimized and the op-
eration of a computer under harsh conditions is avoided. The
PPD-2K acquires high-resolution scattering patterns of indi-
vidual cloud particles. In order to calibrate the sizing of the
instrument, scattering patterns of droplets are selected and
exact Mie solutions are fitted to these patterns. Thus, the
PPD-2K provides an optical diameter for all sampled par-
ticles, which is equivalent to the scattering of a droplet in
5–26◦ forward direction. The scattering patterns contain in-
formation about microphysical properties of individual cloud
particles such as particle size, shape and surface roughness.
Thus, the analysis of the PPD-2K scattering patterns en-
ables a highly sensitive distinction between water droplets
and ice particles and provides an invaluable check of the
droplet evaporation unit operation. The scattering patterns
are recorded starting from the detection limit of around 5 µm.
The analysis procedure as well as a detailed characteriza-
tion of the instrument is the subject of a separate publica-
tion (Vochezer et al., 2015). In addition to the scattering pat-
terns, the PPD-2K generates a particle number size distribu-
tion based on the forward scattering signal.
Downstream of the PPD-2K, interstitial particles and
residual particles released from the droplets in the droplet
evaporation unit are removed from the sample flow with
the use of the commercially available pumped counterflow
virtual impactor (PCVI, model 8100, Brechtel Manufactur-
ing Inc. (BMI), USA; Boulter et al., 2006; Kulkarni et al.,
2011) which separates particles based on their inertia. Parti-
cles with insufficient inertia to overcome a counterflow are
removed, while particles above a certain aerodynamic cut
size are transmitted. Further details on characterization of the
PCVI transmission efficiency can be found in Sect. 2.6. The
ice crystals extracted with the PCVI are subsequently evap-
orated and the physical and chemical properties of the ice
residuals can be probed using on- and offline aerosol instru-
mentation.
2.2 Additional instrumentation
2.2.1 Small Ice Detector (SID-3)
The Small Ice Detector (SID-3; Kaye et al., 2008; Ulanowski
et al., 2014) which is the aircraft version of the PPD-2K,
equivalent in measurement principle and output, was used to
measure ice crystal properties during the CLACE 2013 and
2014 campaigns. The SID-3 was mounted on a platform that
adjusted itself to the wind direction. An aspiration unit en-
sured a constant, near isokinietic particle flow through the
instrument. The SID-3 directly sampled the unaltered cloud
and could thus be used in conjunction with the PPD-2K to
assess the impact of the ISI on the ice crystals. The in situ
characterization of mixed-phase clouds using the SID-3 is
the subject of a publication by Vochezer et al. (2015).
2.2.2 Ultra-High Sensitivity Aerosol Spectrometer
(UHSAS)
An Ultra-High Sensitivity Aerosol Spectrometer (UHSAS,
Droplet Measurement Technologies, Boulder, CO, USA) was
deployed during the CLACE 2014 campaign, alternating be-
tween sampling downstream of the ISI and downstream of
the total inlet. The UHSAS is an optical particle size spec-
trometer which employs a laser operated at 1054 nm as the
light source. The light scattered by particles is collected over
an angle of 22–158◦ in the forward direction with the use
of two pairs of Mangin mirrors (see Cai et al. (2008) for
further details). The UHSAS measures particles in the 60–
1000 nm polystyrene latex (PSL)-equivalent optical diameter
size range.
2.2.3 Wideband Integrated Bioaerosol Sensor (WIBS)
A Wideband Integrated Bioaerosol Sensor (WIBS, Droplet
Measurement Technologies, Boulder, CO, USA) was a fur-
ther instrument measuring aerosol properties downstream
of the ISI and the total inlet. The WIBS instrument em-
ploys the UV-LIF method, whereby ultraviolet (UV) light
is used to excite the amino-acid tryptophan and nicoti-
namide adenine dinucleotide (NADH, a molecule involved
in cell metabolism), and thus induce fluorescence (Toprak
and Schnaiter, 2013). The fluorescence is measured in three
channels (fluorescence resulting from excitation by a 280 nm
UV pulse is measured in the 310–400 and 420–650 nm wave-
bands and fluorescence from excitation by a 370 nm UV
pulse in the 420–650 nm waveband) and allows for detec-
tion of biological material. A comparison of the fluorescence
properties of ISI ice residuals relative to the total aerosol
therefore provides information on the content of bio-material
in the ice residuals compared to the bulk aerosol and on its
role in initiation of ice formation in the atmosphere.
It should be noted that non-biological fluorescent particles
can cause interferences to detection of biological particles.
In fact, some types of mineral dust are known to fluoresce.
Laboratory studies with different mineral dust types have re-
cently been conducted to assess the cross-sensitivity of bio-
particle detection to interferences from mineral dust fluores-
cence (Toprak and Schnaiter, 2015). Importantly, the signals
can be distinguished to a large extent based on the ratios of
fluorescence in the three channels, with different signatures
obtained from biological material and mineral dust.
2.3 Omnidirectional inlet and cyclone performance
In order to establish the performance characteristics of the
omnidirectional inlets and the cyclone used during CLACE
2013 and 2014, we have calculated the aspiration efficiency
for the conical inlet deployed during CLACE 2013, the trans-
mission efficiency of the modified omnidirectional inlet de-
Atmos. Meas. Tech., 8, 3087–3106, 2015 www.atmos-meas-tech.net/8/3087/2015/
P. Kupiszewski et al.: The Ice Selective Inlet 3091
b) a)
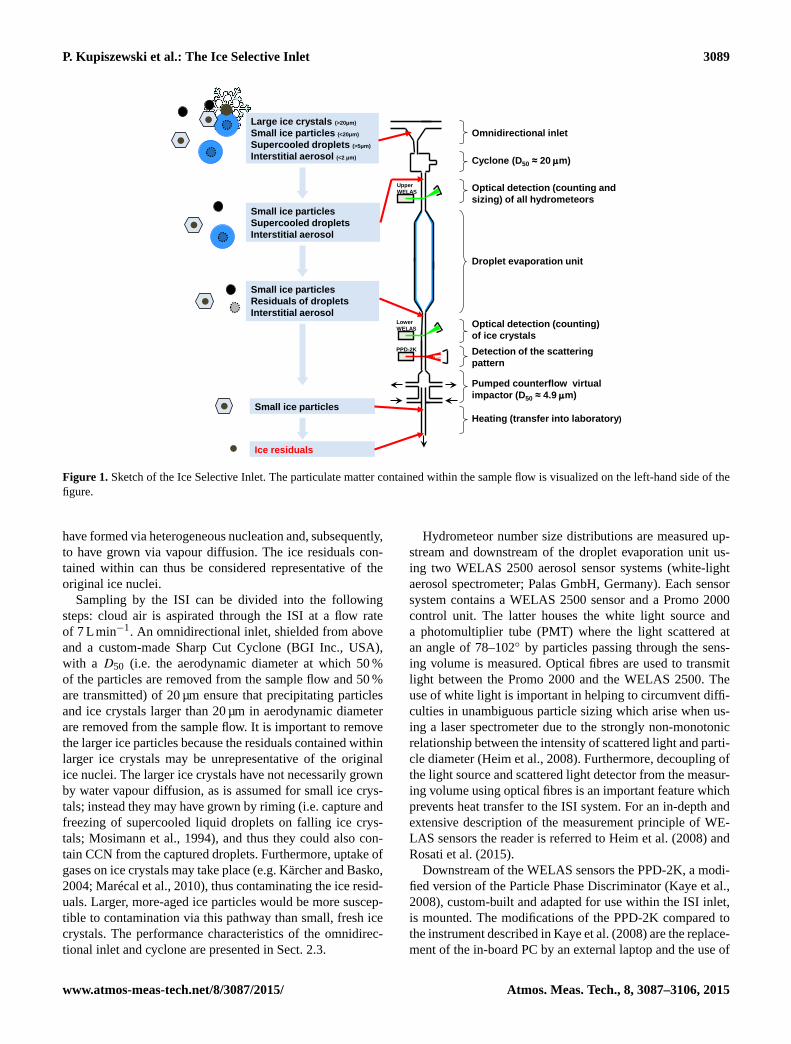
Figure 2. CLACE 2013 omnidirectional inlet (used during CLACE 2013) aspiration efficiency for 90◦ sampling (a), CLACE 2014 omnidi-
rectional inlet transmission efficiency (blue curve in panel b) and cyclone (orange curve in panel b) transmission efficiency as a function of
aerodynamic diameter Daero for standard temperature and pressure.
ployed during CLACE 2014, and the transmission efficiency
of the BGI cyclone.
The CLACE 2013 omnidirectional inlet aspiration effi-
ciency for 90◦ sampling, AE90◦ , shown as a function of
particle aerodynamic diameter for different wind speeds in
Fig. 2a, was calculated based on Eq. (1) following e.g. Mertes
et al. (2007), Noone et al. (1992) and Vincent (2007):
AE90◦ =1
1+ 4GStR0.5, (1)
where G is a coefficient set to 2.1, St is the Stokes number
and R is the ratio of the wind velocity to the inlet veloc-
ity. As in Mertes et al. (2007), the maximum inlet diameter
(0.08 m) was used to calculate St , while the minimum diam-
eter (0.009 m) is used to calculate the inlet velocity, giving
1.83 m s−1 for the sampling flow rate of 7 Lmin−1.
During the course of the CLACE 2013 campaign the
omnidirectional inlet was found to be prone to clogging
by wind-blown snow, and the design of the inlet was sub-
sequently modified prior to the CLACE 2014 campaign.
The re-designed inlet, deployed during CLACE 2014, was
rainbow-shaped, thus sampling upwards at the open end. Fur-
thermore, a wind shield was added so that aspiration would
take place from relatively still air. The transmission effi-
ciency of the CLACE 2014 omnidirectional inlet, assuming
sampling from still air, was calculated using the Particle Loss
Calculator (von der Weiden et al., 2009) and is shown in
Fig. 2b. The transmission efficiency is over 80 % for particles
smaller than 20 µm, and it decreases with increasing particle
size to a few percent for particles of 50 µm aerodynamic di-
ameter.
The transmission efficiency of the cyclone, shown in
Fig. 2b, has been calculated as follows: firstly, the D50 was
calculated using Eq. (2), a model fit shown by Kenny and
Gussman (1997) to describe theD50 for a given cyclone fam-
ily as a function of the flow rate Q and the cyclone body
diameter Dc:
ln(D50)= a+ b ln(Dc)− (b− 1) ln(Q), (2)
where a and b are empirically derived parameters which de-
pend on the cyclone family and are set here to the values
given for the Sharp Cut Cyclone family by Kenny and Guss-
man (2000). Subsequently, the transmission efficiency is cal-
culated for particle diameters between 0 and 50 µm based on
the assumption that the collection efficiency can be fitted to
a cumulative lognormal distribution function (Wang, 2004).
The fraction of particles penetrating the cyclone as a function
of particle diameter P(D) is thus calculated as
P(D)= 1− 0.5erf
(ln(D)− lnD50√
2ln(σg)
), (3)
where erf is the error function, D is the particle diameter,
D50 is the particle diameter for which 50 % of particles are
transmitted and 50 % are collected, and σg is the geometric
standard deviation of the associated lognormal distribution.
σg is equal to the sharpness of the transmission curve, defined
as (D16/D84)0.5 (Kenny and Gussman, 2000), and is given
by the manufacturer as 1.616.
The cyclone transmission efficiency is thus 90 % for parti-
cles withDaero = 10 µm, 50 % for particles just under 20 µm,
20 % for particles withDaero = 30 µm and down to just a few
percent for particles with Daero = 50 µm.
www.atmos-meas-tech.net/8/3087/2015/ Atmos. Meas. Tech., 8, 3087–3106, 2015

3092 P. Kupiszewski et al.: The Ice Selective Inlet
Temperature T [°C]-40 -35 -30 -25 -20 -15 -10 -5 0
Satu
ration v
apour
pre
ssure
ps , 1
0 ×
∆ p
s [m
bar]
-2
-1
0
1
2
3
4
5
6
7
ps(water)
ps(ice)
10*(ps(water)-p
s(ice))
10*(ps(water)-p
s(ice)); T
ice=T
water+0.25°C
10*(ps(water)-p
s(ice)); T
ice=T
water-0.25°C
Figure 3. Saturation vapour pressures over bulk liquid water (blue curve) and ice (green curve) surfaces as a function of temperature (the
parametrizations used for the saturation vapour pressures over water and ice are based on Lowe and Ficke, 1974). The difference (multiplied
by a factor of 10) in the saturation vapour pressures of water and ice is given by the red curve. The difference (multiplied by a factor of 10)
in the saturation vapour pressures of water and ice when the ice temperature (Tice) is 0.25◦C higher and lower than the water temperature
(Twater) is given by the dashed and dotted red lines respectively.
2.4 Working principle of the droplet evaporation unit
The phase separation in the ISI is accomplished with the use
of a droplet evaporation unit. The unit used during CLACE
2013 is an anodized aluminium chamber with sandblasted in-
ner walls, a length of 1.5 m and a volume of 29 L split in 12
axially symmetrical parts. During operation, the inner walls
of the chamber are coated with ice (it should be noted that
the temperature of the droplet evaporation unit is not actively
controlled; i.e. it follows the ambient air temperature). As
a result the air within the chamber is saturated with respect
to a flat ice surface, resulting in evaporation of droplets us-
ing the Wegener–Bergeron–Findeisen process. This process
takes place due to the different saturation vapour pressures
over liquid water and ice (Fig. 3; the parametrizations used
for the saturation vapour pressures over water and ice are
based on Lowe and Ficke, 1974). Consequently, at a given
temperature, in an environment saturated with respect to ice
(green curve in Fig. 3), there is sub-saturation with respect
to water; i.e. the ambient water vapour pressure is below the
saturation vapour pressure with respect to water (blue curve
in Fig. 3). This difference in saturation vapour pressures over
water and ice (red curve in Fig. 3) induces evaporation of
the supercooled droplets, while ice crystals are affected to
a much lesser degree.
As the temperature of the droplet evaporation unit is not
actively controlled, it is possible that there is a slight lag
in temperature equilibration of the chamber walls relative to
the ambient temperature. In order to monitor whether such
a lag takes place, the air temperature inside the evaporation
unit and the wall temperature of the chamber were moni-
tored using PT100 (platinum temperature resistance detec-
tor) probes. Absolute differences in temperature were on av-
erage approximately 0.25 ◦C. The difference in saturation
vapour pressures between water and ice is the driving force
for the Wegener–Bergeron–Findeisen process. Therefore, in
order to show the influence of the aforementioned tempera-
ture lag on this driving force, we show the difference in satu-
ration vapour pressures over water and ice when the ice tem-
perature is 0.25 ◦C higher and lower (dashed and dotted red
lines respectively in Fig. 3) than the droplet temperature (the
droplet temperature is assumed to be equal to the ambient air
temperature).
The design of the droplet evaporation unit is based on
model calculations solving mass transfer equations and Köh-
ler theory, ensuring sufficient residence time for evaporation
of the droplets. The mass transfer equation used follows Se-
infeld and Pandis (2006) and gives the growth/evaporation
rate of a solution droplet as follows:
DpdDp
dt=
Sv,∞− Seq
ρwRT∞4ps(T∞)D′vMw
+1Hvρw
4k′aT∞
(1HvMw
T∞R− 1
) , (4)
where Dp is the droplet diameter, Sv,∞ the ambient water
vapour saturation ratio, Seq the equilibrium water vapour sat-
uration ratio of the droplet, ρw the density of water, R the
Atmos. Meas. Tech., 8, 3087–3106, 2015 www.atmos-meas-tech.net/8/3087/2015/

P. Kupiszewski et al.: The Ice Selective Inlet 3093
−30 −25 −20 −15 −10 −5 0
10
100
1000
Tim
e [
s]
Temperature [°C]
Residence time at VolFlow = 7 L/min, D
init = 20 µm
50 µm −−> 3 µm; AccCoeff = 1
20 µm −−> 3 µm; AccCoeff = 0.01
20 µm −−> 3 µm; AccCoeff = 0.1
20 µm −−> 3 µm; AccCoeff = 1
10 µm −−> 3 µm; AccCoeff = 1
Figure 4. Evaporation times of cloud droplets for different droplet start and end diameters, and different mass accommodation coefficients,
as a function of temperature at a pressure of p = 658.61hPa. The average residence time in the CLACE 2013 droplet evaporation unit as
a function of temperature based on the dimensions of the droplet evaporation unit and a sample flow of 7 Lmin−1 is shown by the dashed
black line.
ideal gas constant, T∞ the ambient temperature, ps the satu-
ration vapour pressure of water, D′v the water vapour diffu-
sivity corrected for non-continuum effects,Mw the molecular
weight of water, k′a the thermal conductivity of air accounting
for non-continuum effects and 1Hv the latent heat of water
evaporation.
Rearrangement and integration of Eq. (4) gives
D1∫D0
1
Sv,∞−Seq
ρwRT∞4ps(T∞)D
′vMw+1Hvρw4k′aT∞
(1HvMwT∞R
−1)DpdDp =
t1∫t0
dt. (5)
Using the MATLAB R2014a (The Mathworks Inc., USA)
software package, Eq. (5) was solved by numeric integra-
tion to give the time needed to evaporate a droplet from
a set start to a set end diameter, as a function of tempera-
ture (Fig. 4). The ambient water vapour saturation ratio was
assumed to be at 100 % saturation with respect to a flat ice
surface (RHice = 100%), the ambient pressure p was set to
658.61 hPa (in order to simulate the ambient conditions at
the Jungfraujoch), the equilibrium water vapour saturation
ratio of the droplet Seq was assumed to be 1 (i.e. the Kelvin
and Raoult effect are negligible for supermicron-sized cloud
droplets) and the mass accommodation coefficient (a compo-
nent of theD′v term) was set to 1. A sensitivity analysis of the
importance of the mass accommodation coefficient was addi-
tionally performed by setting it to 0.1 and 0.01 for the evap-
oration time calculations of droplets with a set start diameter
of 20 µm. In order to check whether droplet residence times
would be sufficient to allow droplet evaporation in the unit,
the average residence time as a function of temperature for
a 20 µm droplet was calculated based on the dimensions of
the droplet evaporation unit and a sample flow of 7 Lmin−1.
The dashed black line in Fig. 4 shows the average residence
time in the evaporation unit.
The calculations of droplet evaporation times based on the
aforementioned parameters show that droplets with diame-
ters of 10 µm take a few seconds to evaporate to a diameter
of 3 µm, a size well below the cut-off of the PCVI, while
20 µm droplets need approximately 10 to 20 s and 50 µm
droplets need of the order of 100 s (Fig. 4). As seen in Fig. 4,
there are significant differences in the evaporation rate as a
function of temperature. Droplet evaporation takes longest
at near-zero temperatures, as well as towards the lower limit
of the modelled temperature range, with evaporation times
increasing as temperature drops below −14 ◦C. The fastest
evaporation rates are at a temperature of approximately −12
to −14 ◦C. These dependencies can be explained by the dif-
ference in saturation vapour pressures over water and ice as
a function of temperature (red curve in Fig. 3): the differ-
ence is lowest at near-zero and at very low temperatures,
and highest between −15 and −10 ◦C. Consequently, where
the difference and, therefore, driving force for the Wegener–
Bergeron–Findeisen process is highest, evaporation rate is at
its fastest, and vice-versa.
www.atmos-meas-tech.net/8/3087/2015/ Atmos. Meas. Tech., 8, 3087–3106, 2015

3094 P. Kupiszewski et al.: The Ice Selective Inlet
Figure 5. The internal structure of the CLACE 2013 droplet evapo-
ration unit as seen from above.
A potentially important uncertainty in the modelled evap-
oration times arises due to the uncertainties associated with
the assumed mass accommodation coefficient value. Many
conflicting studies exist on the value of the mass accom-
modation coefficient, also called the condensation or evap-
oration coefficient. Moreover, while some studies assume
the condensation and evaporation coefficient to be synony-
mous (e.g. Fukuta and Walter, 1970; Shaw and Lamb, 1999),
other studies highlight that the two coefficients are distinct
and can have different values (Eames et al., 1997; Marek
and Straub, 2001; Pound, 1972). A review of experimental
studies investigating evaporation coefficients conducted by
Eames et al. (1997) demonstrates the lack of agreement with
wide-ranging values between 0.01 and 1 found in different
studies. More recent studies slightly narrow this range to 0.04
and 1 (Laaksonen et al., 2005) (with no differentiation how-
ever between the condensation and evaporation coefficients),
while aerosol/cloud models have employed values between
0.042 and 1 for the condensation coefficient when modelling
droplet growth (Kreidenweis et al., 2003).
While it is outside the scope of this paper to investigate
the mass accommodation coefficient of water, we incorpo-
rate a simple sensitivity analysis of the mass accommodation
coefficient into the modelling study of droplet evaporation
rates in order to establish its potential impact on the evapora-
tion rates. The sensitivity analysis is carried out for evapora-
tion of droplets with a set start diameter of 20 µm and shows
that a decrease in the mass accommodation coefficient by one
order of magnitude would result in an increase in the evapo-
ration time of a 20 µm droplet by 17–26 %. A decrease in the
mass accommodation coefficient by two orders of magnitude
would result in the droplet evaporation time increasing by
183–288 %, depending on the temperature. Meanwhile the
residence time of a 20 µm droplet in the evaporation unit was
calculated to be over 200 s for temperatures between −2 and
−30 ◦C. This means that residence time in the droplet evap-
oration unit should be more than sufficient to ensure evap-
oration of 20 µm droplets. It is important to note that the
modelled conditions of 20 µm droplet diameter are a worst-
case scenario, as droplet sizes are usually significantly below
20 µm diameter (e.g. Choularton et al., 2008) and, further-
more, hydrometeors larger than this should be removed by
the cyclone.
As regards the geometry of the droplet evaporation unit,
an internal structure was designed, as shown in Fig. 5. The
internal structure provides a greater inner ice-covered sur-
face, as well as homogenizing the velocity of the sampled
air through the droplet evaporation unit (thus slowing down
droplet transport and allowing more time for droplet evapora-
tion). Due to the radial construction of the structure, the flow
velocity is decreased in the centre of the droplet evaporation
unit; the distances between wall surfaces here are smallest re-
sulting in friction between the sample air and chamber walls
impacting the air flow velocity to a greater extent than further
from the centre of the chamber. As the cone at the centre of
the structure forms a surface for potential impaction of hy-
drometeors, the geometry of the unit was modelled and com-
putational fluid dynamics (CFD) simulations were conducted
using the Comsol Multiphysics 4.2a software (Comsol Inc.,
USA). It should be noted that the geometry used for the CFD
modelling is simplified and does not incorporate the internal
radial structure, but only the centre cone itself. A visualiza-
tion of the CFD simulation results, namely a 2-D cross sec-
tion of the droplet evaporation unit showing the air stream-
lines and velocity field, is presented in Fig. 6. The Comsol
particle tracing module was used in order to model particle
transport through the chamber and to establish whether par-
ticle losses could be of concern. The simulation was initiated
by injecting spherical particles with an aerodynamic diame-
ter of 20 µm into the chamber. As in the case of the calculated
droplet residence time in the evaporation unit, the simulation
was conducted based on the worst-case scenario, with injec-
tion of 20 µm particles which have a higher stopping distance
than smaller particles and are thus more likely to impact on
the internal structure, as opposed to following the gas stream-
lines. The CFD simulations (not shown) of particle trajecto-
ries through the droplet evaporation unit showed impaction
of large particles to be of minimal importance. Furthermore,
the gas flow streamlines simulated show a smooth flow of
air through the unit, with only minor eddy formation (which
could lead to particle losses if significant) in the upper cone
due to an increase in diameter of the sample flow conduit
as the flow enters the evaporation tube and is transported
through its upper section (Fig. 6).
Atmos. Meas. Tech., 8, 3087–3106, 2015 www.atmos-meas-tech.net/8/3087/2015/

P. Kupiszewski et al.: The Ice Selective Inlet 3095
Figure 6. A 2-D cross section of the CLACE 2013 droplet evapo-
ration unit showing the air streamlines and velocity field, calculated
using Comsol 4.2a. An enlargement (not to scale) of the upper cone
section of the evaporation unit is shown in the inset.
2.5 WELAS sensor characterization
The raw signal measured by the WELAS sensors and subse-
quently converted to a particle number size distribution is a
distribution of voltage values representing the scattered light
intensities. An empirical factory calibration is used to relate
the measured voltage to particle size. The empirical calibra-
tion combined with Mie theory provides a relationship in turn
between voltage and particle scattering cross section (the lat-
ter is directly proportional to the voltage). In order to cor-
rect for any drift in instrument sensitivity due to e.g. degra-
dation in the light source or optical fibres, contamination of
the optical windows or changes in performance of the photo-
multiplier, a user calibration is conducted. Hereby particles
with a known scattering cross section are aspirated through
the measuring volume of the WELAS, with a flow rate of
7 Lmin−1, and the calibration factor is empirically estab-
lished. CalDust 1100 (provided by the manufacturer), a cali-
bration dust with a refractive index (RI) of 1.43 and a diam-
eter of 1.1 µm, is used for this purpose. The WELAS sensors
are calibrated assuming an RI of 1.59; therefore the calibra-
tion factor is adjusted so that the measured size of the mono-
disperse CalDust is 0.85 µm (i.e. the optical diameter of the
CalDust particles when assuming they have an RI of 1.59).
As the RI of liquid water is 1.33, Mie theory (e.g. Bohren and
Huffman, 1998) is subsequently used to correct the measured
size distributions for the RI of liquid water. The calculations
are conducted with the assumption that the measured parti-
cles are spherical. It is important to note that as a result of
a single RI being used for the size distribution correction the
diameters calculated are incorrect for particles with a differ-
ent RI, i.e. non-activated aerosol particles and ice crystals.
Nonetheless, hydrometeor measurements are the focus of the
study, and droplets make up the vast bulk of the hydromete-
ors measured upstream of the droplet evaporation unit; there-
fore this approach is deemed satisfactory. A further point to
make is that, as ice crystals are highly aspherical, they can
only be counted, and not accurately sized, by the WELAS
sensors; the shape and orientation of ice crystals in the mea-
suring volume of the WELAS sensor are unknown, and both
affect the intensity of scattered light.
The two WELAS 2500 sensors used within the ISI and
the respective Promo 2000 control units are, in theory, iden-
tical models. Nonetheless, as with all scientific instruments,
due to possible slight differences in the machining, assembly
and calibration of any two such devices, differences in in-
strument performance are commonplace. Consequently, we
have performed a laboratory characterization of the two WE-
LAS sensors in order to establish the potential error in sub-
sequent comparisons of ambient measurements. The exper-
iment was conducted as follows: the instruments were set
up side by side and sampled simultaneously via a common
inlet followed by a Y-splitter. A3 medium-grade Arizona
Test Dust (ISO 12103-1; Powder Technology Inc, USA) was
used as the test aerosol. The aerosol was dispersed using
a vial shaker (Edmund Bühler GmbH, Germany). The WE-
LAS sensors measured the number size distribution of the
sampled aerosol in the PSL-equivalent size range of approx-
imately 0.6–40 µm. Using Mie theory, the measured size dis-
tribution was corrected for particles with the refractive index
of Arizona Test Dust (the RI across the WELAS effective
light spectrum is assumed to have real and imaginary parts
of n= 1.51 and k = 0.0012 respectively, as given by Glen
and Brooks, 2013).
The size distributions measured during the instrument
characterization are presented in Fig. 7, together with the ra-
tio of the total number of counts per size bin measured by the
two sensors (red line in Fig. 7). The ratio shows that there
are considerable differences in the relative counting efficien-
cies of the two sensors at the smallest sizes, with the ratio
of WELAS 2 to WELAS 1 counts steadily increasing from
20 % to just under 100 % for 0.5 to 1 µm particles. The rela-
tive counting efficiency is in fairly good agreement for parti-
cles between 0.8 and 11 µm, albeit with WELAS 2 predom-
inantly under-counting by 10–20 % as compared to WELAS
1. Above 11 µm the ratio of counts increases considerably in
the experiment shown.
The S shape of the ratio of WELAS 2 to WELAS 1 counts
could be explained by a difference or an inherent uncer-
tainty in the CalDust user calibration. An over-amplification
of the signal for WELAS 2 (or an under-amplification for
WELAS 1) would result in a relative shift in the measured
size distribution of WELAS 2 towards larger sizes, thus re-
www.atmos-meas-tech.net/8/3087/2015/ Atmos. Meas. Tech., 8, 3087–3106, 2015

3096 P. Kupiszewski et al.: The Ice Selective Inlet
Optical diameter Dopt
[µm]10
010
1
dN
/dlo
gD
op
t [a
rb.
un
it]
102
103
104
105
106
Welas 1
Welas 2
Wela
s 2
/ W
ela
s 1
[%
]
0
20
40
60
80
100
120
140
160
180
200
Welas 2 / Welas 1
Left y-axis
Right y-axis
Figure 7. Intercomparison of the ISI WELAS optical particle size
spectrometers.
sulting in under-counting of WELAS 2 with respect to WE-
LAS 1 where the gradient of the size distribution is posi-
tive and over-counting where the gradient is negative (as ob-
served during the experiment). Additionally, the larger dif-
ferences in counting efficiencies measured at smaller sizes
can be explained by the fact that at these sizes there is rela-
tively little scattered light reaching the WELAS detector. As
a result, any differences in construction or calibration of the
sensors will have an increasingly strong influence on parti-
cles as their size decreases towards the lower detection limit
of the WELAS sensors. This could be considered an issue
for some measurement purposes; however, as we are inter-
ested in supermicron-sized hydrometeors, it does not pose
a major problem for measurements of droplets and ice crys-
tals in the ISI. Nonetheless the inter-comparison shows that
a systematic error of up to approximately 20 % should be
recognized when discussing further results of the WELAS
measurements.
2.6 PCVI characterization
A defining characteristic of an impactor device is its size-
dependent transmission efficiency (TE), particularly theD50.
Characterization of the PCVI transmission efficiency has
been performed in several previous studies (Boulter et al.,
2006; Kulkarni et al., 2011). As a result, we have focused
solely on validating the characterization for those flow set-
tings that were deemed relevant to our inlet setup.
The characterization performed within the scope of this
study was carried out via dispersion of ATD as the test
aerosol, as opposed to the nebulization of salt solutions used
in previous studies. In order to establish the size-dependent
TE, the following laboratory experiment was conducted (see
Fig. 8 for a schematic of the laboratory setup): Arizona Test
Dust was dispersed with the use of the Topas Solid Aerosol
Generator (SAG 410; Topas GmbH, Germany). In order to
smooth concentration fluctuations due to changes in the out-
Figure 8. Schematic of the laboratory setup for the pumped coun-
terflow virtual impactor (PCVI) transmission efficiency tests.
put rate of the SAG, the flow was passed through a mix-
ing chamber before being sent either through the PCVI or
through a bypass. A three-way valve was used to switch be-
tween PCVI and bypass in alternating cycles of 30 s duration.
The PCVI flow settings used during the characterization were
identical to those used subsequently during the CLACE 2013
and CLACE 2014 field campaigns (sample flow: 7 Lmin−1
; pump flow: 8.3 Lmin−1; add flow: 2.3 Lmin−1; and outlet
flow: 1 Lmin−1). Number size distributions were measured
downstream of the PCVI and downstream of the bypass by
the TSI Aerodynamic Particle Sizer (APS) model 3321 in the
size range of 0.5–20 µm aerodynamic diameter. The number
size distribution measured downstream of the PCVI was cor-
rected for enrichment in the PCVI, which is approximately
equal to the ratio of the inlet and outlet flow (Boulter et al.,
2006). The transmission efficiency of the PCVI was subse-
quently obtained by taking the ratio of the corrected number
size distribution downstream of the PCVI to that measured
downstream of the bypass.
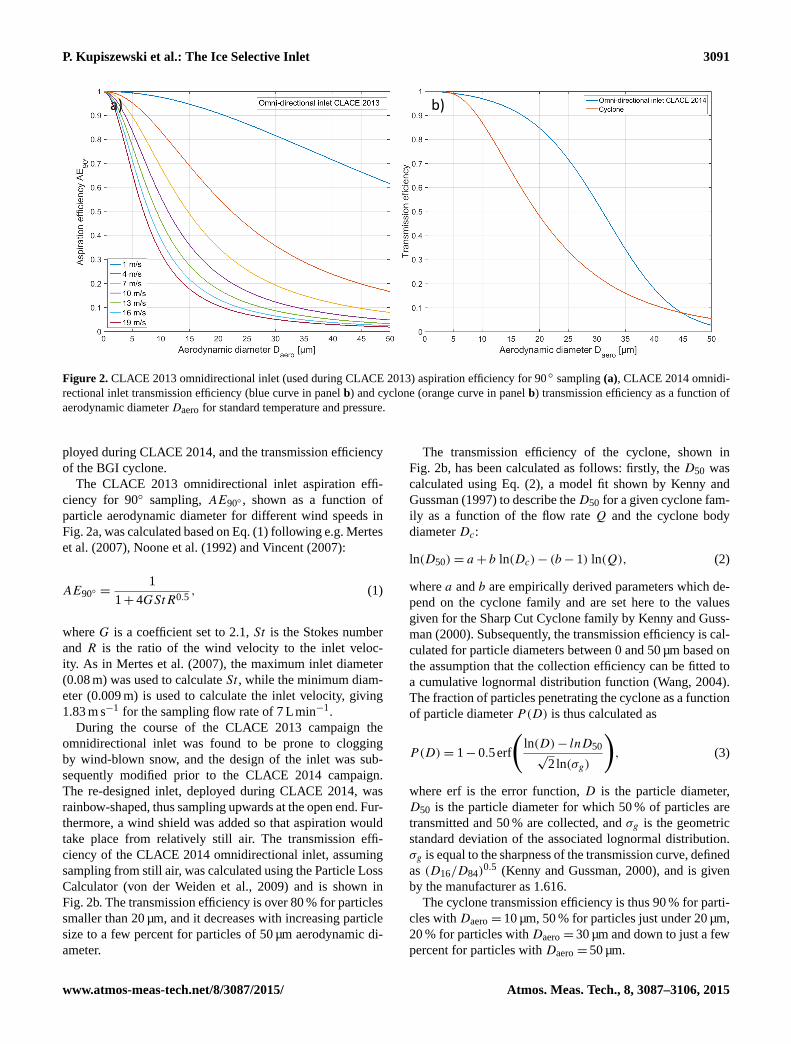
The result of one such experiment is presented in Fig. 9.
As is immediately clear, there is very little transmission of
particles in the size range of 0.5–2 µm through the PCVI
(< 0.05 %). As noted above, the lower detection limit of the
APS is 0.5 µm; therefore no measurements are available for
particles < 0.5 µm. However, as smaller particles have in-
creasingly lower inertia, it can safely be assumed that the
sub-0.5 µm transmission is similar to or lower than that of the
smallest particles measured by the APS. Transmission effi-
ciency increases sharply for particles above 3.5 µm in aerody-
Atmos. Meas. Tech., 8, 3087–3106, 2015 www.atmos-meas-tech.net/8/3087/2015/
P. Kupiszewski et al.: The Ice Selective Inlet 3097
Figure 9. Transmission efficiency of the BMI PCVI, with flows
of 7 Lmin−1 (sample flow), 8.3 Lmin−1 (pump flow), 2.3 Lmin−1
(add flow) and 1 Lmin−1 (outlet flow), as measured by a TSI model
3321 Aerodynamic Particle Sizer.
namic diameter, with a D50 of 4.9 µm, and the plateau value
with a maximum TE of about 80 % is reached for particles
larger than approximately 6 µm. The few smaller particles
transmitted likely originate from one of the potential mea-
surement artefacts described by Pekour and Cziczo (2011),
i.e. capture in the wake of larger particles, collision and co-
alescence with larger particles, and subsequent detrainment
in the output flow, or collision with larger particles imparting
sufficient kinetic energy to the smaller particle for it to cross
the stagnation planes. Furthermore, it should be noted that
due to these artefacts the transmission of particles smaller
than the PCVI cut size is dependent on the number concen-
trations of both small and large particles and thus changes to
some extent from case to case.
The measured transmission pattern is in line with the ide-
alized TE curves derived from CFD simulations in Kulkarni
et al. (2011), to which the reader is referred for an in-depth
discussion of the curve morphology. The maximum TE ob-
served is also similar to that reported by both Boulter et al.
(2006) and Kulkarni et al. (2011), with an imperfect TE be-
ing attributed to losses on the internal fittings of the PCVI.
However, theD50 measured was consistently higher than that
measured for very similar flow settings by Kulkarni et al.
(2011) (case number 5), with a D50 of 4.9 µm in our charac-
terization, as compared to 3.21 µm in Kulkarni et al. (2011).
As it is of the utmost importance to remove all interstitial
particles from the sample flow, the higher cut-off size is not
detrimental for our purposes, and based on our laboratory
characterization the performance of the PCVI was deemed
adequate.
The experiments described above were conducted at an
ambient pressure of 960 mbar. Meanwhile, ambient pressure
at the Jungfraujoch is 650 mbar. This raises the question of
whether the transmission efficiency of the PCVI is pressure
dependent. A comparison of the transmission efficiency of
the PCVI at ambient pressures of 1000 and 600 mbar has
been conducted by L. Schenk (Leibniz Institute for Tropo-
spheric Research, Leipzig, Germany, personal communica-
tions) using a pressure-controlled vessel as the sample vol-
ume and a PCVI model identical to the one used in this
study (BMI, model 8100). Good agreement of the trans-
mission efficiency for set sample volume pressures of 600
and 1000 mbar was found, with the transmission efficiency
curves similar in shape, albeit with a small shift of the D50
aerodynamic diameter by 0.5 from 4.6 µm at an ambient
pressure of 1000 mbar to 5.1 µm at an ambient pressure of
600 mbar. Consequently, it is concluded that the transmission
efficiency of the PCVI is not strongly affected by the lower
ambient pressure at the Jungfraujoch.
3 ISI field measurements: deployment at the
Jungfraujoch
First deployment of the ISI in the field was carried out as
part of an international field campaign: CLACE 2013 in
January–February 2013. A second campaign, with a modi-
fied ISI setup (re-designed omnidirectional inlet and droplet
evaporation tube), was conducted in January–February 2014
(CLACE 2014). The campaigns were conducted at the high-
altitude research station Jungfraujoch (3580 ma.s.l.) in the
Swiss Alps. As part of the CLACE 2013 campaign, three
aerosol inlets were operated (total aerosol inlet (Weingart-
ner et al., 1999), Ice-CVI (Mertes et al., 2007) and ISI (this
paper)), as well as ice nuclei counters and a host of cloud mi-
crophysical probes deployed by collaborators from Germany,
the UK and Switzerland. A similar setup, albeit with reduced
instrumentation, was used during CLACE 2014. In particu-
lar, only the total aerosol inlet and the ISI were deployed dur-
ing CLACE 2014. The comprehensive set of measurements
involved physical and chemical characterization of the total
aerosol, ice residuals and ice nuclei, as well as hydrometeor
concentration and size distribution measurements and mea-
surements of ice crystal properties, such as shape, habit and
surface roughness.
In the following, a comparison of SID-3 and ISI WELAS
cloud microphysical measurements is presented (Sect. 3.1).
Subsequently, measurements of hydrometeors based on the
optical particle spectrometers within the ISI are discussed
(Sect. 3.2), with focus on validating the working principle
of the droplet evaporation unit. A comparison of average in-
cloud WELAS size distributions and PPD-2K number con-
centrations for CLACE 2013 and CLACE 2014 is presented
in Sect. 3.3, demonstrating the increase in transmission of
ice crystals following the modification of the droplet evap-
oration unit post-CLACE 2013. Selected ice residual mea-
surements conducted with an UHSAS during CLACE 2014
are presented in Sect. 3.4, demonstrating the capability of the
ISI to extract ice residuals. Finally, measurements of fluores-
cent particles during a Saharan dust event are discussed in
www.atmos-meas-tech.net/8/3087/2015/ Atmos. Meas. Tech., 8, 3087–3106, 2015

3098 P. Kupiszewski et al.: The Ice Selective Inlet
Time LT, 24-25 February 2013
10:00 12:00 14:00 16:00 18:00 20:00 22:00 00:00 02:00 04:00 06:00
Nu
mb
er
co
nce
ntr
atio
n [
cm
-3]
10-3
10-2
10-1
100
SID-3 10-20 µm ice crystals
WELASupper
> 10 µm
Figure 10. Comparison of the number concentrations of cloud par-
ticles > 10 µm optical diameter Dopt measured by the upper WE-
LAS (green line) and ice crystals with optical diameters Dopt of
10–20 µm (blue line) measured by the SID-3 on 24–25 February
2013.
Sect. 3.5, showing the first indication of enrichment of bio-
material in sub-2 µm ice residuals.
3.1 Sampling efficiency of the ISI down to the upper
WELAS
In order to verify the sampling efficiency of ice crystals by
the ISI, we compare the number concentration of particles
larger than 10 µm measured by the upper WELAS with the
number concentration of small ice particles detected by the
SID-3 probe (Fig. 10). The SID-3 instrument was the only
cloud probe operated during the CLACE 2013 and 2014 cam-
paigns able to distinguish between liquid droplets and ice
crystals in the size range probed by the ISI, i.e. 5–20 µm.
However, in order to maximize the number of ice crystal scat-
tering patterns acquired, the SID-3 camera exposure trigger
threshold during CLACE 2013 was set to a level above that of
the signal generated by liquid droplets and small (5–20 µm)
ice crystals; otherwise the camera is predominantly occupied
with acquisition of scattering patterns of the much more nu-
merous droplets, which are of limited interest. Nonetheless,
on several occasions the trigger threshold was decreased to
ensure small ice crystals were also imaged. One such occa-
sion was 24–25 February 2013, with simultaneous ISI up-
per WELAS and SID-3 measurements with a lowered trig-
ger threshold, thus providing a valuable opportunity for an
inter-comparison (shown in Fig. 10 for the period 08:45 LT
(local time) on 24 February 2013 to 08:00 LT on 25 February
2013). For the inter-comparison of number concentrations a
lower size threshold of 10 µm optical diameter is used for
cloud particles measured by the upper WELAS sensor in the
ISI, thus ensuring the particles counted are predominantly ice
crystals, while the droplets, which are smaller, are excluded.
Correspondingly, for the SID-3 we show the number concen-
tration of ice crystals measured in the 10–20 µm size range.
As seen in Fig. 10 the measured upper WELAS > 10 µm
cloud particle and SID-3 ice crystal number concentrations
are on the same order of magnitude, albeit sometimes with
several factors’ difference between the SID-3 and upper WE-
LAS concentrations. At times, partial or complete clogging
of the ISI by wind-blown snow resulted in a decrease in the
measured WELAS concentrations, as observed, for example,
at approximately 18:00 LT on 24 February. After cleaning
of the inlet, the measured concentrations increased. Further-
more, the difference in the magnitude of measured WELAS
and SID-3 concentrations might partially be due to the fact
that the sizing of particles in the two instruments is based on
the particle scattering signal recorded under different angles
and is thus not fully comparable. Most importantly, however,
the trends of the measured number concentrations are in rea-
sonably good agreement. This is strong evidence that the ISI
is successfully sampling small ice crystals from the ambient
environment.
3.2 ISI WELAS hydrometeor measurements
A comparison of size distributions measured by the two
WELAS sensors upstream and downstream of the droplet
evaporation unit during a mixed-phase cloud measurement
(19:55 LT on 12 February 2013 to 01:20 LT on 13 Febru-
ary 2013) is shown in Fig. 11, highlighting the strengths and
weaknesses of the ISI.
Air temperature during the case study period was in the
range of −20 to −22 ◦C (black curve in Fig. 11a), dropping
gradually during this period. Liquid water content (LWC),
measured by a particulate volume monitor (PVM-100, Ger-
ber Scientific Inc., USA), fluctuated between approximately
0.1 and 0.5 gm−3 (blue curve in Fig. 11a). It should be noted
that, as the PVM-100 signal responds also to ice crystals
(Verheggen et al., 2007), the LWC measurements cannot be
considered as absolute values in the presence of ice. The up-
per WELAS size distributions (see Fig. 11b and d) show high
concentrations of hydrometeors with a mode between ap-
proximately 2 and 14 µm. These are assumed to be predomi-
nantly supercooled droplets based on a comparison with the
scattering patterns recorded by the SID-3 (not shown). The
SID-3 measurements confirm also the presence of ice in the
cloud. The case study period was therefore a prolonged pe-
riod of time during which the ISI sampled in mixed-phase
cloud conditions.
Fig. 11b and c present the contour plots of the 60 s time-
resolved size distributions during the case study period as
measured by the WELAS sensors up- and downstream of the
droplet evaporation unit respectively. Figure 11d shows the
case study average concentration per size bin for each sensor,
along with a description of the processes occurring within
the ISI and their effect on the measured size distributions. It
Atmos. Meas. Tech., 8, 3087–3106, 2015 www.atmos-meas-tech.net/8/3087/2015/

P. Kupiszewski et al.: The Ice Selective Inlet 3099
PCVI cut-off
Particles removed by PCVI Ice crystals extracted by PCVI
Droplet evaporation
a)
b)
c)
d)
Interstitial particles + CCN
Droplet mode
Figure 11. Measurements of liquid water content, air temperature and particle number size distributions during the CLACE 2013 case
study period of 19:55 LT, 12 February 2013 to 01:20 LT, 13 February 2013. Panel (a) shows air temperature (black curve) and liquid
water content (blue curve); panels (b) and (c) show time resolved size distributions measured with the upper and lower ISI WELAS 2500
sensors respectively; and panel (d) shows average size distributions for the case study period from the two WELAS sensors with an overlaid
description of the processes at work in the ISI, and the resulting size distribution characteristics.
is important to note that the presented size distributions as-
sume an RI of 1.33 for all measured particles. As mentioned
in Sect. 2.5 this means that, while droplets are sized correctly,
non-activated aerosol particles, which typically have a much
higher RI, appear at much larger sizes than their true geomet-
ric diameter.
The comparison of WELAS size distributions suggests
that droplets are removed very efficiently by the evapora-
tion unit: the droplet mode clearly visible during the MPC
event in the upper WELAS size distribution is removed by
the ISI, as seen in the lower WELAS size distribution. The
removal of droplets is confirmed by the PPD-2K measure-
ments, which shows that the remaining hydrometeors are al-
most exclusively ice crystals. In the time frame selected for
the case study the PPD-2K recorded 1248 scattering patterns,
from which 10 were classified as droplets. This corresponds
to a fractional droplet interference downstream of the droplet
evaporation unit of 0.8%. The classification was based on the
variance of the azimuthal intensity of the patterns (the clas-
sification method is described in detail by Vochezer et al.,
2015) and a manual cross-check. The finding that the PPD-
2K recorded mainly ice particles was confirmed in various
cases throughout the campaign and leads to the conclusion
that the dominating hydrometeors transmitted by the ISI are
ice particles.
As seen in Fig. 11d, the transmitted fraction of larger par-
ticles above approximately 14 µm is much higher than of
particles in the sub-14 µm range, where the droplet mode is
present. Due to the rapid growth of ice crystals in the pres-
ence of supercooled liquid droplets in mixed-phase clouds,
these larger particles are expected to be predominantly ice
crystals. Although the transmitted fraction of larger particles
is much higher, there are significant losses of these particles
in the droplet evaporation unit.
A remark to be made with regards to the presented size
distributions is that ice crystals are measured even at sizes up
to 100 µm. Meanwhile, as shown in Fig. 2, both the omni-
directional inlet and the cyclone have very low transmission
efficiencies for such large particles. This feature can be ex-
plained by the fact that the scattering phase functions of ice
crystals and water droplets differ considerably. For example,
as shown in Fig. 3 of McFarlane and Marchand (2008), for an
effective radius of 25 µm, ice crystals scatter approximately
an order of magnitude more (depending on their habit) than
water droplets at an angle of 90◦. As the WELAS measure
light scattered at an angle of 90± 12◦ by particles passing
through the sensing volume, the ice crystals are greatly over-
sized by the instrument.
The PPD-2K provides important clues with regards to the
process behind the imperfect transmission of the ice crys-
tals. Figure 12b and c display the ice crystal scattering pat-
www.atmos-meas-tech.net/8/3087/2015/ Atmos. Meas. Tech., 8, 3087–3106, 2015

3100 P. Kupiszewski et al.: The Ice Selective Inlet
b) SID-3: CLACE 2013 c) PPD-2K: CLACE 2013 d) AIDA e) PPD-2K: CLACE 2014
a) AIDA (droplets)
Figure 12. Randomly selected droplet scattering patterns recorded
by the PPD-2K at the AIDA cloud chamber (RICE01 campaign,
experiment 09) (a) and randomly selected ice crystal scattering pat-
terns recorded by the SID-3 directly sampling ambient air during
CLACE 2013 between 18:20 and 18:30 LT on 12 February 2013
(b); by the PPD-2K downstream of the ISI during CLACE 2013
between 19:55 LT on 12 February 2013 and 01:20 LT on 13 Febru-
ary 2013 (c); by the PPD-2K directly connected to the AIDA cloud
chamber during the final stage of an ice cloud experiment (RICE02
campaign, experiment 18) (d); and by the PPD-2K downstream
of the ISI during CLACE 2014 between 09:20 and 11:00 LT on
14 February 2014 (e). The patterns display the distribution of scat-
tered light measured between 0 and 26◦ relative to the forward di-
rection. The black area in the centre of the SID-3 and PPD-2K scat-
tering patterns is due to the beam dump of the SID-3 and PPD-2K.
terns recorded during CLACE 2013 by the SID-3 (directly
sampling ambient air) and by the PPD-2K (downstream of
the ISI) respectively, while Fig. 12a shows droplet scattering
patterns from an experiment at the Aerosol Interactions and
Dynamics in the Atmosphere (AIDA) cloud chamber (e.g.
Möhler et al., 2005), shown for comparison purposes (see
Kaye et al. (2008) and Vochezer et al. (2015) for details on
differentiating between spherical droplets and ice crystals).
SID-3 records indicate a dominant presence of liquid droplets
during the case study period, indicating that a MPC was
present (note: only ice crystal scattering patterns are shown
in Fig. 12b). Due to the SID-3 camera trigger settings used
during the case study period, SID-3 data on small ice par-
ticles are available only 1.5 h prior to the time period of the
presented case study. The meteorological conditions however
stayed rather constant, and the SID-3 scattering patterns dis-
played in Fig. 12b are typical for the SID-3 measurements of
small ice crystals during CLACE 2013.
Comparing the general features of the scattering patterns
displayed in Fig. 12b and c, one notes that the patterns
recorded by the PPD-2K downstream of the ISI (Fig. 12c)
show a more rounded structure than those measured by the
SID-3 directly sampling the ambient air (Fig. 12b). This in-
dicates that the ice particles are altered during their passage
through the ISI evaporation unit. In order to explain this dis-
crepancy, the scattering patterns observed by the PPD-2K
during the case study period (Fig. 12c) have been compared
to those collected by the same instrument during a cloud
chamber experiment: in Fig. 12d patterns are displayed that
were recorded at the AIDA cloud chamber within an ice
cloud experiment during sublimation of ice particles. Pat-
terns in Fig. 12c and d show similar rounded features. Ap-
plying diffraction theory as a first approximation to inter-
pret the scattering patterns, we expect rounded patterns to
be correlated to rounded ice particles. Thus the patterns
displayed in panels (c) and (d) both suggest the presence
of rounded ice particles. Together with the disappearance
of particles indicated by the low transmission efficiency in
Fig. 11, we suspect the ice particles have been sublimated
during their passage through the ISI evaporation chamber.
Rounding of ice particles as an indicator of ice crystal subli-
mation was also found by Heymsfield and Iaquinta (2000),
Nelson (1998), and Sassen et al. (1994). Similar scatter-
ing patterns were recorded by the PPD-2K throughout the
CLACE 2013 campaign in general, and the case study period
in specific (Fig. 12c), pointing to sublimation of ice crys-
tals as the cause for their imperfect transmission. There are
a number of possible reasons for the sublimation, which we
hypothesize on as follows: firstly, if the chamber walls are
colder than the cloud, the relatively warmer cloud ice crys-
tals sublimate in the presence of the colder chamber wall.
Secondly, if the chamber walls are warmer than the ambi-
ent air temperature, the ice cover in the evaporation cham-
ber becomes patchy, i.e. parts of the wall surface would be-
come ice-free. This transient effect would potentially lead
to ice crystal growth in the short-term. However, once the
walls become partially ice-free, the air entering the evapo-
ration chamber becomes sub-saturated with respect to ice in
the vicinity of the ice-free wall surfaces (due to the warm-
ing influence of the chamber walls on the incoming air) and
ice particle sublimation occurs. Thirdly, the higher saturation
vapour pressure over the relatively more curved surfaces of
the ice crystal as compared to the flat ice walls of the evap-
oration chamber (a phenomenon equivalent to the Kelvin ef-
fect for liquid droplets) could lead to ice crystal sublimation.
Finally, as different facets, edges and structures of the ice
crystal surface have different saturation vapour pressures, re-
shaping of the crystal takes place. Studies on the dynamics
of ice crystal growth and sublimation using scanning elec-
tron microscopy conducted by Pfalzgraff et al. (2010) hint at
such a process; however temperature and pressure conditions
differ significantly from those experienced at the Jungfrau-
joch. An important note to make in the context of ice crys-
tal reshaping is that ice particle shape is not expected to
be stable even in an ice-saturated environment (as deposi-
tion and sublimation still occur in equilibrium). This con-
stitutes a major obstacle for investigating ice microphysical
properties such as habit and surface roughness with a sam-
pling system like the ISI in mixed-phase cloud conditions.
In order to address this issue, a smaller droplet evaporation
Atmos. Meas. Tech., 8, 3087–3106, 2015 www.atmos-meas-tech.net/8/3087/2015/
P. Kupiszewski et al.: The Ice Selective Inlet 3101
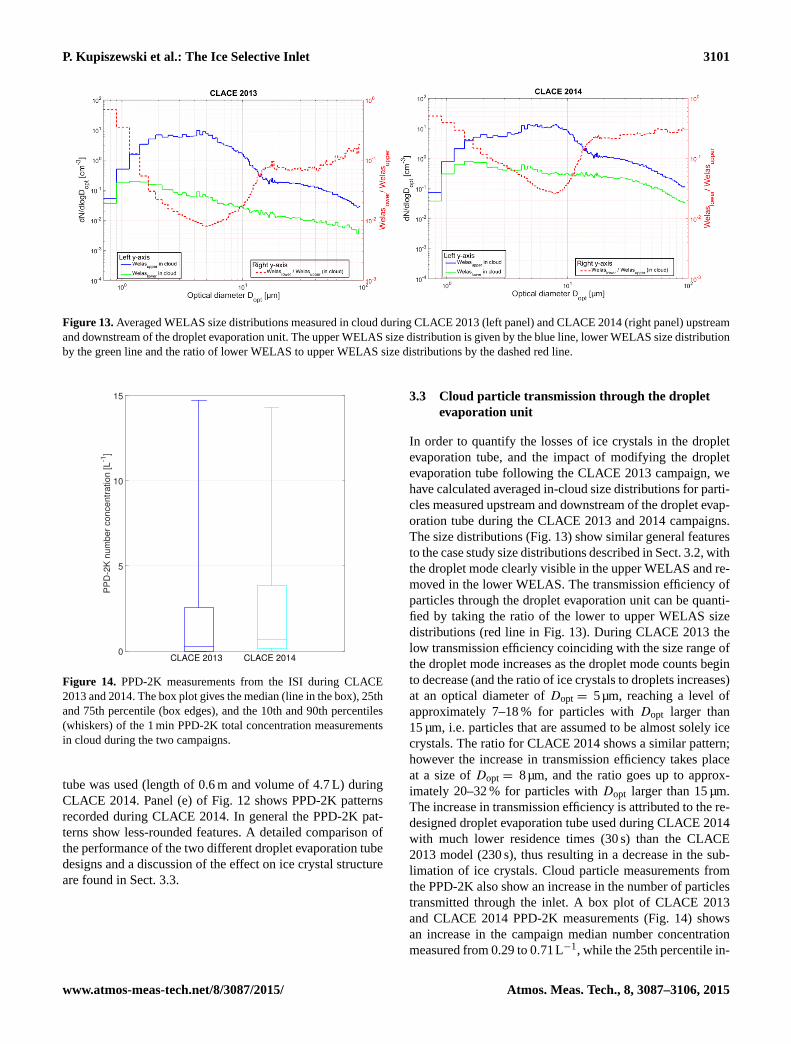
Figure 13. Averaged WELAS size distributions measured in cloud during CLACE 2013 (left panel) and CLACE 2014 (right panel) upstream
and downstream of the droplet evaporation unit. The upper WELAS size distribution is given by the blue line, lower WELAS size distribution
by the green line and the ratio of lower WELAS to upper WELAS size distributions by the dashed red line.
PP
D-2
K n
um
be
r co
nce
ntr
atio
n [
L-1
]
0
5
10
15
CLACE 2013 CLACE 2014
Figure 14. PPD-2K measurements from the ISI during CLACE
2013 and 2014. The box plot gives the median (line in the box), 25th
and 75th percentile (box edges), and the 10th and 90th percentiles
(whiskers) of the 1 min PPD-2K total concentration measurements
in cloud during the two campaigns.
tube was used (length of 0.6 m and volume of 4.7 L) during
CLACE 2014. Panel (e) of Fig. 12 shows PPD-2K patterns
recorded during CLACE 2014. In general the PPD-2K pat-
terns show less-rounded features. A detailed comparison of
the performance of the two different droplet evaporation tube
designs and a discussion of the effect on ice crystal structure
are found in Sect. 3.3.
3.3 Cloud particle transmission through the droplet
evaporation unit
In order to quantify the losses of ice crystals in the droplet
evaporation tube, and the impact of modifying the droplet
evaporation tube following the CLACE 2013 campaign, we
have calculated averaged in-cloud size distributions for parti-
cles measured upstream and downstream of the droplet evap-
oration tube during the CLACE 2013 and 2014 campaigns.
The size distributions (Fig. 13) show similar general features
to the case study size distributions described in Sect. 3.2, with
the droplet mode clearly visible in the upper WELAS and re-
moved in the lower WELAS. The transmission efficiency of
particles through the droplet evaporation unit can be quanti-
fied by taking the ratio of the lower to upper WELAS size
distributions (red line in Fig. 13). During CLACE 2013 the
low transmission efficiency coinciding with the size range of
the droplet mode increases as the droplet mode counts begin
to decrease (and the ratio of ice crystals to droplets increases)
at an optical diameter of Dopt = 5µm, reaching a level of
approximately 7–18 % for particles with Dopt larger than
15 µm, i.e. particles that are assumed to be almost solely ice
crystals. The ratio for CLACE 2014 shows a similar pattern;
however the increase in transmission efficiency takes place
at a size of Dopt = 8µm, and the ratio goes up to approx-
imately 20–32 % for particles with Dopt larger than 15 µm.
The increase in transmission efficiency is attributed to the re-
designed droplet evaporation tube used during CLACE 2014
with much lower residence times (30 s) than the CLACE
2013 model (230 s), thus resulting in a decrease in the sub-
limation of ice crystals. Cloud particle measurements from
the PPD-2K also show an increase in the number of particles
transmitted through the inlet. A box plot of CLACE 2013
and CLACE 2014 PPD-2K measurements (Fig. 14) shows
an increase in the campaign median number concentration
measured from 0.29 to 0.71L−1, while the 25th percentile in-
www.atmos-meas-tech.net/8/3087/2015/ Atmos. Meas. Tech., 8, 3087–3106, 2015

3102 P. Kupiszewski et al.: The Ice Selective Inlet
Figure 15. CLACE 2014 UHSAS measurements downstream of the ISI. The box plot (left panel) gives the mean (x), median (line in the box),
25th and 75th percentile (box edges), and the 10th and 90th percentiles (whiskers) of the 5 min UHSAS total concentration measurements
in cloud vs. out of cloud during the campaign. The right panel shows in-cloud and out-of-cloud size distributions during the campaign. The
mean in-cloud size distribution is given by the blue line, the mean out of cloud by the cyan line, the median of the cloud event means by the
dashed blue line and the median of the clear event means by the asterisk symbol (where no symbol is visible, the median is 0 and thus not
seen on a log-scale plot).
creased from 0 to 0.14L−1 and the 75th percentile from 2.6
to 3.9L−1. The scattering patterns acquired with the PPD-
2K in 2014 (see Fig. 12 panel (d) for examples of randomly
selected patterns) confirm the hypothesis that sublimation of
ice crystals decreased greatly during CLACE 2014; the pat-
terns show much less rounding of the ice crystals as com-
pared to CLACE 2013 with columnar and irregular ice crys-
tals frequently detected, as well as hexagonal plates.
3.4 ISI ice residual measurements
The high ice crystal losses in the droplet evaporation unit dur-
ing CLACE 2013, and the resulting low counting statistics,
greatly hamper the analysis of CLACE 2013 ice residual size
distributions. Consequently, we present selected measure-
ments of ice residuals from CLACE 2014, where ice crystal
transmission was considerably higher due to the re-design
of the droplet evaporation unit. Ice residual counts during
CLACE 2014 were unfortunately also rather low, due to is-
sues with the PCVI performance (ice residual counts were
considerably lower than counts of particles larger than 5 µm
in the lower WELAS, implying losses in the PCVI. We spec-
ulate this could be due to misalignment of the PCVI nozzle,
which could have occurred during installation of the PCVI.
While misalignment does not have a negative effect on re-
jection of small particles (i.e. interstitial aerosol and droplet
residues would still be removed from the sample flow), it has
been shown to cause a substantial decrease in transmission
efficiency if it should occur (Kulkarni et al., 2011). Nonethe-
less, the particles detected and characterized downstream of
the ISI still represent residues of small ice crystals, albeit
only a small fraction of all available. However, this is not
an issue, except for counting statistics, as the loss processes
for the ice crystals are expected to be independent of the IR
properties. Figure 15 shows in-cloud and out-of-cloud UH-
SAS measurements downstream of the ISI. The box plot in
the figure (left panel) shows that in-cloud counts are very low,
but still they are much higher than the out-of-cloud UHSAS
measurements, i.e. the background measurements. Similarly,
the in-cloud vs. out-of-cloud UHSAS campaign median size
distributions (right panel) show that, although both are simi-
lar in shape (both are relatively flat), the in-cloud distribution
is much higher across all measured particle sizes than the
out-of-cloud distribution. The average size distributions dif-
fer in shape somewhat (the in-cloud size distribution shows
relatively much higher concentrations below 300 nm due to a
single cloud event strongly influencing the average size dis-
tribution as compared to the median distribution) and also
confirm that the in-cloud distribution is much higher than
the out-of-cloud distribution. As the ratio of droplets to ice
crystals among the hydrometeors detected by the PPD-2K is
very low (as discussed in Sect. 3.2), and the hydrometeors
transmitted are thus predominantly ice crystals, the stronger
UHSAS signal in cloud compared to out of cloud is further
proof that the ISI selectively extracts ice crystals, and the ice
residuals contained within, in mixed-phase clouds.
Atmos. Meas. Tech., 8, 3087–3106, 2015 www.atmos-meas-tech.net/8/3087/2015/

P. Kupiszewski et al.: The Ice Selective Inlet 3103
Figure 16. Ratio of fluorescent to all particles measured by the WIBS in two fluorescence channels (F2 in the left panels and F3 in the right
panels) as a function of optical particle diameter during CLACE 2014 downstream of the ISI (upper panels) and the total inlet (lower panels)
during a Saharan dust event on 18–19 February 2014. The median values are given by the green line, the mean values by the red line, the
25th and 75th percentiles by the light grey shaded area and the 10th and 90th percentiles by the dark grey shaded area.
3.5 Ice residual characteristics during a Saharan dust
event
During CLACE 2014, on the 18–19 February 2014, a Saha-
ran dust event lasting approximately 40 h was detected at the
Jungfraujoch (see Collaud Coen et al. (2004) for a descrip-
tion of the SDE detection method). During the SDE, mea-
surements were taken in cloud downstream of the ISI and the
total inlet using the WIBS, which was switched between the
two inlets.
For both inlets a ratio of fluorescent to all particles was
calculated for the three fluorescence channels measured by
the WIBS (shown in Fig. 16 are the ratios for fluorescence
channels FL2 and FL3). The ratios, given by the green (me-
dian) and red (mean) lines in Fig. 16, are substantially higher
for sub-2 µm particles downstream of the ISI (upper panels
in Fig. 16), as compared to the total aerosol (lower panels
in Fig. 16), which means there is enrichment of fluorescent
particles in this size range. For particles between ca. 2 and
3.5 µm, the ratio is similar for both inlets. For larger particles
the ratio is slightly higher for the total inlet measurements.
However, the measurement uncertainty for particles above
ca. 3.5 µm is very high, as shown by the increasing spread
of the 25th and 75th percentiles. It should be noted further-
more that for particles with aerodynamic diameters larger
than 3 µm, the transmission efficiency through the PCVI in-
creases strongly as the particle diameter increases, as seen in
Fig. 9. Consequently, for particles larger than 3 µm, with in-
creasing aerodynamic diameter of the sampled particles, an
increasingly large fraction of the particles measured down-
stream of the ISI during a Saharan dust event could be large
dust particles which were not rejected by the PCVI. As a re-
sult, it is hard to make any meaningful statement regarding
the properties of particles in this size range downstream of
the ISI relative to the total inlet measurements.
The enrichment in sub-2 µm fluorescent particles down-
stream of the ISI is of great interest for two reasons. First,
it confirms once again the operating principle of the ISI,
demonstrating that the inlet does indeed have a selective na-
ture and, therefore, that the properties of the measured par-
ticles are different from the bulk aerosol properties. Sec-
ond, enrichment of fluorescent particles in the ice residuals
strongly suggests the presence of biological material, which
is known to be a very efficient catalyst for ice nucleation
(Tobo et al., 2013). Long-range dust transport has been sug-
gested to be an efficient pathway for dispersal of biological
material (Hara and Zhang, 2012). A study by Izquierdo et al.
(2011) found that herbaceous pollen from the Sahara region
were transported on occasion to the Canary Islands, while
Creamean et al. (2013) present evidence that dust and bio-
particles transported from the Sahara and Asia serve as IN
and contribute to formation of orographic precipitation over
the western USA. The results from this study further support
the hypothesis that biological material can be transported to-
gether with dust particles from north Africa and, as efficient
ice nuclei, could contribute to formation of ice in mixed-
phase cloud conditions.
www.atmos-meas-tech.net/8/3087/2015/ Atmos. Meas. Tech., 8, 3087–3106, 2015

3104 P. Kupiszewski et al.: The Ice Selective Inlet
4 Conclusions
The ISI, a novel inlet for the selective sampling of small (ap-
proximately 5 to 20 µm in aerodynamic diameter) ice crys-
tals in mixed-phase clouds, has been designed and developed.
Separation of the small ice crystals from other particles found
in a mixed-phase cloud (i.e. large crystals, droplets and inter-
stitial particles) is achieved using a modular set of compo-
nents. An important property of the droplet evaporation unit
is that it allows for separation of the liquid and ice phase
without physical impaction of the hydrometeors, thus avoid-
ing potential artefacts from ice crystal break-up. In addition
to extraction of ice residuals contained in the selectively sam-
pled ice crystals, the ISI provides valuable cloud microphys-
ical information by means of the optical particle spectrome-
ters mounted within the inlet.
Prior to deployment in the field, the performance of the
WELAS optical particle spectrometers and the transmission
efficiency of the PCVI were characterized in the laboratory.
Furthermore, the performance characteristics of the omnidi-
rectional inlet and cyclone were calculated based on well-
established theoretical models. The ISI was deployed during
its first field experiment as part of the CLACE 2013 cam-
paign at the high-altitude research station Jungfraujoch. The
field campaign provided an opportunity for validation of the
operating principle of the droplet evaporation unit. A com-
parison of SID-3 and ISI WELAS cloud microphysical mea-
surements provides evidence that the ISI is able to sample
ice crystals in mixed-phase cloud conditions. An analysis of
hydrometeor size distributions measured by the WELAS sen-
sors shows that droplets are removed very efficiently by the
evaporation unit. This was confirmed based on PPD-2K scat-
tering patterns which show that the dominating hydrometeors
transmitted by the ISI are ice particles. Partial sublimation
of ice crystals in the droplet evaporation unit was however
found to take place. While this does not pose an issue for
identification and characterization of ice residual particles, it
does result in lower counting statistics, as well as hindering
analysis of the microphysical properties of ice crystals with
the PPD-2K downstream of the evaporation unit. Modifica-
tions in the design of the droplet evaporation unit prior to the
CLACE 2014 campaign substantially improved the transmis-
sion efficiency. Ice residual measurements obtained during
CLACE 2014 provided further proof of the ability of the ISI
to selectively extract ice crystals in mixed-phase clouds. UV-
LIF measurements of aerosol during a Saharan dust event
suggest the presence of bio-material. A first indication of en-
richment of fluorescent particles, considered to be of biologi-
cal origin based on their spectral signature, was found in sub-
2 µm ice residuals, suggesting their possible contribution to
formation of ice during this period.
Acknowledgements. This project is funded by the Swiss National
Science Foundation (grant 135356), the German Research Founda-
tion (grant SCHN 1140/2-1), MeteoSwiss (GAW-CH program), the
European Research Council (grant 615922-BLACARAT) and the
ACTRIS program (European Union Seventh Framework Program
(FP7/2007-2013), grant 262254). The participation of S. Mertes
was funded by the DFG priority program HALO (SPP 1294, grant
ME 3534/1-2) and DFG research unit INUIT (grant STR 453/7-1).
We thank the International Foundation High Altitude Research
Stations Jungfraujoch and Gornergrat (HFSJG) for the opportunity
to perform experiments on the Jungfraujoch. We would also like to
thank G. Lloyd for providing the PVM data, L. Schenk for fruitful
discussions and G. Wehrle for his help in setting up the ISI at the
Jungfraujoch.
Edited by: D. Toohey
References
Bohren, C. F. and Huffman, D. R.: Absorption and Scattering of
Light by Small Particles, Wiley-VCH Verlag GmbH, Weinheim,
Germany, 1998.
Boulter, J. E., Cziczo, D. J., Middlebrook, A. M., Thomson, D. S.,
and Murphy, D. M.: Design and performance of a pumped
counterflow virtual impactor, Aerosol Sci. Tech., 40, 969–976,
doi:10.1080/02786820600840984, 2006.
Cai, Y., Montague, D. C., Mooiweer-Bryan, W., and Deshler,
T.: Performance characteristics of the ultra high sensitivity
aerosol spectrometer for particles between 55 and 800 nm:
Laboratory and field studies, J. Aerosol Sci., 39, 759–769,
doi:10.1016/j.jaerosci.2008.04.007, 2008.
Cantrell, W. and Heymsfield, A.: Production of ice in tropo-
spheric clouds: a review, B. Am. Meteorol. Soc., 86, 795–807,
doi:10.1175/BAMS-86-6-795, 2005.
Chou, C., Stetzer, O., Weingartner, E., Jurányi, Z., Kanji, Z. A., and
Lohmann, U.: Ice nuclei properties within a Saharan dust event
at the Jungfraujoch in the Swiss Alps, Atmos. Chem. Phys., 11,
4725–4738, doi:10.5194/acp-11-4725-2011, 2011.
Choularton, T. W., Bower, K. N., Weingartner, E., Crawford, I.,
Coe, H., Gallagher, M. W., Flynn, M., Crosier, J., Connolly, P.,
Targino, A., Alfarra, M. R., Baltensperger, U., Sjogren, S., Ver-
heggen, B., Cozic, J., and Gysel, M.: The influence of small
aerosol particles on the properties of water and ice clouds, Farad.
Discuss., 137, 205–22, doi:10.1039/B702722M, 2008.
Collaud Coen, M., Weingartner, E., Schaub, D., Hueglin, C., Cor-
rigan, C., Henning, S., Schwikowski, M., and Baltensperger, U.:
Saharan dust events at the Jungfraujoch: detection by wavelength
dependence of the single scattering albedo and first climatology
analysis, Atmos. Chem. Phys., 4, 2465–2480, doi:10.5194/acp-
4-2465-2004, 2004.
Cozic, J., Mertes, S., Verheggen, B., Cziczo, D. J., Gallavardin,
S. J., Walter, S., Baltensperger, U., and Weingartner, E.: Black
carbon enrichment in atmospheric ice particle residuals observed
in lower tropospheric mixed phase clouds, J. Geophys. Res.-
Atmos., 113, D15209, doi:10.1029/2007JD009266, 2008.
Creamean, J. M., Suski, K. J., Rosenfeld, D., Cazorla, A., De-
Mott, P. J., Sullivan, R. C., White, A. B., Ralph, F. M., Min-
nis, P., Comstock, J. M., Tomlinson, J. M., and Prather, K. A.:
Dust and biological aerosols from the Sahara and Asia influ-
ence precipitation in the western U.S., Science, 339, 1572–1578,
doi:10.1126/science.1227279, 2013.
Atmos. Meas. Tech., 8, 3087–3106, 2015 www.atmos-meas-tech.net/8/3087/2015/

P. Kupiszewski et al.: The Ice Selective Inlet 3105
Cziczo, D. J., Froyd, K. D., Hoose, C., Jensen, E. J., Diao,
M., Zondlo, M. A., Smith, J. B., Twohy, C. H., and Mur-
phy, D. M.: Clarifying the dominant sources and mecha-
nisms of cirrus cloud formation, Science, 340, 1320–1324,
doi:10.1126/science.1234145, 2013.
Eames, I., Marr, N., and Sabir, H.: The evaporation coefficient
of water: a review, Int. J. Heat Mass Tran., 40, 2963–2973,
doi:10.1016/S0017-9310(96)00339-0, 1997.
Fukuta, N. and Walter, L. A.: Kinetics of hydrometeor growth
from a vapor-spherical model, J. Atmos. Sci., 27, 1160–1172,
doi:10.1175/1520-0469(1970)027<1160:KOHGFA>2.0.CO;2,
1970.
Glen, A. and Brooks, S. D.: A new method for measuring optical
scattering properties of atmospherically relevant dusts using the
Cloud and Aerosol Spectrometer with Polarization (CASPOL),
Atmos. Chem. Phys., 13, 1345–1356, doi:10.5194/acp-13-1345-
2013, 2013.
Hara, K. and Zhang, D.: Bacterial abundance and viability
in long-range transported dust, Atmos. Environ., 47, 20–25,
doi:10.1016/j.atmosenv.2011.11.050, 2012.
Heim, M., Mullins, B. J., Umhauer, H., and Kasper, G.: Perfor-
mance evaluation of three optical particle counters with an ef-
ficient “multimodal” calibration method, J. Aerosol Sci., 39,
1019–1031, doi:10.1016/j.jaerosci.2008.07.006, 2008.
Heymsfield, A. J. and Iaquinta, J.: Cirrus crystal terminal
velocities, J. Atmos. Sci., 57, 916–938, doi:10.1175/1520-
0469(2000)057<0916:CCTV>2.0.CO;2, 2000.
Izquierdo, R., Belmonte, J., Avila, A., Alarcón, M., Cuevas, E.,
and Alonso-Pérez, S.: Source areas and long-range transport of
pollen from continental land to Tenerife (Canary Islands), Int. J.
Biometeorol., 55, 67–85, doi:10.1007/s00484-010-0309-1, 2011.
Kärcher, B. and Basko, M. M.: Trapping of trace gases in
growing ice crystals, J. Geophys. Res.-Atmos., 109, D22204,
doi:10.1029/2004JD005254, 2004.
Kaye, P. H., Hirst, E., Greenaway, R. S., Ulanowski, Z., Hesse, E.,
DeMott, P. J., Saunders, C., and Connolly, P.: Classifying at-
mospheric ice crystals by spatial light scattering, Opt. Lett., 33,
1545–1547, doi:10.1364/OL.33.001545, 2008.
Kenny, L. and Gussman, R.: Characterization and modelling of a
family of cyclone aerosol preseparators, J. Aerosol Sci., 28, 677–
688, doi:10.1016/S0021-8502(96)00455-7, 1997.
Kenny, L. and Gussman, R.: A direct approach to the design of cy-
clones for aerosol-monitoring applications, J. Aerosol Sci., 31,
1407–1420, doi:10.1016/S0021-8502(00)00047-1, 2000.
Kreidenweis, S. M., Walcek, C. J., Feingold, G., Gong, W., Ja-
cobson, M. Z., Kim, C.-H., Liu, X., Penner, J. E., Nenes, A.,
and Seinfeld, J. H.: Modification of aerosol mass and size dis-
tribution due to aqueous-phase SO2 oxidation in clouds: com-
parisons of several models, J. Geophys. Res.-Atmos., 108, 4213,
doi:10.1029/2002JD002697, 2003.
Kulkarni, G., Pekour, M., Afchine, A., Murphy, D. M., and Cz-
iczo, D. J.: Comparison of experimental and numerical stud-
ies of the performance characteristics of a pumped coun-
terflow virtual impactor, Aerosol Sci. Tech., 45, 382–392,
doi:10.1080/02786826.2010.539291, 2011.
Laaksonen, A., Vesala, T., Kulmala, M., Winkler, P. M., and Wag-
ner, P. E.: Commentary on cloud modelling and the mass accom-
modation coefficient of water, Atmos. Chem. Phys., 5, 461–464,
doi:10.5194/acp-5-461-2005, 2005.
Lloyd, G., Choularton, T. W., Bower, K. N., Gallagher, M. W.,
Connolly, P. J., Flynn, M., Farrington, R., Crosier, J., Sch-
lenczek, O., Fugal, J., and Henneberger, J.: The origins of ice
crystals measured in mixed phase clouds at High-Alpine site
Jungfraujoch, Atmos. Chem. Phys. Discuss., 15, 18181–18224,
doi:10.5194/acpd-15-18181-2015, 2015.
Lohmann, U.: A glaciation indirect aerosol effect caused
by soot aerosols, Geophys. Res. Lett., 29, 4, 11–1–11–4,
doi:10.1029/2001GL014357, 2002.
Lohmann, U. and Feichter, J.: Global indirect aerosol effects: a re-
view, Atmos. Chem. Phys., 5, 715–737, doi:10.5194/acp-5-715-
2005, 2005.
Lowe, P. R. and Ficke, J. M.: The computation of saturation vapor
pressure, Technical Paper 4-74, Tech. rep., Environmental Pre-
diction Research Facility, Naval Postgraduate School, Monterey,
CA, USA, 1974.
Marécal, V., Pirre, M., Rivière, E. D., Pouvesle, N., Crowley, J. N.,
Freitas, S. R., and Longo, K. M.: Modelling the reversible up-
take of chemical species in the gas phase by ice particles formed
in a convective cloud, Atmos. Chem. Phys., 10, 4977–5000,
doi:10.5194/acp-10-4977-2010, 2010.
Marek, R. and Straub, J.: Analysis of the evaporation coefficient and
the condensation coefficient of water, Int. J. Heat Mass Tran., 44,
39–53, doi:10.1016/S0017-9310(00)00086-7, 2001.
McFarlane, S. A. and Marchand, R. T.: Analysis of ice crystal
habits derived from MISR and MODIS observations over the
ARM Southern Great Plains site, J. Geophys. Res.-Atmos., 113,
doi:10.1029/2007JD009191, 2008.
Mertes, S., Verheggen, B., Walter, S., Connolly, P., Ebert, M.,
Schneider, J., Bower, K. N., Cozic, J., Weinbruch, S., Bal-
tensperger, U., and Weingartner, E.: Counterflow virtual impactor
based collection of small ice particles in mixed-phase clouds for
the physico-chemical characterization of tropospheric ice nuclei:
sampler description and first case study, Aerosol Sci. Tech., 41,
848–864, doi:10.1080/02786820701501881, 2007.
Möhler, O., Büttner, S., Linke, C., Schnaiter, M., Saathoff, H., Stet-
zer, O., Wagner, R., Krämer, M., Mangold, A., Ebert, V., and
Schurath, U.: Effect of sulfuric acid coating on heterogeneous
ice nucleation by soot aerosol particles, J. Geophys. Res.-Atmos.,
110, D11210, doi:10.1029/2004JD005169, 2005.
Mosimann, L., Weingartner, E., and Waldvogel, A.: An anal-
ysis of accreted drop sizes and mass on rimed snow
crystals, J. Atmos. Sci., 51, 1548–1558, doi:10.1175/1520-
0469(1994)051<1548:AAOADS>2.0.CO;2, 1994.
Myhre, G., Shindell, D., Bréon, F.-M., Collins, W., Fuglestvedt,
J., Huang, J., Koch, D., Lamarque, J.-F., Lee, D., Mendoza,
B., Nakajima, T., Robock, A., Stephens, G., Takemura, T., and
Zhang, H.: Anthropogenic and Natural Radiative Forcing, in:
Climate Change 2013: The Physical Science Basis. Contribu-
tion of Working Group I to the Fifth Assessment Report of the
Intergovernmental Panel on Climate Change, chap. 8, 659–740,
Cambridge University Press, Cambridge, UK and New York, NY,
USA, 2013.
Nelson, J.: Sublimation of ice crystals, J. Atmos. Sci., 55, 910–919,
doi:10.1175/1520-0469(1998)055<0910:SOIC>2.0.CO;2, 1998.
Noone, K. J., Hansson, H.-C., and Mallant, R. K.: Droplet sampling
from crosswinds: An inlet efficiency calibration, J. Aerosol Sci.,
23, 153–164, doi:10.1016/0021-8502(92)90051-V, 1992.
www.atmos-meas-tech.net/8/3087/2015/ Atmos. Meas. Tech., 8, 3087–3106, 2015

3106 P. Kupiszewski et al.: The Ice Selective Inlet
Pekour, M. S. and Cziczo, D. J.: Wake capture, parti-
cle breakup, and other artifacts associated with counter-
flow virtual impaction, Aerosol Sci. Tech., 45, 758–764,
doi:10.1080/02786826.2011.558942, 2011.
Penner, J. E.: Climate change: the cloud conundrum, Nature, 432,
962–963, doi:10.1038/432962a, 2004.
Pfalzgraff, W. C., Hulscher, R. M., and Neshyba, S. P.: Scan-
ning electron microscopy and molecular dynamics of surfaces
of growing and ablating hexagonal ice crystals, Atmos. Chem.
Phys., 10, 2927–2935, doi:10.5194/acp-10-2927-2010, 2010.
Pound, G. M.: Selected values of evaporation and condensation co-
efficients for simple substances, J. Phys. Chem. Ref. Data, 1,
135–146, doi:10.1063/1.3253096, 1972.
Prenni, A. J., DeMott, P. J., Twohy, C., Poellot, M. R., Kreiden-
weis, S. M., Rogers, D. C., Brooks, S. D., Richardson, M. S.,
and Heymsfield, A. J.: Examinations of ice formation processes
in Florida cumuli using ice nuclei measurements of anvil ice
crystal particle residues, J. Geophys. Res.-Atmos., 112, D10221,
doi:10.1029/2006JD007549, 2007.
Pruppacher, H. R. and Klett, J. D.: Microphysics of Clouds and Pre-
cipitation, 2nd ed., Kluwer Academic Publishers, Dordrecht, the
Netherlands, 1997.
Rosati, B., Wehrle, G., Gysel, M., Zieger, P., Baltensperger, U.,
and Weingartner, E.: The white-light humidified optical parti-
cle spectrometer (WHOPS) – a novel airborne system to charac-
terize aerosol hygroscopicity, Atmos. Meas. Tech., 8, 921–939,
doi:10.5194/amt-8-921-2015, 2015.
Sassen, K., Knight, N. C., Takano, Y., and Heymsfield, A. J.: Effects
of ice-crystal structure on halo formation: cirrus cloud experi-
mental and ray-tracing modeling studies, Appl. Opt., 33, 4590–
4601, doi:10.1364/AO.33.004590, 1994.
Schenk, L. P., Mertes, S., Kästner, U., Frank, F., Nillius, B., Bundke,
U., Rose, D., Schmidt, S., Schneider, J., Worringen, A., Kan-
dler, K., Bukowiecki, N., Ebert, M., Curtius, J., and Strat-
mann, F.: Characterization and first results of an ice nucleating
particle measurement system based on counterflow virtual im-
pactor technique, Atmos. Meas. Tech. Discuss., 7, 10585–10617,
doi:10.5194/amtd-7-10585-2014, 2014.
Schmidt, S., Schneider, J., Klimach, T., Mertes, S., Schenk, L. P.,
Curtius, J., Kupiszewski, P., Hammer, E., Vochezer, P., Lloyd, G.,
Ebert, M., Kandler, K., Weinbruch, S., and Borrmann, S.: In-situ
single submicron particle composition analysis of ice residuals
from mountain-top mixed-phase clouds in Central Europe, 15,
4677–4724, doi:10.5194/acpd-15-4677-2015, 2015.
Seinfeld, J. H. and Pandis, S. N.: Atmospheric Chemistry and
Physics: From Air Pollution to Climate Change, 2nd Edition,
John Wiley & Sons, Inc., Hoboken, NJ, USA, 2006.
Shaw, R. A. and Lamb, D.: Experimental determination of the ther-
mal accommodation and condensation coefficients of water, J.
Chem. Phys, 111, 10659–10663, doi:10.1063/1.480419, 1999.
Sun, Z. and Shine, K. P.: Studies of the radiative properties of ice
and mixed-phase clouds, Q. J. Roy. Meteor. Soc., 120, 111–137,
doi:10.1002/qj.49712051508, 1994.
Tobo, Y., Prenni, A. J., DeMott, P. J., Huffman, J. A., McCluskey,
C. S., Tian, G., Pöhlker, C., Pöschl, U., and Kreidenweis, S. M.:
Biological aerosol particles as a key determinant of ice nuclei
populations in a forest ecosystem, J. Geophys. Res.-Atmos., 118,
10100–10110, doi:10.1002/jgrd.50801, 2013.
Toprak, E. and Schnaiter, M.: Fluorescent biological aerosol par-
ticles measured with the Waveband Integrated Bioaerosol Sen-
sor WIBS-4: laboratory tests combined with a one year field
study, Atmos. Chem. Phys., 13, 225–243, doi:10.5194/acp-13-
225-2013, 2013.
Toprak, E. and Schnaiter, M.: Measurement of biological particles
during Saharan dust events at Jungfraujoch, Atmos. Chem. Phys.,
in prep., 2015.
Twohy, C. H. and Poellot, M. R.: Chemical characteristics of ice
residual nuclei in anvil cirrus clouds: evidence for homogeneous
and heterogeneous ice formation, Atmos. Chem. Phys., 5, 2289–
2297, doi:10.5194/acp-5-2289-2005, 2005.
Ulanowski, Z., Kaye, P. H., Hirst, E., Greenaway, R. S., Cotton,
R. J., Hesse, E., and Collier, C. T.: Incidence of rough and irregu-
lar atmospheric ice particles from Small Ice Detector 3 measure-
ments, Atmos. Chem. Phys., 14, 1649–1662, doi:10.5194/acp-
14-1649-2014, 2014.
Verheggen, B., Cozic, J., Weingartner, E., Bower, K., Mertes, S.,
Connolly, P., Gallagher, M., Flynn, M., Choularton, T., and Bal-
tensperger, U.: Aerosol partitioning between the interstitial and
the condensed phase in mixed-phase clouds, J. Geophys. Res.-
Atmos., 112, doi:10.1029/2007JD008714, 2007.
Vincent, J. H.: Aerosol Sampling: Science, Standards, Instrumenta-
tion and Applications, John Wiley & Sons, Ltd, Chichester, UK,
2007.
Vochezer, P., Järvinen, E., Wagner, R., Kupiszewski, P., Leisner,
T., and Schnaiter, M.: In situ characterization of mixed phase
clouds using the Small Ice Detector and the Particle Phase
Discriminator, Atmos. Meas. Tech. Discuss., 8, 6511–6558,
doi:10.5194/amtd-8-6511-2015, 2015.
von der Weiden, S.-L., Drewnick, F., and Borrmann, S.: Particle
Loss Calculator – a new software tool for the assessment of the
performance of aerosol inlet systems, Atmos. Meas. Tech., 2,
479–494, doi:10.5194/amt-2-479-2009, 2009.
Wang, L.: Theoretical study of cyclone design, Ph.D. thesis, Texas
A&M University, 2004.
Weingartner, E., Nyeki, S., and Baltensperger, U.: Seasonal and di-
urnal variation of aerosol size distributions (10 <D < 750 nm) at
a high-alpine site (Jungfraujoch 3580 m a.s.l.), J. Geophys. Res.-
Atmos., 104, 26809–26820, doi:10.1029/1999JD900170, 1999.
Worringen, A., Kandler, K., Benker, N., Dirsch, T., Mertes, S.,
Schenk, L., Kästner, U., Frank, F., Nillius, B., Bundke, U., Rose,
D., Curtius, J., Kupiszewski, P., Weingartner, E., Vochezer, P.,
Schneider, J., Schmidt, S., Weinbruch, S., and Ebert, M.: Single-
particle characterization of ice-nucleating particles and ice par-
ticle residuals sampled by three different techniques, 15, 4161–
4178, doi:10.5194/acp-15-4161-2015, 2015.
Atmos. Meas. Tech., 8, 3087–3106, 2015 www.atmos-meas-tech.net/8/3087/2015/


![Optical and Electrical Properties of TTF-MPcs€¦ · Optical and Electrical Properties of TTF-MPcs ... well as for organic solar cells (OSC) [2]. ... in many applications, such as](https://img.pdfslide.us/doc/110x75/5f0859bd7e708231d421939c/optical-and-electrical-properties-of-ttf-mpcs-optical-and-electrical-properties.jpg)


![RBEs and MPCs in MSC.nastran2[1]](https://img.pdfslide.us/doc/110x75/577d20d31a28ab4e1e93d88c/rbes-and-mpcs-in-mscnastran21.jpg)