Embed Size (px)
Citation preview

Atmos. Chem. Phys., 6, 5279–5293, 2006www.atmos-chem-phys.net/6/5279/2006/© Author(s) 2006. This work is licensedunder a Creative Commons License.
AtmosphericChemistry
and Physics
A mass spectrometric study of secondary organic aerosols formedfrom the photooxidation of anthropogenic and biogenic precursorsin a reaction chamberM. R. Alfarra1,2, D. Paulsen1,*, M. Gysel1,2, A. A. Garforth3, J. Dommen1, A. S. H. Prevot1, D. R. Worsnop4,U. Baltensperger1, and H. Coe2
1Laboratory of Atmospheric Chemistry, Paul Scherrer Institut, 5232 Villigen PSI, Switzerland2School of Earth, Atmospheric and Environmental Sciences, Univ. of Manchester, P. O. Box 88, Manchester M60 1QD, UK3School of Chemical Engineering and Analytical Sciences, Univ. of Manchester, P. O. Box 88, Manchester M60 1QD, UK4Aerodyne Research Inc., 45 Manning Road, Billerica, MA 01821, USA*now at: Division of Engineering and Applied Sciences, Harvard University, Cambridge, MA 02138, USA
Received: 20 April 2006 – Published in Atmos. Chem. Phys. Discuss.: 10 August 2006Revised: 8 November 2006 – Accepted: 10 November 2006 – Published: 20 November 2006
Abstract. An Aerodyne Aerosol Mass Spectrometer (AMS)has been utilised to provide on-line measurements of themass spectral signatures and mass size distributions ofthe oxidation products resulting from irradiating 1,3,5-trimethylbenzene (1,3,5-TMB) and α-pinene, separately, inthe presence of nitrogen oxide, nitrogen dioxide and propenein a reaction chamber. Mass spectral results indicate thatboth precursors produce SOA with broadly similar chemi-cal functionality of a highly oxidised nature. However, sig-nificant differences occur in the minor mass spectral frag-ments for the SOA in the two reaction systems, indicatingthat they have different molecular composition. Nitrogen-containing organic compounds have been observed in thephotooxidation products of both precursors, and their for-mation appeared to be controlled by the temporal variabil-ity of NOx. Although the overall fragmentation patterns ofthe photooxidation products in both systems did not changesubstantially over the duration of each experiment, the con-tribution of some individual mass fragments to total massappeared to be influenced by the irradiation time. The ef-fective densities of the 1,3,5-TMB and α-pinene SOA parti-cles were determined for various particle sizes using the re-lationship between mobility and vacuum aerodynamic diam-eters. The effective density for the 1,3,5-TMB SOA rangedfrom 1.35–1.40 g/cm3, while that for α-pinene SOA rangedfrom 1.29–1.32 g/cm3. The determined effective densitiesdid not show dependence on irradiation time. Results sug-gest that further chemical processing of SOA takes place in
Correspondence to: M. R. Alfarra([email protected])
the real atmosphere, as neither the α-pinene nor the 1,3,5-TMB experimental results reproduce the right relative prod-uct distribution between carbonyl-containing and multifunc-tional carboxylic acid species measured at ambient locationsinfluenced by aged continental organic aerosols.
1 Introduction
Understanding the formation, composition and behaviour ofambient aerosol particles is of critical importance due totheir contribution to many important atmospheric processes,such as cloud formation (Novakov and Penner, 1993; Cruzand Pandis, 1997; Facchini et al., 1999a, b), visibility re-duction (Macias et al., 1981; Vasconcelos et al., 1994) anddirect radiative forcing (Charlson et al., 1992). Also, re-sults of epidemiological studies indicate that exposure toambient aerosol particles with aerodynamic diameters lessthan 2.5 µm is correlated with daily mortality and morbid-ity rates (Dockery et al., 1993). However, to date, the cli-matic impact of aerosol particles is poorly quantified, andthe compounds that contribute to adverse health effects havenot been established. This is partly due to the fact thatthe chemical composition of ambient aerosol particles hasnot been fully characterised, in particular its organic frac-tion. While organic aerosol particles can be directly emit-ted into the atmosphere (e.g. biomass burning, combustionprocesses), they can also be introduced by secondary or-ganic aerosol (SOA) formation. SOA formation occurs whenvolatile organic compounds undergo atmospheric oxidationreactions, forming products that have low enough volatilities
Published by Copernicus GmbH on behalf of the European Geosciences Union.
5280 M. R. Alfarra et al.: A mass spectrometric study of secondary organic aerosols
to form aerosol via either nucleation or gas-to-particle par-titioning to pre-existing particles (Odum et al., 1996; Hoff-mann et al., 1997; Kamens et al., 1999; Kamens and Jaoui,2001). Volatile organic compounds (VOCs) are emitted intothe atmosphere from anthropogenic and biogenic sources(Went, 1960; Odum et al., 1996; Seinfeld and Pandis, 1998;Kleindienst et al., 1999; Aschmann et al., 2002). Anthro-pogenic VOC sources comprise organics such as alkanes,alkenes, aromatics and carbonyls, while biogenic sources in-clude organics such as isoprene, monoterpenes and sesquiter-penes. Aromatics as well as monoterpenes are particularlyimportant constituents of urban and regional atmosphericchemistry and most have been identified as SOA precursors(Odum et al., 1996; Griffin et al., 1999; Kamens et al., 1999;Larsen et al., 2001).
In situ investigation of key physical and chemical pro-cesses during SOA formation in the atmosphere is compli-cated by the vast number of species involved and their gen-erally low concentrations. Hence reaction chambers are of-ten used to study these processes. A reaction chamber is alarge confined volume in which sunlight or simulated sun-light is used to irradiate mixtures of atmospheric trace gases(hydrocarbons, nitrogen oxides, sulphur dioxide, etc.) in pu-rified air. Reaction chambers can be used to produce con-trolled atmospheres to investigate a range of physical phe-nomena from the formation of gas-phase reaction products tothe partitioning of semi-volatile compounds between the gasand particle phase. Such experiments can be useful in un-derstanding the chemical and physical parameters that con-trol the formation of secondary organic aerosols. A num-ber of reaction chamber studies have investigated gas-particlepartitioning of products of photochemical reactions involv-ing anthropogenic as well as biogenic precursors. Much ofthe efforts have been made to quantify the aerosol forma-tion potential (aerosol yield) of small aromatic and naturalhydrocarbon compounds both in the absence and presenceof seed aerosol particles (Odum et al., 1996, 1997; Grif-fin et al., 1999; Kleindienst et al., 1999; Aschmann et al.,2002). Other studies have attempted to identify the molec-ular composition of the oxidation products of anthropogenicand biogenic precursors, mainly aromatic and monoterpenecompounds, and have offered detailed reaction mechanismsfor the formation of various chemical species (Forstner et al.,1997; Glasius et al., 2000; Jang and Kamens, 2001; Larsenet al., 2001; Griffin et al., 2002; Jaoui and Kamens, 2003;Kleindienst et al., 2004). In most of the studies, aerosol par-ticles were collected on filters, extracted with solvents andthen analysed off-line, using gas chromatography-mass spec-trometry (GC-MS). Only 10–30% of the mass collected andextracted could be identified on a molecular level (Forstner etal., 1997; Cocker et al., 2001). More recently, online aerosolmass spectrometers have been employed to characterise SOAparticles formed from photooxidation or ozonolysis experi-ments in smog chambers (Bahreini et al., 2005; Liggio et al.,2005; Gross et al., 2006).
Recent studies have reported that polymers and oligomerscompose significant fractions of SOA formed from the pho-tooxidation of aromatic and biogenic compounds (Gao etal., 2004a, b; Iinuma et al., 2004; Tolocka et al., 2004).Kalberer et al. (2004) found that about 50% of the SOA mass,formed from the photooxidation of 1,3,5-trimethylbenzene(1,3,5-TMB) in a reaction chamber, consists of oligomerswith molecular masses of up to 1000 daltons. Moreover,the formation of oligomeric molecules has been reported asan important step in the SOA production by the reactionof α-pinene and ozone in the presence of acid seed aerosol(Tolocka et al., 2004). The study reported here follows onfrom Kalberer et al. (2004) and Baltensperger et al. (2005)and employs an Aerodyne aerosol mass spectrometer (AMS)to provide on-line measurements of the mass spectral signa-tures and mass size distributions of the oxidation productsresulting from irradiating 1,3,5-TMB (anthropogenic precur-sor) and α-pinene (biogenic precursor), separately, in thepresence of nitrogen oxide, nitrogen dioxide and propene in areaction chamber. Unlike most other studies, the objective isnot to provide detailed chemical speciation of the photoox-idation products of both precursors. This is due to the factthat the AMS does not utilise any means of chemical sep-aration prior to the vaporisation and ionisation of the parti-cles (Jayne et al., 2000; Jimenez et al., 2003b). Rather, thispaper aims to study the change in the highly time resolvedchemical signatures of the products from each precursor asa function of irradiation time, and to compare the chemicalsignatures and the densities of the SOA formed from thesetwo precursors. In addition, the study attempts to investigatethe extent of oxidation and oligomerisation of the aerosol-phase reaction products. Finally, the implications of the pho-tooxidation reactions carried out in this study on atmosphericmeasurements are discussed by comparing the mass spectralsignatures of the products of both precursors to mass spectraof ambient organic particulate measured in relevant environ-ments. Aerosol particles have been directly sampled fromthe reaction chamber into the AMS, avoiding any artifacts(e.g. evaporation, adsorption, filter contamination) usuallyassociated with the off-line analysis methods.
2 Experimental
2.1 Reaction chamber
Experiments were carried out in the indoor reaction chamberat Paul Scherrer Institute (PSI). The PSI reaction chamber isa 27 m3 transparent Teflon ® bag suspended in a temperature-controlled housing. The radiation was generated by fourxenon arc lamps (4 kW each) selected to simulate the solarlight spectrum and natural photochemistry. The constructionof the facility and its operation are described in more detailelsewhere (Paulsen et al., 2005).
Atmos. Chem. Phys., 6, 5279–5293, 2006 www.atmos-chem-phys.net/6/5279/2006/
M. R. Alfarra et al.: A mass spectrometric study of secondary organic aerosols 5281
2.2 Instrumentation
An Aerodyne aerosol mass spectrometer (AMS) was usedto provide on-line quantitative measurements of the chem-ical composition and mass size distributions of the non-refractory fraction of aerosol particles at a temporal reso-lution of two minutes. Detailed descriptions of the AMSmeasurement principles and various calibrations (Jayne etal., 2000; Jimenez et al., 2003b), its modes of operation(Jimenez et al., 2003b) and data processing and analysis (Al-lan et al., 2003a, 2004; Alfarra et al., 2004) are availablein recent publications. In brief, the instrument utilises anaerodynamic lens (Liu et al., 1995a, b; Zhang et al., 2002,2004) to produce a collimated particle beam that impacts on aporous tungsten surface heated typically to 550◦C under highvacuum (∼10−8 Torr), causing the non-refractory fractionof the particles to flash vaporise. The vapour plume is im-mediately ionised using a 70 eV electron impact (EI) ionisa-tion source, and a quadrupole mass spectrometer (QMA 410,Balzers, Liechtenstein) is used to analyse the resultant ionswith unit mass-to-charge (m/z) resolution. A beam widthprobe (BWP) was used during these experiments to infer nonsphericity of the particles through divergence of the particlebeam arising from increases in the lift forces on the particles.The BWP and its application have been described in detailby Huffman et al. (2005).
Total particle number concentration (diameter Dp>3 nm)was monitored with a condensation particle counter (CPC,TSI model 3025). A scanning mobility particle sizer (SMPS)consisting of a differential mobility analyser (DMA, TSImodel 3071) and a condensation particle counter (CPC, TSImodel 3022) was used to measure particle size distributionsfrom 7 to 316 nm. A volatility tandem differential mobilityanalyser (VTDMA) was used to measure the volatile frac-tion of size-selected particles as described in previous pub-lication (Kalberer et al., 2004; Paulsen et al., 2006). Thefollowing gas phase components were also measured: CO(AeroLaser AL5002), NO and NOx (ML 9841A and ThermoEnvironmental Instruments 42C retrofitted with a photolyticconverter), O3 (UV-photometer: Environics S300), the pre-cursor hydrocarbons and their oxidation products with a pro-ton transfer reaction – mass spectrometer (PTR-MS, Ioni-con). This paper primarily reports the AMS results, whilemost of the other measurements are discussed in separatepublications (Paulsen et al., 2005, 2006).
2.3 Experimental conditions
Three experiments were carried out in the reaction chamberusing each of the precursors, two of which were at “high”concentration and one was at “low” concentration. Table 1summarises the initial conditions for each experiment. The“high” concentration levels were chosen to provide good sig-nal statistics for the AMS, whereas the low concentration lev-els were chosen to be as close as possible to atmospherically
relevant concentrations, while taking into account instrumentdetection limits. The chamber was purged with purified airfor at least 24 h before each experiment. Primary gas compo-nents including precursor, nitrogen oxides, purified air andwater vapour were introduced into the chamber where theywere allowed to mix for approximately 45 min before thelights were turned on. Precursors were irradiated in the pres-ence of NOx and propene at nominally 50% relative humidityfor durations between 8 and 20 h. NOx were added primarilyto facilitate the basic photochemical cycle involving O3 (Se-infeld and Pandis, 1998; Griffin et al., 1999; Finlayson-Pittsand Pitts, 2000), while propene was used as a photochemicalinitiator to provide OH radicals at sufficient levels for the in-ception of the experiment (Odum et al., 1996; Forstner et al.,1997; Griffin et al., 1999; Kleindienst et al., 1999).
3 Overview of secondary organic aerosol (SOA) forma-tion
It is predicted from the traditional theory of SOA forma-tion that the non-volatile and semivolatile products from aphotochemical reaction of an organic precursor accumulatewith ongoing irradiation and when their gas phase satura-tion concentrations are exceeded, they begin to condense onpre-existing particles or, in the absence of seed aerosol par-ticles, form new particles by homogeneous nucleation. Theamount of a product that partitions into the particle phase isthe quantity in excess of its gas phase saturation concentra-tion (Odum et al., 1996). However, Pankow (1994a, b) sug-gested that, once organics begin to condense and an organiclayer forms on the particles, even products whose gas phaseconcentrations are below their saturation concentrations willpartition a portion of their mass into this condensed organicphase. Nucleation, condensation and subsequent adsorptionand absorption of oxidation products lead to particles thatare almost completely organic in composition. The quan-tity of aerosol produced in this case, estimated from the finalaerosol volume after accounting for wall losses, provides ameasure of the SOA formation potential in a clean environ-ment.
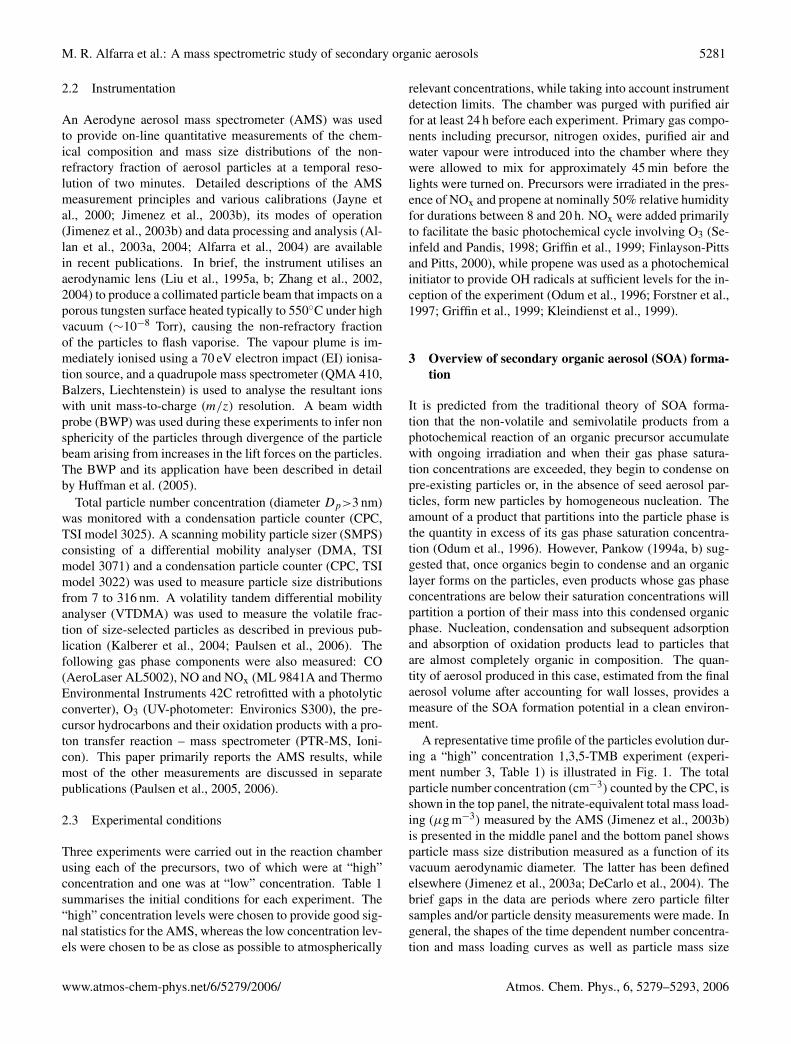
A representative time profile of the particles evolution dur-ing a “high” concentration 1,3,5-TMB experiment (experi-ment number 3, Table 1) is illustrated in Fig. 1. The totalparticle number concentration (cm−3) counted by the CPC, isshown in the top panel, the nitrate-equivalent total mass load-ing (µg m−3) measured by the AMS (Jimenez et al., 2003b)is presented in the middle panel and the bottom panel showsparticle mass size distribution measured as a function of itsvacuum aerodynamic diameter. The latter has been definedelsewhere (Jimenez et al., 2003a; DeCarlo et al., 2004). Thebrief gaps in the data are periods where zero particle filtersamples and/or particle density measurements were made. Ingeneral, the shapes of the time dependent number concentra-tion and mass loading curves as well as particle mass size
www.atmos-chem-phys.net/6/5279/2006/ Atmos. Chem. Phys., 6, 5279–5293, 2006
5282 M. R. Alfarra et al.: A mass spectrometric study of secondary organic aerosols
Table 1. Summary of conditions at the start of each experiment.
Experiment Precursor Concentration (ppbv) NO (ppbv) NO2 (ppbv) Propene (ppbv)
1 1,3,5-TMB 35 11 8 3002 1,3,5-TMB 620 150 150 3003 1,3,5-TMB 620 150 150 3004 α−Pinene 160 94 77 3005 α−Pinene 30 55 68 3006 α−Pinene 160 59 67 300
16 M. R. Alfarra et al.: A mass spectrometric study of secondary organic aerosols
Fig. 1. Time profile of the evolution of particles during a “high”concentration 1,3,5-TMB experiment (experiment number 3, Ta-ble 1), showing the total particle number concentration (p cm−3)counted by the CPC in the top panel, the total nitrate-equivalentmass loading (µg m−3) measured by the AMS in the middle paneland particle mass size distribution measured as a function of its vac-uum aerodynamic diameter in the bottom panel. Note that data isnot corrected for wall losses. The tail off in mass loading at the highsizes above the main mode is not due to large particles, but resultsfrom high particle loads slowing the normally near instantaneousvaporisation of particles.
20
15
10
5
0
1301109070503010
m/z
20
15
10
5
0Con
trib
utio
n to
Tot
al S
igna
l (%
)
20
15
10
5
0
1301109070503010
m/z
��������� ������
� � � �
� � � �
� � �
43
43
1518
1844
44
5355
67 69 9191
74 96109
123 136 139
A
B
C
D
E
F
43
43
27
2930
2915
1529 44
44
43
43
18
18
29
29
29
44
44
� � �
� � � �
� � � �
55
55
53
53
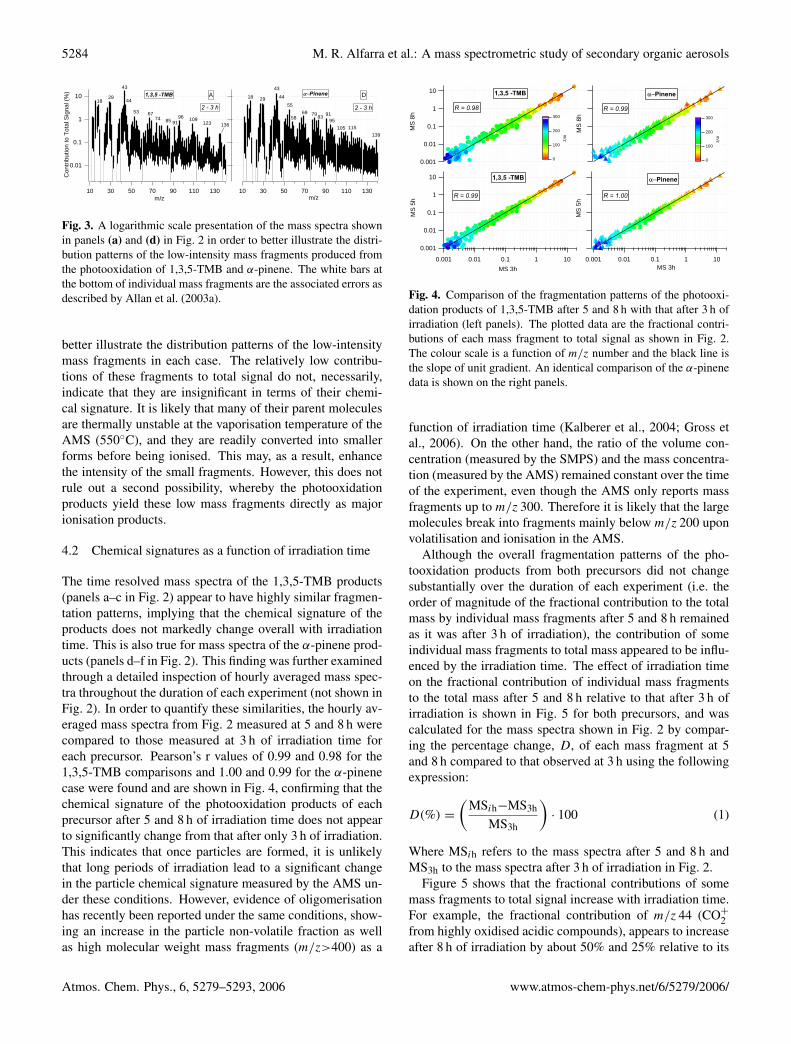
Fig. 2. Mass spectra of the photooxidation products of 1,3,5-TMBandα-pinene (experiments 3 and 4, respectively, Table 1) averagedfor one hour each after 3, 5 and 8 h of irradiation. All spectraare normalised to the sum total of all mass fragments, providinga quantitative fractional contribution of each mass fragment to thetotal measured signal. The white bars at the bottom of individualmass fragments are the associated errors as described by Allan etal. (2003a).
0.01
0.1
1
10
Con
trib
utio
n to
Tot
al S
igna
l (%
)
1301109070503010m/z
1301109070503010m/z
����� ��� ���� �
� � � �
A D
� � � �
43 43
444418
1829 29
5355
67 6974 85 91
917996 109136123
139
11595
83
105
58
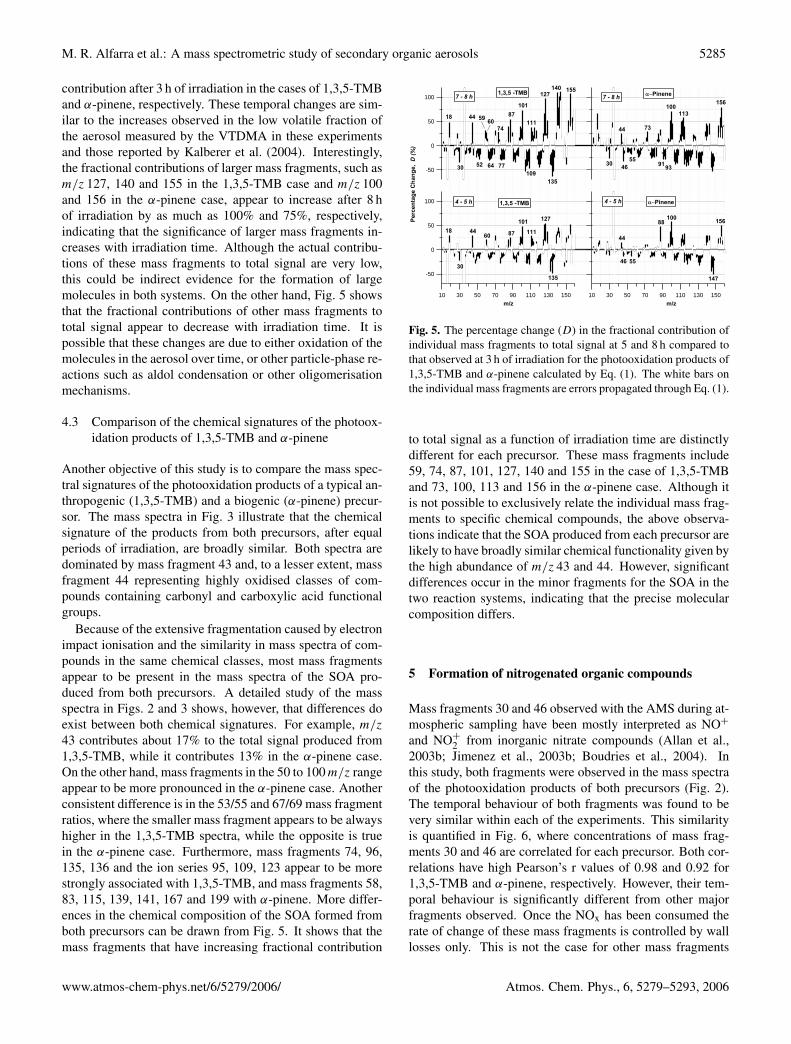
Fig. 3. A logarithmic scale presentation of the mass spectra shownin (a) and (d) in Fig. 2 in order to better illustrate the distribu-tion patterns of the low-intensity mass fragments produced fromthe photooxidation of 1,3,5-TMB andα-pinene. The white bars atthe bottom of individual mass fragments are the associated errors asdescribed by Allan et al. (2003a).
0.001
0.01
0.1
1
10
MS
5h
0.001 0.01 0.1 1 10
MS 3h
0.001
0.01
0.1
1
10
MS
8h
MS
5h
0.001 0.01 0.1 1 10MS 3h
MS
8h
� � ����
� � ���� � � ����
� � ����
����� ��� ���� �
300
200
100
0
m/z
300
200
100
0
m/z
����� ������� �
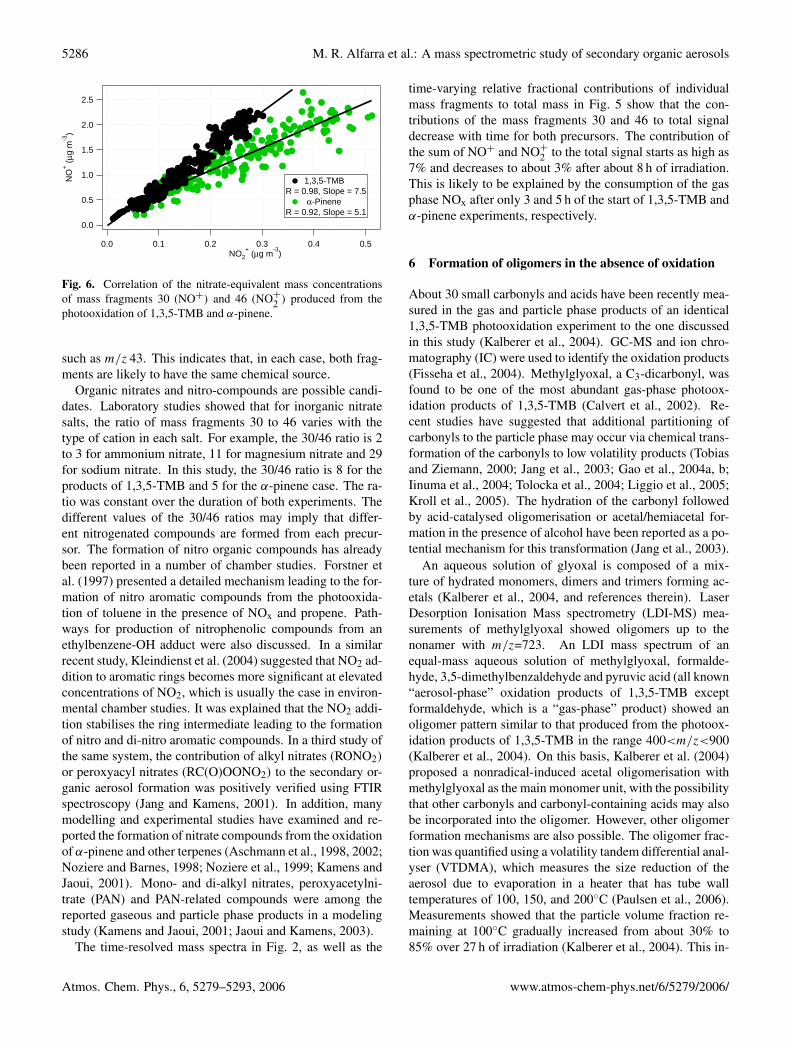
Fig. 4. Comparison of the fragmentation patterns of the photooxi-dation products of 1,3,5-TMB after 5 and 8 h with that after 3 h ofirradiation. The plotted data are the fractional contributions of eachmass fragment to total signal as shown in Fig. 2. The grey colourscale is a function ofm/z number and the black line is the slope ofunit gradient. An identical comparison of theα-pinene data is alsoshown.
100
50
0
-50
�������������������
�
1501301109070503010 ��
1501301109070503010 ��
100
50
0
-50
����� ���� ��������� � �
� �
��
��
��
��
��
��
��
��
��
��
��
���
���
���
���
���
������ ���
���
���
���
���
���
���
��
���
��
���� ��
��
���
��
��
��
��
���
���� ��
� �
� � �
����� ���� ��������
��
��
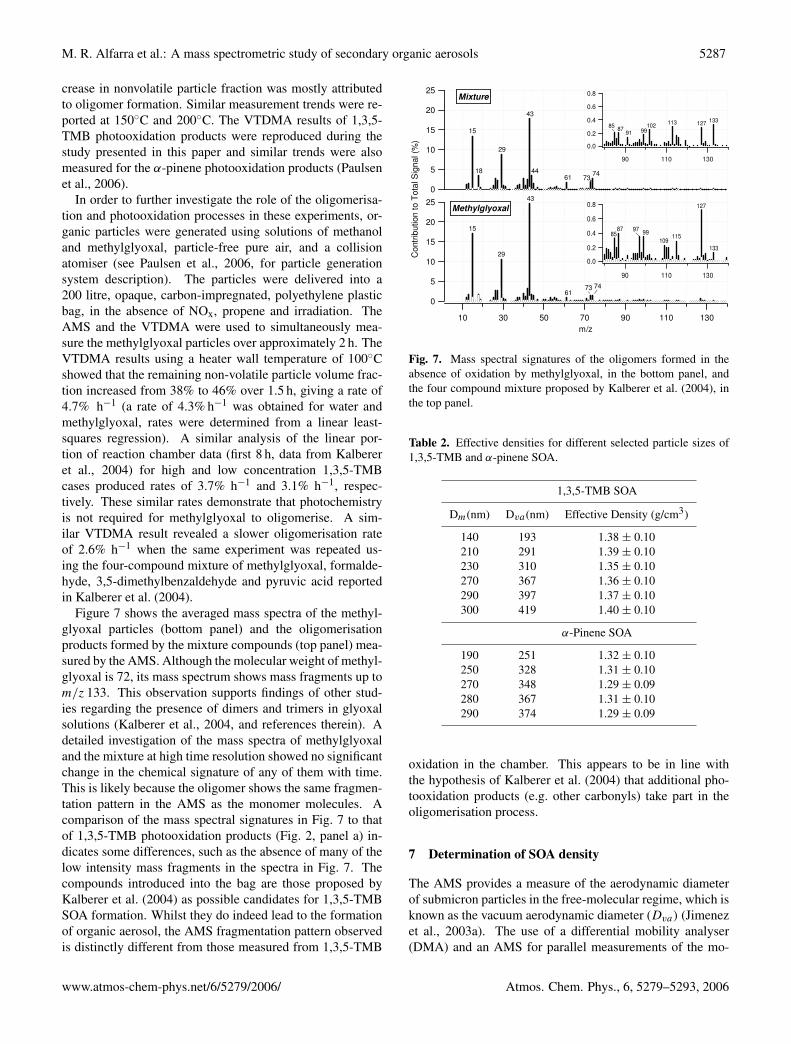
Fig. 5. The percentage change (D%) in the fractional contributionof individual mass fragments to total signal at 5 and 8 h compared tothat observed at 3 h of irradiation for the photooxidation products of1,3,5-TMB andα-pinene calculated by Eq. (1). The white bars onthe individual mass fragments are errors propagated through Eq. (1).
Atmos. Chem. Phys., 0000, 0001–17, 2006 www.atmos-chem-phys.org/acp/0000/0001/
Fig. 1. Time profile of the evolution of particles during a “high”concentration 1,3,5-TMB experiment (experiment number 3, Ta-ble 1), showing the total particle number concentration (cm−3)
counted by the CPC in the top panel, the total nitrate-equivalentmass loading (µg m−3) measured by the AMS in the middle paneland particle mass size distribution measured as a function of its vac-uum aerodynamic diameter in the bottom panel. Note that data isnot corrected for wall losses. The tail off in mass loading at the highsizes above the main mode is not due to large particles, but resultsfrom high particle loads slowing the normally near instantaneousvaporisation of particles.
distributions were similar for all experiments, though theirabsolute values depended on the organic precursor and itsinitial concentration.
Each experiment began with a nucleation event markedby the increasing number concentration of particles, whichthen grew by condensation and coagulation as reflected inthe increasing particle diameters. CPC data for the experi-ment in Fig. 1 show that particles grew to detectable sizes(>3 nm) about half an hour after the lights were turned onand their number concentration increased rapidly to peak atabout 35 000 cm−3 within another 40 min. During experi-ment number 3, the total mass loading of particles increasedwith ongoing particle formation and condensational growthand reached its maximum 3 h and 25 min after the start of ir-radiation, and then started to decrease gradually due to thedominance of particle wall losses. Aerosol mass concen-
trations can be corrected for wall losses based on the ob-served decay of the particle number concentration, when par-ticle formation has ceased to take place. This is particularlyimportant for particle and product yield studies, where thequantity of aerosol produced in a clean environment is esti-mated from the final aerosol volume. However, this is notthe focus of this paper and therefore, data were not correctedfor wall losses. The delay between particle detection by theCPC and the AMS is due to the difference in particle sizedetection limit of both instruments (3 nm for the CPC andabout 40 nm for the AMS). As a result the AMS could onlyprovide information on the particle growth and not nucle-ation, since the smallest particles that the AMS could analysehad about a thousand times more mass than the initial nuclei(Zhang et al., 2004). Gas phase measurements showed thatozone levels were below 1 ppb at the beginning of each ex-periment and increased slowly as NO was converted to NO2,and then increased rapidly and peaked at about 300 ppb asthe NO mixing ratio decreased to values below 1 ppb. Thegas phase data are discussed in more detail in separate publi-cations (Kalberer et al., 2004; Paulsen et al., 2005).
4 Chemical signatures
One of the main objectives of this paper is to investigate thechange of the chemical signature (also referred to as the massspectral signature) of the photooxidation products of bothprecursors as a function of irradiation time. This will be firstdiscussed for the products of each precursor followed by acomparison of their signatures at similar time intervals. Thetwo “high” concentration experiments for 1,3,5-TMB (exper-iments 2 and 3, Table 1) resulted in similar SOA concen-trations and reproducible mass spectra (R=1.00 for compar-ison of the averaged mass spectra for the two experiments).This was also true for the two “high” concentration exper-iments for α-pinene (experiments 4 and 6, Table 1), whichalso showed an R value of 1.00 for the averaged spectra. Onthe other hand, low signal to noise levels in the ‘low’ concen-tration 1,3,5-TMB and α-pinene cases (experiments 1 and5, respectively, Table 1) did not allow a useful comparisonwith the “high” concentration experiments. As a result, it isimportant to note that all spectra discussed in this paper for
Atmos. Chem. Phys., 6, 5279–5293, 2006 www.atmos-chem-phys.net/6/5279/2006/

M. R. Alfarra et al.: A mass spectrometric study of secondary organic aerosols 5283
the photooxidation products of 1,3,5-TMB and α-pinene arefrom the “high” concentration experiments 3 and 4, respec-tively, in Table 1. It is also worth noting that the reportedchemical signatures are for the growing (>40 nm), not nu-cleating, particles in each case. Figure 2 shows mass spectraof the aerosol-phase photooxidation products of 1,3,5-TMB(panels a–c) and α-pinene (panels d–f) averaged for one houreach after 3, 5 and 8 h of irradiation (for example, the spec-trum after 3 h is an average from the start of hour 2 to the startof hour 3). All spectra are normalised to the sum total of allmass fragments, providing a quantitative fractional contribu-tion of each mass fragment to the total measured signal.
4.1 Discussion of the chemical signatures of the photooxi-dation products of 1,3,5-TMB and α-pinene
The mass spectra of the photooxidation products of both1,3,5-TMB and α-pinene are characterised by a very intensemass fragment at m/z 43, contributing about 18 and 13%, re-spectively, to the total produced signal in each case. Thisfragment arises, typically, from either saturated hydrocar-bons in the form of (C3H+
7 ), or from oxidised, carbonyl-containing compounds (e.g. aldehydes and ketones) in theform of (CH3CO+), which is more likely to be the case inthis study. It was suspected that a possible reason for thedomination of mass fragment 43 in both mass spectra was theuse of propene in all experiments as a source of radicals. Thephotooxidation of propene is known to produce compoundslike acetaldehyde and acetic acid, which produce mass frag-ment 43 as one of their main fragments upon ionisation bya 70 eV EI source (McLafferty and Turecek, 1993). How-ever, further experiments were conducted in the absence ofpropene where m/z 43 remained the most dominant fragmentin the spectra.
Mass fragment 44 corresponds to the CO+
2 fragment andlaboratory experiments have shown that it arises, along withat least a similar amount of mass fragment 18 (H2O+), fromdecarboxylation of oxo- and di-carboxylic acids (Alfarra,2004), as well as highly oxidised compounds such as fulvicacid, which represents an example of humic-like substances.In many cases however, the mass fragment 18 also containslarge contributions from gas phase water and gaseous organicmolecules as well as from particulate water. To retrieve thetotal organic mass loading, the contribution of water result-ing from decarboxylation at m/z 18 is set equal to m/z 44based on laboratory results with pure compounds performedin argon, where the interferences to m/z 18 are eliminated(Aerodyne Research Inc., unpublished laboratory results).As a result, there is no independent information about themass spectral signature of the observed organic in these ex-periments at m/z 18. The two fragments together contributeup to at least 12 and 16% to the total signal that is pro-duced from the aerosol products of 1,3,5-TMB and α-pinene,respectively. The contributions of m/z 43 and 44 indicatethat the particles produced from the photooxidation of both
20
15
10
5
0
1301109070503010
m/z
20
15
10
5
0Con
trib
utio
n to
Tot
al S
igna
l (%
)
20
15
10
5
0
1301109070503010
m/z
��������� ������
� � � �
� � � �
� � �
43
43
1518
1844
44
5355
67 69 9191
74 96109
123 136 139
A
B
C
D
E
F
43
43
27
2930
2915
1529 44
44
43
43
18
18
29
29
29
44
44
� � �
� � � �
� � � �
55
55
53
53
Fig. 2. Mass spectra of the photooxidation products of 1,3,5-TMBand α-pinene (experiments 3 and 4, respectively, Table 1) averagedfor one hour each after 3, 5 and 8 h of irradiation. All spectraare normalised to the sum total of all mass fragments, providinga quantitative fractional contribution of each mass fragment to thetotal measured signal. The white bars at the bottom of individualmass fragments are the associated errors as described by Allan etal. (2003a).
precursors are highly oxidised in nature and are dominatedby carbonyl-containing and multifunctional carboxylic acidspecies. This is in agreement with previous reaction cham-ber studies, where highly oxidised chemical classes includ-ing di-, keto-, and hydroxy-keto- carboxylic acids in addi-tion to ketones, keto-aldehydes, hydroxy-keto-aldehydes andhydroxy-ketones have been reported, in different concentra-tions and distribution patterns, as photooxidation products ofaromatic and monoterpene compounds (Forstner et al., 1997;Glasius et al., 2000; Jang and Kamens, 2001; Larsen et al.,2001; Jaoui and Kamens, 2003; Kleindienst et al., 2004).
Mass fragments 15, 27 and 29 are signatures of the shortcarbon chains CH+
3 , C2H+
3 and C2H+
5 , respectively, whichmost likely form part of the carbon structure of the oxidisedcompounds discussed above. They contribute a total of about14 and 13% to the total produced signal from the products of1,3,5-TMB and α-pinene, respectively. In addition, m/z 29 islikely to have contributions from the HCO+ fragment arisingfrom carbonyl-containing compounds.
A large number of low-intensity fragments account for therest of the produced signal. These fragments typically con-tribute less than 3% each to the total produced signal fromeach precursor, but are clearly observable above the back-ground. Figure 3 displays the mass spectra shown in pan-els (a) and (d) in Fig. 2 on a logarithmic scale in order to
www.atmos-chem-phys.net/6/5279/2006/ Atmos. Chem. Phys., 6, 5279–5293, 2006
5284 M. R. Alfarra et al.: A mass spectrometric study of secondary organic aerosols
0.01
0.1
1
10
Con
trib
utio
n to
Tot
al S
igna
l (%
)
1301109070503010m/z
1301109070503010m/z
����� ��� ���� �
� � � �
A D
� � � �
43 43
444418
1829 29
5355
67 6974 85 91
917996 109136123
139
11595
83
105
58
Fig. 3. A logarithmic scale presentation of the mass spectra shownin panels (a) and (d) in Fig. 2 in order to better illustrate the distri-bution patterns of the low-intensity mass fragments produced fromthe photooxidation of 1,3,5-TMB and α-pinene. The white bars atthe bottom of individual mass fragments are the associated errors asdescribed by Allan et al. (2003a).
better illustrate the distribution patterns of the low-intensitymass fragments in each case. The relatively low contribu-tions of these fragments to total signal do not, necessarily,indicate that they are insignificant in terms of their chemi-cal signature. It is likely that many of their parent moleculesare thermally unstable at the vaporisation temperature of theAMS (550◦C), and they are readily converted into smallerforms before being ionised. This may, as a result, enhancethe intensity of the small fragments. However, this does notrule out a second possibility, whereby the photooxidationproducts yield these low mass fragments directly as majorionisation products.
4.2 Chemical signatures as a function of irradiation time
The time resolved mass spectra of the 1,3,5-TMB products(panels a–c in Fig. 2) appear to have highly similar fragmen-tation patterns, implying that the chemical signature of theproducts does not markedly change overall with irradiationtime. This is also true for mass spectra of the α-pinene prod-ucts (panels d–f in Fig. 2). This finding was further examinedthrough a detailed inspection of hourly averaged mass spec-tra throughout the duration of each experiment (not shown inFig. 2). In order to quantify these similarities, the hourly av-eraged mass spectra from Fig. 2 measured at 5 and 8 h werecompared to those measured at 3 h of irradiation time foreach precursor. Pearson’s r values of 0.99 and 0.98 for the1,3,5-TMB comparisons and 1.00 and 0.99 for the α-pinenecase were found and are shown in Fig. 4, confirming that thechemical signature of the photooxidation products of eachprecursor after 5 and 8 h of irradiation time does not appearto significantly change from that after only 3 h of irradiation.This indicates that once particles are formed, it is unlikelythat long periods of irradiation lead to a significant changein the particle chemical signature measured by the AMS un-der these conditions. However, evidence of oligomerisationhas recently been reported under the same conditions, show-ing an increase in the particle non-volatile fraction as wellas high molecular weight mass fragments (m/z>400) as a
0.001
0.01
0.1
1
10
MS
5h
0.001 0.01 0.1 1 10
MS 3h
0.001
0.01
0.1
1
10
MS
8h
MS
5h
0.001 0.01 0.1 1 10MS 3h
MS
8h
� � ����
� � ���� � � ����
� � ����
����� ��� ���� �
300
200
100
0
m/z
300
200
100
0
m/z
����� ������� �
Fig. 4. Comparison of the fragmentation patterns of the photooxi-dation products of 1,3,5-TMB after 5 and 8 h with that after 3 h ofirradiation (left panels). The plotted data are the fractional contri-butions of each mass fragment to total signal as shown in Fig. 2.The colour scale is a function of m/z number and the black line isthe slope of unit gradient. An identical comparison of the α-pinenedata is shown on the right panels.
function of irradiation time (Kalberer et al., 2004; Gross etal., 2006). On the other hand, the ratio of the volume con-centration (measured by the SMPS) and the mass concentra-tion (measured by the AMS) remained constant over the timeof the experiment, even though the AMS only reports massfragments up to m/z 300. Therefore it is likely that the largemolecules break into fragments mainly below m/z 200 uponvolatilisation and ionisation in the AMS.
Although the overall fragmentation patterns of the pho-tooxidation products from both precursors did not changesubstantially over the duration of each experiment (i.e. theorder of magnitude of the fractional contribution to the totalmass by individual mass fragments after 5 and 8 h remainedas it was after 3 h of irradiation), the contribution of someindividual mass fragments to total mass appeared to be influ-enced by the irradiation time. The effect of irradiation timeon the fractional contribution of individual mass fragmentsto the total mass after 5 and 8 h relative to that after 3 h ofirradiation is shown in Fig. 5 for both precursors, and wascalculated for the mass spectra shown in Fig. 2 by compar-ing the percentage change, D, of each mass fragment at 5and 8 h compared to that observed at 3 h using the followingexpression:
D(%) =
(MSih−MS3h
MS3h
)· 100 (1)
Where MSih refers to the mass spectra after 5 and 8 h andMS3h to the mass spectra after 3 h of irradiation in Fig. 2.
Figure 5 shows that the fractional contributions of somemass fragments to total signal increase with irradiation time.For example, the fractional contribution of m/z 44 (CO+
2from highly oxidised acidic compounds), appears to increaseafter 8 h of irradiation by about 50% and 25% relative to its
Atmos. Chem. Phys., 6, 5279–5293, 2006 www.atmos-chem-phys.net/6/5279/2006/
M. R. Alfarra et al.: A mass spectrometric study of secondary organic aerosols 5285
contribution after 3 h of irradiation in the cases of 1,3,5-TMBand α-pinene, respectively. These temporal changes are sim-ilar to the increases observed in the low volatile fraction ofthe aerosol measured by the VTDMA in these experimentsand those reported by Kalberer et al. (2004). Interestingly,the fractional contributions of larger mass fragments, such asm/z 127, 140 and 155 in the 1,3,5-TMB case and m/z 100and 156 in the α-pinene case, appear to increase after 8 hof irradiation by as much as 100% and 75%, respectively,indicating that the significance of larger mass fragments in-creases with irradiation time. Although the actual contribu-tions of these mass fragments to total signal are very low,this could be indirect evidence for the formation of largemolecules in both systems. On the other hand, Fig. 5 showsthat the fractional contributions of other mass fragments tototal signal appear to decrease with irradiation time. It ispossible that these changes are due to either oxidation of themolecules in the aerosol over time, or other particle-phase re-actions such as aldol condensation or other oligomerisationmechanisms.
4.3 Comparison of the chemical signatures of the photoox-idation products of 1,3,5-TMB and α-pinene
Another objective of this study is to compare the mass spec-tral signatures of the photooxidation products of a typical an-thropogenic (1,3,5-TMB) and a biogenic (α-pinene) precur-sor. The mass spectra in Fig. 3 illustrate that the chemicalsignature of the products from both precursors, after equalperiods of irradiation, are broadly similar. Both spectra aredominated by mass fragment 43 and, to a lesser extent, massfragment 44 representing highly oxidised classes of com-pounds containing carbonyl and carboxylic acid functionalgroups.
Because of the extensive fragmentation caused by electronimpact ionisation and the similarity in mass spectra of com-pounds in the same chemical classes, most mass fragmentsappear to be present in the mass spectra of the SOA pro-duced from both precursors. A detailed study of the massspectra in Figs. 2 and 3 shows, however, that differences doexist between both chemical signatures. For example, m/z
43 contributes about 17% to the total signal produced from1,3,5-TMB, while it contributes 13% in the α-pinene case.On the other hand, mass fragments in the 50 to 100 m/z rangeappear to be more pronounced in the α-pinene case. Anotherconsistent difference is in the 53/55 and 67/69 mass fragmentratios, where the smaller mass fragment appears to be alwayshigher in the 1,3,5-TMB spectra, while the opposite is truein the α-pinene case. Furthermore, mass fragments 74, 96,135, 136 and the ion series 95, 109, 123 appear to be morestrongly associated with 1,3,5-TMB, and mass fragments 58,83, 115, 139, 141, 167 and 199 with α-pinene. More differ-ences in the chemical composition of the SOA formed fromboth precursors can be drawn from Fig. 5. It shows that themass fragments that have increasing fractional contribution
100
50
0
-50
�������������������
�
1501301109070503010 ��
1501301109070503010 ��
100
50
0
-50
����� ���� ��������� � �
� �
��
��
��
��
��
��
��
��
��
��
��
���
���
���
���
���
������ ���
���
���
���
���
���
���
��
���
��
���� ��
��
���
��
��
��
��
���
���� ��
� �
� � �
����� ���� ��������
��
��
Fig. 5. The percentage change (D) in the fractional contribution ofindividual mass fragments to total signal at 5 and 8 h compared tothat observed at 3 h of irradiation for the photooxidation products of1,3,5-TMB and α-pinene calculated by Eq. (1). The white bars onthe individual mass fragments are errors propagated through Eq. (1).
to total signal as a function of irradiation time are distinctlydifferent for each precursor. These mass fragments include59, 74, 87, 101, 127, 140 and 155 in the case of 1,3,5-TMBand 73, 100, 113 and 156 in the α-pinene case. Although itis not possible to exclusively relate the individual mass frag-ments to specific chemical compounds, the above observa-tions indicate that the SOA produced from each precursor arelikely to have broadly similar chemical functionality given bythe high abundance of m/z 43 and 44. However, significantdifferences occur in the minor fragments for the SOA in thetwo reaction systems, indicating that the precise molecularcomposition differs.
5 Formation of nitrogenated organic compounds
Mass fragments 30 and 46 observed with the AMS during at-mospheric sampling have been mostly interpreted as NO+
and NO+
2 from inorganic nitrate compounds (Allan et al.,2003b; Jimenez et al., 2003b; Boudries et al., 2004). Inthis study, both fragments were observed in the mass spectraof the photooxidation products of both precursors (Fig. 2).The temporal behaviour of both fragments was found to bevery similar within each of the experiments. This similarityis quantified in Fig. 6, where concentrations of mass frag-ments 30 and 46 are correlated for each precursor. Both cor-relations have high Pearson’s r values of 0.98 and 0.92 for1,3,5-TMB and α-pinene, respectively. However, their tem-poral behaviour is significantly different from other majorfragments observed. Once the NOx has been consumed therate of change of these mass fragments is controlled by walllosses only. This is not the case for other mass fragments
www.atmos-chem-phys.net/6/5279/2006/ Atmos. Chem. Phys., 6, 5279–5293, 2006
5286 M. R. Alfarra et al.: A mass spectrometric study of secondary organic aerosols
2.5
2.0
1.5
1.0
0.5
0.0
NO
+ (
μg m
-3)
0.50.40.30.20.10.0NO2
+ (μg m
-3)
1,3,5-TMBR = 0.98, Slope = 7.5
α-PineneR = 0.92, Slope = 5.1
Fig. 6. Correlation of the nitrate-equivalent mass concentrationsof mass fragments 30 (NO+) and 46 (NO+
2 ) produced from thephotooxidation of 1,3,5-TMB and α-pinene.
such as m/z 43. This indicates that, in each case, both frag-ments are likely to have the same chemical source.
Organic nitrates and nitro-compounds are possible candi-dates. Laboratory studies showed that for inorganic nitratesalts, the ratio of mass fragments 30 to 46 varies with thetype of cation in each salt. For example, the 30/46 ratio is 2to 3 for ammonium nitrate, 11 for magnesium nitrate and 29for sodium nitrate. In this study, the 30/46 ratio is 8 for theproducts of 1,3,5-TMB and 5 for the α-pinene case. The ra-tio was constant over the duration of both experiments. Thedifferent values of the 30/46 ratios may imply that differ-ent nitrogenated compounds are formed from each precur-sor. The formation of nitro organic compounds has alreadybeen reported in a number of chamber studies. Forstner etal. (1997) presented a detailed mechanism leading to the for-mation of nitro aromatic compounds from the photooxida-tion of toluene in the presence of NOx and propene. Path-ways for production of nitrophenolic compounds from anethylbenzene-OH adduct were also discussed. In a similarrecent study, Kleindienst et al. (2004) suggested that NO2 ad-dition to aromatic rings becomes more significant at elevatedconcentrations of NO2, which is usually the case in environ-mental chamber studies. It was explained that the NO2 addi-tion stabilises the ring intermediate leading to the formationof nitro and di-nitro aromatic compounds. In a third study ofthe same system, the contribution of alkyl nitrates (RONO2)
or peroxyacyl nitrates (RC(O)OONO2) to the secondary or-ganic aerosol formation was positively verified using FTIRspectroscopy (Jang and Kamens, 2001). In addition, manymodelling and experimental studies have examined and re-ported the formation of nitrate compounds from the oxidationof α-pinene and other terpenes (Aschmann et al., 1998, 2002;Noziere and Barnes, 1998; Noziere et al., 1999; Kamens andJaoui, 2001). Mono- and di-alkyl nitrates, peroxyacetylni-trate (PAN) and PAN-related compounds were among thereported gaseous and particle phase products in a modelingstudy (Kamens and Jaoui, 2001; Jaoui and Kamens, 2003).
The time-resolved mass spectra in Fig. 2, as well as the
time-varying relative fractional contributions of individualmass fragments to total mass in Fig. 5 show that the con-tributions of the mass fragments 30 and 46 to total signaldecrease with time for both precursors. The contribution ofthe sum of NO+ and NO+
2 to the total signal starts as high as7% and decreases to about 3% after about 8 h of irradiation.This is likely to be explained by the consumption of the gasphase NOx after only 3 and 5 h of the start of 1,3,5-TMB andα-pinene experiments, respectively.
6 Formation of oligomers in the absence of oxidation
About 30 small carbonyls and acids have been recently mea-sured in the gas and particle phase products of an identical1,3,5-TMB photooxidation experiment to the one discussedin this study (Kalberer et al., 2004). GC-MS and ion chro-matography (IC) were used to identify the oxidation products(Fisseha et al., 2004). Methylglyoxal, a C3-dicarbonyl, wasfound to be one of the most abundant gas-phase photoox-idation products of 1,3,5-TMB (Calvert et al., 2002). Re-cent studies have suggested that additional partitioning ofcarbonyls to the particle phase may occur via chemical trans-formation of the carbonyls to low volatility products (Tobiasand Ziemann, 2000; Jang et al., 2003; Gao et al., 2004a, b;Iinuma et al., 2004; Tolocka et al., 2004; Liggio et al., 2005;Kroll et al., 2005). The hydration of the carbonyl followedby acid-catalysed oligomerisation or acetal/hemiacetal for-mation in the presence of alcohol have been reported as a po-tential mechanism for this transformation (Jang et al., 2003).
An aqueous solution of glyoxal is composed of a mix-ture of hydrated monomers, dimers and trimers forming ac-etals (Kalberer et al., 2004, and references therein). LaserDesorption Ionisation Mass spectrometry (LDI-MS) mea-surements of methylglyoxal showed oligomers up to thenonamer with m/z=723. An LDI mass spectrum of anequal-mass aqueous solution of methylglyoxal, formalde-hyde, 3,5-dimethylbenzaldehyde and pyruvic acid (all known“aerosol-phase” oxidation products of 1,3,5-TMB exceptformaldehyde, which is a “gas-phase” product) showed anoligomer pattern similar to that produced from the photoox-idation products of 1,3,5-TMB in the range 400<m/z<900(Kalberer et al., 2004). On this basis, Kalberer et al. (2004)proposed a nonradical-induced acetal oligomerisation withmethylglyoxal as the main monomer unit, with the possibilitythat other carbonyls and carbonyl-containing acids may alsobe incorporated into the oligomer. However, other oligomerformation mechanisms are also possible. The oligomer frac-tion was quantified using a volatility tandem differential anal-yser (VTDMA), which measures the size reduction of theaerosol due to evaporation in a heater that has tube walltemperatures of 100, 150, and 200◦C (Paulsen et al., 2006).Measurements showed that the particle volume fraction re-maining at 100◦C gradually increased from about 30% to85% over 27 h of irradiation (Kalberer et al., 2004). This in-
Atmos. Chem. Phys., 6, 5279–5293, 2006 www.atmos-chem-phys.net/6/5279/2006/
M. R. Alfarra et al.: A mass spectrometric study of secondary organic aerosols 5287
crease in nonvolatile particle fraction was mostly attributedto oligomer formation. Similar measurement trends were re-ported at 150◦C and 200◦C. The VTDMA results of 1,3,5-TMB photooxidation products were reproduced during thestudy presented in this paper and similar trends were alsomeasured for the α-pinene photooxidation products (Paulsenet al., 2006).
In order to further investigate the role of the oligomerisa-tion and photooxidation processes in these experiments, or-ganic particles were generated using solutions of methanoland methylglyoxal, particle-free pure air, and a collisionatomiser (see Paulsen et al., 2006, for particle generationsystem description). The particles were delivered into a200 litre, opaque, carbon-impregnated, polyethylene plasticbag, in the absence of NOx, propene and irradiation. TheAMS and the VTDMA were used to simultaneously mea-sure the methylglyoxal particles over approximately 2 h. TheVTDMA results using a heater wall temperature of 100◦Cshowed that the remaining non-volatile particle volume frac-tion increased from 38% to 46% over 1.5 h, giving a rate of4.7% h−1 (a rate of 4.3% h−1 was obtained for water andmethylglyoxal, rates were determined from a linear least-squares regression). A similar analysis of the linear por-tion of reaction chamber data (first 8 h, data from Kalbereret al., 2004) for high and low concentration 1,3,5-TMBcases produced rates of 3.7% h−1 and 3.1% h−1, respec-tively. These similar rates demonstrate that photochemistryis not required for methylglyoxal to oligomerise. A sim-ilar VTDMA result revealed a slower oligomerisation rateof 2.6% h−1 when the same experiment was repeated us-ing the four-compound mixture of methylglyoxal, formalde-hyde, 3,5-dimethylbenzaldehyde and pyruvic acid reportedin Kalberer et al. (2004).
Figure 7 shows the averaged mass spectra of the methyl-glyoxal particles (bottom panel) and the oligomerisationproducts formed by the mixture compounds (top panel) mea-sured by the AMS. Although the molecular weight of methyl-glyoxal is 72, its mass spectrum shows mass fragments up tom/z 133. This observation supports findings of other stud-ies regarding the presence of dimers and trimers in glyoxalsolutions (Kalberer et al., 2004, and references therein). Adetailed investigation of the mass spectra of methylglyoxaland the mixture at high time resolution showed no significantchange in the chemical signature of any of them with time.This is likely because the oligomer shows the same fragmen-tation pattern in the AMS as the monomer molecules. Acomparison of the mass spectral signatures in Fig. 7 to thatof 1,3,5-TMB photooxidation products (Fig. 2, panel a) in-dicates some differences, such as the absence of many of thelow intensity mass fragments in the spectra in Fig. 7. Thecompounds introduced into the bag are those proposed byKalberer et al. (2004) as possible candidates for 1,3,5-TMBSOA formation. Whilst they do indeed lead to the formationof organic aerosol, the AMS fragmentation pattern observedis distinctly different from those measured from 1,3,5-TMB
1
25
20
15
10
5
0
Contr
ibution t
o T
ota
l S
ignal (%
)
1301109070503010
m/z
25
20
15
10
5
0
15
15
18
29
29
43
43
4461 73
74
617473
Methylglyoxal
Mixture
0.8
0.6
0.4
0.2
0.0
13011090
8587 97
99
109115
127
133
0.8
0.6
0.4
0.2
0.0
13011090
8587
91 99102
113 127133
Fig. 7. Mass spectral signatures of the oligomers formed in theabsence of oxidation by methylglyoxal, in the bottom panel, andthe four compound mixture proposed by Kalberer et al. (2004), inthe top panel.
Table 2. Effective densities for different selected particle sizes of1,3,5-TMB and α-pinene SOA.
1,3,5-TMB SOA
Dm(nm) Dva(nm) Effective Density (g/cm3)
140 193 1.38 ± 0.10210 291 1.39 ± 0.10230 310 1.35 ± 0.10270 367 1.36 ± 0.10290 397 1.37 ± 0.10300 419 1.40 ± 0.10
α-Pinene SOA
190 251 1.32 ± 0.10250 328 1.31 ± 0.10270 348 1.29 ± 0.09280 367 1.31 ± 0.10290 374 1.29 ± 0.09
oxidation in the chamber. This appears to be in line withthe hypothesis of Kalberer et al. (2004) that additional pho-tooxidation products (e.g. other carbonyls) take part in theoligomerisation process.
7 Determination of SOA density
The AMS provides a measure of the aerodynamic diameterof submicron particles in the free-molecular regime, which isknown as the vacuum aerodynamic diameter (Dva) (Jimenezet al., 2003a). The use of a differential mobility analyser(DMA) and an AMS for parallel measurements of the mo-
www.atmos-chem-phys.net/6/5279/2006/ Atmos. Chem. Phys., 6, 5279–5293, 2006
5288 M. R. Alfarra et al.: A mass spectrometric study of secondary organic aerosols
20
10
0
100908070605040302010m/z
20
10
0
20
10
0
20
10
0
20
10
0
Con
trib
utio
n to
Tot
al S
igna
l (%
)
20
10
0
20
10
0
���������
������
���� ���
� �
�����
�����
�����
�
�
�
�
!
18
18
18
18
18
18
1815
15
15
15 27
27
27
29
29
43
43
43
43
43
43
44
44
44
44
44
44
44
43
55 57 69 71
55
55
55
55
55
53
57
29
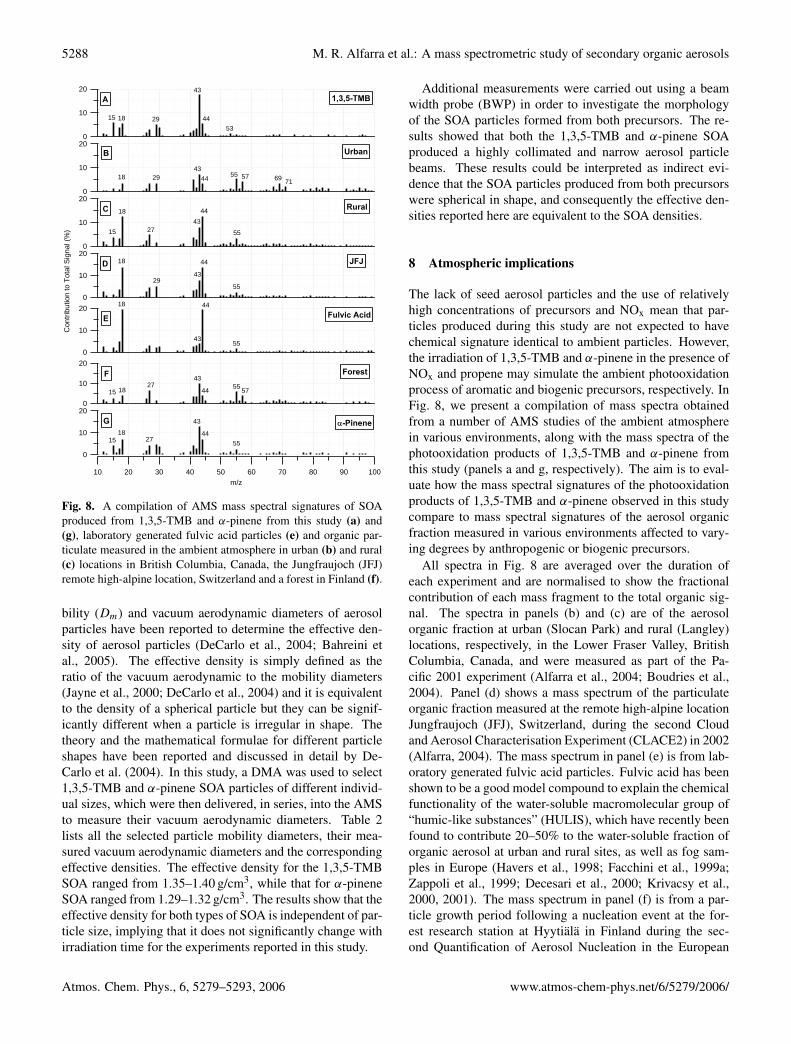
Fig. 8. A compilation of AMS mass spectral signatures of SOAproduced from 1,3,5-TMB and α-pinene from this study (a) and(g), laboratory generated fulvic acid particles (e) and organic par-ticulate measured in the ambient atmosphere in urban (b) and rural(c) locations in British Columbia, Canada, the Jungfraujoch (JFJ)remote high-alpine location, Switzerland and a forest in Finland (f).
bility (Dm) and vacuum aerodynamic diameters of aerosolparticles have been reported to determine the effective den-sity of aerosol particles (DeCarlo et al., 2004; Bahreini etal., 2005). The effective density is simply defined as theratio of the vacuum aerodynamic to the mobility diameters(Jayne et al., 2000; DeCarlo et al., 2004) and it is equivalentto the density of a spherical particle but they can be signif-icantly different when a particle is irregular in shape. Thetheory and the mathematical formulae for different particleshapes have been reported and discussed in detail by De-Carlo et al. (2004). In this study, a DMA was used to select1,3,5-TMB and α-pinene SOA particles of different individ-ual sizes, which were then delivered, in series, into the AMSto measure their vacuum aerodynamic diameters. Table 2lists all the selected particle mobility diameters, their mea-sured vacuum aerodynamic diameters and the correspondingeffective densities. The effective density for the 1,3,5-TMBSOA ranged from 1.35–1.40 g/cm3, while that for α-pineneSOA ranged from 1.29–1.32 g/cm3. The results show that theeffective density for both types of SOA is independent of par-ticle size, implying that it does not significantly change withirradiation time for the experiments reported in this study.
Additional measurements were carried out using a beamwidth probe (BWP) in order to investigate the morphologyof the SOA particles formed from both precursors. The re-sults showed that both the 1,3,5-TMB and α-pinene SOAproduced a highly collimated and narrow aerosol particlebeams. These results could be interpreted as indirect evi-dence that the SOA particles produced from both precursorswere spherical in shape, and consequently the effective den-sities reported here are equivalent to the SOA densities.
8 Atmospheric implications
The lack of seed aerosol particles and the use of relativelyhigh concentrations of precursors and NOx mean that par-ticles produced during this study are not expected to havechemical signature identical to ambient particles. However,the irradiation of 1,3,5-TMB and α-pinene in the presence ofNOx and propene may simulate the ambient photooxidationprocess of aromatic and biogenic precursors, respectively. InFig. 8, we present a compilation of mass spectra obtainedfrom a number of AMS studies of the ambient atmospherein various environments, along with the mass spectra of thephotooxidation products of 1,3,5-TMB and α-pinene fromthis study (panels a and g, respectively). The aim is to eval-uate how the mass spectral signatures of the photooxidationproducts of 1,3,5-TMB and α-pinene observed in this studycompare to mass spectral signatures of the aerosol organicfraction measured in various environments affected to vary-ing degrees by anthropogenic or biogenic precursors.
All spectra in Fig. 8 are averaged over the duration ofeach experiment and are normalised to show the fractionalcontribution of each mass fragment to the total organic sig-nal. The spectra in panels (b) and (c) are of the aerosolorganic fraction at urban (Slocan Park) and rural (Langley)locations, respectively, in the Lower Fraser Valley, BritishColumbia, Canada, and were measured as part of the Pa-cific 2001 experiment (Alfarra et al., 2004; Boudries et al.,2004). Panel (d) shows a mass spectrum of the particulateorganic fraction measured at the remote high-alpine locationJungfraujoch (JFJ), Switzerland, during the second Cloudand Aerosol Characterisation Experiment (CLACE2) in 2002(Alfarra, 2004). The mass spectrum in panel (e) is from lab-oratory generated fulvic acid particles. Fulvic acid has beenshown to be a good model compound to explain the chemicalfunctionality of the water-soluble macromolecular group of“humic-like substances” (HULIS), which have recently beenfound to contribute 20–50% to the water-soluble fraction oforganic aerosol at urban and rural sites, as well as fog sam-ples in Europe (Havers et al., 1998; Facchini et al., 1999a;Zappoli et al., 1999; Decesari et al., 2000; Krivacsy et al.,2000, 2001). The mass spectrum in panel (f) is from a par-ticle growth period following a nucleation event at the for-est research station at Hyytiala in Finland during the sec-ond Quantification of Aerosol Nucleation in the European
Atmos. Chem. Phys., 6, 5279–5293, 2006 www.atmos-chem-phys.net/6/5279/2006/
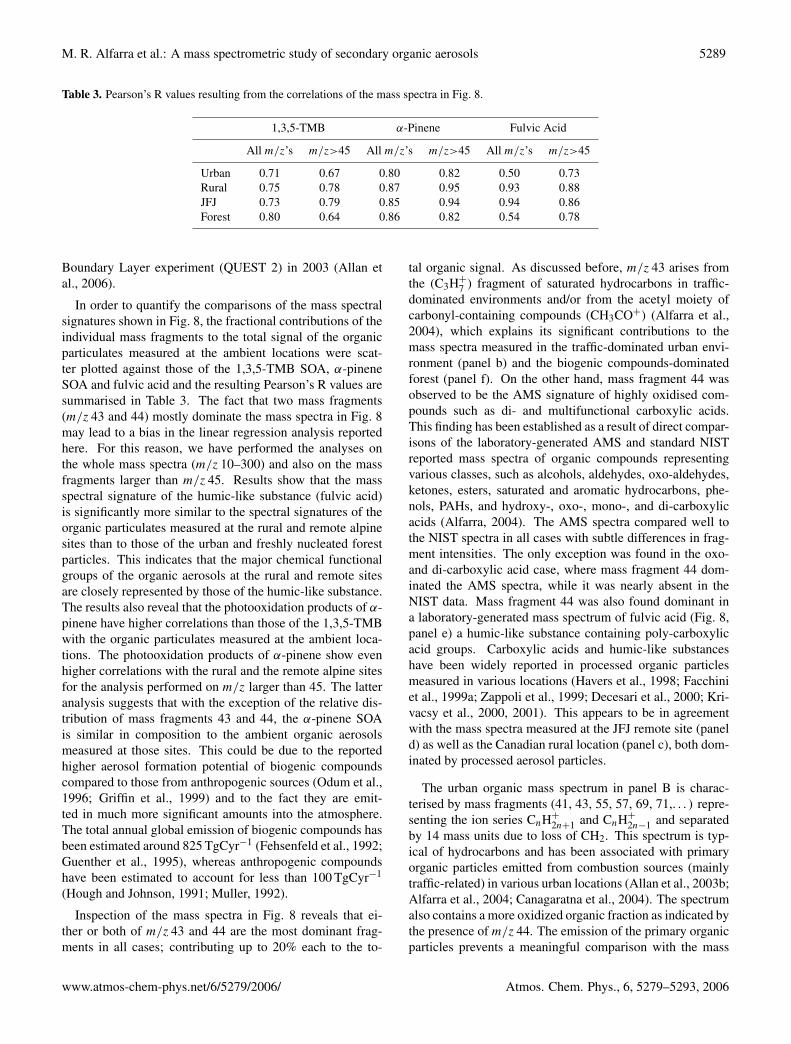
M. R. Alfarra et al.: A mass spectrometric study of secondary organic aerosols 5289
Table 3. Pearson’s R values resulting from the correlations of the mass spectra in Fig. 8.
1,3,5-TMB α-Pinene Fulvic Acid
All m/z’s m/z>45 All m/z’s m/z>45 All m/z’s m/z>45
Urban 0.71 0.67 0.80 0.82 0.50 0.73Rural 0.75 0.78 0.87 0.95 0.93 0.88JFJ 0.73 0.79 0.85 0.94 0.94 0.86Forest 0.80 0.64 0.86 0.82 0.54 0.78
Boundary Layer experiment (QUEST 2) in 2003 (Allan etal., 2006).
In order to quantify the comparisons of the mass spectralsignatures shown in Fig. 8, the fractional contributions of theindividual mass fragments to the total signal of the organicparticulates measured at the ambient locations were scat-ter plotted against those of the 1,3,5-TMB SOA, α-pineneSOA and fulvic acid and the resulting Pearson’s R values aresummarised in Table 3. The fact that two mass fragments(m/z 43 and 44) mostly dominate the mass spectra in Fig. 8may lead to a bias in the linear regression analysis reportedhere. For this reason, we have performed the analyses onthe whole mass spectra (m/z 10–300) and also on the massfragments larger than m/z 45. Results show that the massspectral signature of the humic-like substance (fulvic acid)is significantly more similar to the spectral signatures of theorganic particulates measured at the rural and remote alpinesites than to those of the urban and freshly nucleated forestparticles. This indicates that the major chemical functionalgroups of the organic aerosols at the rural and remote sitesare closely represented by those of the humic-like substance.The results also reveal that the photooxidation products of α-pinene have higher correlations than those of the 1,3,5-TMBwith the organic particulates measured at the ambient loca-tions. The photooxidation products of α-pinene show evenhigher correlations with the rural and the remote alpine sitesfor the analysis performed on m/z larger than 45. The latteranalysis suggests that with the exception of the relative dis-tribution of mass fragments 43 and 44, the α-pinene SOAis similar in composition to the ambient organic aerosolsmeasured at those sites. This could be due to the reportedhigher aerosol formation potential of biogenic compoundscompared to those from anthropogenic sources (Odum et al.,1996; Griffin et al., 1999) and to the fact they are emit-ted in much more significant amounts into the atmosphere.The total annual global emission of biogenic compounds hasbeen estimated around 825 TgCyr−1 (Fehsenfeld et al., 1992;Guenther et al., 1995), whereas anthropogenic compoundshave been estimated to account for less than 100 TgCyr−1
(Hough and Johnson, 1991; Muller, 1992).
Inspection of the mass spectra in Fig. 8 reveals that ei-ther or both of m/z 43 and 44 are the most dominant frag-ments in all cases; contributing up to 20% each to the to-
tal organic signal. As discussed before, m/z 43 arises fromthe (C3H+
7 ) fragment of saturated hydrocarbons in traffic-dominated environments and/or from the acetyl moiety ofcarbonyl-containing compounds (CH3CO+) (Alfarra et al.,2004), which explains its significant contributions to themass spectra measured in the traffic-dominated urban envi-ronment (panel b) and the biogenic compounds-dominatedforest (panel f). On the other hand, mass fragment 44 wasobserved to be the AMS signature of highly oxidised com-pounds such as di- and multifunctional carboxylic acids.This finding has been established as a result of direct compar-isons of the laboratory-generated AMS and standard NISTreported mass spectra of organic compounds representingvarious classes, such as alcohols, aldehydes, oxo-aldehydes,ketones, esters, saturated and aromatic hydrocarbons, phe-nols, PAHs, and hydroxy-, oxo-, mono-, and di-carboxylicacids (Alfarra, 2004). The AMS spectra compared well tothe NIST spectra in all cases with subtle differences in frag-ment intensities. The only exception was found in the oxo-and di-carboxylic acid case, where mass fragment 44 dom-inated the AMS spectra, while it was nearly absent in theNIST data. Mass fragment 44 was also found dominant ina laboratory-generated mass spectrum of fulvic acid (Fig. 8,panel e) a humic-like substance containing poly-carboxylicacid groups. Carboxylic acids and humic-like substanceshave been widely reported in processed organic particlesmeasured in various locations (Havers et al., 1998; Facchiniet al., 1999a; Zappoli et al., 1999; Decesari et al., 2000; Kri-vacsy et al., 2000, 2001). This appears to be in agreementwith the mass spectra measured at the JFJ remote site (paneld) as well as the Canadian rural location (panel c), both dom-inated by processed aerosol particles.
The urban organic mass spectrum in panel B is charac-terised by mass fragments (41, 43, 55, 57, 69, 71,. . . ) repre-senting the ion series CnH+
2n+1 and CnH+
2n−1 and separatedby 14 mass units due to loss of CH2. This spectrum is typ-ical of hydrocarbons and has been associated with primaryorganic particles emitted from combustion sources (mainlytraffic-related) in various urban locations (Allan et al., 2003b;Alfarra et al., 2004; Canagaratna et al., 2004). The spectrumalso contains a more oxidized organic fraction as indicated bythe presence of m/z 44. The emission of the primary organicparticles prevents a meaningful comparison with the mass
www.atmos-chem-phys.net/6/5279/2006/ Atmos. Chem. Phys., 6, 5279–5293, 2006
5290 M. R. Alfarra et al.: A mass spectrometric study of secondary organic aerosols
spectral signature of the photooxidation products of both pre-cursors in the smog chamber.
The photooxidation products of α-pinene and 1,3,5-TMBappear to have mass spectral signatures (panels g and a) moresimilar to that of the particle growth following a nucleationevent measured in a location dominated by biogenic emis-sions (panel f). In all of the three spectra (a, f and g), thecontribution of m/z 43 to the total organic signal is higherthan that of m/z 44, implying that the organic aerosols mea-sured in these three systems have more carbonyl-containingcompounds (e.g. aldehydes and ketones) than di- and multi-functional carboxylic acids. On the other hand, m/z 44 ap-pears to be more dominant in the organic particulates mea-sured at the rural and the remote alpine locations (panelsc and d, respectively) compared to those measured at thesmog chamber. This suggests that neither the α-pinene northe 1,3,5-TMB experimental results reproduce the right rel-ative product distribution between carbonyl-containing andmultifunctional carboxylic acid species measured at ambi-ent locations influenced by continental aged organic aerosol.These results may well imply that the aerosols produced inthe smog chamber represent a “young” SOA that is less agedthan the organic aerosols measured at some of ambient loca-tions described here (the contribution of m/z 44 to the totalorganic signal continues to increase as a function of irradi-ation time in the chamber). These results also indicate thatfurther chemical processing takes place in the aerosol afterthe initial SOA formation. Other reasons for the differencesmay be that the photochemical conditions in the chamber,including the VOC/NOx ratio are different from those in theatmosphere; or that the complexity of the precursor pool inthe atmosphere gives rise to a change in the product distri-bution in ambient aerosols compared to the chamber. Morework is clearly needed to understand this issue.
Acknowledgements. The AMS was purchased through Natu-ral Environmental Research Council (NERC) research grantGR3/12499 and maintained through the NERC-National Centre forAtmospheric Science (NCAS) University Facility for AtmosphericMeasurement (UFAM). Further support was provided by NERCresearch grant NER/A/S/2003/00541. The PSI chamber facilitywas supported by the EC project EUROCHAMP (Integration ofEuropean Simulation Chambers for Investigating AtmosphericProcesses) and the Swiss National Science Foundation. Theauthors would like to thank J. L. Jimenez for useful comments anddiscussions.
Edited by: S. Martin
References
Alfarra, M. R.: Insights into atmospheric organic aerosols usingan aerosol mass spectrometer, Thesis, University of ManchesterInstitute of Science and Technology (UMIST), UK, 2004.
Alfarra, M. R., Coe, H., Allan, J. D., Bower, K. N., Boudries, H.,Canagaratna, M. R., Jimenez, J. L., Jayne, J. T., Garforth, A.,Li, S.-M., and Worsnop, D. R.: Characterization of urban andrural organic particulate in the Lower Fraser Valley using twoAerodyne aerosol mass spectrometers, Atmos. Environ., 38(34),5745–5758, 2004.
Allan, J. D., Alfarra, M. R., Bower, K. N., Coe, H., Jayne, J. T.,Worsnop, D. R., Aalto, P. P., Kulmala, M., Hyotylainen, T., Cav-alli, F., and Laaksonen, A.: Size and composition measurementsof background aerosol and new particle growth in a Finnish forestduring QUEST 2 using an Aerodyne Aerosol Mass Spectrome-ter, Atmos. Chem. Phys., 6, 315–327, 2006,http://www.atmos-chem-phys.net/6/315/2006/.
Allan, J. D., Alfarra, M. R., Bower, K. N., Williams, P. I., Gal-lagher, M. W., Jimenez, J. L., McDonald, A. G., Nemitz, E.,Canagaratna, M. R., Jayne, J. T., Coe, H., and Worsnop, D.R.: Quantitative sampling using an Aerodyne aerosol mass spec-trometer – 2. Measurements of fine particulate chemical com-position in two U.K. cities, J. Geophys. Res.-Atmos., 108(D3),4091, doi:10.1029/2002JD002359, 2003b.
Allan, J. D., Delia, A. E., Coe, H., Bower, K. N., Alfarra, M. R.,Jimenez, J. L., Middlebrook, A. M., Drewnick, F., Onasch, T. B.,and Canagaratna, M. R.: A generalised method for the extractionof chemically resolved mass spectra from Aerodyne aerosol massspectrometer data, J. Aerosol Sci., 35(7), 909–922, 2004.
Allan, J. D., Jimenez, J. L., Williams, P. I., Alfarra, M. R., Bower,K. N., Jayne, J. T., Coe, H., and Worsnop, D. R.: Quantita-tive sampling using an Aerodyne aerosol mass spectrometer –1. Techniques of data interpretation and error analysis, J. Geo-phys. Res.-Atmos., 108(D3), 4090, doi:10.1029/2002JD002359,2003a.
Aschmann, S. M., Atkinson, R., and Arey, J.: Products of reactionof OH radicals with α-pinene, J. Geophys. Res., 107(D14), 4191,doi:10.1029/2002JD002358, 2002.
Aschmann, S. M., Reissell, A., Atkinson, R., and Arey, J.: Prod-ucts of the gas phase reactions of the OH radical with alpha- andbeta-pinene in the presence of NO, J. Geophys. Res., 103(D19),25 553, doi:10.1029/98JD01676, 1998.
Bahreini, R., Keywood, M. D., Ng, N. L., Varutbangkul, V., Gao, S.,Flagan, R. C., Seinfeld, J. H., Worsnop, D. R., and Jimenez, J. L.:Measurements of secondary organic aerosol from oxidation ofcycloalkenes, Terpenes, and m-xylene using an aerodyne aerosolmass spectrometer, Environ. Sci. Technol., 39(15), 5674–5688,2005.
Baltensperger, U., Kalberer, M., Dommen, J., Paulsen, D., Alfarra,M. R., Coe, H., Fisseha, R., Gascho, A., Gysel, M., Nyeki, S.,Sax, M., Steinbacher, M., Prevot, A. S. H., Sjogren, S., Wein-gartner, E., and Zenobi, R.: Secondary organic aerosols fromanthropogenic and biogenic precursors, Faraday Discuss., 130,265–278, 2005.
Boudries, H., Canagaratna, M. R., Jayne, J. T., Alfarra, M. R., Al-lan, J. D., Bower, K. N., Coe, H., Pryor, S. C., Jimenez, J. L.,Brook, J. R., Li, S., and Worsnop, D. R.: Chemical and PhysicalProcesses Controlling the Distribution of Aerosol in the LowerFraser Valley, Canada, during the PACIFIC 2001 Filed Cam-
Atmos. Chem. Phys., 6, 5279–5293, 2006 www.atmos-chem-phys.net/6/5279/2006/
M. R. Alfarra et al.: A mass spectrometric study of secondary organic aerosols 5291
paign, Atmos. Environ., 38(34), 5759–5774, 2004.Calvert, J. G., Atkinson, R., Becker, K. H., Kamens, R. M., Se-
infeld, J. H., Wallington, T. H., and Yarwood, G.: The Mecha-nisms of Atmospheric Oxidation of the Aromatic Hydrocarbons,Oxford University Press, 2002.
Canagaratna, M. R., Jayne, J. T., Ghertner, D. A., Herndon, S., Shi,Q., Jimenez, J. L., Silva, P. J., Williams, P., Lanni, T., Drewnick,F., Demerjian, K. L., Kolb, C. E., and Worsnop, D. R.: Chasestudies of particulate emissions from in-use New York city vehi-cles, Aerosol Sci. Technol., 38, 555–573, 2004.
Charlson, R. J., Schwartz, S. E., Hales, J. M., Cess, R. D., Coakley,J. A., Hansen, J. E., and Hofmann, D. J.: Climate forcing byanthropogenic aerosols, Sci., 255(5043), 423–430, 1992.
Cocker, D. R., Mader, B. T., Kalberer, M., Flagan, R. C., and Sein-feld, J. H.: The effect of water on gas-particle partitioning of sec-ondary organic aerosol: II. m-xylene and 1,3,5-trimethylbenzenephotooxidation systems, Atmos. Environ., 35, 6073–6085, 2001.
Cruz, C. N. and Pandis, S. N.: A study of the ability of pure sec-ondary organic aerosol to act as cloud condensation nuclei, At-mos. Environ., 31(15), 2205–2214, 1997.
DeCarlo, P., Slowik, J. G., Worsnop, D. R., Davidovits, P., andJimenez, J. L.: Particle morphology and density characterizationby combined mobility and aerodynamic diameter measurements.Part 1: Theory., Aerosol Sci. Technol., 38, 1185–1205, 2004.
Decesari, S., Facchini, M. C., Fuzzi, S., and Tagliavini, E.: Char-acterization of water-soluble organic compounds in atmosphericaerosol: A new approach, J. Geophys. Res.-Atmos., 105(D1),1481–1489, 2000.
Dockery, D. W., Pope, C. A., Xu, X. P., Spengler, J. D., Ware, J.H., Fay, M. E., Ferris, B. G., and Speizer, F. E.: An associationbetween air-pollution and mortality in 6 United States cities, NewEngland Journal of Medicine, 329(24), 1753–1759, 1993.
Facchini, M. C., Fuzzi, S., Zappoli, S., Andracchio, A., Gelencser,A., Kiss, G., Krivacsy, Z., Meszaros, E., Hansson, H.-C., Als-berg, T., and Zebuhr, Y.: Partitioning of the organic aerosol com-ponent between fog droplets and interstitial air, J. Geophys. Res.,104, 26 821-26 832, 1999a.
Facchini, M. C., Mircea, M., Fuzzi, S., and Charlson, R. J.: Cloudalbedo enhancement by surface-active organic solutes in growingdroplets, Nature, 401(6750), 257–259, 1999b.
Fehsenfeld, F., Calvert, J., Fall, R., Goldan, P., Guenther, A. B.,Hewitt, C. N., Lamb, B., Liu, S., Trainer, M., Westberg, H.,and Zimmerman, P.: Emissions of volatile organic compoundsfrom vegetation and the implications for atmospheric chemistry,Global Biogeochem. Cycles, 6, 389–430, 1992.
Finlayson-Pitts, B. J. and Pitts, J. N.: Chemistry of the Upperand Lower Atmosphere: Theory, Experiments and Applications,Academic Press, San Diego, Calif., London, 2000.
Fisseha, R., Dommen, J., Sax, M., Paulsen, D., Kalberer, M., Mau-rer, R., Hofler, F., and Baltensperger, U.: Identification of organicacids in secondary organic aerosol from chamber experiments,Anal. Chem., 76(22), 6535–6540, 2004.
Forstner, H. J. L., Flagan, R. C., and Seinfeld, J. H.: Secondary or-ganic aerosol from the photoxidation of aromatic hydrocarbons:molecular composition, Environ. Sci. Technol., 31, 1345–1358,1997.
Gao, S., Keywood, M., Ng, N. L., Surratt, J., Varutbangkul, V.,Bahreini, R., Flagan, R. C., and Seinfeld, J. H.: Low-molecularweight and oligomeric components in secondary organic aerosol
from the ozonolysis of cycloalkenes and alpha-pinene, J. Phys.Chem., 108, 10 147–10 164, 2004a.
Gao, S., Ng, N. L., Keywood, M., Varutbangkul, V., Bahreini, R.,Nenes, A., He, J., Yoo, K. Y., Beauchamp, J. L., Hodyss, R.P., Flagan, R. C., and Seinfeld, J. H.: Particle phase acidity andoligomer formation in secondary organic aerosol, Environ. Sci.Technol., 38, 6582–6589, 2004b.
Glasius, M., Lahaniati, M., Calogirou, A., Bella, D. D., Jensen, N.R., Hjorth, J., Kotzias, D., and Larsen, B. R.: Carboxylic acidsin secondary aerosol from oxidation of cyclic monoterpenes byozone, Environ. Sci. Technol., 34, 1001–1010, 2000.
Griffin, R. J., Cocker, D. R., Flagan, R. C., and Seinfeld, J. H.:Organic aerosol formation from the oxidation of biogenic hydro-carbons, J. Geophys. Res., 104(D3), 3555–3567, 1999.
Griffin, R. J., Dabdub, D., and Seinfeld, J. H.: Secondary organicaerosol, 1. Atmospheric chemical mechanism for productionof molecular constituents, J. Geophys. Res., 107(D17), 4332,doi:10.1029/2001JD000541, 2002.
Gross, D. S., Galli, M. E., Kalberer, M., Prevot, A. S. H., Dom-men, J., Alfarra, M. R., Duplissy, J., Gaeggeler, K., Gascho,A., Metzger, A., and Baltensperger, U.: Real time measure-ment of oligomeric species in secondary organic aerosol withthe aerosol time-of-flight mass spectrometer, Anal. Chem., 78(7),2130–2137, 2006.
Guenther, A., Hewitt, C. N., Erickson, D., Fall, R., Geron, C.,Graedel, T., Harley, P., Klinger, L., Lerdau, M., McKay, W. A.,Pierce, T., Scholes, B., Steinbrecher, R., Tallamraju, R., Taylor,J., and Zimmerman, P.: A global model of natural volatile or-ganic compound emissions, J. Geophys. Res., 100, 8873–8892,1995.
Havers, N., Burba, P., Lambert, J., and Klockow, D.: Spectroscopiccharacterisation of humic-like substances in airborne particulatematter, J. Atmos. Chem., 29, 45–54, 1998.
Hoffmann, T., Odum, J. R., Bowman, F., Collins, D., Klowckow,D., Flagan, R. C., and H., S. J.: Formation of organic aerosolsfrom the oxidation of biogenic hydrocarbons, J. Atmos. Chem.,26, 189–222, 1997.
Hough, A. M. and Johnson, C. E.: Modelling the role of nitrogenoxides, hydrocarbons and carbon monoxide in the global forma-tion of tropospheric oxidants, Atmos. Environ., 25A, 1819–1835,1991.
Huffman, J. A., Jayne, J. T., Drewnick, F., Aiken, A. C., Onasch, T.,Worsnop, D. R., and Jimenez, J. L.: Design, modeling, optimiza-tion, and experimental tests of a particle beam width probe forthe Aerodyne aerosol mass spectrometer, Aerosol Sci. Technol.,39(12), 1143–1163, 2005.
Iinuma, Y., Boge, O., Gnauk, T., and Herrmann, H.: Aerosol-chamber study of the α-pinene/O3 reaction: influence of particleacidity on aerosol yields and products, Atmos. Environ., 38(5),761–773, 2004.
Jang, M. and Kamens, R. M.: Characterization of secondary aerosolfrom the photooxidation of toluene in the presence of NOx and1-propene, Environ. Sci. Technol., 35, 3626–3639, 2001.
Jang, M. S., Carroll, B., Chandramouli, B., and Kamens, R. M.:Particle growth by acid-catalyzed heterogeneous reactions of or-ganic carbonyls on preexisting aerosols, Environ. Sci. Technol.,37(17), 3828–3837, 2003.
Jaoui, M. and Kamens, R. M.: Gaseous and particulate oxidationproducts analysis of a mixture of α-pinene+β-pinene/O3/air in
www.atmos-chem-phys.net/6/5279/2006/ Atmos. Chem. Phys., 6, 5279–5293, 2006
5292 M. R. Alfarra et al.: A mass spectrometric study of secondary organic aerosols
the absence of light and α-pinene+β-pinene/NOx/air in the pres-ence of natural sunlight, J. Atmos. Chem., 44, 259–297, 2003.
Jayne, J. T., Leard, D. C., Zhang, X. F., Davidovits, P., Smith, K.A., Kolb, C. E., and Worsnop, D. R.: Development of an aerosolmass spectrometer for size and composition analysis of submi-cron particles, Aerosol Sci. Technol., 33(1–2), 49–70, 2000.
Jimenez, J. L., Bahreini, R., Cocker, D. R., Zhuang, H., Varut-bangkul, V., Flagan, R. C., Seinfeld, J. H., O’Dowd, C. D.,and Hoffmann, T.: New particle formation from photooxidationof diiodomethane (CH2I2), J. Geophys. Res.-Atmos., 108(D10),4318, doi:10.1029/2005JD002452, 2003a.
Jimenez, J. L., Jayne, J. T., Shi, Q., Kolb, C. E., Worsnop, D. R.,Yourshaw, I., Seinfeld, J. H., Flagan, R. C., Zhang, X., Smith, K.A., Morris, J. W., and Davidovits, P.: Ambient aerosol samplingusing the Aerodyne aerosol mass spectrometer, J. Geophys. Res.-Atmos., 108(D7), 8425, doi:10.1029/2001JD001213, 2003b.
Kalberer, M., Paulsen, D., Sax, M., Steinbacher, M., Dommen, J.,Prevot, A. S. H., Fisseha, R., Weingartner, E., Frankevich, V.,Zenobi, R., and Baltensperger, U.: Identification of polymersas major components of atmospheric organic aerosols, Science,303, 1659–1662, 2004.
Kamens, R., Jang, M., Chien, C., and Leach, K.: Aerosol forma-tion from the reaction of α-pinene and ozone using a gas-phasekinetics-aerosol partitioning model, Environ. Sci. Technol., 33,1430–1438, 1999.
Kamens, R. M. and Jaoui, M.: Modeling aerosol formaiton from α-pinene+NOx in the presence of natural sunlight using gas-phasekinetics and gas-particle partitioning theory, Environ. Sci. Tech-nol., 35, 1394–1405, 2001.
Kleindienst, T. E., Conver, T. S., McIver, C. D., and Edney, E.O.: Determination of secondary organic aerosol products fromthe photooxidation of toluene and their implications in ambientPM2.5, J. Atmos. Chem., 47, 79–100, 2004.
Kleindienst, T. E., Smith, D. F., Li, W., Edney, E. O., Driscoll, D.J., Speer, R. E., and Weathers, W. S.: Secondary organic aerosolformation from the oxidation of aromatic hydrocarbons in thepresence of dry submicron ammonium sulphate aerosol, Atmos.Environ., 33, 3669–3681, 1999.
Krivacsy, Z., Hoffer, A., Sarvari, Z., Temesi, D., Baltensperger, U.,Nyeki, S., Weingartner, E., Kleefeld, S., and Jennings, S. G.:Role of organic and black carbon in the chemical composition ofatmospheric aerosol at European background sites, Atmos. Env-iron., 35(36), 6231–6244, 2001.
Krivacsy, Z., Kiss, G., Varga, B., Galambos, I., Sarvari, Z., Ge-lencser, A., Molnar, A., Fuzzi, S., Facchini, M. C., and Zappoli,S.: Study of humic-like substances in fog and interstitial aerosolby size-exclusion chromatography and capillary electrophoresis,Atmos. Environ., 34(25), 4273–4281, 2000.
Kroll, J. H., Nga, N. L., Murphy, S. M., Varutbangkul, V., Fla-gan, R. C., and Seinfeld, J. H.: Chamber Studies of Sec-ondary Organic Aerosol Growth by Reactive Uptake of Sim-ple Carbonyl Compounds, J. Geophys. Res., 110, D23207,doi:10.1029/2005JD006004, 2005.
Larsen, B. R., Bella, D. D., Glasius, M., Winterhalter, R., Jensen,N. R., and Hjorth, J.: Gas-phase OH oxidation of monoterpenes:Gaseous and particulate products, J. Atmos. Chem., 38, 231–276,2001.
Liggio, J., Li, S. M., and McLaren, R.: Heterogeneous reactions ofglyoxal on particulate matter: identification of acetals and sulfate
esters, Environ. Sci. Technol., 39(6), 1532–1541, 2005.Liu, P., Ziemann, P. J., Kittelson, D. B., and McMurry, P. H.: Gen-
erating particle beams of controlled dimensions and divergence:I. Theory of particle motion in aerodynamic lenses and nozzleexpansions, Aerosol Sci. Technol., 22(3), 293–313, 1995a.
Liu, P., Ziemann, P. J., Kittelson, D. B., and McMurry, P. H.: Gen-erating particle beams of controlled dimensions and divergence:II. Experimental evaluation of particle motion in aerodynamiclenses and nozzle expansions, Aerosol Sci. Technol., 22(3), 314–324, 1995b.
Macias, E. S., Zwicker, J. O., Ouimette, J. R., Hering, S. V., Fried-lander, S. K., Cahill, T. A., Kuhlmey, G. A., and Richards, L. W.:Regional haze case studies in the Southwestern U.S. – I. Aerosolchemical composition, Atmos. Environ., 15, 1971–1986, 1981.
McLafferty, F. W. and Turecek, F.: Interpretation of mass spectra,Fourth Edition, University Science Books, 1993.
Muller, J. F.: Geographical distribution and seasonal variation ofsurface emissions and deposition velocities of atmospheric tracegases, J. Geophys. Res., 97, 3787–3804, 1992.
Novakov, T. and Penner, J. E.: Large contribution of organicaerosols to cloud-condensation nuclei concentrations, Nature,365, 323–365, 1993.
Noziere, B. and Barnes, I.: Evidence for the formation of a PANanalogue of pinonic structure and investigation of its thermal sta-bility, J. Geophys. Res., 103, 25 587–25 597, 1998.
Noziere, B., Barnes, I., and Becker, K.: Product study andmechanisms of the reactions of α-pinene and pinonaldehydewith OH radicals, J. Geophys. Res., 104(D19), 23 645–23 656,doi:1999JD900778, 1999.
Odum, J. R., Hoffmann, T., Bowman, F., Collins, D., Flagan, R.C., and Seinfeld, J. H.: Gas/particle partitioning and secondaryorganic aerosol yields, Environ. Sci. Technol., 30, 2580–2585,1996.
Odum, J. R., Jungkamp, T. P. W., Griffin, R. J., Flagan, R. C., andSeinfeld, J. H.: The atmospheric aerosol-forming potential ofwhole gasoline vapor, Sci., 276, 96–99, 1997.
Pankow, J. F.: An absorption model of the gas/aerosol partitioninginvolved in the formation of secondary organic aerosol, Atmos.Environ., 28, 189–194, 1994a.
Pankow, J. F.: An absorption model of the gas/aerosol partitioningof organic compounds in the atmosphere, Atmos. Environ., 28,185–188, 1994b.
Paulsen, D., Dommen, J., Kalberer, M., Prevot, A. S. H., Richter,R., Sax, M., Steinbacher, M., Weingartner, E., and Baltensperger,U.: Secondary organic aerosol formation by irradiation of 1,3,5trimethylbenzene-NOx-H2O in a new reaction chamber for at-mospheric chemistry and physics, Environ. Sci. Technol., 39,2668–2678, 2005.
Paulsen, D., Weingartner, E., Alfarra, M. R., and Baltensperger,U.: Volatility measurements of photochemically and nebulizer-generated organic aerosol particles, J. Aerosol Sci., J. AerosolSci., 37(9), 1025–1051, 2006.
Seinfeld, J. H. and Pandis, S. N.: Atmospheric Chemistry andPhysics: from Air Pollution to Climate Change, John Wiley &Sons, New York, Chichester, 1998.
Tobias, H. J. and Ziemann, P. J.: Thermal desorption mass spec-trometric analysis of organic aerosol formed from reactions of1-tetradecene and O3 in the presence of alcohols and carboxylicacids, Environ. Sci. Technol., 34(11), 2105–2115, 2000.
Atmos. Chem. Phys., 6, 5279–5293, 2006 www.atmos-chem-phys.net/6/5279/2006/
M. R. Alfarra et al.: A mass spectrometric study of secondary organic aerosols 5293
Tolocka, M. P., Jang, M., Ginter, J. M., Cox, F. J., Kamens, R.M., and Johnston, M. V.: Formation of oligomers in secondaryorganic aerosol, Environ. Sci. Technol., 38, 1428–1434, 2004.
Vasconcelos, L. A., Macias, E. S., and White, W. H.: Aerosol com-position as a function of haze and humidity levels in the south-western US, Atmos. Environ., 28, 3679–3691, 1994.
Went, F. W.: Blue haze in the atmosphere, Nature, 187, 641–643,1960.
Zappoli, S., Andracchio, A., Fuzzi, S., Facchini, M. C., Gelencser,A., Kiss, G., Krivacsy, Z., Molnar, A., Meszaros, E., and Hans-son, H.-C.: Inorganic, organic and macromolecular componentsof fine aerosol in different areas of Europe in relation to theirwater solubility, Atmos. Environ., 33(17), 2733–2743, 1999.
Zhang, Q., Stanier, C. O., Canagaratna, M. C., Jayne, J. T.,Worsnop, D. R., Pandis, S. N., and Jimenez, J. L.: Insights intothe chemistry of nucleation bursts and new particle growth eventsin Pittsburgh based on aerosol mass spectrometry, Environ. Sci.Technol., 38, 4797–4809, 2004.
Zhang, X. F., Smith, K. A., Worsnop, D. R., Jimenez, J., Jayne, J. T.,and Kolb, C. E.: A numerical characterization of particle beamcollimation by an aerodynamic lens-nozzle system: Part I. Anindividual lens or nozzle, Aerosol Sci.Technol., 36(5), 617–631,2002.
Zhang, X. F., Smith, K. A., Worsnop, D. R., Jimenez, J. L., Jayne, J.T., Kolb, C. E., Morris, J., and Davidovits, P.: Numerical charac-terization of particle beam collimation: Part II. Integrated aero-dynamic lens-nozzle system, Aerosol Sci. Technol., 38(6), 619–638, 2004.
www.atmos-chem-phys.net/6/5279/2006/ Atmos. Chem. Phys., 6, 5279–5293, 2006