Embed Size (px)
Citation preview

Abstract—Physico-chemistry and biological data were
investigated from October of 2010 until April of 2011 of Jatiluhur
reservoir. A total of six sampling stations were selected for this study.
The discharge and hidrological data were obtained from Perum Jasa
Tirta II Jatiluhur. The results showed that the hydrological regime in
the reservoir Jatiluhur is affected by global phenomenon La Nina
events in 2010 and early in 2011. Stream flows were determined
during sampling to range from 78 to 482,5 m3/s. The water quality
findings were as follows: pH (6,93-8,81), temperature (26,37-
30,6°C), dissolved oxygen (0,733-5,2 mg/l), conductivity (2,45-
233µmhos/cm), COD (7,36-96,9 mg/l), turbidity (4,063-65,6 NTU),
total phosphate (0,002-0,324 mg/l), total nitrogen (0,99-5,96 mg/l),
Chlorophyl a (2,237-43,37 mg/m3), visibility (30-160 cm). The
eutrophication was pronounced at Jatiluhur reservoir. Canonical
Correspendence Analysis found that some water quality parameters
correlated positively with the discharge and the water level.
Keywords—Hidrological regimes, water quality parameter,
trophic status index, Jatiluhur Cascade Citarum reservoir
I. INTRODUCTION
Reservoir or a dam is a surface water resources that have
played an important function throughout the history in the
development of human civilization [1] and built to change
natural flow regimes which the most significant human
interventions in the hydrological cycle [2]. Thence, swamps,
and reservoirs in the category of multi-purpose lake that has
both ecological and social functions, economics and culture.
Construction of reservoirs in Indonesia began with the
construction of reservoirs in the Citarum cascade downstream
of the reservoir is Ir.H.Djuanda (Jatiluhur) in 1967, which has
8.300 hectare area of inundation and a maximum depth of 107
m. Jatiluhur if it is associated as a multi-use function, has been
a major proponent of 80% of the raw water to Jakarta at 16.5
m3/second [3]. The water from the waterfall weir of Jatiluhur
divided in three channel, namely West Tarum Channel, North
Tarum Channel, and East Tarum Channel. Water at West
Tarum channel is used to meet the needs of irrigation,
domestic, and industrial. Citarum cascade reservoirs has the
Lieza Corsita is Candidate Doctor, University of science and technology of
Jayapura Papua, Indonesia. Email id: [email protected]
Arwin is professor of Departement enviromental engineering, Faculty of
civil engineering and enviromental, Bandung Institute of Technology,
Indonesia
main function used for Hydroelectric Power Plant (HEPP),
which Jatiluhur also has a function as a raw water source of
drinking water and flood control and irrigation. Jatiluhur has
run into decreased function and carrying capacity [4]. Erosion
in the upper watershed Jatiluhur cause the input stream
becomes increasingly turbid during the dry season [5]. This is
due to high demand for water for agriculture, urban and
industrial West Tarum along the channel and due to climate
change and land use in the catchment area Jatiluhur, Cirata and
Saguling upstream. Other function other than as a reservoir
raw water source or a place to store water [6], is also a
productive freshwater ecosystems where productivity is
dominated by phytoplankton. In general, the utilization factor
and the survival function of a body of water , among others,
determined by the level of fertility waters. The level of fertility
or marine productivity can be determined with the abundance
and biomass of phytoplankton as primary producers in the
water. The decline in water quality is also characterized by the
presence of changes in aquatic community structure and the
emergence of the dominance of a water biota. Something
similar happened also in the waters of the Citarum Cascade
Reservoir. The abundance of one type of aquatic biota,
particularly phytoplankton may cause the food chain (food
web), under-utilized by zooplankton and fish, and also the
condition of the waters has decreased as a result of the poison
(toxin ) that is caused by certain types of phytoplankton [7].
The results of the analysis in Saguling, Cirata and Jatiluhur
stated that 55 genera of phytoplankton classes contained in the
reservoir water. Phytoplankton species can be used as bio-
indicators to indicate water quality Saguling, Cirata and
Jatiluhur who have undergone the process of eutrophication ,
ie cultural eutrophication [8]-[10].
II. MATERIALS AND METHODS
A. Description of the study area
Jatiluhur Dam or reservoir is located in West Java
Province, Java island, Indonesia. It lies within the Citarum
river. Based on geographic coordinates, body position
Jatiluhur dam is at 6o31 'south latitude and 107
o23' east
longitude. The Citarum river is the largest river system in West
Java and drains before joining the Java sea about 6.000 square
kilometres of the catchment area. The annual mean discharge
of the Citarum river at Jatiluhur reservoir has been estimated
The Hydrological Regimes, Water Quality
Assesment and Trophic Status of the Reservoir
(Case Study: Jatiluhur Cascade Citarum
Reservoir)
Lieza Corsita, Arwin, Barti Setiani Muntalif, and Indah Rachmatiah S. Salami
International Conference on Latest Trends in Food, Biological & Ecological Sciences (ICLTFBE’14) July 15-16, 2014 Phuket (Thailand)
http://dx.doi.org/10.17758/IAAST.A0714022 18
as 175 m3/s. Citarum reservoir system consists of three
reservoirs including Jatiluhur, Cirata and Saguling. The
Jatiluhur dam was built in 1957 and officially began operating
in 1967. It is lower most and largest reservoir of the Citarum
reservoir system and provides a multipurpose gross storage of
about 2.448 m3. The management of the dam has experienced
many changes reflecting Indonesian macroeconomic changes
and various interests in benefiting from water from the dam.
Jatiluhur Authority was first established in 1967 as Public
Utility Company (Perusahaan Umum) whose main task was
providing public services in the water resources sector. In
1999 a big change happened when Jatiluhur Authority was
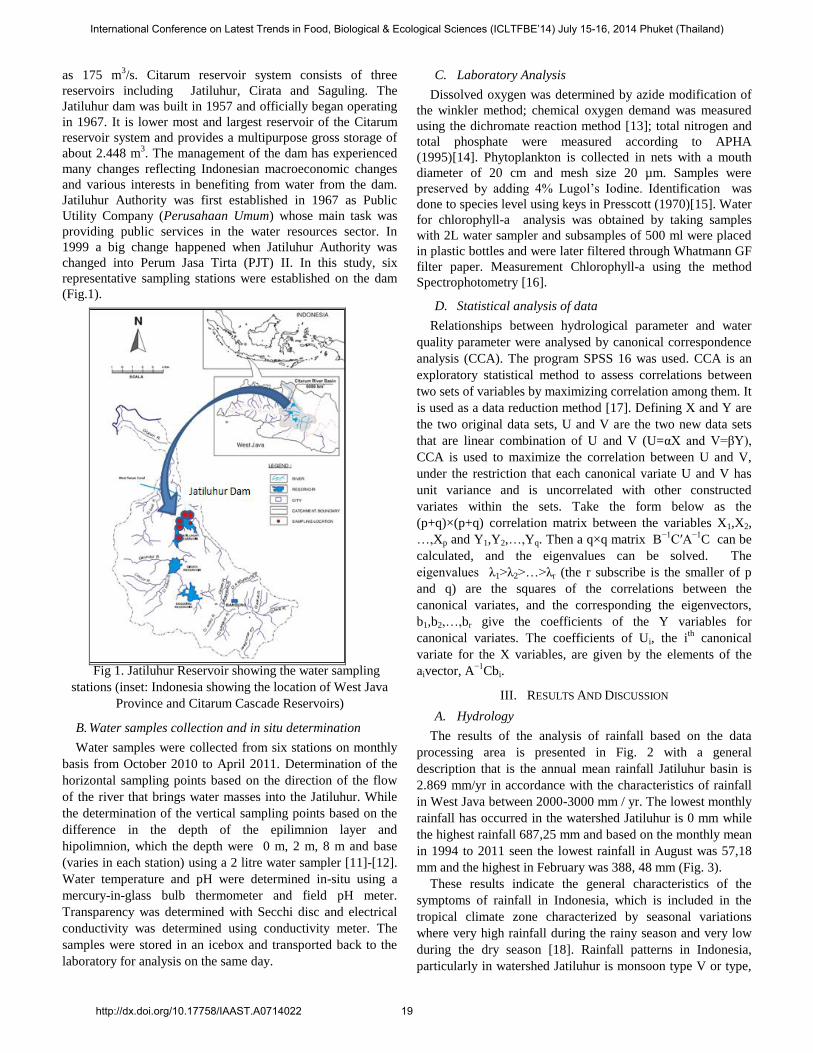
changed into Perum Jasa Tirta (PJT) II. In this study, six
representative sampling stations were established on the dam
(Fig.1).
Fig 1. Jatiluhur Reservoir showing the water sampling
stations (inset: Indonesia showing the location of West Java
Province and Citarum Cascade Reservoirs)
B. Water samples collection and in situ determination
Water samples were collected from six stations on monthly
basis from October 2010 to April 2011. Determination of the
horizontal sampling points based on the direction of the flow
of the river that brings water masses into the Jatiluhur. While
the determination of the vertical sampling points based on the
difference in the depth of the epilimnion layer and
hipolimnion, which the depth were 0 m, 2 m, 8 m and base
(varies in each station) using a 2 litre water sampler [11]-[12].
Water temperature and pH were determined in-situ using a
mercury-in-glass bulb thermometer and field pH meter.
Transparency was determined with Secchi disc and electrical
conductivity was determined using conductivity meter. The
samples were stored in an icebox and transported back to the
laboratory for analysis on the same day.
C. Laboratory Analysis
Dissolved oxygen was determined by azide modification of
the winkler method; chemical oxygen demand was measured
using the dichromate reaction method [13]; total nitrogen and
total phosphate were measured according to APHA
(1995)[14]. Phytoplankton is collected in nets with a mouth
diameter of 20 cm and mesh size 20 µm. Samples were
preserved by adding 4% Lugol’s Iodine. Identification was
done to species level using keys in Presscott (1970)[15]. Water
for chlorophyll-a analysis was obtained by taking samples
with 2L water sampler and subsamples of 500 ml were placed
in plastic bottles and were later filtered through Whatmann GF
filter paper. Measurement Chlorophyll-a using the method
Spectrophotometry [16].
D. Statistical analysis of data
Relationships between hydrological parameter and water
quality parameter were analysed by canonical correspondence
analysis (CCA). The program SPSS 16 was used. CCA is an
exploratory statistical method to assess correlations between
two sets of variables by maximizing correlation among them. It
is used as a data reduction method [17]. Defining X and Y are
the two original data sets, U and V are the two new data sets
that are linear combination of U and V (U=αX and V=βY),
CCA is used to maximize the correlation between U and V,
under the restriction that each canonical variate U and V has
unit variance and is uncorrelated with other constructed
variates within the sets. Take the form below as the
(p+q)×(p+q) correlation matrix between the variables X1,X2,
…,Xp and Y1,Y2,…,Yq. Then a q×q matrix B−1
C′A−1
C can be
calculated, and the eigenvalues can be solved. The
eigenvalues λ1>λ2>…>λr (the r subscribe is the smaller of p
and q) are the squares of the correlations between the
canonical variates, and the corresponding the eigenvectors,
b1,b2,…,br give the coefficients of the Y variables for
canonical variates. The coefficients of Ui, the ith
canonical
variate for the X variables, are given by the elements of the
aivector, A−1
Cbi.
III. RESULTS AND DISCUSSION
A. Hydrology
The results of the analysis of rainfall based on the data
processing area is presented in Fig. 2 with a general
description that is the annual mean rainfall Jatiluhur basin is
2.869 mm/yr in accordance with the characteristics of rainfall
in West Java between 2000-3000 mm / yr. The lowest monthly
rainfall has occurred in the watershed Jatiluhur is 0 mm while
the highest rainfall 687,25 mm and based on the monthly mean
in 1994 to 2011 seen the lowest rainfall in August was 57,18
mm and the highest in February was 388, 48 mm (Fig. 3).
These results indicate the general characteristics of the
symptoms of rainfall in Indonesia, which is included in the
tropical climate zone characterized by seasonal variations
where very high rainfall during the rainy season and very low
during the dry season [18]. Rainfall patterns in Indonesia,
particularly in watershed Jatiluhur is monsoon type V or type,
International Conference on Latest Trends in Food, Biological & Ecological Sciences (ICLTFBE’14) July 15-16, 2014 Phuket (Thailand)
http://dx.doi.org/10.17758/IAAST.A0714022 19

or annual rainfall graph shaped like the letter V (Fig.3). This
type shows that Indonesia in general have large amounts of
precipitation in the month of December to February and had a
little precipitation in June-August. While the month of March
to May and September to November is referred to as
transitional season. In this transitional season, rainfall and
wind is erratic, this is caused by changes in the trade winds
and the monsoon.
Fig. 2 Distribution of annual rainfall from 1994-2011
Fig. 3 Distribution of monthly mean rainfall
from 1994-2011
The highest number of rain days per month was recorded during
the wet season during February to March in 2010, on the contrary the
wet season was recorded during November to Desember in 2011
(Fig.4). The highest rainfall (674,353 mm and 496,575 mm) was
recorded in March 2010 and November 2011; the lowest (0 mm and
18,54 mm) was recorded in October 2010 and August 2011 (Fig.4).
Fig. 4 Distribution of rainfall from January to Desember
2010 and 2011
B. Discharge and water level in Jatiluhur
Annual discharge and water level Jatiluhur (2001 - 2011)
can be seen in Fig.5. This graph has been demonstrated and
proven that vision hydrology states that the components are
random and stochastic. Extremity inflow discharge had
occurred in 2003 in which there has been a minimum inflow
discharge and in 2010 the maximum inflow discharge has
occurred in the past 10 years.
Fig. 5 Inflow discharge and water level in Jatiluhur
During 2001 to 2011
Fig. 6 5-year moving average inflow discharge (a) and
precipitation (b) in Jatiluhur
Tendency or trend that occurred in the inflow discharge and
rainfall in Jatiluhur can be shown from the calculation of
moving averages 5 (five) years. Figure 6 (a) and (b) show that
there has been a trend of increasing inflow discharge and
rainfall within a period of 10 (ten) years, ie from 2001 to 2011.
International Conference on Latest Trends in Food, Biological & Ecological Sciences (ICLTFBE’14) July 15-16, 2014 Phuket (Thailand)
http://dx.doi.org/10.17758/IAAST.A0714022 20

This showed that the hydrological regime in Jatiluhur greatly
affected by the changes global climate occurring in Indonesia
by a monsoon climate which both random and stochastic.
C. Water quality
Measurement of water quality in the primary study was
conducted in six (6) observation stations based on differences
in the depth of the reservoir. Name of Station 1: Parung
Kalong, station 2: Bojong, station 3: Kerenceng, station 4:
KJA, station 5: Cilalawi and station 6: Dam. Sampling was
done by 2 (two) times the decision or measure to stratify depth
of 0 m, 2 m, 4 m, 8 m and base. Differences depth is divided
into two, the depth of the Epilimnion (surface water 0 m to 8
m) and Hipolimnion (depth of 8 m to the base reservoir).
Division two lines due to the depth of the thermocline gradient
could not be determined with certainty at each sampling.
Vertical distribution of temperature is basically divided into
three layers, namely the warm layer on top or epilimnion layer
where the temperature gradient in this layer slowly changing,
the thermocline layer is the layer where the temperature
gradient changes rapidly according to the increase of depth,
the cold layer at below the thermocline layer, also called
hipolimnion [19]. Jatiluhur has had a variation where the
measurement results of water quality varies in each
observation station (Fig. 7). Temperatures in Jatiluhur ranged
from 26,5° C to 30,5° C. The lowest temperature in the region
has occurred in Parung Kalong (Jatiluhur upstream) and the
highest in the region Cilalawi River. In general, the mean
Jatiluhur water temperature was 28,26+ 1,21 °C with an
uneven distribution according to the depth of the reservoir.
The vertical distribution of water temperature during the
observation Jatiluhur reservoir showed a decrease related to
the depth of the water layer. This condition may occured due
to the intensity of light entering the water layer decreased so
that the water temperature becomes lower with increasing
water depth.
pH value during the observations have shown a decrease in
line with increasing water depth. Changes in the pH value of
the water will affect the toxicity of chemical compounds in
water. Under government regulations on drinking water
standard in Indonesia, the pH of the water reservoir Jatiluhur is
within the allowable limits. Measured range of pH values
remained within the tolerance limits for the growth of
phytoplankton. The degree of pH describes the ability of a
body of water to neutralize hydrogen ions that enter the body
of water where most of the aquatic biota are sensitive to
changes in pH and liked the pH value ranged from 7 to 8,5.
Observations on the pH is relatively the same as the condition
of the waters in 1983, 2004, 2005 and 2006 [20]. Fig. 7 also
shows the concentration of dissolved oxygen conditions in the
reservoir ranged from 1 mg/l to 5,5 mg/l. Dissolved oxygen is
an important parameter that determines the quality of the
water. Stations that have the lowest dissolved oxygen levels
are station 1 and 2 where the station located at the inlet
Jatiluhur. Due to the input of the reservoir Cirata which carried
out organic material, stations 1 and 2 have occurred
decomposition of organic material in which the decomposition
process required oxygen levels. The organic content derived
from Cirata was high as a result of aquaculture activities and it
was greater than the carrying capacity of reservoir [20].
Vertical distribution pattern indicates that the average of value
of dissolved oxygen concentrations generally decreased with
increasing of water depth. Significant differences occurred at a
depth of epilimnion and hipolimnion for DO parameters. The
mean measurement of dissolved oxygen in the epilimnion layer
was 3,72+1,29 mg/l while the mean dissolved oxygen at depth
hipolimnion was 1,53+0,65 mg/l. The deeper layers of the
waters, the more diminished photosynthesis activities of
phytoplankton.
The other parameters were turbidity (the mean was
16,05+19,34 NTU, conductivity (the mean was
210,21+24,37µmhos/cm), total nitrogen (the mean was
1,79+0,79 mg/l, total phosphate (the mean was 0,07+0,11
mg/l) and visibility showed a pattern that seen similar in each
observation station. Parameters that exceed the quality
standards of class I (Regulation No. 82 of 2001 about Water
Quality Standards) were COD (the mean was 31,97+17,54
mg/l) and Pb (the mean was 0,01+0,01 mg/l). Stations that
have high levels of COD and the highest Pb located in the inlet
area and outlet streams Cilalawi river. Effects of human
activities on the reservoir and its watershed are much reflected
on the variations seen in nitrate, phosphate and possibly
sulphate concentration [ 21] and dissolved heavy metal. Based
on BPS data in 2005, along watersheds Citarum there were
699 registered industry, which consists of 327 pieces of large-
scale industries and 372 medium-sized industries. The number
does not include small-scale industries that are home industry
along the Citarum watershed. The concentrations of
phosphate, nitrogen and metals ion were higher during the
rainy season because the period is usually the peak of
agricultural activities around the reservoir.
The content of the biomass of phytoplankton in the photic
layer of 0,5 meters at each observation station ranged from
2,237 to 43,37 mg Chl-a/m3 with a mean of 15,38 Chl-a/m
3
which can be seen in Fig. 8. Chlorophyll-a concentration in
Jatiluhur showed that the concentration of chlorophyll a was
increased in January and tends to decrease in the following
months (Fig.8). Chlorophyll-a is used as one of the parameters
determining the trophic status or condition of eutrophication
that occurs in Jatiluhur.
International Conference on Latest Trends in Food, Biological & Ecological Sciences (ICLTFBE’14) July 15-16, 2014 Phuket (Thailand)
http://dx.doi.org/10.17758/IAAST.A0714022 21

Fig.7 Distribution of 10 water quality parameters; i.e pH,
Temperature, Turbidity, Conductivity, DO, COD, Total
Nitrogen, Total Phosphate, Dissolved Pb and Visibility
Fig.8 Distribution of Chlorophyl-a at 6 station sampling
D. Trophic State Index
Lakes and reservoirs fertility rates can be calculated based
on some very influential parameters in accordance with the
calculation of Trophic Status Index (TSI), namely: Total
Phosphorous, chlorophyll-a, and brightness using Sechi disc
measurements. An attempt to evaluate the trophic state of the
Jatiluhur reservoir was made by using the Modified Carlson
Index [22].
Fig.9 Distribution of Trophic State Index at 6 station
The determination of the three parameters based on the
close linkage of each parameter, where the elements of
pollutants that enter the waters trigger phytoplankton growth is
characterized by the presence of chlorophyll-a, and due to the
density of chlorophyll-a will cause inhibition of the column of
light that enters the lake which is characterized by more short-
brightness of the waters. Fig. 9 showed Jatiluhur trophic status
using Carlson method in the category of eutrophication (water
pollution where indicated) that has been shown by TSI values
ranged between 50 -70 and TSI values calculated on the basis
of Secchi disc depth, total phosphorus and chlorophyll-a
showed a characteristic seasonal variation.
30
40
50
60
70
80
0kt
nov jan
feb
mar
april 0kt
nov jan
feb
mar ap
r0k
tno
v jan
feb
mar ap
r0k
tno
v jan
feb
mar ap
r0k
tno
v jan
feb
mar ap
r0k
tno
v jan
feb
mar ap
r
st1 st2 st3 st4 st5 st6
TS
I
Station
Total Tsi
International Conference on Latest Trends in Food, Biological & Ecological Sciences (ICLTFBE’14) July 15-16, 2014 Phuket (Thailand)
http://dx.doi.org/10.17758/IAAST.A0714022 22

E. Canonical Component Analysis
TABLE I
CCA OF THE DATA SETS
Canonical Variate Function-1 Function-2
Canonical Correlations 0,03 0,19
sig. Of F 0,000 0,051
Variable 1 2
Total Nitrogen -0,133 -0,235
Total Phosphate -0,062 -0,3202
pH 0,972 -0,003
COD 0,344 0,455
Dissolved Pb 0,234 -0,872
Dissolved Oxygen 0,697 0,222
Covariate 1 2
Temperature 0,602 0,215
Visibility 0,079 -0,082
Conductivity 0,225 -0,043
Turbidity -0,306 -0,111
Discharge inflow -0,412 -0,716
Water level -0,167 -0,853
The six chemical variables were taken as the response
data, and the six physical variables were treated as the
predictor set. The CCA results were showed in Table 1.
Although there are totally six canonical variates, only those
with canonical correlation coefficients higher than 0.45 are
considered as important parameters. Correlation coefficients
for canonical variates 1 and 2 were 0,03 and 0,19
respectively, with the significance of F less than 0.01,
indicating that they are all significant. To determine the
dominant parameter, their outstanding coefficients with the
highest values in each group were analyzed and highlighted in
Table 4. Considered the above-mentioned results, pH and DO
has positive correlation. COD and dissolved Pb has negative
correlation. Temperature and discharge has negative
correlation but it has positive correlation with water level.
Water level and discharge were the dominant variables in the
physical; pH and DO were the dominant variable in the
chemical parameters respectively. It indicated and reported
the dominant water parameter as wells as the relationship
between the physical parameters and the chemical parameters
in Jatiluhur reservoir. Water level or discharge can be the
represented physical water parameters, while pH or DO can
be the represented chemical water parameter for the reservoir
monitoring and management. However, other water parameters
and the adopted measurement methods could limit the
implications of this finding [17].
IV. CONCLUSION
The historical data of hydrological Jatiluhur showed that
discharge is random and stochastic where there has been
extremities of a minimum and maximum discharge that
occurred in 2010 and 2011 due to climate change. It affects the
management of reservoirs in the Citarum cascade. A detail
physico-chemical study of the Jatiluhur reservoir during the
wet season showed different seasonal fluctuations in various
parameters. The results of water quality trends showed that
most water quality parameters were quite high in the wet
season like COD, turbidity, Pb, total phosphate and Trophic
Index. The eutrophication was occured in Jatiluhur that can
significantly alter the rate of natural process and shorten the
life expectancy of the affected water body [22]. Recently, there
has not been yet significant efforts being made in Jatiluhur to
protect, rehabilitate and restore the reservoir and
impoundments contributing to the country’s water resources.
Two types of conservation can adopted to Jatiluhur : Control
of pollution at source and in-reservoir treatment and control
measures [22].
ACKNOWLEDGMENT
This paper originated as part of PhD thesis funded by
Indonesian Goverment through ITB research grant (KK and
inovation). Providing the field data for this study by PJT II
Jatiluhur, Loka Riset Pemacuan Stok Ikan Jatiluhur and
PSDA West Java, Indonesia, was greatly appreciated.
REFERENCES
[1] G.Muhammad Barzani, B.S Ismail, Sahibin Abd.Rahim, Sujaul Islamir
and C.C Tan, ―Hidrology And Water Quality Assesment Of Tasik
Chini’s Feeder Rivers, Pahang, Malaysia,‖ American-Eurasian Journal
Agriculture & Enviromental Science, Vol. 2 (1), 2007, pp 39-47.
[2] E.O.Akindele, I.F.Adeniyi and I.I Indabawa,‖Spatio Temporal
Assesment And Water Quality Characteristics Of Lake Tiga, Kano,
Nigeria,‖ Research Journal of Enviromental and Earth Science,
Vol.5(2), 2013, pp. 67-77.
[3] M.Z.A.Tamim,‖ Kebijakan Strategis Pengembangan Air Minum, Di
Kawasan Andalan Kasus Jagodetabek,‖ unpublished paper, 2008,
Direktorat PAM, Dirjen Cipta Karya, Kementrian PU.
[4] M. Rizka, Hilda L, and Asep M., ― Analisa Daya Dukung Waduk
Dilihat Dari Hubungan Parameter Fisika-Kimia Air Terhadap Parameter
Nutrien Menurut Perbedaan Musim,‖ Proceeding Seminar
Geoteknologi Kontribusi Ilmu Kebumian dalam pembangunan
berkelanjutan, 2008, Puslit Geoteknologi LIPI.
[5] L.Hilda, Rizka Maria, Sukristiyanti, and Nining Sutarman,‖ Observasi
Kualitas Air pada Waduk Jatiluhur,‖ Proseding Seminar Geoteknologi
Kontribusi Ilmu Kebumian dalam pembangunan berkelanjutan, 2007,
Puslit Geoteknologi LIPI
[6] Suwignyo.,‖Ekosistem Perairan Pedalaman, Tipologi dan
Permasalahannya,‖, unpublished paper, 1996, Kuliah Kursus
Penyusunan Amdal XIX, PPSML-LP UI, Jakarta.
[7] Eun Hye Na and Seok Soon Park,‖ A Hydrodynamic And Water Quality
Modeling Study Of Spatial And Temporal Patterns Of Fitoplankton
Growth In A Stratified Lake With Buoyant Incoming flow,” Jurnal
Ecological Modelling, 2006, Vol. 199, pp. 298–314.
http://dx.doi.org/10.1016/j.ecolmodel.2006.05.008
[8] Diah Prabandani, ‖Kajian Fitoplankton Dalam Penentuan Kualitas
Perairan Waduk (Studi Kasus Perairan Waduk Saguling, Jawa
Barat)‖, thesis, 2006, Jurusan Teknik Lingkungan, ITB.
[9] Prihadi,‖ Pengelolaan Budidaya Ikan Secara Lestari di Waduk : Studi
Kasus di Perairan Waduk Cirata, Jawa Barat,‖ Dissertation, 2005,.
Institut Pertanian Bogor, pp.185.
[10] C. Umar,‖ Struktur Komunitas dan Kelimpahan Fitoplankton dalam
Kaitannya dengan Kandungan Unsur Hara (Nitrogen dan Fosfor) dari
Budidaya Ikan dalam Keramba Jaring Apung di Waduk Ir. H. Juanda
Jatiluhur Jawa Barat,‖ Tesis Program Magister, 2003, Institut
Pertanian Bogor, pp 78.
International Conference on Latest Trends in Food, Biological & Ecological Sciences (ICLTFBE’14) July 15-16, 2014 Phuket (Thailand)
http://dx.doi.org/10.17758/IAAST.A0714022 23

[11] A.S Nastiti, Krismono and Endi S. K,‖ Dampak Budi Daya Ikan dalam
Keramba Jaring Apung terhadap Peningkatan Unsur N dan P di Perairan
Waduk Saguling, Cirata dan Jatiluhur,‖ Jurnal Penelitian Perikanan
Indonesia, 2001,Vol.7 nomor 2, pp.22-27.
[12] N.T.M Pratiwi, Enan M.A, Majariana K, and Hesty D.W,‖ Distribusi
Spasial Fitoplankton pada Kawasan Keramba Jaring Apung di Waduk
Jatiluhur, Purwakarta, Jawa Barat‖, Prosiding Seminar Nasional
Limnologi, 2006, pp. 222-240.
[13] Hach, Water Analysis Handbook (Fourth edition),Volume 2, 2003,
Hach Chemical Company, Loveland, Colorado,USA, pp.1268.
[14] APHA (American Public Health Association), Standard Methods For
The Examination Of Water And Waste Water, 19th edition, 1995,
American Public Health Association Inc, New York, pp.1193.
[15] Tamuka Nhiwatiwa and Brian E.Marshall,‖Water Quality and Plankton
Dynamics in Two Small Dams in Zimbabwe,‖ African Journal of
Aquatic Science, 2007, Vol.32(2), pp 139-151.
http://dx.doi.org/10.2989/AJAS.2007.32.2.5.202
[16] M.Radojevic and V.N Bashkin, Practical Enviromental Analysis, Royal
Society of Chemistry, 1999, Cambridge, pp.466.
[17] Mio Cheng Chan, Inchio Lou, Wai Kin Ung and Kai Meng Mok,‖
Integrating Principle Analysis For Monitoring Water Quality in Storage
Reservoir,‖ Journal Applied Mechanics and Materials, Vol.284-287,
2013, pp 1458-1462, Trans Tech Publications, Switzerland.
http://dx.doi.org/10.4028/www.scientific.net/AMM.284-287.1458
[18] J.H Park, Lei Duan, Bomchul Kim, Myron J.M., and Hideaki Shibata,
‖Potential Effects Of Climate Change and Variability on Watershed
Biogeochemical Processes and Water Quality in Northeast Asia, “
Journal Enviroment International, 2010, Vol. 36,pp. 212-225.
http://dx.doi.org/10.1016/j.envint.2009.10.008
[19] Hefni Effendi, Telaah Kuaitas Air Bgi Pengelolaan Sumber Daya dan
Lingkungan Perairan, Penerbit Kanisius, 2003, Yogyakarta.
[20] Didik Wahju Hendro Tjahjo, Sri Endah Purnamaningtys, Masayu
Rahmia Anwar Putri, Yayuk Sugianti and Hendra Saipullah,
Biolimnologi dan Hidrologi Waduk Kaskade Sungai Citarum, Jawa
Barat, Annual Report, 2009, Balai Riset Pemulihan Sumber Daya Ikan,
Departemen Kelautan dan Perikanan.
[21] Moshood Keke Mustapha,‖ Assesment of the Water Quality of Oyun
Reservoir,Offa,Nigeria, Using Selected Physico-Chemical Parameters,‖
Turkish Journal Of Fisheries and Aquatic Sciences, Vol.8, 2008,
pp.309-319.
[22] M.P.Sharma, Arun Kumar and Shalini Rajvanshi,‖Assesment of
Trophic State of Lakes : A Case of Mansi Ganga Lake In India,‖
Journal Hydro Nepal, Issue No.6, January, 2010, pp.65-72.
.
International Conference on Latest Trends in Food, Biological & Ecological Sciences (ICLTFBE’14) July 15-16, 2014 Phuket (Thailand)
http://dx.doi.org/10.17758/IAAST.A0714022 24