Embed Size (px)
Citation preview

The human olfactory bulb processes odor valencerepresentation and cues motor avoidance behaviorBehzad Iravania , Martin Schaefera , Donald A. Wilsonb,c, Artin Arshamiana,d,1, and Johan N. Lundstr€oma,e,f,g,1,2
aDepartment of Clinical Neuroscience, Karolinska Institutet 17177 Stockholm, Sweden; bNathan Kline Institute for Psychiatric Research, Orangeburg, NY 10962;cDepartment of Child and Adolescent Psychiatry, New York University LangoneMedical School, New York, NY 10016; dDepartment of Psychology, StockholmUniversity 10405 Stockholm, Sweden; eMonell Chemical Senses Center, Philadelphia, PA 19104; fDepartment of Psychology, University of Pennsylvania,Philadelphia, PA 19104; and gStockholm University Brain Imaging Centre, Stockholm University 11415 Stockholm, Sweden
Edited by LindaM. Bartoshuk, University of Florida, Gainesville, FL, and approved July 21, 2021 (received for review January 22, 2021)
Determining the valence of an odor to guide rapid approach–avoidancebehavior is thought to be one of the core tasks of the olfactory sys-tem, and yet little is known of the initial neural mechanisms sup-porting this process or of its subsequent behavioral manifestationin humans. In two experiments, we measured the functional proc-essing of odor valence perception in the human olfactory bulb(OB)—the first processing stage of the olfactory system—using anoninvasive method as well as assessed the subsequent motoravoidance response. We demonstrate that odor valence perceptionis associated with both gamma and beta activity in the human OB.Moreover, we show that negative, but not positive, odors initiatean early beta response in the OB, a response that is linked to a pre-paratory neural motor response in the motor cortex. Finally, in aseparate experiment, we show that negative odors trigger afull-body motor avoidance response, manifested as a rapid leaningaway from the odor, within the time period predicted by theOB results. Taken together, these results demonstrate that thehuman OB processes odor valence in a sequential manner in boththe gamma and beta frequency bands and suggest that rapidprocessing of unpleasant odors in the OB might underlie rapidapproach–avoidance decisions.
olfactory bulb j valence j electrobulbogram j pleasantness j avoidance
The survival of any organism is dependent on approach–avoidance mechanisms: avoiding dangerous and approaching
rewarding stimuli. Among our senses, the olfactory system seemsspecifically tuned to aid approach–avoidance decisions and, inparticular, to assist in avoiding potentially dangerous stimuli. It isnot surprising then that the very first stage of the central olfactorysystem, the olfactory bulb (OB), processes various informationdirectly related to whether an odor should be avoided (1).
In nonhuman animals, the OB demonstrates rapid plasticityto aversive stimuli (1) and has dedicated processing of odorsinnately associated with threats (2). Sensory systems are nor-mally attuned to signals indicating negative outcomes for theindividual given that a failure to respond to such stimuli maylead to fatal consequences (3). For example, fast responses arearguably more important when withdrawing from toxic fumesthan the need for speed when approaching positive odor sour-ces. The perceptual equivalent to the motor-drivenapproach–avoidance system in the olfactory system is the sub-jective perceptual experience of an odorant’s valence. Here,perceived unpleasantness of odorants emitted from potentiallydangerous sources, such as, for example, rotten food, is trans-lated to avoidance (4). However, the underlying neural mecha-nism for this system is largely unknown. There are two majorreasons for this. First, it is difficult to assess the subjective expe-rience of a novel odorant’s valence in animal models. Second,although assessing subjective measurements from humans isstraightforward, until recently, there has been no method thatallows a noninvasive measure of neural signals from the humanOB. With that said, several brain imaging studies on humanshave targeted the central processing mechanisms underlying
valence perception. Here, valence perception has mainly beenlocalized to the orbitofrontal cortex (OFC); cf. ref. 5. However,the OFC is an area that is situated relatively late in the centralolfactory processing stream (6) and the location of neural proc-essing of odor avoidance in nonhuman animals has been identi-fied to be much earlier in the pathway, just one synapse awayfrom the odor receptors in the OB (7, 8). Thus, it is necessaryto study the OB to establish the underlying neural mechanismof the earliest processing stages to understand how the olfac-tory system processes the subjective valence of an odorant, thefirst stage of an approach–avoidance decision.
Based on past studies in nonhuman animals (8), we hypothe-sized that the OB in awake humans would demonstrate earlyvalence-differential processing and induce a preparatory motorapproach/avoidance response according to perceived odorvalence. In Experiment 1, we determined whether odor valenceis processed by the human OB by means of a recently devel-oped method that allows a direct but noninvasive measurementof the human OB (9). We found that subjective odor valencecould be linked to gamma and beta activity in the human OB,independent of respiration, and that an early beta activity inOB processing was linked to motor cortex processing in avalence-dependent manner. Based on these results, in Experi-ment 2, we assessed whether humans, akin to nonhuman
Significance
Whether an odor's perceived valence induces an approachresponse or triggers avoidance is critical for survival, and yetlittle is known about the neural mechanisms supporting thisdecision. Using electrophysiological measures from thehuman olfactory bulb (OB), the first processing stage of theolfactory system, and measures of full-body movement, weprovide evidence that this process is initiated in the humanOB. We demonstrate that odor valence is associated withboth gamma and beta activity in the OB. Furthermore, weshow that unpleasant odors have privileged temporal OBaccess, as indicated by early beta activity that is linked to apreparatory neural motor response in the motor cortex,which, in turn, is associated behaviorally with a fast full-body avoidance response.
Author contributions: B.I., D.A.W., A.A., and J.N.L. designed research; B.I. and M.S.performed research; B.I., M.S., A.A., and J.N.L. analyzed data; B.I., M.S., D.A.W., A.A.,and J.N.L. wrote the paper; and J.N.L. provided funding and resources.
The authors declare no competing interest.
This article is a PNAS Direct Submission.
This open access article is distributed under Creative Commons Attribution-NonCommercial-NoDerivatives License 4.0 (CC BY-NC-ND).1A.A. and J.N.L. contributed equally to this work.2To whom correspondence may be addressed. Email: [email protected] [email protected].
This article contains supporting information online at http://www.pnas.org/lookup/suppl/doi:10.1073/pnas.2101209118/-/DCSupplemental.
Published October 13, 2021.
PNAS 2021 Vol. 118 No. 42 e2101209118 https://doi.org/10.1073/pnas.2101209118 j 1 of 12
PSYC
HOLO
GICALAND
COGNITIVESC
IENCE
S
Dow
nloa
ded
by g
uest
on
Oct
ober
20,
202
1

animals (10), demonstrate a rapid, full-body approach/avoid-ance response to odors in a valence-dependent manner in thetime period predicted by Experiment 1. We found that partici-pants rapidly moved away from a negative odor source. Inter-estingly, only unpleasant odors produced a consistent motorresponse, and, importantly, this response aligned temporallywith the valence-associated activity in the OB demonstrated inExperiment 1.
ResultsEarly Phase–Amplitude Coupling between Beta and Gamma in OB.Odor-evoked neural signals in response to six odors with vary-ing valence were recorded from 4 electrodes located directlyabove the eyebrows, which, in combination with 64 electroen-cephalogram (EEG) scalp electrodes, were used to extractsource space electrobulbogram (EBG) (9) signals from the OB(Fig. 1A). Inhalation phase-locked odor stimuli were deliveredusing a sniff-triggered, computer-controlled, and temporallyprecise olfactometer (11). Odor delivery delay (∼200 ms) wasmeasured with a photoionization detector and adjusted for inall analyses (12). After each odor stimulus, participants ratedperceived odor intensity, valence, and familiarity. A total of 19participants participated in 3 separate and seemingly identicalsessions, comprising a total of 540 trials per participant. Next,we removed trials with artifacts including muscle and blink (seeMethods for details) by which an average of 27.92 6 10.49 cleantrials per odor were included in the analysis for each individual.Hence, considering all six odors, the total number of trials foreach individual included in our analyses was on average 167.526 25.81. More importantly, there was no statistical difference
between the number of trials across odors, F(5, 108) = 0.39,P > 0.86, indicating that after artifact rejection, the experimen-tal design remained balance.
We have previously established that the EBG measure is avalid and reliable measure of OB processing (9), but prior toour main analysis, we estimated the quality and spatial disper-sion of the reconstructed OB signal within this unique dataset.To this end, we used a simulation where the spatial dispersionof three levels of signal-to-noise-ratio were assessed, namely ahypothetical ideal, the empirical level, and twofold lower (i.e.,twofold larger noise level) than empirical level. This analysisconfirmed that our source reconstruction method can success-fully isolate OB’s EBG signal in source space given that thespatial gain was similar to the hypothetical ideal conditionwhen assessing a signal-to-noise ratio similar to what we empir-ically observed in the current dataset (SI Appendix, Fig. S1).
To allow direct comparisons between neural and behavioraldata, we used representational similarity analysis (RSA)—amultivariate method that compares similarity (e.g., correlation)matrices between continuous relationships to determine therepresentational geometry on the individual level (13), there-fore allowing direct comparisons between different parameterswithout being hindered by difference in scaling and other inher-ent differences between measuring techniques. In this case, weassess how well a perceptual feature can be decoded from neu-ral activity (presented as degree of similarity between measures’representational dissimilarity matrix [RDM]). The perceptualand neural population RDMs were initially derived on the indi-vidual level as relationship-distances between individual odors,separately for perceptual and neural space, and later assessedfor similarities between them in group-level analysis (14). In
Fig. 1. Early PAC between beta and gamma in the OB. (A) Methodological summary of Experiment 1, where individuals (n = 19) were tested duringthree separate sessions that were subsequently merged. Source reconstruction was performed using the EEG/EGB electrodes in combination with a multi-spherical head model and digitalized electrode positions to extract OB time course. RDMs were constructed for both OB neural signals and perceptual rat-ings; subsequent partial Pearson correlations were derived for each time point from all possible permutations. (B) Group mean perceived valence ratingsof the six odors in Experiment 1. Individuals’ mean ratings are indicated with filled circles. Note that for analyses, valence ratings of each individual wereused to create a common structure with the DISTATIS method (14). Error bars represent SEM. (C) Heat map showing the strength of PAC as function oftime. Compared to background, a significant coupling around 53 to 65 Hz (significant results assessed with permutation testing and marked with blackboundaries) starts around 250 ms after odor onset. (D) The comodulogram between the beta and gamma bands (∼53 to 65 Hz) during the whole 1 sindicates that the coupling appeared in the beta band around ∼16 to 18 Hz. Significant peak marked with asterisk and assessed with Student’s t test. Thestatistical threshold for detecting significance (t = 1.96 equal to P < 0.05) is marked with a gray dashed line. FP denotes frequency of slower oscillation orfrequency phase.
2 of 12 j PNAS Iravani et al.https://doi.org/10.1073/pnas.2101209118 The human olfactory bulb processes odor valence representation and
cues motor avoidance behavior
Dow
nloa
ded
by g
uest
on
Oct
ober
20,
202
1

other words, for each time point in the OB recording, we assesswhether the relationship between the six tested odors in theneural space is similar to the relationship between ratings ofthe same odors in the perceptual space. Statistical relationshipsare then assessed for the group. Specifically, we compared howodor-induced neural activity in the OB within the gamma andbeta bands corresponds to individual valence ratings of thesame odors (Fig. 1B).
We initially assessed the relationship between activity of thebeta and gamma frequency bands, determining the frequenciescoupled together in OB and later the activity of these frequen-cies to perceived valence in RSA. Phase–amplitude coupling(PAC), a subclass of cross frequency-coupling phenomena, hasbeen identified as a neural mechanism detectable in most mam-mals and critical for information processing in a multitude ofbrain regions (15–20). Here, the phase of the lower frequencyoscillation drives the power of the coupled higher frequencyoscillation. Different functional roles have been attributed toPAC, including sensory signal detection (21), executive func-tions (22), and attentional selection (23). Specifically for olfac-tion, it has recently been demonstrated that PAC in the OBshapes early sensory processing in mice (24). Given this, weexamined PAC between beta and gamma oscillation within theOB and its relation to the processing of the individual’s odorvalence using RSA. To gain a temporal dimension of the PAC,we used time-resolved PAC [t-PAC (25)], a method that alsoincorporates the temporal dynamic of the signal.
As a first step, we assessed the relationship between betaand gamma bands with t-PAC within the first second afterreceiving an odor stimulus to determine whether these fre-quency bands demonstrate PAC and, if so, at which frequen-cies. We found significant PAC between beta and gammaalready at 250 ms after odor onset (∼53 to 65 Hz), as assessedby Monte Carlo permutation test (Fig. 1C; t = 3.85, P < 0.006,and CI = [0.002, 0.006]). Next, we assessed the comodulogrambetween beta and the detected range in gamma oscillations toisolate frequencies of interest in the beta band. We found thatthis coupling operates in the beta band within 16 to 18 Hz (t =2.57, P < 0.009, CI = [0.002, 0.012]; Fig. 1D). The t-PAC andthe comodulogram results guided our subsequent neuronal andvalence RSA analysis by isolating signals of interest.
Early Gamma and Late Beta Activity Relate to Perceived OdorValence. Bandpassed OB reconstructed time courses were trans-formed into a complex signal using Hilbert transform. Bothamplitude as well as phase were used to construct neural andperceptual valence RDMs. This was performed at each timepoint separately for each frequency band (gamma/beta) usingthe Euclidean distance across six odors that varied in valence,resulting in a sequence of RDMs (Fig. 1A). Then, maximumpartial Pearson correlations were calculated by an approximate80-ms-wide nonoverlapping sliding window, sweeping 0 to 1 safter odor onset anchored to inhalation, between two sequencesof RDMs (Fig. 2A). This resulted in a correlation time coursewhile controlling for perceived intensity (Fig. 2B). To test thesignificance of the correlation at each time point controlling forfalse positives, we performed a nonparametric permutation testby which all possible combinations (number of randomizations= 720) were tested for all time points (n = 13) during 1 s andexact P values were computed. We found time points of signifi-cant associations in RSA space between subband of gammaactivity (53 to 65 Hz, consequent to PAC result) and perceivedodor valence around 250 to 325 ms (r1 = 0.60, p1 < 0.010, CI =[0.56, 1]) (Fig. 2B; adjusted for measured olfactometer delay).The distribution and exact P value for the significant instance isshown in Fig. 2C.
Given the association between gamma activity and perceivedvalence, as well as the coupling between gamma amplitude and
phase of beta in the t-PAC analysis, we subsequently assessedthe potential relationship between beta band and perceivedvalence using RSA. The extracted time course of OB was band-passed to align with the results from the previously mentionedcomodulogram PAC (16 to 18 Hz). Similar to gamma, betaoscillation values were extracted and converted into complexsignals using Hilbert transform to estimate instantaneousamplitude and phase values. This was next transformed toRDMs and partial Pearson correlations were performedbetween beta RDMs and valence RDM while controlling forperceived odor intensity, in a similar manner as describedpreviously.
We found that there was a significant association betweenbeta activity and valence in a time interval around ∼800 msafter odor onset (Fig. 2D). In other words, there was an associ-ation between variance in perceived odor valence and variancein beta activity around 800 ms after odor onset in a subbandaround 16 to 18 Hz. Similar to the gamma activity analysis, wetested the statistical significance of the correlations using allpossible permutation tests for each time point within 1 s afterodor onset. Next, we compared each actual correlation with thedistribution derived from the permutation to extract the exact Pvalue (r = 0.65, P < 0.014, CI = [0.59, 1]). The distribution andexact P value for the significant instance is shown in Fig. 2D.
Behavioral studies in humans have demonstrated intensity-dependent regulation of the sniff response amplitude as earlyas 160 ms after odor onset (26), and there are demonstratedlinks between sniff magnitudes and both odor valence (27) aswell as odor intensity (28). Similarly, sniff rhythms have beendemonstrated to regulate OB gamma oscillation in anesthetizedrodents (29). Therefore, to determine whether the discoveredlink between valence ratings and OB activity is potentiallymediated by participants’ sniff patterns, unrelated to the odorpresented, we assessed potential relationships between gammaand beta activity and relevant sniff parameters (sniff trace, i.e.,amplitudes over time; maximum sniff amplitude; and areaunder the curve) using separate Spearman rank correlations.However, our analysis demonstrated that there were no signifi-cant relationships between sniff trace and OB activity in eitherthe gamma or beta bands (SI Appendix, Fig. S2).
Next, we asked whether there were any commonalities in theneural representations of odor valence in the aforementionedidentified gamma and beta bands. To this end, the group-leveldistance matrices of gamma and beta (RDMs) at the identifiedtime periods were scaled down using the first two eigenvectors(principal component [PC]) to create two-dimensional (2D)representations. For the gamma band, valence seemed to besomewhat linearly organized along the first PC (PC1), whereasthere was no obvious valence-dependent organization along thesecond PC axis (PC2) (Fig. 3A). For the beta band, there was areverse relationship as well as a linear linkage between valenceorganization between the PC1–PC2 dimensions. To investigatestatistically which frequency band best explained most of theindividual’s valence ratings, we first determined whether theorganization of the odors within the 2D projections formedclusters. To this end, the RDMs were first converted to similar-ity matrices and communities were evaluated using a Newmanalgorithm (30). Odor valence ratings were hierarchicallyclustered from one to six clusters, and we found the elbow ofmodularity index (Q) graph at three, which indicates that athree-cluster solution best explains valence ratings (Fig. 3B).On the neural data, we subsequently derived a modularity index(Q) for each of the gamma and beta correlation peaks giventhe three clusters determined by hierarchical clustering ofvalence ratings and normalized their values to a correspondingnull model from 5,000 random rewirings (31). We found thatthe beta band had a larger Q-value than the gamma band,meaning that the odors formed the most coherent pleasant and
PSYC
HOLO
GICALAND
COGNITIVESC
IENCE
S
Iravani et al.The human olfactory bulb processes odor valence representation andcues motor avoidance behavior
PNAS j 3 of 12https://doi.org/10.1073/pnas.2101209118
Dow
nloa
ded
by g
uest
on
Oct
ober
20,
202
1

unpleasant clusters here. This indicates that more detailedinformation of participants’ subjective valence ratings can beobtained from the beta frequency band rather than the gammaband (Fig. 3C). We then statistically assessed whether theobtained modularity indexes were significantly different from
the null model using 5,000 Monte Carlo permutations tests. Wefound that the modularity index for beta was significantly largerthan for gamma (Z = 2.95, P < 0.003, CI = [0.009, 0.018]).
These results suggest that the final odor valence perception canbest be explained by processing in the beta band. Our analyses so
A
B C
D E
Fig. 2. OB activity in the gamma and beta band relates to valence perception. (A) Example of relationships between valence and OB activity in RSAspace. (B) Partial Pearson correlation time course between activity of gamma and valence on the group level. All possible permuted partial Pearson corre-lation of gamma activity and valence indicated significant correlations at a time point ∼250 to 325 ms after odor onset (P < 0.010). (C) Distribution of allpossible permutations for the significant instances and actual correlation indicated with red closed circles. (D) Correlation time course of beta activity inthe OB and odor valence RDMs indicating a significant relationship with valence perception around 800 ms after odor onset. (E) Distribution of all possi-ble permuted partial Pearson correlation of beta activity and valence ratings for time points centered around 800 ms (P < 0.014). Red closed circle showsthe actual correlation within the permutation distribution.
4 of 12 j PNAS Iravani et al.https://doi.org/10.1073/pnas.2101209118 The human olfactory bulb processes odor valence representation and
cues motor avoidance behavior
Dow
nloa
ded
by g
uest
on
Oct
ober
20,
202
1

far have, however, assessed odor valence by forcing ratings into asingle continuous dimension or into three clusters and used thesecontinuous parameters to assess organizational relationshipsbetween odor perception and neural activity. This approachmeans that we cannot assess whether either one of the contrastingvalence dimensions (pleasant or unpleasant) contribute more tothe OB processing. It has been argued that positive and negativevalence is separated in a 2D space (32), and a common approachin past studies has been to assess valence using a dichotomizeddesign where groups of odors that differ in their rated valence(labeled as pleasant and unpleasant) are contrasted. To facilitatean assessment of whether there are differences in processingbetween pleasant and unpleasant odor in the OB, we comparedOB processing of the two most pleasant odors against the twomost unpleasant odors, eliminating the two neutral middle odors,all based on the individual’s own valence rating. When contrastingthe two odor valence categories, we found that negative odorsproduced a greater synchronization response in the early portionof the beta band (around 50 to 200 ms, t = 3.01, P < 0.004, proba-bility CI range = 0.004), whereas positive odors produced agreater synchronization response in the late beta band (around690 to 780 ms, t = 3.49, P < 0.002, probability CI range = 0.003)determined by 5,000 Monte Carlo permutation tests.
The separation in processing between the two valenceextremes demonstrated that negative odors produced a morepronounced activity in the early beta band. We hypothesizedthat this early processing might indicate the cuing of an earlyavoidance response. This would align with behavioral data inhumans that have shown that an odor associated with threatelicits a full-body motor avoidance response (10). If thishypothesis is valid, we should observe odor valence-dependentmodulation of preparatory motor responses over the motor cor-tex in the time interval of these OB responses. Specifically, wehypothesized that we would observe greater power in the murhythm over the motor cortex for negative odors. Desynchroni-zation in mu rhythm has previously been demonstrated to be ameasure of preparatory motor responses to salient stimuli (33,34), whereas inhibition of motor behavior yields synchroniza-tion in mu rhythm (35, 36). To this end, the mu rhythm for twoextremes was assessed on the whole scalp, where we foundgreater power over the motor cortex (electrode C2: t = 2.17,P < 0.014, probability CI range = 0.003; electrode C4: t =3.00, P < 0.003, probability CI range = 0.001; electrode CP2:t = 2.01, P < 0.022, probability CI range = 0.004; electrodeCP4: t = 3.27, P < 0.001, probability CI range = 0.001; elec-trode CP6: t = 2.23, P < 0.012, probability CI range = 0.003).
A
D E F
B C
Fig. 3. OB activity in the late-occurring beta band is more similar to subsequent perceptual ratings than activity in the early-occurring gamma band. (A)Odors placed within the 2-dimensional PC space, derived from peak values within detected significant peaks in Fig. 1 B and D, separated by frequencyband. Observe the linear alignment between perceived odor valence and placement in PC space for the beta band. Odor names are written using abbrevi-ations: Li (linalool), 2PE (2-phenyl ethanol), EB (ethyl butyrate), 1O3 (1-octen-3-ol), and DD (diethyl disulfide). Color code indicates average perceivedvalence where green colors denote positive valence and red/yellow colors denote negative valence. See Fig. 1B for absolute valence ratings. (B) Hierarchi-cal clustering valence rating from 1 to 6 clusters. The elbow of the graph is shown with a red closed circle. (C) Newman modularity index demonstratesthat mean Q-values are larger for beta synchronization, indicating that a more detailed odor valence readout can be inferred from this time point. Errorbar shows 95% CI for 5,000 permutations, and ** in C indicates P < 0.01. (D) t-contrast map indicated more beta power during early time points and lessbeta power during late time points for the two most unpleasant odors compared to two most pleasant odors. (E) Topographical map of mu rhythm illus-trates higher values for unpleasant compared to pleasant odors over motor cortex during intervals of 300 to 400 ms. (F) Source of mu rhythm was local-ized to the right motor cortex (x 27, y �35, z 60) using eLORETA during the time interval displayed in E, i.e., 300 to 400 ms after odor onset.
PSYC
HOLO
GICALAND
COGNITIVESC
IENCE
S
Iravani et al.The human olfactory bulb processes odor valence representation andcues motor avoidance behavior
PNAS j 5 of 12https://doi.org/10.1073/pnas.2101209118
Dow
nloa
ded
by g
uest
on
Oct
ober
20,
202
1

Next, we localized the source of the mu rhythm using extra low-resolution electromagnetic tomography (eLORETA) and founda cluster around the right motor cortex (x 27, y �35, z 60)where the dipole voltage density was 12% stronger for unpleas-ant compared to pleasant odors. Furthermore, for negativeodor trial (defined as 1.5 SD below the group mean), weextracted valence ratings and odor-induced responses and sub-sequently assessed the effect on mu rhythm for each trial usinga generalized linear model with Valence and Intensity as pre-dictors. The group effect of Valence to predict mu power wasfinally estimated for each electrode using a Student’s t test. Inline with our hypothesis, negative odor valence was related tomu rhythm power over the motor cortex in the time period ofinterest (250 to 450 ms after odor onset, the interval wasselected slightly larger to increase frequency specificity), elec-trode CP2: t(18) = �2.23, P < 0.038, CI = [�1.39, �0.04] andelectrode FC4: t(18) = �2.32, P < 0.032, CI = [�0.92, �0.046](SI Appendix, Fig. S3). In other words, the more negative anodor was perceived, the more mu power over the motor cortexwas observed in the time period of the early OB processing.
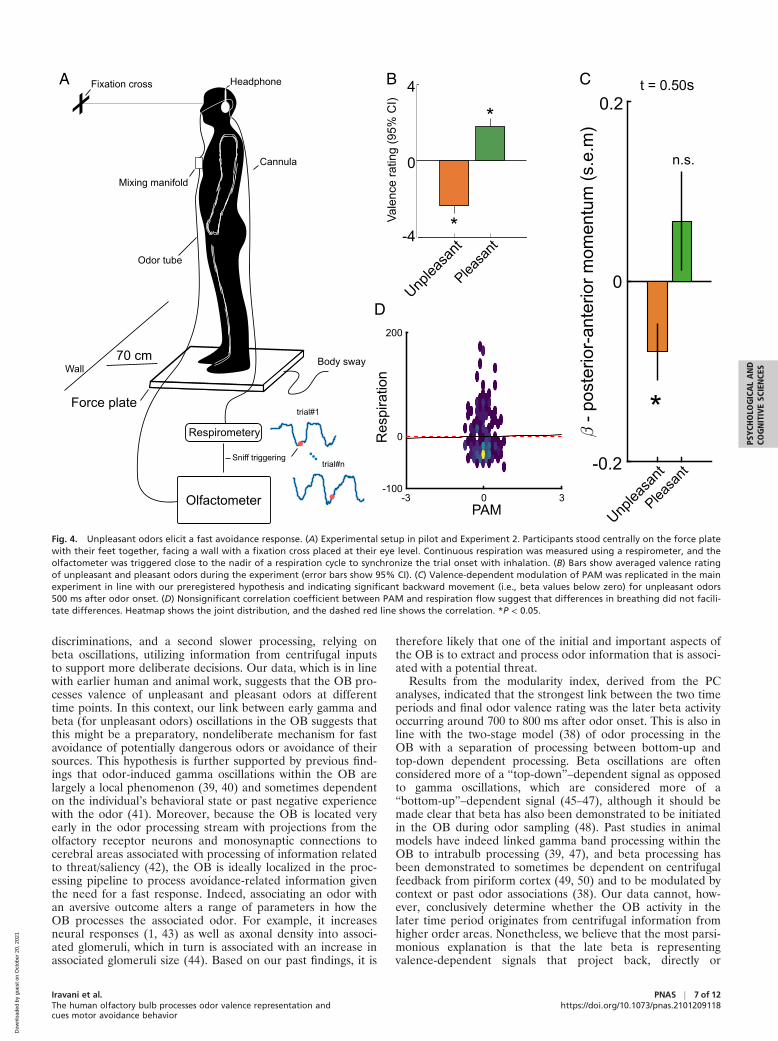
Unpleasant Odors Elicit a Fast Avoidance Response. Our results sofar have suggested that processing in the human OB is attunedto odor valence and that there is a link between processing inthe OB and motor cortex activity in a valence-dependent man-ner. These results suggest an association between valence proc-essing of negative odors in the OB and an early avoidanceresponse. In other words, if the results obtained in Experiment1 are valid, when a negative odor stimulates the OB, a behav-ioral avoidance response should be initiated by the motorsystem in the time period shortly after the demonstrated muactivity, i.e., 400 ms plus motor response time. To directly testthis prediction, in Experiment 2, we sought to determinewhether odor valence initiates an approach–avoidanceresponse. Specifically, we wanted to determine whether thisresponse is linked in time to the early time period where associ-ations between OB processing and valence perception werefound as well as a functional gating was demonstrated betweenthe OB and the motor cortex in the mu band. We operational-ized approach–avoidance motor responses as posterior-anteriorangular motion, derived from normalized responses from aforce plate that measures participants’ whole-body microsway(Fig. 4A). We hypothesized that a negative odor would elicit anavoidance response, manifested by the initiation of a backwardmotion in the early time period of interest. The body microswaywas measured as posterior-anterior angular motion that wasnormalized to the height of individuals and bandpass filtered toproduce posterior-anterior momentum (PAM). Two pleasantand two unpleasant odors, with averaged valence ratings illus-trated in Fig. 4B, were presented using sniff-triggered olfactom-etry, identical to what is described for Experiment 1.
We first performed a pilot experiment (n = 21) to allow us todetermine the time point(s) of interest for analyses of PAMresponses in a nonbiased manner, to preregister our hypothesisand analyses, and, importantly, to establish known priors forsubsequent Bayesian analyses. To this end, we assessed fivetime points of interest: 0.25 s (at the time of gamma process-ing), 0.5 s (the hypothesized period of interest, gamma +response time, based on results in Experiment 1), 0.75 s (at thetime of the beta processing), 1.0 s (at the time of beta process-ing + response time), and 1.25 s after odor onset across thepleasant and unpleasant odor conditions (SI Appendix, Fig.S4A). These time points were selected to cover the full odorpresentation with additional motor response time factored in.Within a linear mixed effect model (LMM) statistical model,with participant as intercept and conditions as random slope,we found a significant main effect for conditions only at thetime point 0.5 s after odor onset, t(61) = 2.13, P < 0.037, CI =
[0.01, 0.04], with no other significant effects at other time points(SI Appendix, Fig. S4B). Subsequent Student’s t tests against 0(standing straight) demonstrated that the backward motion inresponse to negative odors was significant, t(61) = 2.06, P < 0.04, CI = [�0.28, �0.04], but without a potential forwardmotion in response to a positive odor, t(61) = 0.64, P > 0.74,CI = [�0.19, 0.39].
In the main experiment (Experiment 2; n = 44), we focusedour analyses on the time point identified in the pilot experi-ment—all other aspects but the sample size remained identical.We selected the sample size based on an estimated effect sizeof 0.3 (derived from the pilot experiment) and required power0.95, alpha error probability 0.05, and a correlation amongmeasures of 0.4—this yields a suggested sample size of 44 par-ticipants to enable a strong prediction. All hypothesis and anal-yses were preregistered at https://aspredicted.org/fk9gw.pdf.
We could replicate the result demonstrated in the pilotexperiment with a significant difference between the two odorcategories at time point 0.5 s after odor onset, t(174) = 3.24,P < 0.001, CI = [0.06, 0.23] (Fig. 4C). Given the fact that forExperiment 2 we had a known prior from an independent data-set (result from the pilot experiment), we further explored thiseffect using Bayesian statistics. The Bayesian analyses sup-ported results obtained with frequentist methods. We foundthat our analyses gave substantial support for a differencebetween the two parameters (Bf10 = 3.32; SI Appendix, Fig. S5).However, these analyses assess potential differences betweenthe two odor categories, whereas results from the pilot experi-ment indicate that effects are mediated mainly by negativeodors. When assessing each odor valence category separatelyagainst no movement using a one-sided Student’s t test withdirectionality based on the preregistration, there was onceagain only a statistically significant effect for the negative odorsto elicit a backward motion, t(174) = 2.47, P < 0.007, CI =[�∞, �0.016], and no significant effect for the positive odors,t(174) = 1.22, P > 0.11, CI = [�0.04, +∞].
We then assessed whether the difference between odorvalence in PAM was mediated by a potential difference in respi-ratory flow, a parameter that previously has been demonstratedto be linked to odor valence (37). However, we found no corre-lation between the respiration flow and PAM at the time pointof interest (0.5 s), rho = �0.02, P > 0.75, (Fig. 4D). Moreover,to verify the lack of dependency, we assessed the null effectusing Bayesian statistics with the known priors. These analysesalso supported the conclusion that PAM and respiration werenot interdependent (SI Appendix, Fig. S6).
DiscussionWe here demonstrate that neural activity in the human OB islinked to perceived odor valence. Specifically, we found thatthe OB processes odor information sequentially within twotime periods: First, a brief period of initial gamma activityacross the valence dimension and a temporally privileged earlybeta activity for unpleasant odors, both indirectly linked to thecuing of a motor avoidance response. Second, there was a laterperiod of beta processing that was linked to the linear forma-tion of the final subjective valence percept of the presentedodor. These results indicate that one of the initial and primaryfunctions of the OB is to process early odor-based valenceinformation, potentially to extract early odor-based warningsignals.
The observation that odor valence was processed in thehuman OB mainly during two time points, one early and onelate stage, is in line with the two-stage model of odor processingin the OB suggested by Frederic et al. (38). They specificallydemonstrated that the OB first executes a fast processing, rely-ing on gamma oscillations, allowing the individual to make fast
6 of 12 j PNAS Iravani et al.https://doi.org/10.1073/pnas.2101209118 The human olfactory bulb processes odor valence representation and
cues motor avoidance behavior
Dow
nloa
ded
by g
uest
on
Oct
ober
20,
202
1
discriminations, and a second slower processing, relying onbeta oscillations, utilizing information from centrifugal inputsto support more deliberate decisions. Our data, which is in linewith earlier human and animal work, suggests that the OB pro-cesses valence of unpleasant and pleasant odors at differenttime points. In this context, our link between early gamma andbeta (for unpleasant odors) oscillations in the OB suggests thatthis might be a preparatory, nondeliberate mechanism for fastavoidance of potentially dangerous odors or avoidance of theirsources. This hypothesis is further supported by previous find-ings that odor-induced gamma oscillations within the OB arelargely a local phenomenon (39, 40) and sometimes dependenton the individual’s behavioral state or past negative experiencewith the odor (41). Moreover, because the OB is located veryearly in the odor processing stream with projections from theolfactory receptor neurons and monosynaptic connections tocerebral areas associated with processing of information relatedto threat/saliency (42), the OB is ideally localized in the proc-essing pipeline to process avoidance-related information giventhe need for a fast response. Indeed, associating an odor withan aversive outcome alters a range of parameters in how theOB processes the associated odor. For example, it increasesneural responses (1, 43) as well as axonal density into associ-ated glomeruli, which in turn is associated with an increase inassociated glomeruli size (44). Based on our past findings, it is
therefore likely that one of the initial and important aspects ofthe OB is to extract and process odor information that is associ-ated with a potential threat.
Results from the modularity index, derived from the PCanalyses, indicated that the strongest link between the two timeperiods and final odor valence rating was the later beta activityoccurring around 700 to 800 ms after odor onset. This is also inline with the two-stage model (38) of odor processing in theOB with a separation of processing between bottom-up andtop-down dependent processing. Beta oscillations are oftenconsidered more of a “top-down”–dependent signal as opposedto gamma oscillations, which are considered more of a“bottom-up”–dependent signal (45–47), although it should bemade clear that beta has also been demonstrated to be initiatedin the OB during odor sampling (48). Past studies in animalmodels have indeed linked gamma band processing within theOB to intrabulb processing (39, 47), and beta processing hasbeen demonstrated to sometimes be dependent on centrifugalfeedback from piriform cortex (49, 50) and to be modulated bycontext or past odor associations (38). Our data cannot, how-ever, conclusively determine whether the OB activity in thelater time period originates from centrifugal information fromhigher order areas. Nonetheless, we believe that the most parsi-monious explanation is that the late beta is representingvalence-dependent signals that project back, directly or
A B
D
C
Fig. 4. Unpleasant odors elicit a fast avoidance response. (A) Experimental setup in pilot and Experiment 2. Participants stood centrally on the force platewith their feet together, facing a wall with a fixation cross placed at their eye level. Continuous respiration was measured using a respirometer, and theolfactometer was triggered close to the nadir of a respiration cycle to synchronize the trial onset with inhalation. (B) Bars show averaged valence ratingof unpleasant and pleasant odors during the experiment (error bars show 95% CI). (C) Valence-dependent modulation of PAM was replicated in the mainexperiment in line with our preregistered hypothesis and indicating significant backward movement (i.e., beta values below zero) for unpleasant odors500 ms after odor onset. (D) Nonsignificant correlation coefficient between PAM and respiration flow suggest that differences in breathing did not facili-tate differences. Heatmap shows the joint distribution, and the dashed red line shows the correlation. *P < 0.05.
PSYC
HOLO
GICALAND
COGNITIVESC
IENCE
S
Iravani et al.The human olfactory bulb processes odor valence representation andcues motor avoidance behavior
PNAS j 7 of 12https://doi.org/10.1073/pnas.2101209118
Dow
nloa
ded
by g
uest
on
Oct
ober
20,
202
1

indirectly, from other cerebral areas, such as the orbitofrontal,amygdala, and piriform cortex. These projections would thenhelp shape the final interpretation of the odor by adding infor-mation of past experiences (51) as well as information aboutthe odor object per se (52–54)—two factors that are known tostrongly influence the final odor valence percept (4, 55). None-theless, the analysis we performed in this study was unable todemonstrate directionality and future studies need to deter-mine this specific question.
In our data, the early gamma and beta power in the OBseem specifically attuned to the processing and perception ofnegative odor valence with no clear demonstration that the OBprocesses odors associated with a positive outcome at earlytime points. This finding is in line with findings in rodents indi-cating that the anterior OB is processing negative or aversiveodors, whereas odors with a positive valence are processedmainly within an area downstream from the OB, the olfactorytubercle (56, 57), an area that does not have centrifugal directconnections with the OB (58). Whether this region-specificvalence separation in processing also occurs in humans is notknown. However, a recent study on human participants demon-strated that, akin to rodents, pleasant but not negative odorsare preferentially processed in the olfactory tubercle (59).Moreover, intracranial electric stimulation of the OFC, an areapreviously linked to odor valence processing in humans, couldonly produce pleasant odor experiences (60). This separationbetween valence extremes support the 2D valence hypothesispostulating that odor valence perception is not represented bya unidimensional spectrum, ranging from unpleasant to pleas-ant. Instead, a 2D space where positive and negative valence isseparated with neutral valence as the start point has been sug-gested (32). This has also been supported by data on thesemantic distribution of odor descriptors that are commonlydivided into a positive and a negative category (32, 61). In con-trast to the demonstrated increase in beta frequency for odorswith more negative valence as compared to odors with morepositive valence, we did not find an association between valenceand beta activity when assessing links in RSA space using a lin-ear approach in early time points. A possible explanation forthis discrepancy might be that our t-PAC finding suggests thatthe detailed odor valence information for beta is reflected inphase and not amplitude in early time periods of OB process-ing of the odor. Hence, it is possible that the lack of linear asso-ciation between neural activity in beta band and odor valencein RSA space during early time points is due to our finding thatonly phase, but not amplitude, based on PAC coupling, islinked to gamma, thereby suggesting that the coupling of ampli-tude is critical for finding linear associations in RSA space.Similarly, our present method may not be able to capture thatthe OB also processes positive valence during early time pointsdue to the range of our odors used where only some mean indi-vidual ratings reached above 70 on the 0 to 100 scale (Fig. 1B).
When studying OB function, a confounding factor is the pos-sible effect of respiration change, modulated by odor valence.Past studies demonstrate that unpleasant odors can modulatethe sniff magnitude (62), which in turn affects OB activity (63).Hence, a negative odor can indirectly change OB activity bymere modulation of respiration and not directly through recep-tors. That said, both animal (64) and intracranial recordings inhumans (65) demonstrate that respiration mainly affects slowerfrequencies in the theta/delta bands in the brain. When consid-ering the fact that oscillations in the present data (i.e., gamma/beta) are well separated from theta/delta bands and that nochanges were found in breathing parameters between odors (SIAppendix, Fig. S3), it is unlikely that our findings are signifi-cantly affected by potential differences in respiration. It shouldfurther be noted that the EBG method requires that partici-pants are in a nutrition-deprived state to maximize signals from
the OB, which might have an impact on the obtained results (9,66, 67). However, this later aspect of the method can also meanthat the potential perceived reward of the odor would increaseand therefore also maximizes the likelihood of finding effectsfor positive odors. Future studies where odors are eitherindividually selected based on their reward properties or condi-tioned with positive outcome are needed to conclusively deter-mine whether the human OB prioritizes processing negativeodor valence.
Results in Experiment 1 suggested the existence of anapproach/avoidance motor response occurring around 500 msafter odor onset in a valence-dependent manner. In two sepa-rate experiments (pilot and Experiment 2) and using a designwith preregistered hypotheses and analyses, we demonstratehere that odors with a negative valence triggered an avoidanceresponse that was manifested as leaning away from the odorsource. We have previously demonstrated a similar fast avoid-ance response in human participants to the odor of blood (10),an odor that is treated as an approach or avoidance triggeracross species. Our current findings extend these results andsuggest that odor avoidance in humans might extend beyondbiologically important and potentially inherent signals and be ageneral phenomenon that is linked to the valence of the odorper se. Negative odors induced larger mu desynchronizationover and within the motor cortex, which is a response that pre-viously has been demonstrated to be a measure of preparatorymotor responses to salient stimuli (33, 34). Although specula-tive, this mu desynchronization appeared in a time period that,when response time is factored in, corresponds to the motoravoidance response to negative odors demonstrated in Experi-ment 2. Moreover, this motor cortex response to the negativeodors appeared around 150 ms after the valence-relatedincrease in gamma and early beta activity within the OB,thereby allowing the signal time needed to transmit the infor-mation between the OB and motor cortex. For neutral andpleasant odors, a similar motor movement would probably berelated to later processing. In line with this notion, rodents per-forming a Go, No-Go task with positive reinforcement exhibitsimultaneous activity in the piriform cortex and primary motorcortex just before executing a motor response for the Go trials.Importantly, while these responses are seen in low and highgamma, as well as beta activity, they are only present during thesecond and the third and final sniff (68). For the first sniff(equivalent to the data in our study), there was, however, noresponse related to the motor cortex for the rewarded Go trials.This indicates that for neutral and pleasant odors, as comparedto unpleasant, a top-down regulation from olfactory cortex andmotor cortex directly to the OB is more evident (68). Ourresults suggest that the olfactory and motor systems are alsomore closely linked in humans than has previously been appre-ciated and that this, especially for unpleasant odors, may becued at the OB level.
It should be noted that while our results demonstrate thatthe human OB processes subjective odor valence, it does notsuggest that the OB is the first processing stage of valence.Multiple studies in humans and nonhuman animals alike showthat an odorant’s valence partially depends on its physicochemi-cal properties (69–75). Physicochemical properties have beenshown to predict olfactory receptor neuron activation, andbased on this, it has been suggested that odor valence is, atleast partially, coded at the level of the olfactory epithelium(74). Because the six odors in Experiment 1 were selected fromthe DREAM challenge (75) to span the physicochemicalvalence space, our OB activations may to some extent reflectinformation from physicochemical properties originating fromreceptor neurons projecting upstream to the OB (76). It is stillan open question if a peripheral valence code originating fromphysicochemical properties reaches the OB and if the OB in
8 of 12 j PNAS Iravani et al.https://doi.org/10.1073/pnas.2101209118 The human olfactory bulb processes odor valence representation and
cues motor avoidance behavior
Dow
nloa
ded
by g
uest
on
Oct
ober
20,
202
1

turn refines the signal or keeps it unchanged. It should, how-ever, be noted that all results linking odor valence to OB proc-essing are based on the individual’s own valence rating and notan a priori defined valence rank among the included odors.Specifically, we show that perceived pleasantness is representeduniformly across participants in the bulb at specific timeperiods and frequencies in a manner that is represented by sub-jective perception and not predefined odor classification. Thissuggests that valence is processed and not merely manifestedby odor identity. Valence ratings are, to a nontrivial degree,dependent on personal experiences. Indeed, when we assessthe relationship between individual’s RDM of odor valence rat-ings and that of the full group, the mean similarity is 61.6%,which means that about 38.2% of the total variance in thesevalence ratings (in this case, valence ranking) is explained byindividual differences. Our choice of methods thereforereduces, but does not eliminate, the potential impact physico-chemical properties might have on our results in favor of sub-jective valence perception.
Even though we can demonstrate links between the OB andthe motor cortex in a relevant time period, it should be notedthat our whole-body avoidance results are only indirectly linkedto the EEG data. For it to be directly linked, it would requireassessing EEG source signals from individuals who are freelymoving around, which is not possible with current methods formeasuring OB responses because the active electrodes stronglyamplify motion artifacts. To the best of our knowledge, nomethod currently exists that would allow measures from the OBwhile participants moved their full body. Moreover, it is impor-tant to highlight that our data only covers the first sniff of anunannounced odor. As demonstrated in rodents, OB processingis continuously updated with each continuous sniff with markedshifts in both neural and behavioral responses (68, 77, 78).
In summary, our results suggest that the human OB processesodor valence. We propose that the two stages of processing ofvalence in the OB are due to a reciprocal process where the ini-tial fast gamma and beta response address negative odors basedon valence information that may be projected from the olfactoryreceptor neurons (69) or learned from past aversive experiencesalready coded in the OB (1). In contrast, the later beta responseseems more related to the final valence rating of the odor as wellas potential preparation of the OB’s initial gamma and subse-quent beta responses for the second sniff of the same odor. Atthis stage, the OB should be influenced by information related topast experiences with the identity of the odor. Importantly, nega-tive odors seem to have privileged temporal access in the humanOB. This suggests that one of the initial functions of the OB is toprocess and extract early odor-based warning signals to aid theindividual’s approach–avoidance decisions.
MethodsExperiment 1: Valence Decoding from Oscillations within the OB.Participants. In Experiment 1, 19 individuals (mean age 28.88 6 4.52,7 women) who reported being healthy, nonsmokers, and with no history ofhead trauma or neurological disorders participated in three separate record-ing sessions (all identical). Prior to inclusion, a working sense of smell wasconfirmed in all participants using a five item, four alternative, cued odoridentification test (79). All participants cleared the cutoff for inclusion of atleast three correct answers. Given the scarcity of functional anosmia in theparticipants’ age range, the probability that we erroneously included individu-als with anosmia in the experiment is less than 0.05%. The study was approvedby the national Swedish Ethical Review Authority (EPN: 2016/1692-31/4), andall participants signed informed consent prior to participation.Chemicals and odor delivery. In Experiment 1, six odorants were used,namely linalool, ethyl butyrate, 2-phenyl-ethanol, 1-oceten-3-ol, octanoicacid, and diethyl disulfide (SI Appendix). Odors were delivered birhinally usinga computer-controlled olfactometer (11), and each odor was presented 20times in each session to participants (i.e., 60 times in total for each odor acrossthe three sessions). The olfactometer has an onset time of 200 ms, measured
from computer trigger to odor delivered in the nose, and a sharp rise time tofacilitate an odor presentation with high temporal precision (11). A total flowrate of 3 L/min inserted into a constant 0.3 L/min flow to prevent tactile sensa-tion of odor onset was used. To further avoid participants predicting odoronset but ensure a clear percept, odor onset was (unbeknownst to the partici-pants) triggered by their own sniff cycle. When the assigned intertrial interval(10 s) had occurred, an odor was triggered at the nadir of the inhalation phasein the sniff cycle following that interval, thus ensuring odor presentation atinhalation. A relatively long intertrial interval was used to lower the risk ofodor habitation. Participants’ sniff cycle was measured by thermopod (Experi-ment 1) and respirometer (Experiment 2) sampling at a rate of 400 Hz (Power-lab 16/35, ADInstruments), and respiration traces for triggering of odor wereanalyzed online by LabChart recording software (ADInstrument). Data weresubsequently down-sampled offline to 40 Hz and processed in MATLAB 2018afor further analyses.Procedure. To allow us to collect a large data set for each individual, each par-ticipant participated in three sessions on separate days with at least 1 d and atthe most 1 mo apart. Each session consisted of three 15-min long blocks with5-min break between each to limit odor adaptation/habituation, totalingabout 1 h per session. Participants were presented with the six different odorsin a random order and after each odor presentation, they rated how pleasantand intense they perceived the presented odor to be. Ratings were done byplacing a marker on a labeled visual analog scale presented on the screenranging from 0 (very unpleasant/very weak) to 100 (very pleasant/very strong).Electroencephalography, EBG, neuronavigation measurement. Sixty-fourEEG scalp electrodes were placed according to international 10/20 standardand an additional four EBG electrodes on the forehead (9). Signals were sam-pled at 512 Hz using active electrodes (ActiveTwo, Bio-Semi) and the recordingfrom both 64 EEG and 4 EBG electrodes was used to interpolate surface poten-tials on scalp as well as forehead. Subsequently, these recordings were used toreconstruct OB time course on the source level. Electrode offsets were manu-ally checked prior to experiment onset, and electrodes were adjusted untilmeeting the a priori established criteria (<40 mV). Next, the position of all theelectrodes in stereotactic space was determined using an optical neuro-navigation system (Brain-Sight, Rogue Research); for more details, please seeref. 9.EBG/EEG data analysis. Preprocessing. Data were epoched from 500 ms pres-timulus to 1,500 ms poststimulus, rereferenced to average of activity at allelectrodes, linear phase bandpass filtered at 1 to 100 Hz (Butterworths fourthorder), and power-line interference filtered using discrete Fourier transformfiltering at electrical frequency (50 Hz) to remove power-line noise. Trials withlarge muscle and eye blink artifacts were identified with an automatic algo-rithm. The artifact detection protocol consisted of bandpass filtering usingButterworth filter (fourth order), Hilbert transform to extract amplitude val-ues, and z-scoring. Trials with z-values above 4 were marked and removedfrom further analysis.
OB time course extraction. To extract OB’s response time course, digitizedelectrode positions were first used to coregister the participant’s head to adefault Montreal Neurological Institute (MNI) brain using a six-parameteraffine transformation. Second, a headmodel was constructed based on amul-tishell spherical headmodel. Spherical volume conductors were considered forscalp, skull, gray matter, and white matter with the conductivity of 0.43, 0.01,0.33, and 0.14 (9). The covariance matrix of 64 scalp and 4 EBG electrodes dur-ing the 1 s odor presentation were regularized by 10% prior to being fed intoeLORETA algorithm to estimate the time course of the dipole placed in (x6 6,y 30, z �32) on trial level, which corresponds to OB location (9, 80). The maxi-mum projection of the dipoles’ time course over three principal axes wascomputed to serve as OB activity. eLORETA analysis was carried out in theopen-source Fieldtrip toolbox 2018within MATLAB R2019b (81).
Time-frequency analysis of OB signal. After extracting the OB’s responsetime course, we assessed the difference in power evolution of the two mostunpleasant and pleasant odors. The time-frequency map for broadband fre-quencies [1∼100 Hz], with step of 1 Hz and interval [�0.1∼1 s] with step of0.005 s, was estimated using a multitapered sliding window from discrete pro-late spheroidal sequences (DPSS). The window length was adjusted to cover atleast three cycles for each frequency, ranging 0.3∼3 s. Next, the time-frequency map of each trial was assessed and converted to decibels. Finally, tocreate the contrast map, the most unpleasant and pleasant category, eachconsisting of two odors, was determined on the individual level based on par-ticipants’ valence ratings and contrasted against each other.
Mu rhythm and source localization. Similar to time-frequency analysis of OBsignal, the mu rhythm power for all scalp electrodes were estimated using
PSYC
HOLO
GICALAND
COGNITIVESC
IENCE
S
Iravani et al.The human olfactory bulb processes odor valence representation andcues motor avoidance behavior
PNAS j 9 of 12https://doi.org/10.1073/pnas.2101209118
Dow
nloa
ded
by g
uest
on
Oct
ober
20,
202
1

multitapered sliding DPSS widow for mu frequency range [10∼13 Hz] withstep of 0.5 Hz and time interval of 0.3∼0.4 s with step of 0.005 s. Likewise toOB time-frequency analysis, the window lengths were chosen to cover at leastthree cycles of mu rhythm. Next, the mu power for the two most unpleasantand pleasant odors were estimated, baseline corrected, and converted to deci-bels. Finally, a topographical map was created and nonparametric statisticswere performed to create contrast and find channels that were significantlydifferent in mu power. Source localization was performed similar to the OBsource localization, and after coregistration of electrodes to default MNIbrain, a spherical head model with four tissue types was created. The cross-spectral density matrix of electrodes during the 0.3∼0.4 s after the odor onsetwere regularized by 10% and fed into eLORETA to localize the source ofmu rhythm.
t-PAC. t-PAC of the extracted OB response time course was analyzed betweengamma and beta bands with window length 250 ms and 50% overlapping.The gamma band [30∼100 Hz], discretized to 20 frequency bins, and theinstantons amplitude were extracted using Hilbert transform at each fre-quency bin. Similarly, using Hilbert transformation , the instantaneous phaseof slower oscillations (i.e., beta [12∼30 Hz]) was computed, and t-PAC for eachtime bin was calculated as the power ratio of the composite signal of instanta-neous amplitude of faster oscillation and phase of slower to the faster oscilla-tion during the window interval on the individual level (25). Moreover, wequantified the comodulogram level between the outcome of t-PAC with aslower band to isolate a range of slower frequencies that are coupled to iden-tified gamma. t-PAC analysis were carried out in BrainStorm toolbox withinMATLAB R2019b (82).
RSA. We used RSA to assess the relationship between the odor valence ratingand neuronal population activity of OB in two prominent odor-related fre-quencies, gamma and beta. To limit our statistical tests and minimize thepotential false positive error, we only include the frequencies of gamma andbeta bands in the RSA analysis that were found to be coupled in the t-PACanalysis. The RDMs for whole 1 s of odor stimuli were compared between thebehavioral and OB response in a searchlight framework on the individuallevel. In line with a multidimensional scaling method (14), the so-called DISTA-TIS method, we constructed a consensus RDM to represent the group level. Todetermine the potential relationship between neural and perceptual RDMs,values above the diagonal line of the matrices was assessed using all possiblepermuted (i.e., shuffling the labels of odors; given 6 odors, the total possiblecombinations is 720) partial Pearson correlation to avoid inflated correlationdue to symmetry of RDMs (Fig. 1A). The group-level RDMs were subsequentlyscaled down using eigenvector decomposition into two main axes. The dis-tance matrices were converted to similarity matrices by inversing the distancematrix after added by 1, and modularity indices (Q) were computed using theNewman method (30) given three clusters. The three clusters were identifiedusing a hierarchical clustering of valence rating, varying the number of clus-ters from 1 to 6 and estimating the knee of the modularity curve where theknee of the curve was estimated as the furthest point from the linear approxi-mation. RSA analysis and community detection were performed in the open-source CoSMoSMVPA toolbox (83) and MATLAB Network Toolbox (https://github.com/ivanbrugere/matlab-networks-toolbox).Statistical analysis. We assessed the statistical difference in power evolutionbetween the two most unpleasant and pleasant odors, as well as scalp murhythm, using a nonparametric statistic. The time-frequency maps of unpleas-ant and pleasant odors of OB signal and scalp electrodes were computedusing multitapered sliding windows and compared using 5,000-permutationMonte Carlo tests to find significance time/frequency bins or channels. To stat-ically test the relationship between the brain data and valence rating in RSA,RDMmatrices at each time point were shuffled through all possible combina-tions. In each iteration, partial Pearson correlation between neural and per-ceptual valence was computed with intensity as nuisance covariates. Toextract the exact P value from the permutation test, we computed the numberof times the actual partial Pearson correlation was bigger than shuffle dataout of total permutations (720). Similarly, for t-PAC analysis, nonparametricMonte Carlo 5,000 permutation tests were performed for the OB couplingvalue at each time-frequency bin against baseline (250 ms prestimulus), andexact P valuewere extracted. The subsequent t-mapwas smoothed, while pre-serving the shape, for illustration purposes.
The distance matrices at the instances of significant correlation withvalence for both gamma and beta were scaled down to first and second PCs(i.e., PC1 and PC2), and Newman modularity was calculated to assess whether
the tested odors clusters comply with valence rating. To statistically test theNewman index Q, the modularity of similarity matrices was compared withthe null model for each correlation peak. The null model was generated by5,000 times rewiring of the adjacency (similarity) matrix while perseveringweight, degree, and strength distribution using the Brain Connectivity Tool-box within MATLAB R2019b (84, 85). Later, the actual modularity index wascompared with the null distribution. In the post hoc analysis to assess effectson premotor responses, we extracted data in the time interval 300 to 400 msafter odor onset. We tested if the preparatory response for motor action weobserved in Experiment 2 could be found in this experiment, even thoughhere, participants were sitting in a chair and instructed to sit as still as possible.The power of mu synchronization/desynchronization was predicted using ageneralized linear model having valence and intensity as predictors for eachelectrode on the scalp and yielding in beta maps on the individual level. Sub-sequently, the beta maps were statically tested on the group level via the Stu-dent’s t test.
Experiment 2: Odor Valence–Dependent Approach/Avoidance Responses.Participants. Given that links between perceived odor valence and approach/avoidance motor responses had not been previously assessed, we initially per-formed a structured pilot experiment to explore the time period of interest ofthe motor response, the result of which was later used as a priori defined tem-poral regions of interest in Experiment 2. In the pilot experiment, a total of 21individuals (age = 28.71 6 5.84, 11 women) participated. In the subsequentExperiment 2, a total of 44 individuals (age = 25.526 4.01, 26 women) partici-pated. Inclusion criteria (including passing the anosmia screening test) werethe same as described for Experiment 1. The studies were approved by thelocal ethical review board (EPN: 2016/1692-31/4), and all participants signedinformed consent prior to their participation.Odors and delivery method. In both the pilot and main experiments, odorswere piloted and presented as described in Experiment 1 but using slightlydifferent odors. In the pilot experiment, four odors were used, namely straw-berry, carvone, fish odor, and ethanethiol. To limit odor dependency, straw-berry was substituted with vanillin and ethanethiol with diethyl disulfide inthe main experiment (SI Appendix). Odors were presented identical to Experi-ment 1 and, unbeknownst to the participants, triggered by their sniff cycle(Fig. 4A).Body sway measurement. Participant’s body microsway was assessed with aforce plate (AccSwayPlus, AMTI Massachusetts) assessing eight axes of motion.The force plate was initially allowed to warm up for a few minutes, afterwhich it was zeroed, and a 25-s period of unloaded baseline was initiallyrecorded for calibration purposes.Procedure. Participants stood in the center of the force plate with their feettogether, facing a wall where a fixation cross was placed at eye height about70 cm away from their face. The height of the fixation cross was adjusted foreach individual according to the participant’s height. Their arms were posi-tioned alongside the body, and they were instructed to avoid performingredundantmovement (Fig. 4A). See SI Appendix for more information.Statistical analyses. Posterior-anterior angular momentum extracted fromthe body sway data recorded by the force plate was assessed according to acalibration matrix provided by the force plate vendor. In the pilot study (n =21), event-related responses of the PAM were calculated for five time pointsduring the odor interval with steps of 0.25 s to identify the time point of inter-est. LMMwith participant intercept and random slope of odor were fitted forthe three time points. Having determined the time point of interest, werepeated the experiment in a completely new data set with bigger samplesize and fitted LMMwith the exact similar design. Moreover, as a control anal-ysis, we examined if respiration correlates PAM by means of Pearson correla-tion at the time point of interest. The analysis was repeated in a Bayesianframework as supplementary analysis. See SI Appendix for more information.
Data Availability. EEG and behavioral data as well as all scripts have beendeposited in the Open Science Framework (https://osf.io/c8u39/?view_only=ebb85532e1064d128db79bacb6be27f8).
ACKNOWLEDGMENTS. We thank Kimberly Battista (battistaillustration.com)for making the EBG insert in Fig. 1A as well as Dr. Jason Yee at the Universityof Veterinary Medicine, Vienna, Austria, for proofreading. Funding was pro-vided by research grants from the National Institute on Deafness and OtherCommunication Disorders (R21DC016735) as well as the Knut and Alice Wal-lenberg Foundation (KAW 2018.0152) awarded to J.N.L. A.A. is supported byan award from the Swedish Research Council (2018-01603).
1. L. M. Kay, G. Laurent, Odor- and context-dependentmodulation ofmitral cell activityin behaving rats.Nat. Neurosci. 2, 1003–1009 (1999).
2. K. Kobayakawa et al., Innate versus learned odour processing in the mouse olfactorybulb.Nature 450, 503–508 (2007).
10 of 12 j PNAS Iravani et al.https://doi.org/10.1073/pnas.2101209118 The human olfactory bulb processes odor valence representation and
cues motor avoidance behavior
Dow
nloa
ded
by g
uest
on
Oct
ober
20,
202
1

3. M. G. Haselton, D. Nettle, The paranoid optimist: An integrative evolutionary modelof cognitive biases. Pers. Soc. Psychol. Rev. 10, 47–66 (2006).
4. Y. Yeshurun, N. Sobel, An odor is not worth a thousand words: From multidimen-sional odors to unidimensional odor objects.Annu. Rev. Psychol. 61, 219–241 (2010).
5. J. Seubert, C. Regenbogen, U. Habel, J. N. Lundstr€om, “Behavioral and neural deter-minants of odor valence perception” in Springer Handbook of Odor, A. Buettner, Ed.(Springer, 2017), pp. 99–100.
6. J. D. Mainland, J. N. Lundstr€om, J. Reisert, G. Lowe, From molecule to mind: An inte-grative perspective on odor intensity. Trends Neurosci. 37, 443–454 (2014).
7. W. Doucette et al., Associative cortex features in the first olfactory brain relay sta-tion.Neuron 69, 1176–1187 (2011).
8. F. Kermen et al., Topographical representation of odor hedonics in the olfactorybulb.Nat. Neurosci. 19, 876–878 (2016).
9. B. Iravani, A. Arshamian, K. Ohla, D. A. Wilson, J. N. Lundstr€om, Non-invasive record-ing from the human olfactory bulb.Nat. Commun. 11, 648 (2020).
10. A. Arshamian et al., A mammalian blood odor component serves as an approach-avoidance cue across phylum border - fromflies to humans. Sci. Rep. 7, 13635 (2017).
11. J. N. Lundstr€om, A. R. Gordon, E. C. Alden, S. Boesveldt, J. Albrecht, Methods forbuilding an inexpensive computer-controlled olfactometer for temporally-preciseexperiments. Int. J. Psychophysiol. 78, 179–189 (2010).
12. K. Ohla, J. N. Lundstr€om, Sex differences in chemosensation: Sensory or emotional?Front. Hum. Neurosci. 7, 607 (2013).
13. N. Kriegeskorte, M.Mur, P. Bandettini, Representational similarity analysis - connect-ing the branches of systems neuroscience. Front. Syst. Neurosci. 2, 4 (2008).
14. H. Abdi, A. J. O’Toole, D. Valentin, B. Edelman, “DISTATIS: The analysis of multipledistance matrices” in 2005 IEEE Computer Society Conference on Computer Visionand Pattern Recognition (CVPR’05) -Workshops (IEEE, 2005), p. 42.
15. G. Buzs�aki et al., Hippocampal network patterns of activity in the mouse. Neurosci-ence 116, 201–211 (2003).
16. A. Bragin et al., Gamma (40-100 Hz) oscillation in the hippocampus of the behavingrat. J. Neurosci. 15, 47–60 (1995).
17. K. Kendrick et al., Learning alters theta-nested gamma oscillations in inferotemporalcortex.Nat. Prec., 10.1038/npre.2009.3151.2 (2009).
18. P. Lakatos et al., An oscillatory hierarchy controlling neuronal excitability and stimu-lus processing in the auditory cortex. J. Neurophysiol. 94, 1904–1911 (2005).
19. N. Axmacher et al., Cross-frequency coupling supports multi-item working memoryin the human hippocampus. Proc. Natl. Acad. Sci. U.S.A. 107, 3228–3233 (2010).
20. M. X. Cohen et al., Good vibrations: Cross-frequency coupling in the human nucleusaccumbens during reward processing. J. Cogn. Neurosci. 21, 875–889 (2009).
21. B. H€andel, T. Haarmeier, Cross-frequency coupling of brain oscillations indicates thesuccess in visual motion discrimination.Neuroimage 45, 1040–1046 (2009).
22. A. B. L. Tort, R. W. Komorowski, J. R. Manns, N. J. Kopell, H. Eichenbaum, Theta-gamma coupling increases during the learning of item-context associations. Proc.Natl. Acad. Sci. U.S.A. 106, 20942–20947 (2009).
23. C. E. Schroeder, P. Lakatos, Low-frequency neuronal oscillations as instruments ofsensory selection. Trends Neurosci. 32, 9–18 (2009).
24. J. Losacco,D. Ramirez-Gordillo, J. Gilmer, D. Restrepo, Learning improves decodingof odoridentitywithphase-referencedoscillations in theolfactory bulb. eLife9, e52583 (2020).
25. S. Samiee, S. Baillet, Time-resolved phase-amplitude coupling in neural oscillations.Neuroimage 159, 270–279 (2017).
26. B. N. Johnson, J. D. Mainland, N. Sobel, Rapid olfactory processing implicates subcor-tical control of an olfactomotor system. J. Neurophysiol. 90, 1084–1094 (2003).
27. J. Prescott, J. Burns, R. A. Frank, Influence of odor hedonics, food-relatedness, andmotivational state on human sniffing. Chemosens. Percept. 3, 85–90 (2010).
28. D. G. Laing, Natural sniffing gives optimumodour perception for humans. Perception12, 99–117 (1983).
29. H. Manabe, K. Mori, Sniff rhythm-paced fast and slow gamma-oscillations in theolfactory bulb: Relation to tufted and mitral cells and behavioral states. J. Neurophy-siol. 110, 1593–1599 (2013).
30. M. E. J. Newman, M. Girvan, Finding and evaluating community structure in net-works. Phys. Rev. E Stat. Nonlin. SoftMatter Phys. 69, 026113 (2004).
31. S. Maslov, K. Sneppen, Specificity and stability in topology of protein networks. Sci-ence 296, 910–913 (2002).
32. S. S. Schiffman, Physicochemical correlates of olfactory quality. Science 185, 112–117(1974).
33. S. Kumar, M. J. Riddoch, G. Humphreys, Mu rhythm desynchronization reveals motoricinfluences of handactiononobject recognition. Front. Hum.Neurosci. 7, 66 (2013).
34. J. Matsumoto et al., Modulation of mu rhythm desynchronization during motorimagery by transcranial direct current stimulation. J. Neuroeng. Rehabil. 7, 27 (2010).
35. R. C. Howe, M. B. Sterman, Cortical-subcortical EEG correlates of suppressed motorbehavior during sleep andwaking in the cat. Electroencephalogr. Clin. Neurophysiol.32, 681–695 (1972).
36. G. Pfurtscheller, C. Brunner, A. Schl€ogl, F. H. Lopes da Silva,Mu rhythm (de)synchroni-zation and EEG single-trial classification of different motor imagery tasks. Neuro-image 31, 153–159 (2006).
37. R. A. Frank, M. F. Dulay, R. C. Gesteland, Assessment of the Sniff Magnitude Test as aclinical test of olfactory function. Physiol. Behav. 78, 195–204 (2003).
38. D. E. Frederick et al., Gamma and beta oscillations define a sequence of neurocogni-tivemodes present in odor processing. J. Neurosci. 36, 7750–7767 (2016).
39. C. Martin, N. Ravel, Beta and gamma oscillatory activities associated with olfactorymemory tasks: Different rhythms for different functional networks? Front. Behav.Neurosci. 8, 218 (2014).
40. C. M. Gray, J. E. Skinner, Centrifugal regulation of neuronal activity in the olfactorybulb of the waking rabbit as revealed by reversible cryogenic blockade. Exp. BrainRes. 69, 378–386 (1988).
41. L. M. Kay, Two species of gamma oscillations in the olfactory bulb: Dependence onbehavioral state and synaptic interactions. J. Integr. Neurosci. 2, 31–44 (2003).
42. J. Mainland, N. Sobel, The sniff is part of the olfactory percept. Chem. Senses 31,181–196 (2006).
43. M. L. Fletcher, Olfactory aversive conditioning alters olfactory bulb mitral/tufted cellglomerular odor responses. Front. Syst. Neurosci. 6, 16 (2012).
44. S. V. Jones, D. C. Choi, M. Davis, K. J. Ressler, Learning-dependent structural plasticityin the adult olfactory pathway. J. Neurosci. 28, 13106–13111 (2008).
45. A. Gnaedinger, H. Gurden, B. Gour�evitch, C. Martin, Multisensory learning betweenodor and sound enhances beta oscillations. Sci. Rep. 9, 11236 (2019).
46. C. G. Richter, W. H. Thompson, C. A. Bosman, P. Fries, Top-down beta enhancesbottom-up gamma. J. Neurosci. 37, 6698–6711 (2017).
47. L. M. Kay, Circuit oscillations in odor perception and memory. Prog. Brain Res. 208,223–251 (2014).
48. B. Gour�evitch, L. M. Kay, C. Martin, Directional coupling from the olfactory bulb tothe hippocampus during a go/no-go odor discrimination task. J. Neurophysiol. 103,2633–2641 (2010).
49. S. L. Bressler, Spatial organization of EEGs from olfactory bulb and cortex. Electroen-cephalogr. Clin. Neurophysiol. 57, 270–276 (1984).
50. C. Martin, R. Gervais, B. Messaoudi, N. Ravel, Learning-induced oscillatory activitiescorrelated to odour recognition: A network activity. Eur. J. Neurosci. 23, 1801–1810(2006).
51. W. Li, J. D. Howard, T. B. Parrish, J. A. Gottfried, Aversive learning enhances percep-tual and cortical discrimination of indiscriminable odor cues. Science 319, 1842–1845(2008).
52. D. A. Wilson, R. M. Sullivan, Cortical processing of odor objects. Neuron 72, 506–519(2011).
53. D. K. Porada, C. Regenbogen, J. Seubert, J. Freiherr, J. N. Lundstr€om, Multisensoryenhancement of odor object processing in primary olfactory cortex. Neuroscience418, 254–265 (2019).
54. J. K. Olofsson et al., A designated odor-language integration system in the humanbrain. J. Neurosci. 34, 14864–14873 (2014).
55. J. Djordjevic et al., A rose by any other name: Would it smell as sweet? J. Neurophy-siol. 99, 386–393 (2008).
56. M. A. Gadziola, K. A. Tylicki, D. L. Christian, D. W.Wesson, The olfactory tubercle enc-odes odor valence in behavingmice. J. Neurosci. 35, 4515–4527 (2015).
57. M. A. Gadziola, D. W. Wesson, The neural representation of goal-directed actions andoutcomes in the ventral striatum’s olfactory tubercle. J. Neurosci. 36, 548–560 (2016).
58. E. E. in 't Zandt, H. L. Cansler, H. B. Denson, D. W. Wesson, Centrifugal innervation ofthe olfactory bulb: A reappraisal. eNeuro, 10.1523/ENEURO.0390-18.2019 (2019).
59. M. Midroit et al., Neural processing of the reward value of pleasant odorants. Curr.Biol. 31, 1592–1605.e9 (2021).
60. N. B�erard et al., Electrical stimulation of the medial orbitofrontal cortex in humanselicits pleasant olfactory perceptions. Epilepsy Behav. 114, 107559 (2020).
61. S. Schiffman, D. E. Robinson, R. P. Erickson, Multidimensional scaling of odorants:Examination of psychological and physicochemical dimensions. Chem. Senses 2,375–390 (1977).
62. P. Joussain, M. Thevenet, C. Rouby, M. Bensafi, Effect of aging on hedonic apprecia-tion of pleasant and unpleasant odors. PLoSOne 8, e61376 (2013).
63. A. H. Moberly et al., Olfactory inputs modulate respiration-related rhythmic activityin the prefrontal cortex and freezing behavior.Nat. Commun. 9, 1528 (2018).
64. L. M. Kay, Theta oscillations and sensorimotor performance. Proc. Natl. Acad. Sci.U.S.A. 102, 3863–3868 (2005).
65. C. Zelano et al., Nasal respiration entrains human limbic oscillations and modulatescognitive function. J. Neurosci. 36, 12448–12467 (2016).
66. J. P. Royet, J. Pager, Olfactory bulb responsiveness to an aversive or novel food odorin; the unrestrained rat. Brain Res. Bull. 7, 375–378 (1981).
67. J. Pager, I. Giachetti, A. Holley, J. Le Magnen, A selective control of olfactory bulbelectrical activity in relation to food deprivation and satiety in rats. Physiol. Behav. 9,573–579 (1972).
68. R. Hermer-Vazquez, L. Hermer-Vazquez, S. Srinivasan, J. K. Chapin, Beta- andgamma-frequency coupling between olfactory and motor brain regions prior toskilled, olfactory-driven reaching. Exp. Brain Res. 180, 217–235 (2007).
69. R. M. Khan et al., Predicting odor pleasantness from odorant structure: Pleasantnessas a reflection of the physical world. J. Neurosci. 27, 10015–10023 (2007).
70. L. Secundo, K. Snitz, N. Sobel, The perceptual logic of smell. Curr. Opin. Neurobiol.25, 107–115 (2014).
71. J. Poncelet et al., Semantic knowledge influences prewired hedonic responses toodors. PLoS One 5, e13878 (2010).
72. M. Bensafi, F. Rinck, B. Schaal, C. Rouby, Verbal cues modulate hedonic perception ofodors in 5-year-old children as well as in adults. Chem. Senses 32, 855–862 (2007).
73. N. Mandairon, J. Poncelet, M. Bensafi, A. Didier, Humans and mice express similarolfactory preferences. PLoS One 4, e4209 (2009).
PSYC
HOLO
GICALAND
COGNITIVESC
IENCE
S
Iravani et al.The human olfactory bulb processes odor valence representation andcues motor avoidance behavior
PNAS j 11 of 12https://doi.org/10.1073/pnas.2101209118
Dow
nloa
ded
by g
uest
on
Oct
ober
20,
202
1

74. P. Joussain, A. Chakirian, F. Kermen, C. Rouby, M. Bensafi, Physicochemical influenceon odor hedonics:Where does it occurfirst? Commun. Integr. Biol. 4, 563–565 (2011).
75. A. Keller et al., Predicting human olfactory perception from chemical features ofodormolecules. Science 355, 820–826 (2017).
76. C. Sezille et al., Dissociated neural representations induced by complex and simpleodorantmolecules.Neuroscience 287, 23–31 (2015).
77. P. Gupta, D. F. Albeanu, U. S. Bhalla, Olfactory bulb coding of odors, mixtures andsniffs is a linear sum of odor time profiles.Nat. Neurosci. 18, 272–281 (2015).
78. M. A. Patterson, S. Lagier, A. Carleton, Odor representations in the olfactory bulbevolve after the first breath and persist as an odor afterimage. Proc. Natl. Acad. Sci.U.S.A. 110, E3340–E3349 (2013).
79. G. Kobal et al., Multicenter investigation of 1,036 subjects using a standardizedmethod for the assessment of olfactory function combining tests of odor identifica-tion, odor discrimination, and olfactory thresholds. Eur. Arch. Otorhinolaryngol. 257,205–211 (2000).
80. R. D. Pascual-Marqui et al., Assessing interactions in the brain with exact low-resolution electromagnetic tomography. Philos. Trans.- Royal Soc., Math. Phys. Eng.Sci. 369, 3768–3784 (2011).
81. R. Oostenveld, P. Fries, E. Maris, J.-M. Schoffelen, FieldTrip: Open source software foradvanced analysis of MEG, EEG, and invasive electrophysiological data. Comput.Intell. Neurosci. 2011, 156869 (2011).
82. F. Tadel, S. Baillet, J. C. Mosher, D. Pantazis, R. M. Leahy, Brainstorm: A user-friendlyapplication forMEG/EEG analysis. Comput. Intell. Neurosci. 2011, 879716 (2011).
83. N. N. Oosterhof, A. C. Connolly, J. V. Haxby, CoSMoMVPA: Multi-modal multivariatepattern analysis of neuroimaging data in Matlab/GNU octave. Front. Neuroinform.10, 27 (2016).
84. M. Rubinov, O. Sporns, Weight-conserving characterization of complex functionalbrain networks.Neuroimage 56, 2068–2079 (2011).
85. M. Rubinov, O. Sporns, Complex network measures of brain connectivity: Uses andinterpretations.Neuroimage 52, 1059–1069 (2010).
12 of 12 j PNAS Iravani et al.https://doi.org/10.1073/pnas.2101209118 The human olfactory bulb processes odor valence representation and
cues motor avoidance behavior
Dow
nloa
ded
by g
uest
on
Oct
ober
20,
202
1


![Cannabinoid action in the olfactory epithelium · evoked ORN responses (black traces) were modulated (red traces). After 12 min of drug washout the odor-induced [Ca2] i transients](https://img.pdfslide.us/doc/110x75/60c743d47659e2406d2fae13/cannabinoid-action-in-the-olfactory-epithelium-evoked-orn-responses-black-traces.jpg)