Embed Size (px)
Citation preview
The human influence on recent extreme storms.
Probabilistic Flood Hazard Assessment (PFHA) Research WorkshopUS Nuclear Regulatory Commission
February 19, 2020
Michael F. WehnerLawrence Berkeley National Laboratory
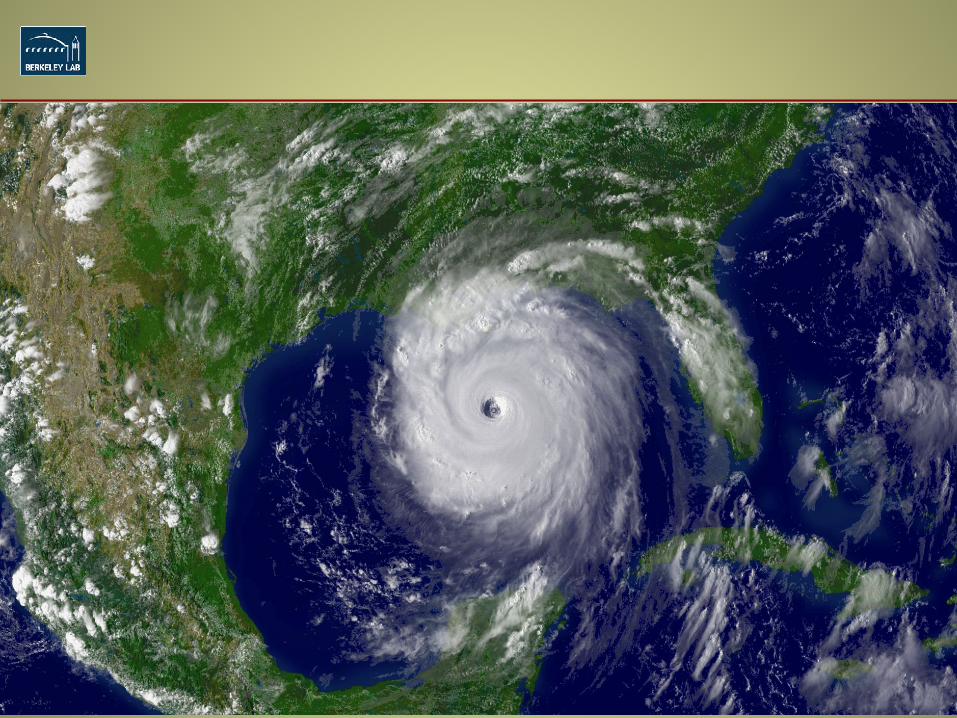
Houston, Texas after Harvey
The human influence on recent extreme storms.OrDid global warming flood my house?
Probabilistic Flood Hazard Assessment (PFHA) Research WorkshopUS Nuclear Regulatory Commission
February 16, 2020
Michael F. WehnerLawrence Berkeley National Laboratory
Houston, Texas after Harvey
US DOE Policy 411.2A
SUBJECT: SCIENTIFIC INTEGRITY
When expressing opinions on policy matters to the public and media, research personnel must make it clear when they are expressing their personal views, rather than those of the Department, the U.S. Government, or their respective institutions. Public representation of Government or DOE positions or policies must be cleared through their program management to include DOE headquarters.
In accordance with this policy, any material in this presentation should be considered the opinion of the speaker and not necessarily that of the US Dept. of Energy, the University of California or the Lawrence Berkeley National Laboratory.
3
• United Nations Framework Convention on Climate Change” • “to achieve stabilization of greenhouse gas concentrations in the
atmosphere at a level that would prevent dangerous anthropogenic [human] interference with the climate system.”
• 2009 Copenhagen Accord:• This level is such that the global average temperature should be
stabilized at two degrees Celsius (3.6 degrees Fahrenheit) above its preindustrial level.
• 2015 Paris Agreement (COP21):• “Invites the Intergovernmental Panel on Climate Change to provide a
special report in 2018 on the impacts of global warming of 1.5 °C above pre-industrial levels and related global greenhouse gas emission pathways”
• 2020: We are already over 1oC above pre-industrial levels.• I will argue that this is not safe.• Dangerous climate change is here now.
What is the “safe” amount of climate change?
What have we done to extreme weather?– “How has the risk of a weather event changed because of climate
change?”Or– “How did climate change affect the magnitude of that event?”
Dangerous climate change is already here?!
• This new science is called “Extreme Event Attribution”.• Invented in 2003 after the deadly European heatwave.• Quantifies the human influence, if any, on extreme
weather events that have already occurred.• Borrows statistical methods from Epidemiology.• Fundamentally an exercise in Causal Inference. • A rapidly evolving science.
• New technologies.• It is still getting warmer…
Extreme event attribution
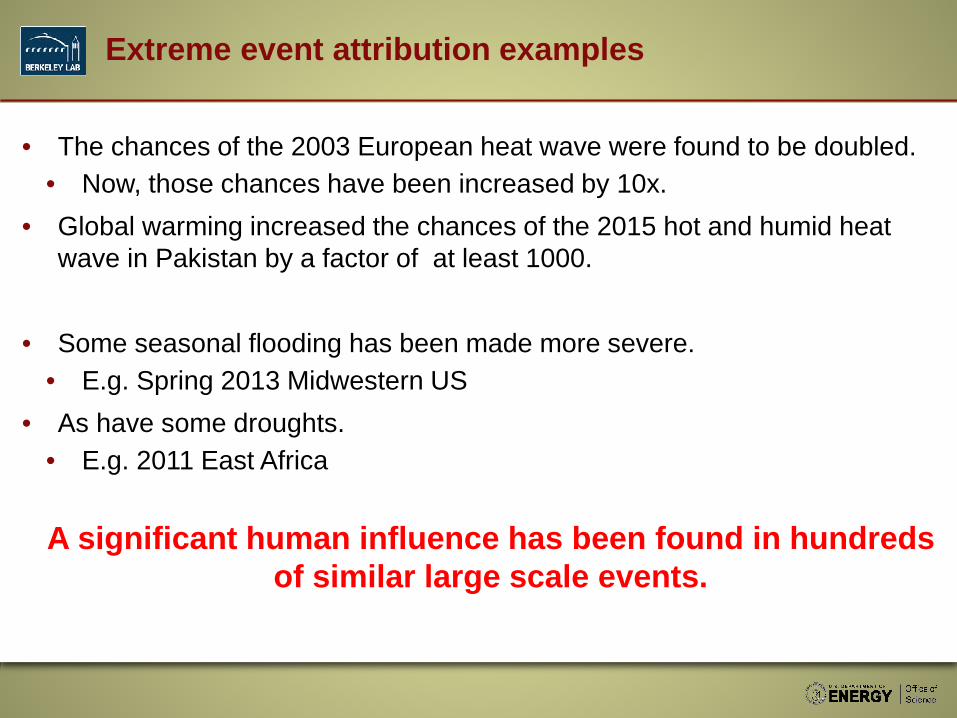
• The chances of the 2003 European heat wave were found to be doubled.• Now, those chances have been increased by 10x.
• Global warming increased the chances of the 2015 hot and humid heat wave in Pakistan by a factor of at least 1000.
• Some seasonal flooding has been made more severe.• E.g. Spring 2013 Midwestern US
• As have some droughts.• E.g. 2011 East Africa
A significant human influence has been found in hundreds of similar large scale events.
Extreme event attribution examples
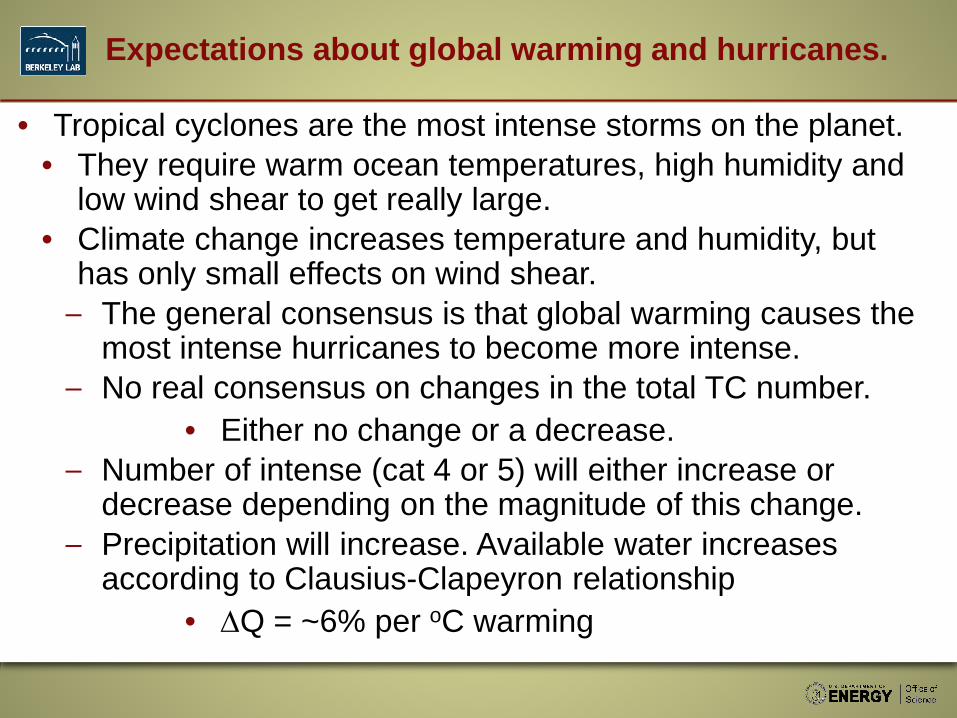
• Tropical cyclones are the most intense storms on the planet.• They require warm ocean temperatures, high humidity and
low wind shear to get really large.• Climate change increases temperature and humidity, but
has only small effects on wind shear.– The general consensus is that global warming causes the
most intense hurricanes to become more intense.– No real consensus on changes in the total TC number.
• Either no change or a decrease.– Number of intense (cat 4 or 5) will either increase or
decrease depending on the magnitude of this change.– Precipitation will increase. Available water increases
according to Clausius-Clapeyron relationship• ∆Q = ~6% per oC warming
Expectations about global warming and hurricanes.
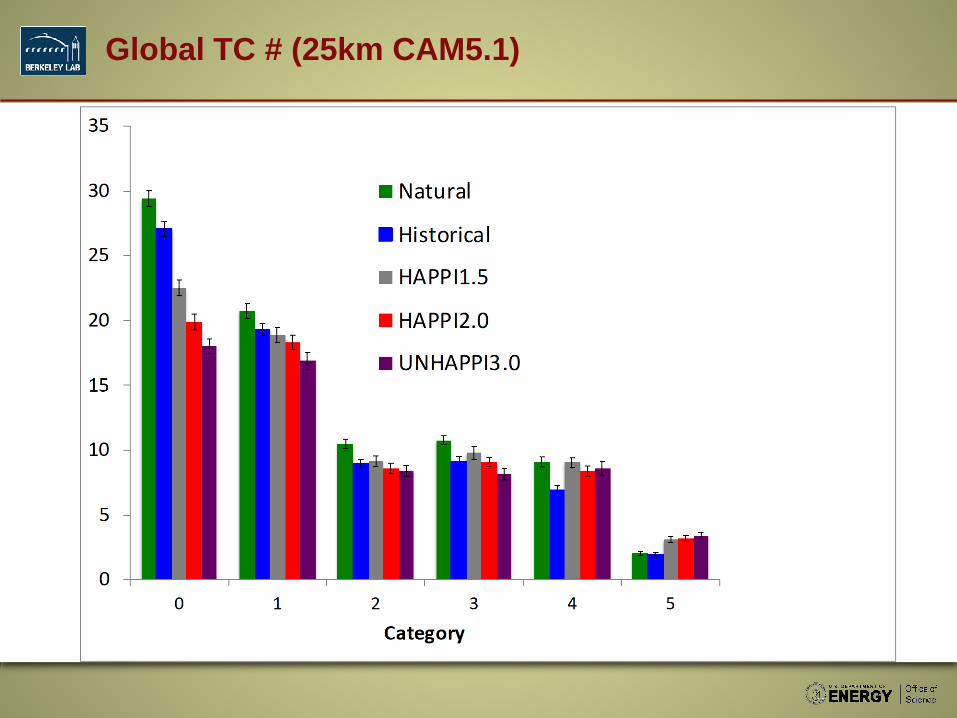
Global TC # (25km CAM5.1)
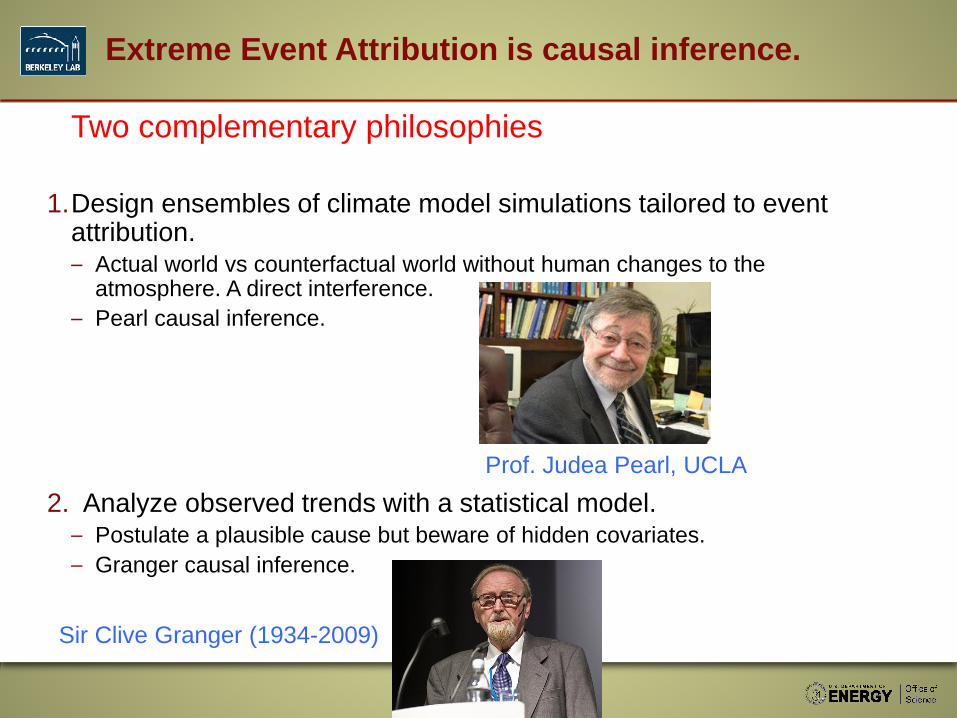
Two complementary philosophies
1.Design ensembles of climate model simulations tailored to event attribution. – Actual world vs counterfactual world without human changes to the
atmosphere. A direct interference.– Pearl causal inference.
2. Analyze observed trends with a statistical model.– Postulate a plausible cause but beware of hidden covariates.– Granger causal inference.
Extreme Event Attribution is causal inference.
Prof. Judea Pearl, UCLA
Sir Clive Granger (1934-2009)
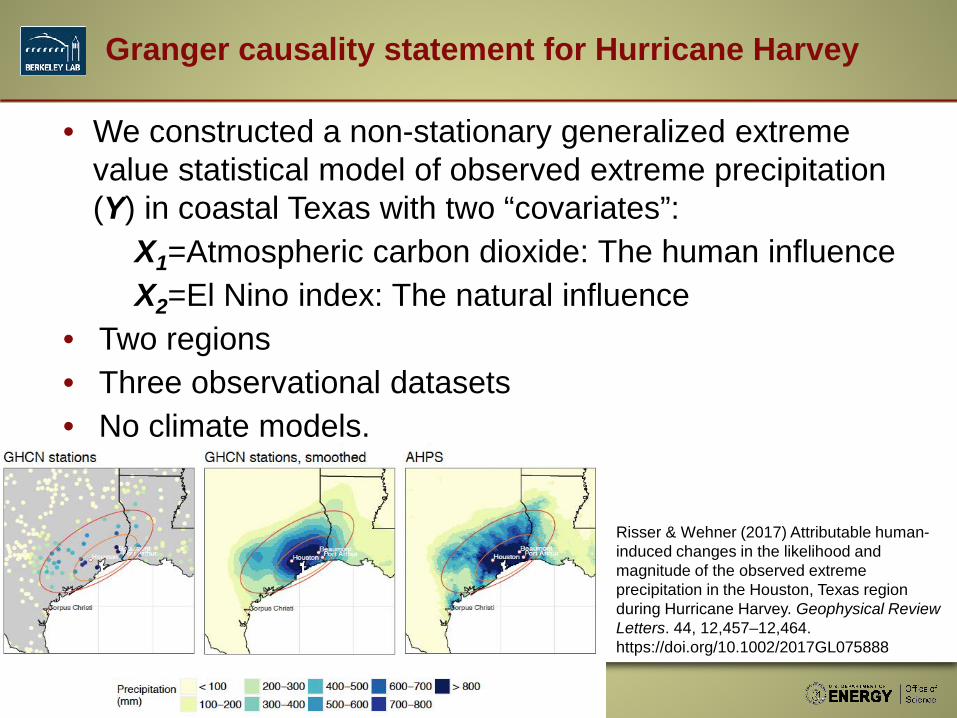
• We constructed a non-stationary generalized extreme value statistical model of observed extreme precipitation (Y) in coastal Texas with two “covariates”:
X1=Atmospheric carbon dioxide: The human influenceX2=El Nino index: The natural influence
• Two regions• Three observational datasets• No climate models.
Granger causality statement for Hurricane Harvey
Risser & Wehner (2017) Attributable human-induced changes in the likelihood and magnitude of the observed extreme precipitation in the Houston, Texas region during Hurricane Harvey. Geophysical Review Letters. 44, 12,457–12,464. https://doi.org/10.1002/2017GL075888
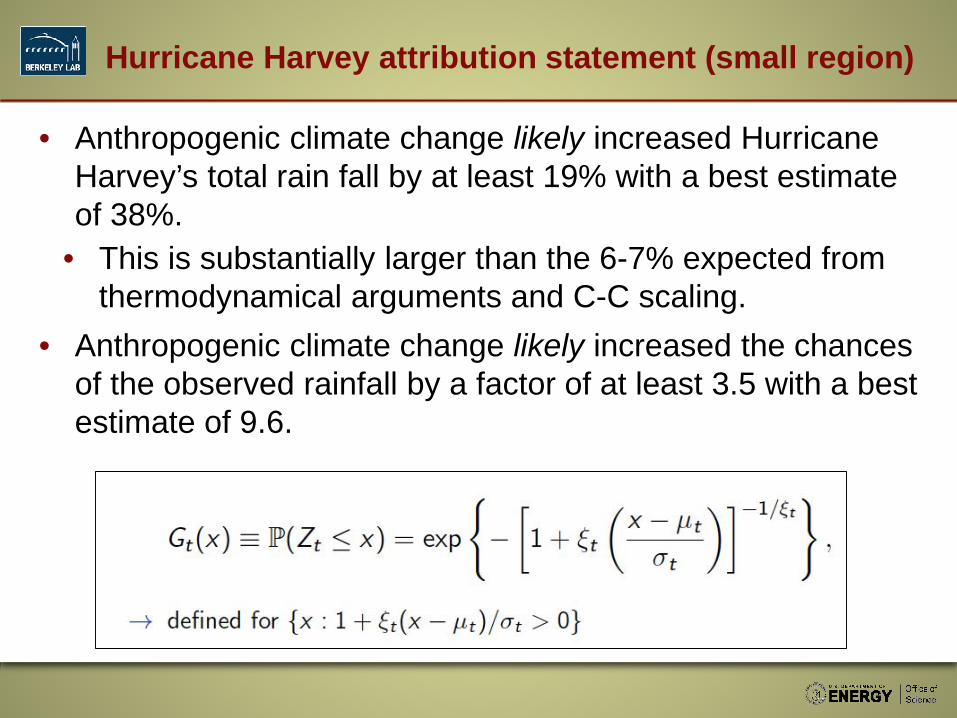
• Anthropogenic climate change likely increased Hurricane Harvey’s total rain fall by at least 19% with a best estimate of 38%.
• This is substantially larger than the 6-7% expected from thermodynamical arguments and C-C scaling.
• Anthropogenic climate change likely increased the chances of the observed rainfall by a factor of at least 3.5 with a best estimate of 9.6.
Hurricane Harvey attribution statement (small region)
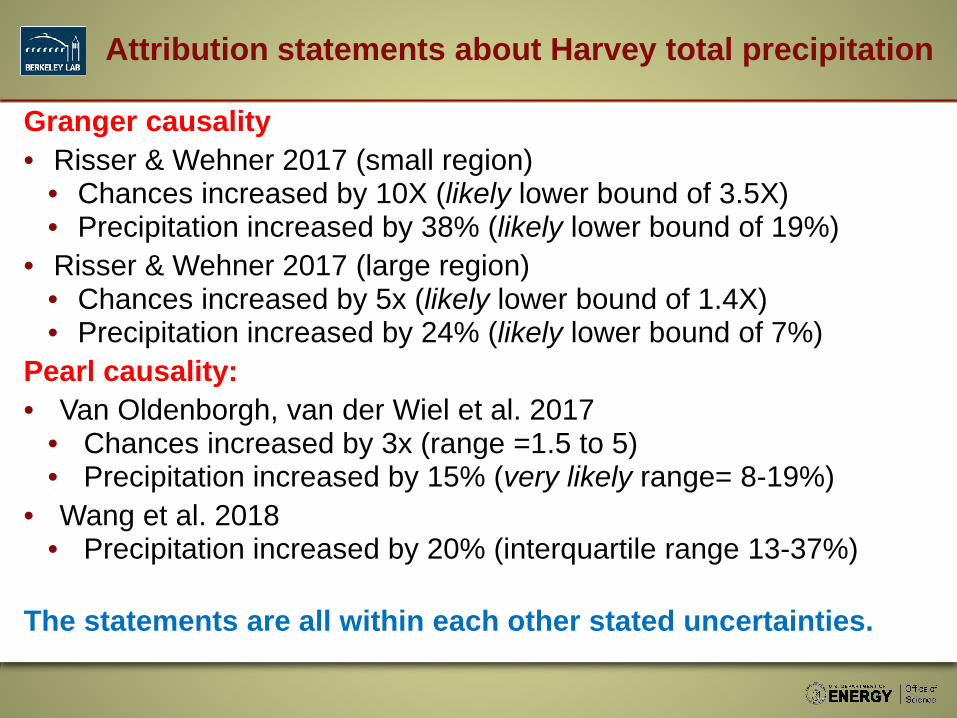
Granger causality• Risser & Wehner 2017 (small region)
• Chances increased by 10X (likely lower bound of 3.5X)• Precipitation increased by 38% (likely lower bound of 19%)
• Risser & Wehner 2017 (large region)• Chances increased by 5x (likely lower bound of 1.4X)• Precipitation increased by 24% (likely lower bound of 7%)
Pearl causality:• Van Oldenborgh, van der Wiel et al. 2017
• Chances increased by 3x (range =1.5 to 5)• Precipitation increased by 15% (very likely range= 8-19%)
• Wang et al. 2018• Precipitation increased by 20% (interquartile range 13-37%)
The statements are all within each other stated uncertainties.
Attribution statements about Harvey total precipitation
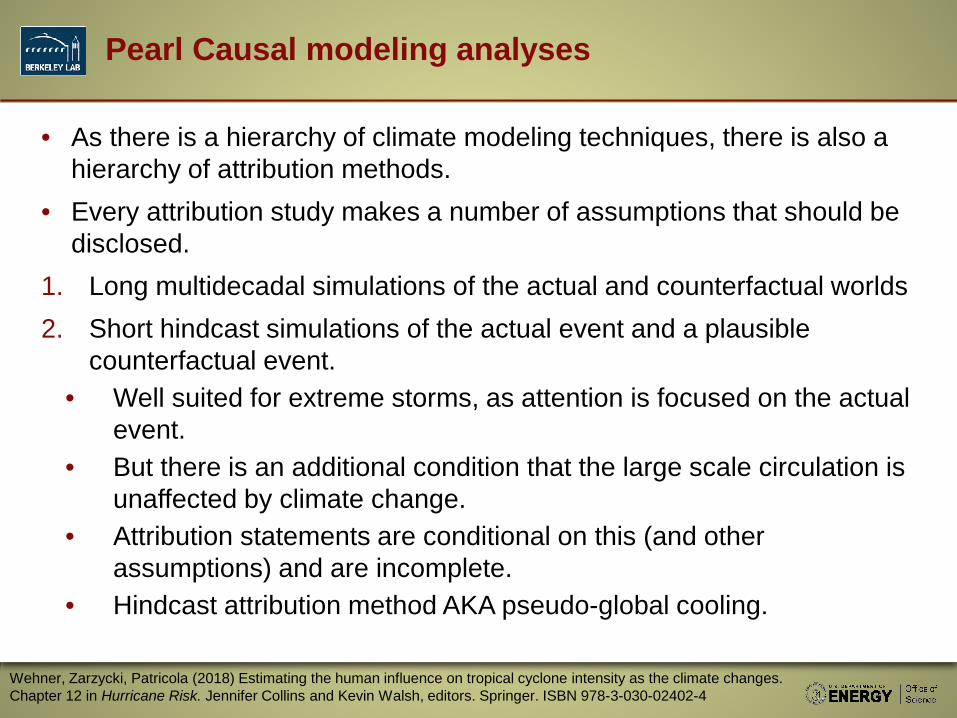
• As there is a hierarchy of climate modeling techniques, there is also a hierarchy of attribution methods.
• Every attribution study makes a number of assumptions that should be disclosed.
1. Long multidecadal simulations of the actual and counterfactual worlds2. Short hindcast simulations of the actual event and a plausible
counterfactual event.• Well suited for extreme storms, as attention is focused on the actual
event.• But there is an additional condition that the large scale circulation is
unaffected by climate change.• Attribution statements are conditional on this (and other
assumptions) and are incomplete.• Hindcast attribution method AKA pseudo-global cooling.
Pearl Causal modeling analyses
Wehner, Zarzycki, Patricola (2018) Estimating the human influence on tropical cyclone intensity as the climate changes. Chapter 12 in Hurricane Risk. Jennifer Collins and Kevin Walsh, editors. Springer. ISBN 978-3-030-02402-4
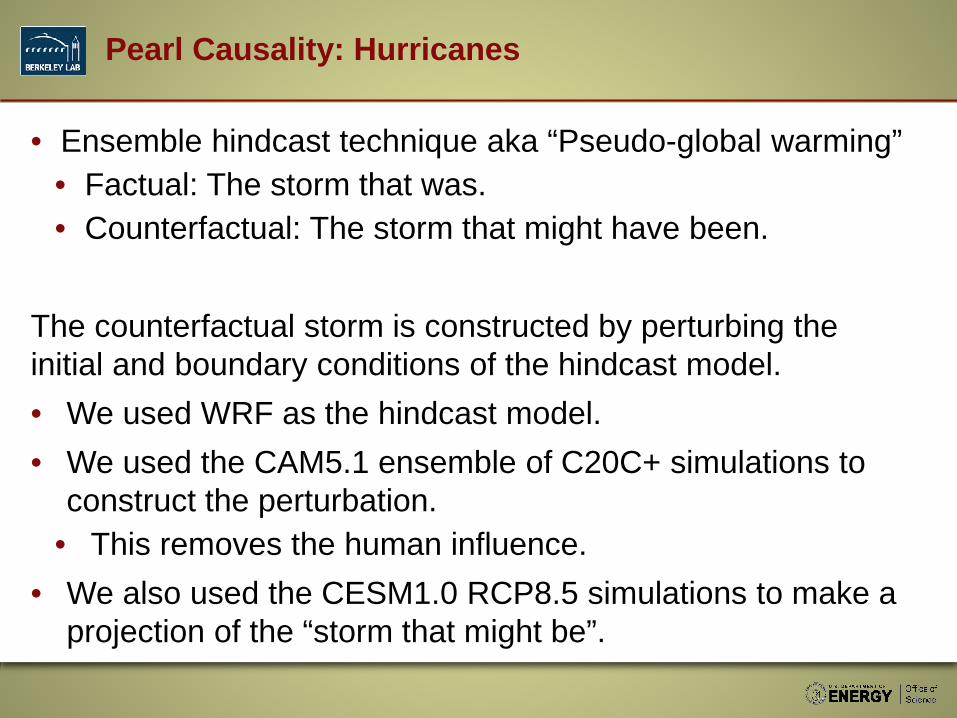
• Ensemble hindcast technique aka “Pseudo-global warming”• Factual: The storm that was.• Counterfactual: The storm that might have been.
The counterfactual storm is constructed by perturbing the initial and boundary conditions of the hindcast model.• We used WRF as the hindcast model.• We used the CAM5.1 ensemble of C20C+ simulations to
construct the perturbation.• This removes the human influence.
• We also used the CESM1.0 RCP8.5 simulations to make a projection of the “storm that might be”.
Pearl Causality: Hurricanes
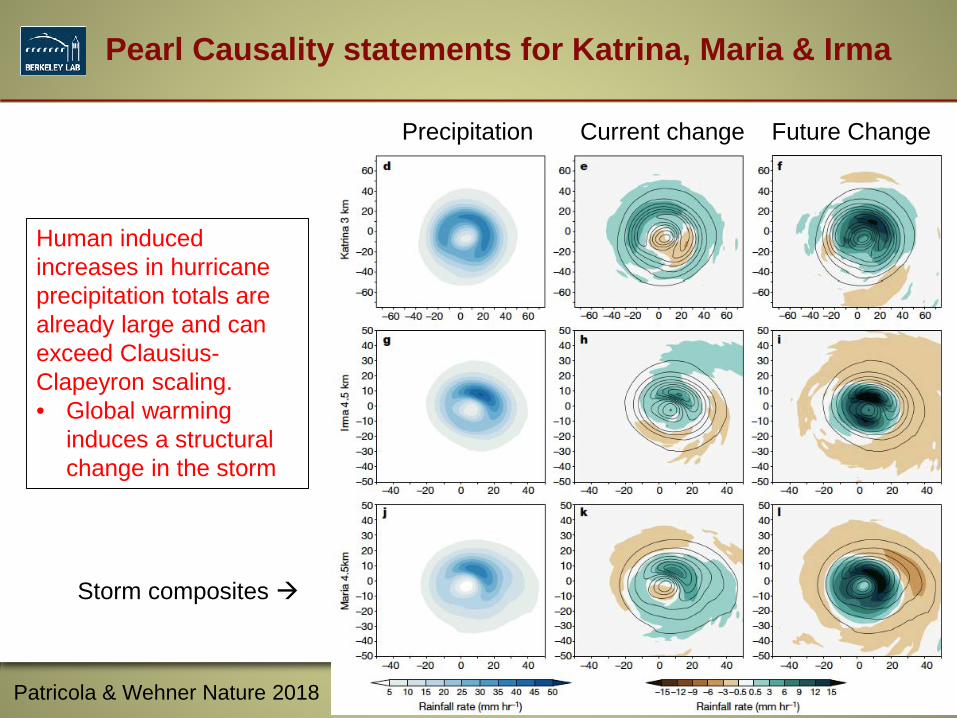
Pearl Causality statements for Katrina, Maria & Irma
Precipitation Current change Future Change
Patricola & Wehner Nature 2018
Human induced increases in hurricane precipitation totals are already large and can exceed Clausius-Clapeyron scaling.• Global warming
induces a structural change in the storm
Storm composites
C-C scaling case Study: A closer look at Maria
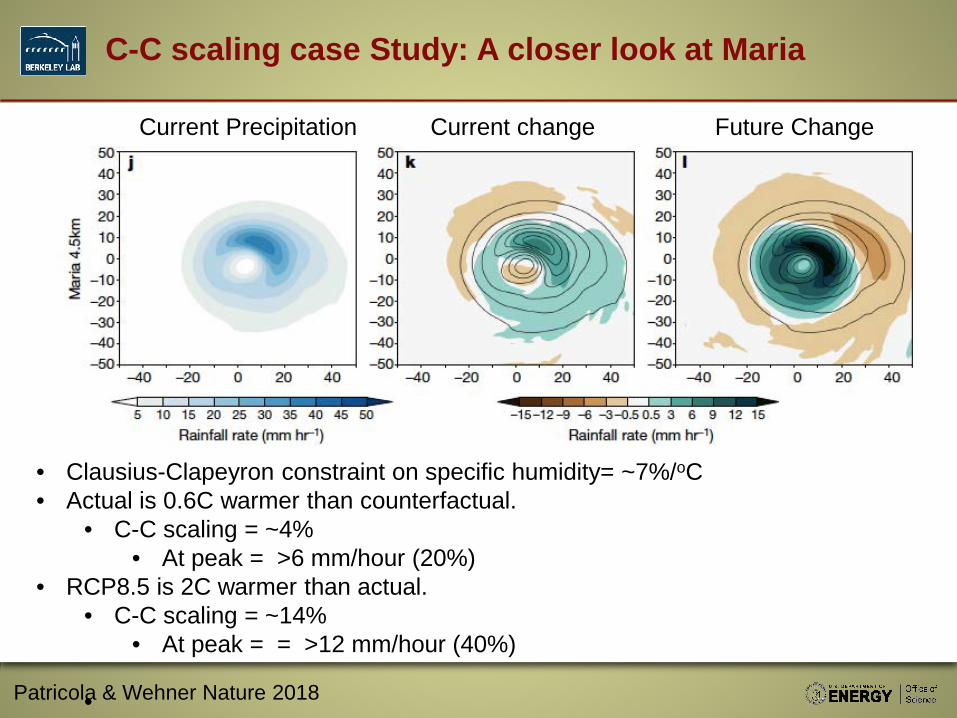
Current Precipitation Current change Future Change
Patricola & Wehner Nature 2018
• Clausius-Clapeyron constraint on specific humidity= ~7%/oC• Actual is 0.6C warmer than counterfactual.
• C-C scaling = ~4%• At peak = >6 mm/hour (20%)
• RCP8.5 is 2C warmer than actual.• C-C scaling = ~14%
• At peak = = >12 mm/hour (40%)
•
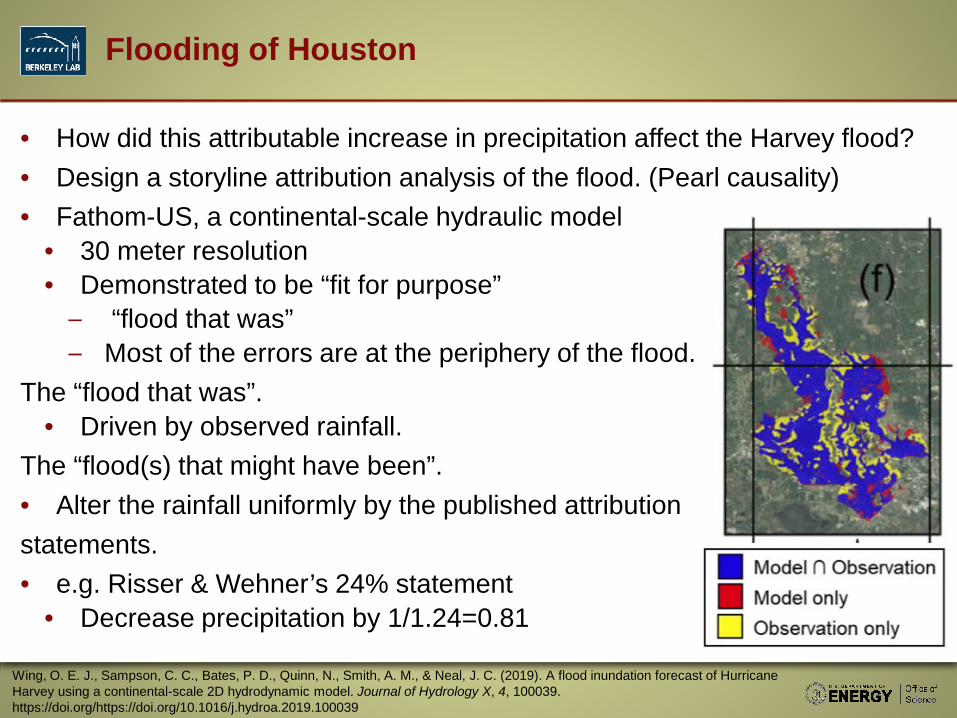
• How did this attributable increase in precipitation affect the Harvey flood?• Design a storyline attribution analysis of the flood. (Pearl causality)• Fathom-US, a continental-scale hydraulic model
• 30 meter resolution• Demonstrated to be “fit for purpose”
– “flood that was”– Most of the errors are at the periphery of the flood.
The “flood that was”.• Driven by observed rainfall.
The “flood(s) that might have been”.• Alter the rainfall uniformly by the published attribution statements.• e.g. Risser & Wehner’s 24% statement
• Decrease precipitation by 1/1.24=0.81
Flooding of Houston
Wing, O. E. J., Sampson, C. C., Bates, P. D., Quinn, N., Smith, A. M., & Neal, J. C. (2019). A flood inundation forecast of Hurricane Harvey using a continental-scale 2D hydrodynamic model. Journal of Hydrology X, 4, 100039. https://doi.org/https://doi.org/10.1016/j.hydroa.2019.100039
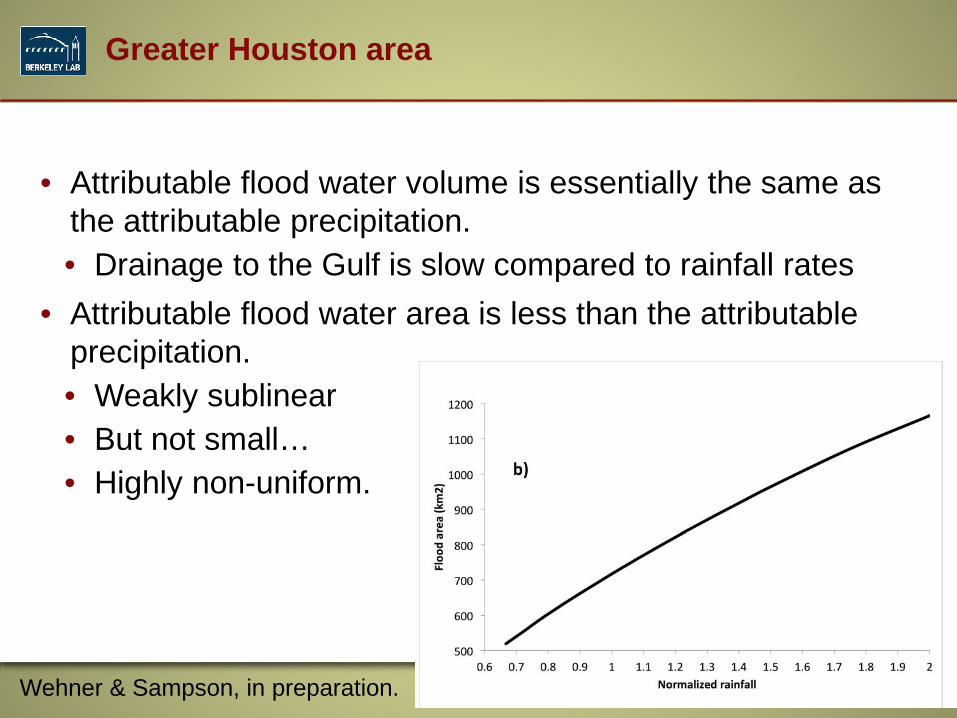
• Attributable flood water volume is essentially the same as the attributable precipitation.• Drainage to the Gulf is slow compared to rainfall rates
• Attributable flood water area is less than the attributable precipitation.• Weakly sublinear• But not small…• Highly non-uniform.
Greater Houston area
Wehner & Sampson, in preparation.
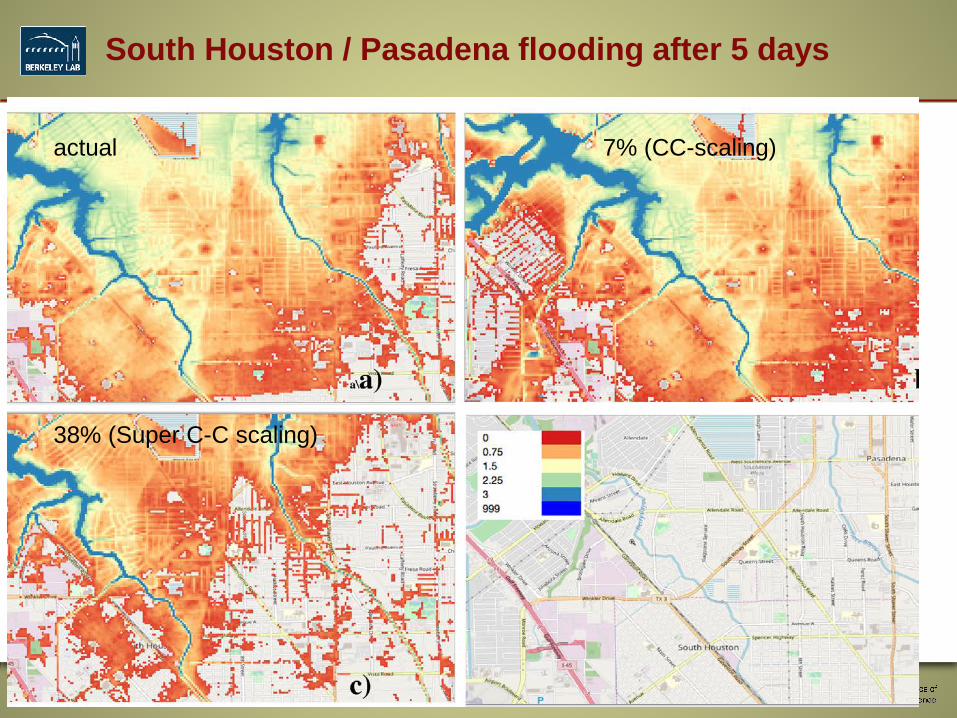
South Houston / Pasadena flooding after 5 days
actual 7% (CC-scaling)
38% (Super C-C scaling)
• Super C-C scaling of tropical cyclone precipitation is a real thing.• Changes in local dynamics are responsible.• But we should not expect different extreme storms types to behave in
the same way.• Tropical cyclones• Extra-tropical cyclones• Atmospheric Rivers• Mesoscale convective systems.• Frontal systems
• Multiple routes to super C-C.• But all are probably dynamical in nature.• What is the relative role of changes in local vs. large scale dynamics?
Conclusions
• This question needs to be interpreted in the probabilistic sense of extreme event attribution.
• It depends a lot on which range of attribution statements you are willing to accept.
• It also depends a lot on where your house is.• Many homes would have been flooded even without the
human increase in precipitation.• But some homes would not have been.
Data and software available at https://portal.nersc.gov/cascade/Harvey/
Did global warming flood my house?
Thank [email protected]