Embed Size (px)
Citation preview
The Hull, the Feasible Set, and the Risk Surface A Review of the Portfolio Modelling Infrastructure in R/Rmetrics
Diethelm Würtz
g /
Institute for Theoretical Physics ETH ZurichInstitute for Theoretical Physics ETH ZurichCurriculum for Computational Science ETH Zurich
Finance Online & Rmetrics Association Zurich
UseR! Gaithersburg, July 2010
Joint work withYohan Chalabi, William Chen, Christine Dong, Andrew Ellis,
Sebastian Pérez Saaibi, David Scott, Stefan Theussl
www.itp.phys.ethz.ch | www.rmetrics.org | www.finance.ch
Overview
Part I Rmetrics and Our Visions
Part II Portfolio Analysis with R/Rmetricsy /
Part III New DirectionsPart III New Directions
2

Part I
Who is Rmetrics and what are our Visions ?
Rmetrics is a non profit taking Association under Swiss law working in the public interest in the field of measuring and analyzing risks in finance and related fields
W t Ed ti l d T hi Pl tf• We operate an Educational and Teaching Platform• We offer an R Code Archive and a Public Tools Platform• We started to Build a Public Stability and Risk Data BaseWe started to Build a Public Stability and Risk Data Base
about 50 packages and 25 developers on r‐forge
3
Vision No 1: An Open Educational and Teaching PlatformAn Open Educational and Teaching Platform
Rmetrics Open Source Teaching Platform and Community
• Software Packages Serving as Code Archive• Datafeeds for Public Available Data on the WebDatafeeds for Public Available Data on the Web• High Quality Documentation R/Rmetrics eBooks• Support Student Internships for Training at ETHZ• Support Student Internships for Training at ETHZ• Rmetrics Meielisalp Summer School• Rmetrics Meielisalp User and Developer Workshop• Rmetrics Meielisalp User and Developer Workshop
4
Vision No 2: An Open Code ArchiveAn Open Code Archive
Why we Maintain an R Code Archive
• We need a platform which provides algorithms and software tools to measure and control the risk andsoftware tools to measure and control the risk andunstabilities of financial investments.
• We need more graphical tools which allow for better views on the performance risk attributions andviews on the performance, risk attributions and stability of financial investments.
5
Vision No 3: An Open Stability and Risk Data PlatformAn Open Stability and Risk Data Platform
Why we Create a Stability and Risk Data Platform
• Financial stability and risk data are in the public interest.
• We need an independent data base and platform which allows to make investments more transparentwhich allows to make investments more transparent and reproducible for everybody.
• We believe it is time to start with such a project, feelfree to join us.j
6
Part II
Portfolio Design with R/Rmetrics• What is a Financial Portfolio?What is a Financial Portfolio?• Portfolio Objectives and Constraints• Rmetrics Portfolio Solver Interfaces
ExamplesAb l t d R l ti Ri k Obj ti• Absolute and Relative Risk Objectives
• Covariance Matrix Estimation• Extreme Risk MeasuresExtreme Risk Measures• Estimation Risk/Problems
7
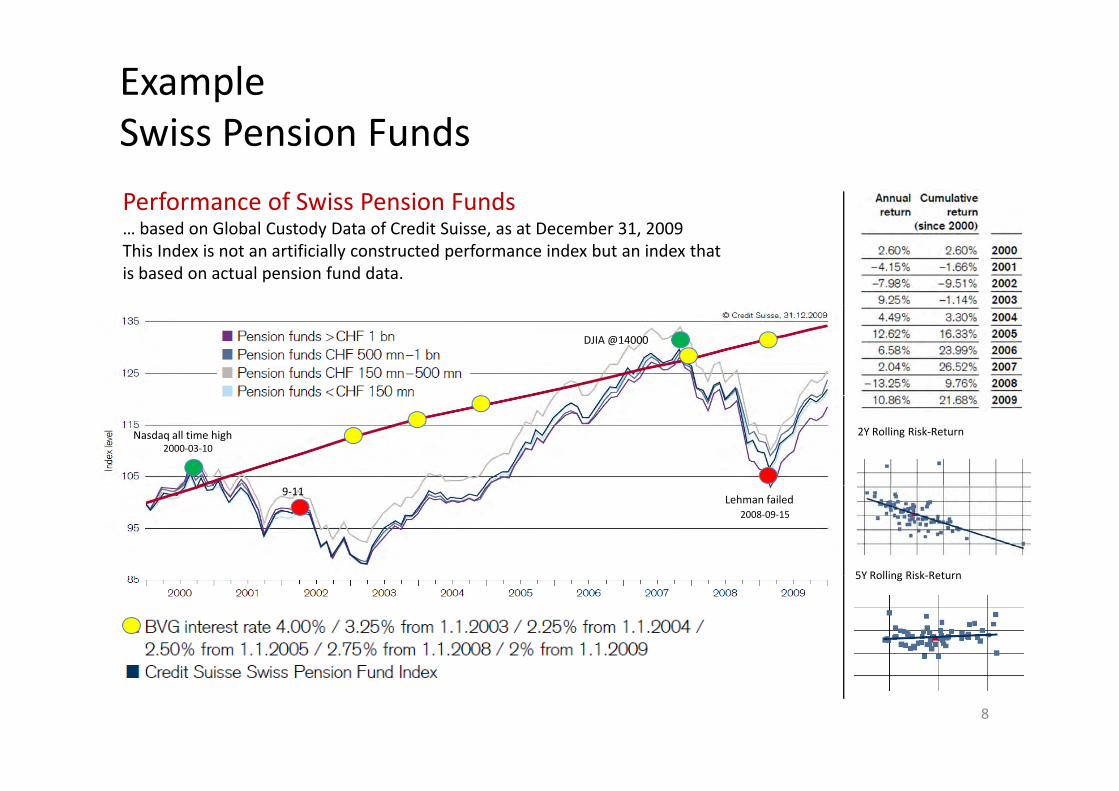
ExampleSwiss Pension FundsSwiss Pension FundsPerformance of Swiss Pension Funds
ExampleSwiss Pension Fund Portfolio
… based on Global Custody Data of Credit Suisse, as at December 31, 2009This Index is not an artificially constructed performance index but an index that is based on actual pension fund data.
DJIA @14000
Nasdaq all time high2000‐03‐10
2Y Rolling Risk‐Return
Lehman failed9‐11
2008‐09‐15
5Y Rolling Risk Return5Y Rolling Risk‐Return
8
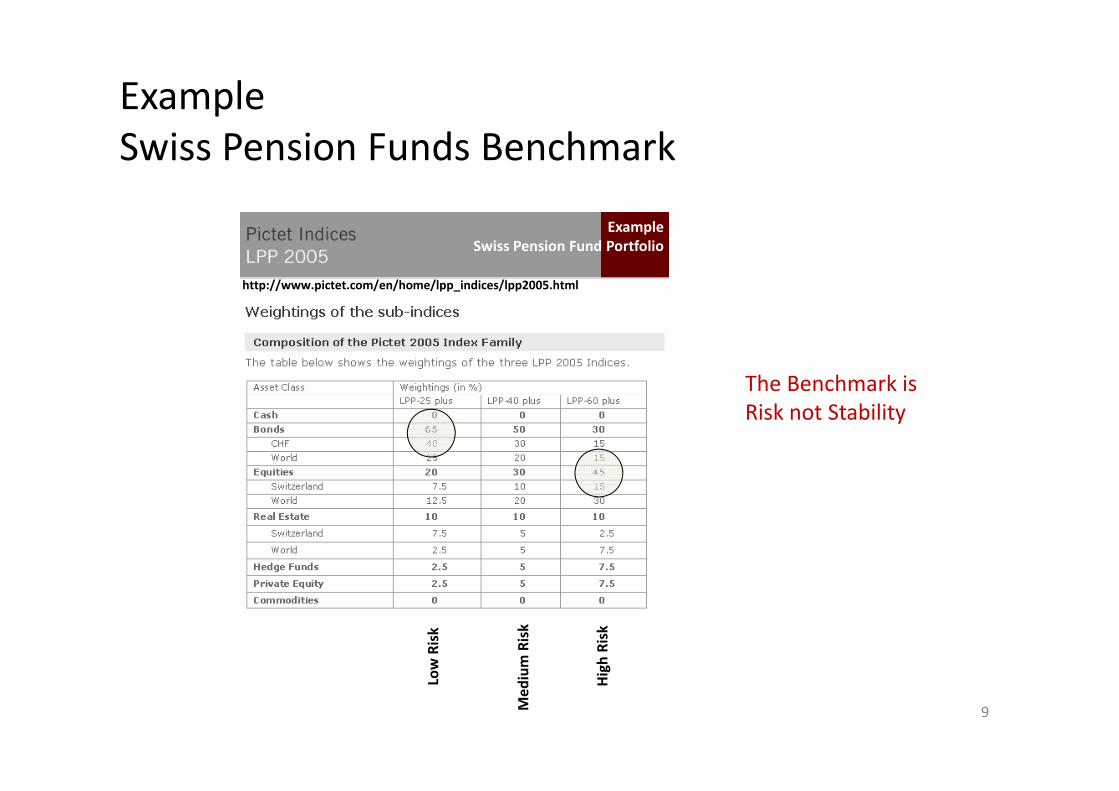
ExampleSwiss Pension Funds Benchmark
ExampleSwiss Pension Fund Portfolio
http://www.pictet.com/en/home/lpp_indices/lpp2005.html
The Benchmark is Risk not Stability
w Risk
m Risk
h Risk
9
Low
Med
ium
Hig
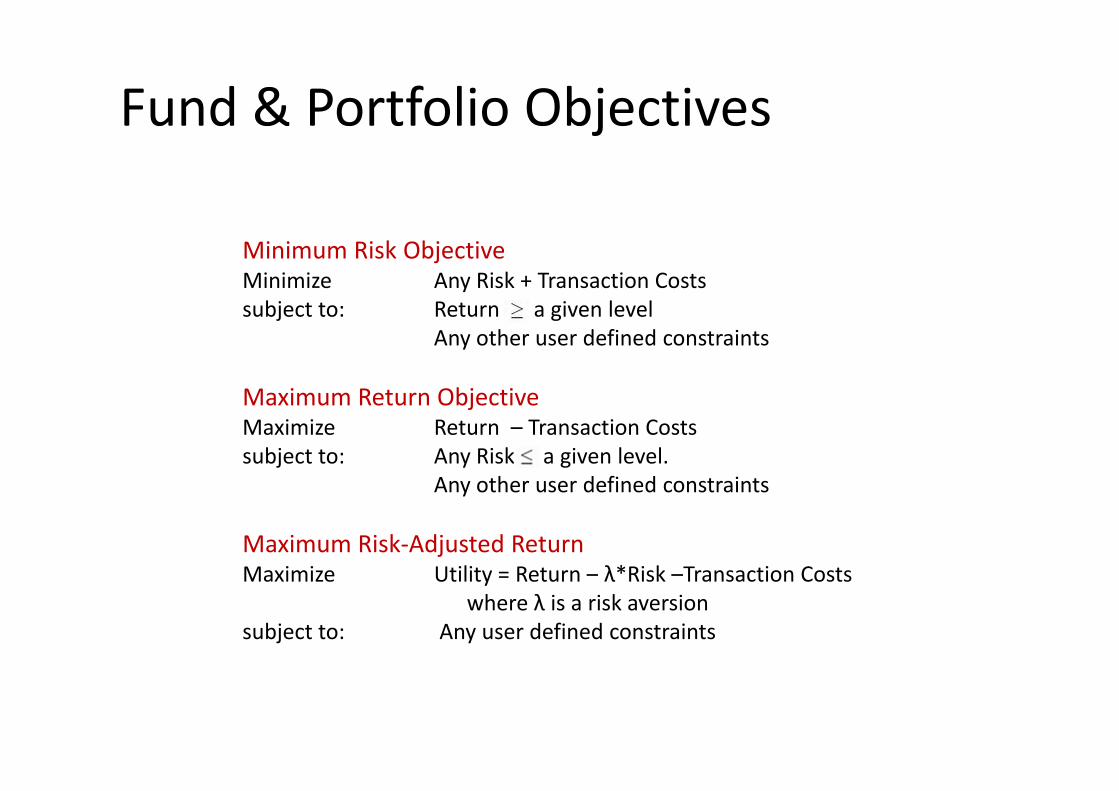
Fund & Portfolio Objectivesj
Minimum Risk ObjectiveMinimize Any Risk + Transaction Costssubject to Return > a given levelsubject to: Return > a given level
Any other user defined constraints
Maximum Return ObjectiveMaximum Return ObjectiveMaximize Return – Transaction Costssubject to: Any Risk < a given level.
Any other user defined constraintsAny other user defined constraints
Maximum Risk‐Adjusted ReturnMaximize Utility = Return – λ*Risk –Transaction CostsMaximize Utility = Return – λ Risk –Transaction Costs
where λ is a risk aversionsubject to: Any user defined constraints
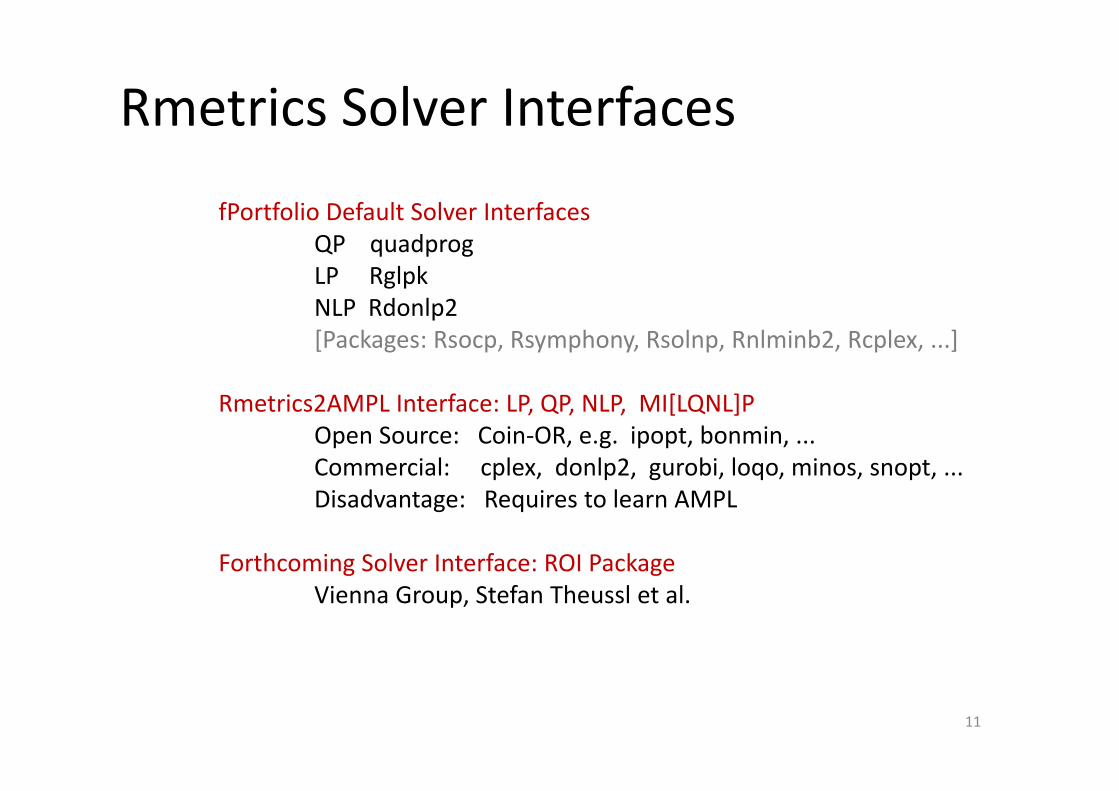
Rmetrics Solver Interfaces
fPortfolio Default Solver InterfacesfPortfolio Default Solver Interfaces QP quadprogLP Rglpk NLP Rdonlp2NLP Rdonlp2 [Packages: Rsocp, Rsymphony, Rsolnp, Rnlminb2, Rcplex, ...]
R i 2AMPL I f LP QP NLP MI[LQNL]PRmetrics2AMPL Interface: LP, QP, NLP, MI[LQNL]POpen Source: Coin‐OR, e.g. ipopt, bonmin, ... Commercial: cplex, donlp2, gurobi, loqo, minos, snopt, ...Disadvantage: Requires to learn AMPL
Forthcoming Solver Interface: ROI Package g gVienna Group, Stefan Theussl et al.
11
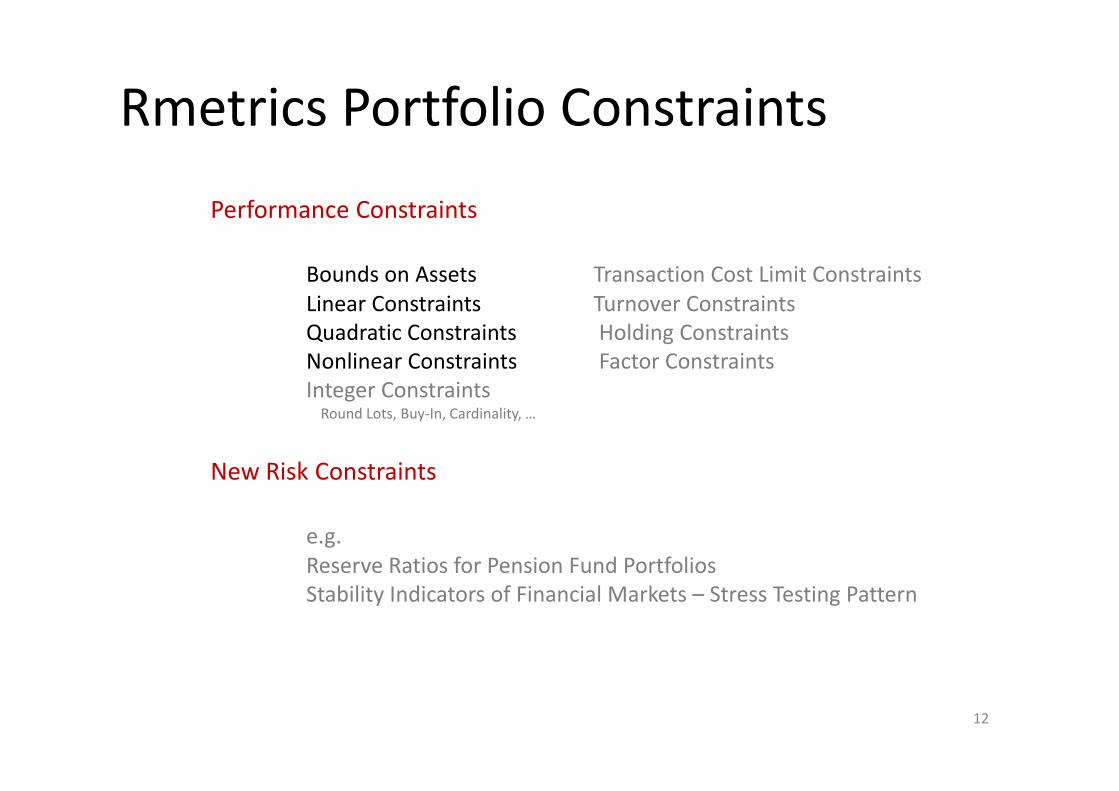
Rmetrics Portfolio Constraints
Performance ConstraintsPerformance Constraints
Bounds on Assets Transaction Cost Limit ConstraintsLinear Constraints Turnover ConstraintsLinear Constraints Turnover Constraints Quadratic Constraints Holding ConstraintsNonlinear Constraints Factor ConstraintsInteger ConstraintsInteger ConstraintsRound Lots, Buy‐In, Cardinality, …
New Risk Constraints
e.g. Reserve Ratios for Pension Fund PortfoliosStability Indicators of Financial Markets – Stress Testing Pattern
12
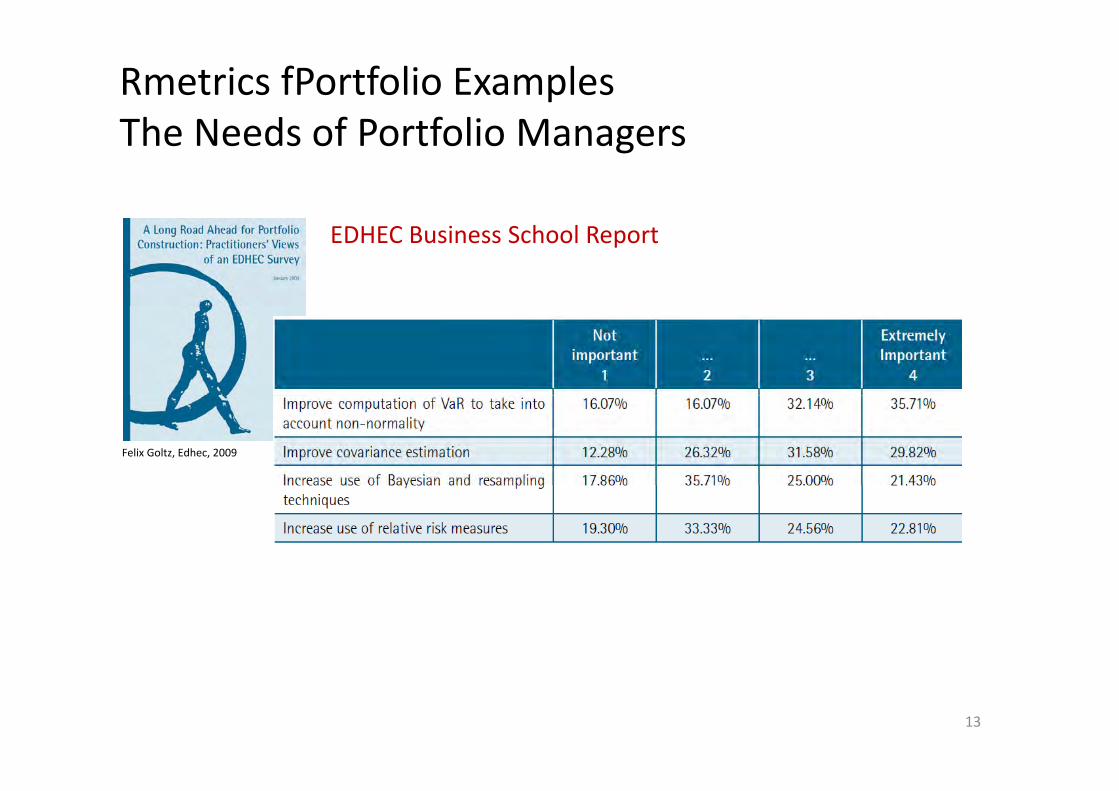
Rmetrics fPortfolio ExamplesThe Needs of Portfolio ManagersThe Needs of Portfolio Managers
EDHEC Business School Report
Felix Goltz, Edhec, 2009
13
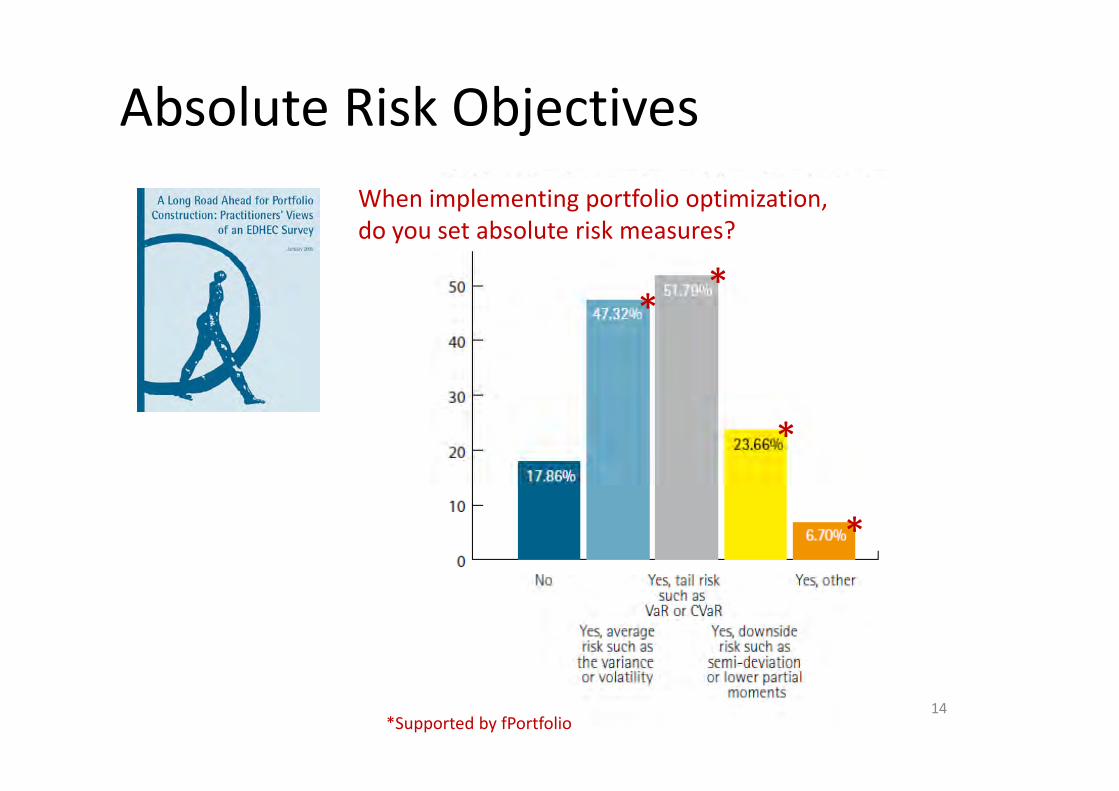
Absolute Risk ObjectivesjWhen implementing portfolio optimization,
* *do you set absolute risk measures?
*
*
*
14*Supported by fPortfolio
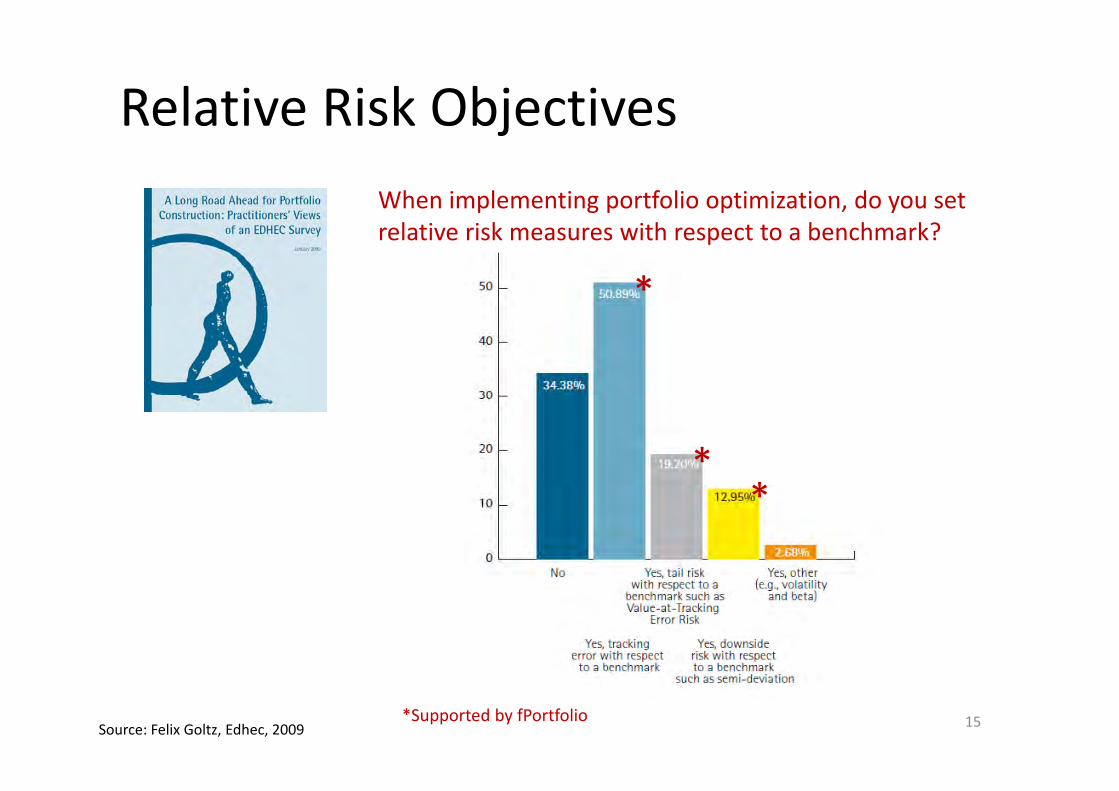
Relative Risk ObjectivesjWhen implementing portfolio optimization, do you set
*relative risk measures with respect to a benchmark?
***
15Source: Felix Goltz, Edhec, 2009 *Supported by fPortfolio
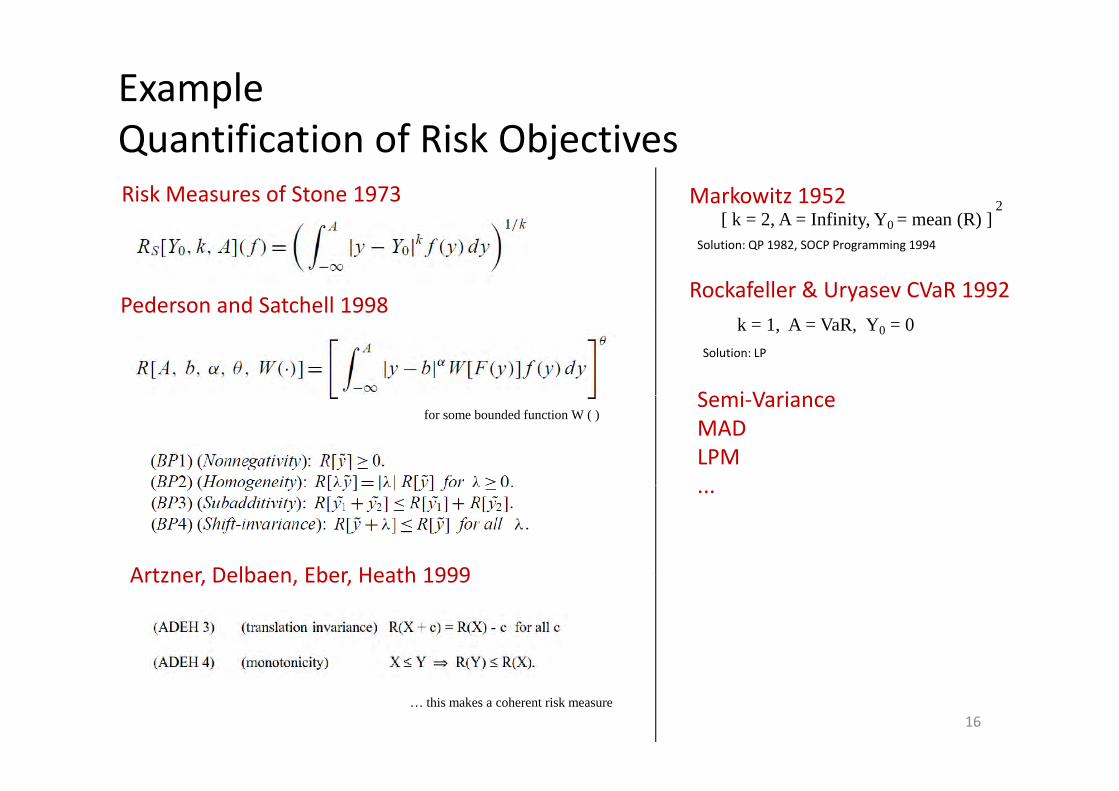
ExampleQ ifi i f Ri k Obj iQuantification of Risk ObjectivesRisk Measures of Stone 1973
[ k 2 A I fi it Y (R) ]2Markowitz 1952
Pederson and Satchell 1998Rockafeller & Uryasev CVaR 1992
[ k = 2, A = Infinity, Y0 = mean (R) ]Solution: QP 1982, SOCP Programming 1994
Pederson and Satchell 1998k = 1, A = VaR, Y0 = 0
Solution: LP
Semi Variancefor some bounded function W ( )
Semi‐VarianceMADLPM
Artzner Delbaen Eber Heath 1999
...
Artzner, Delbaen, Eber, Heath 1999
16… this makes a coherent risk measure
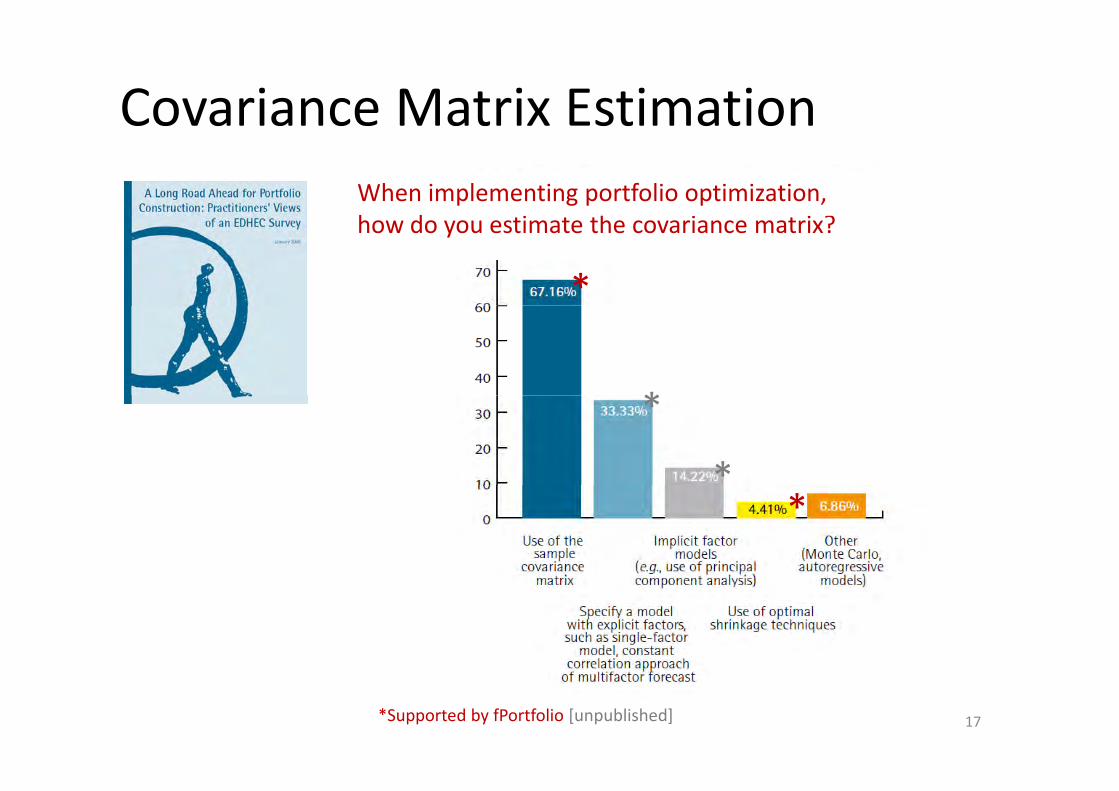
Covariance Matrix EstimationWhen implementing portfolio optimization, h d i h i i ?
*
how do you estimate the covariance matrix?
**
**
17*Supported by fPortfolio [unpublished]
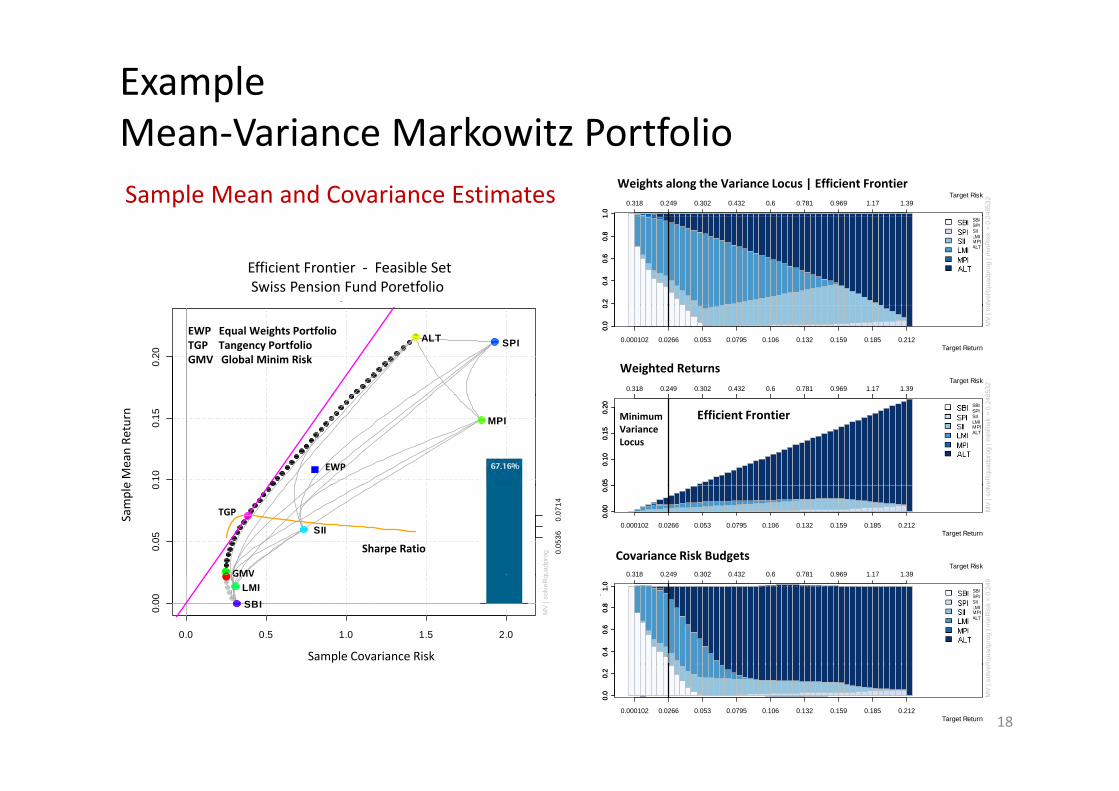
ExampleMean Variance Markowitz PortfolioMean‐Variance Markowitz Portfolio
1.0
1.0
0.318 0.249 0.302 0.432 0.6 0.781 0.969 1.17 1.39Target Risk
ht 2485
32
WeightsWeights along the Variance Locus | Efficient FrontierSample Mean and Covariance Estimates
Efficient FrontierMV Portfolio | mean-Stdev View
0.2
0.4
0.6
0.8
1
SBISPISIILMIMPIALT
0.2
0.4
0.6
0.8
1W
eigh
olve
Rqu
adpr
og |
min
Ris
k =
0.2
Efficient Frontier ‐ Feasible SetSwiss Pension Fund Poretfolio
0.20
SPIALT
0.0
00.
00
0.000102 0.0266 0.053 0.0795 0.106 0.132 0.159 0.185 0.212Target Return
MV
| so
0.318 0.249 0.302 0.432 0.6 0.781 0.969 1.17 1.39Target Risk
8532
Weighted Returns
EWP Equal Weights PortfolioTGP Tangency PortfolioGMV Global Minim Risk
Weighted Returns
0.10
0.15
et R
etur
n[m
ean] MPI
050.
100.
150.
20 SBISPISIILMIMPIALT
050.
100.
150.
20W
eigh
ted
Ret
urn
veR
quad
prog
| m
inR
isk
= 0.
248
EWP
MinimumVarianceLocus
Efficient Frontier
e Mean Re
turn
0.05
0
uadp
rog
Targ
e
0.05
36
0.0
714
SII
0.00
0.0
0.00
0.0
0.000102 0.0266 0.053 0.0795 0.106 0.132 0.159 0.185 0.212Target Return
MV
| sol
v
0 318 0 249 0 302 0 432 0 6 0 781 0 969 1 17 1 39Target RiskCov Risk Budgets
TGP
Sharpe Ratio
GMV
Covariance Risk Budgets
Sample
0.0 0.5 1.0 1.5 2.0
0.00
MV
| sol
veR
q
Target Risk[Cov]
SBILMI
0.4
0.6
0.8
1.0
SBISPISIILMIMPIALT
0.4
0.6
0.8
1.0
0.318 0.249 0.302 0.432 0.6 0.781 0.969 1.17 1.39
Cov
Ris
k Bu
dget
s
Rqu
adpr
og |
min
Ris
k =
0.24
9
GMV
Sample Covariance Risk
0.0
0.2
0.0
0.2
0.000102 0.0266 0.053 0.0795 0.106 0.132 0.159 0.185 0.212Target Return
MV
| sol
veR
18
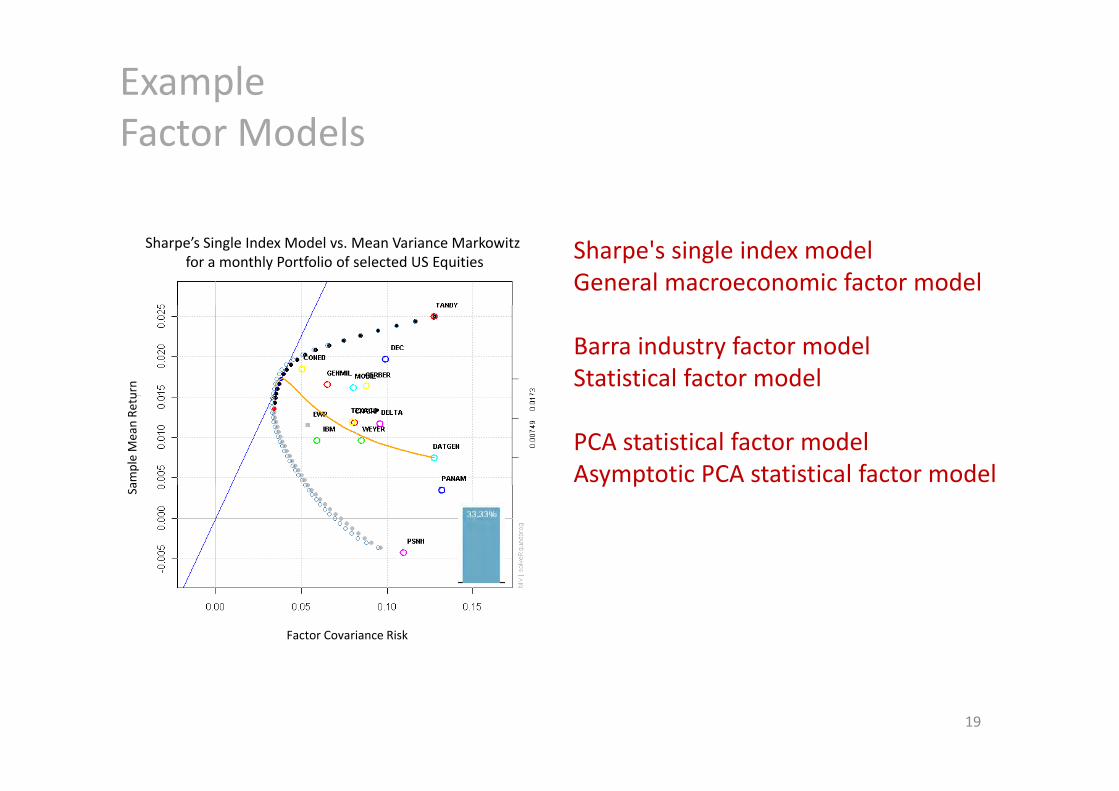
ExampleFactor ModelsFactor Models
Sharpe's single index model General macroeconomic factor model
Sharpe’s Single Index Model vs. Mean Variance Markowitz for a monthly Portfolio of selected US Equities
Barra industry factor model Statistical factor model
urn
PCA statistical factor model Asymptotic PCA statistical factor model am
ple Mean Re
tu
y p
Sa
Factor Covariance Risk
19
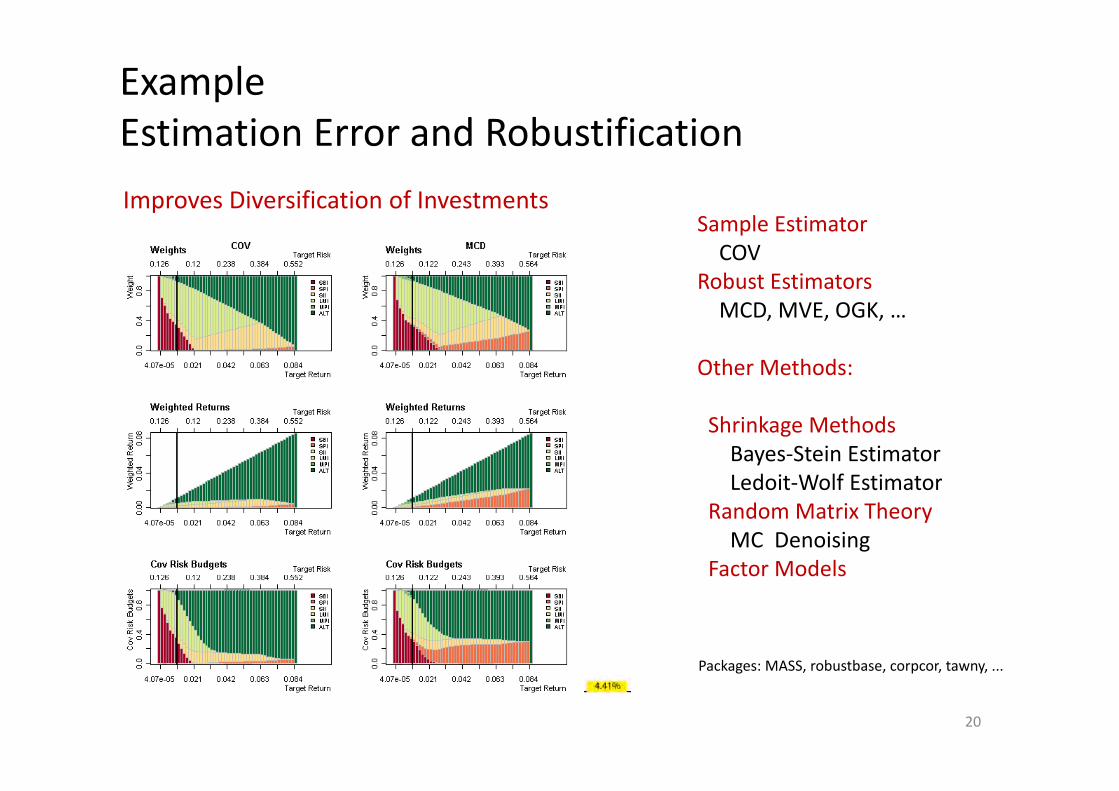
ExampleEstimation Error and RobustificationEstimation Error and Robustification
S l iImproves Diversification of Investments
Sample EstimatorCOV
Robust EstimatorsMCD MVE OGKMCD, MVE, OGK, …
Other Methods:
Shrinkage MethodsBayes‐Stein EstimatorLedoit‐Wolf EstimatorLedoit Wolf Estimator
Random Matrix TheoryMC Denoising
Factor ModelsFactor Models
Packages: MASS robustbase corpcor tawny
20
Packages: MASS, robustbase, corpcor, tawny, ...
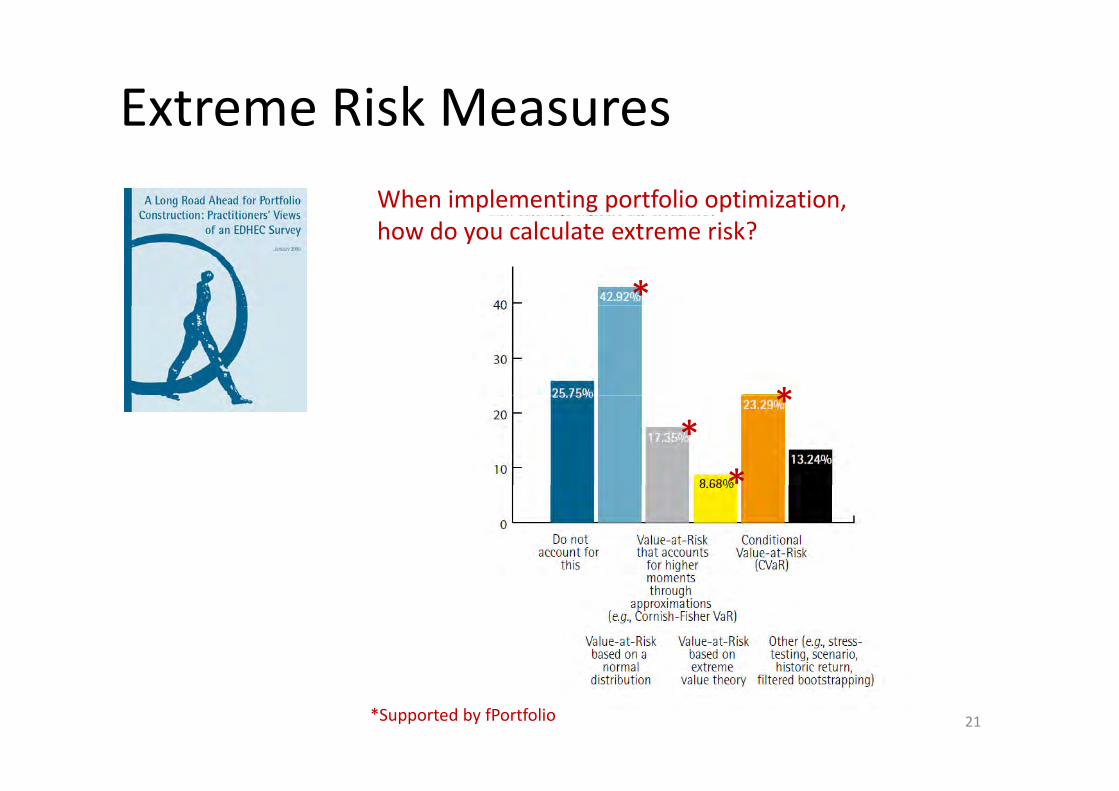
Extreme Risk MeasuresWhen implementing portfolio optimization,
*
how do you calculate extreme risk?
**
*
*
21*Supported by fPortfolio
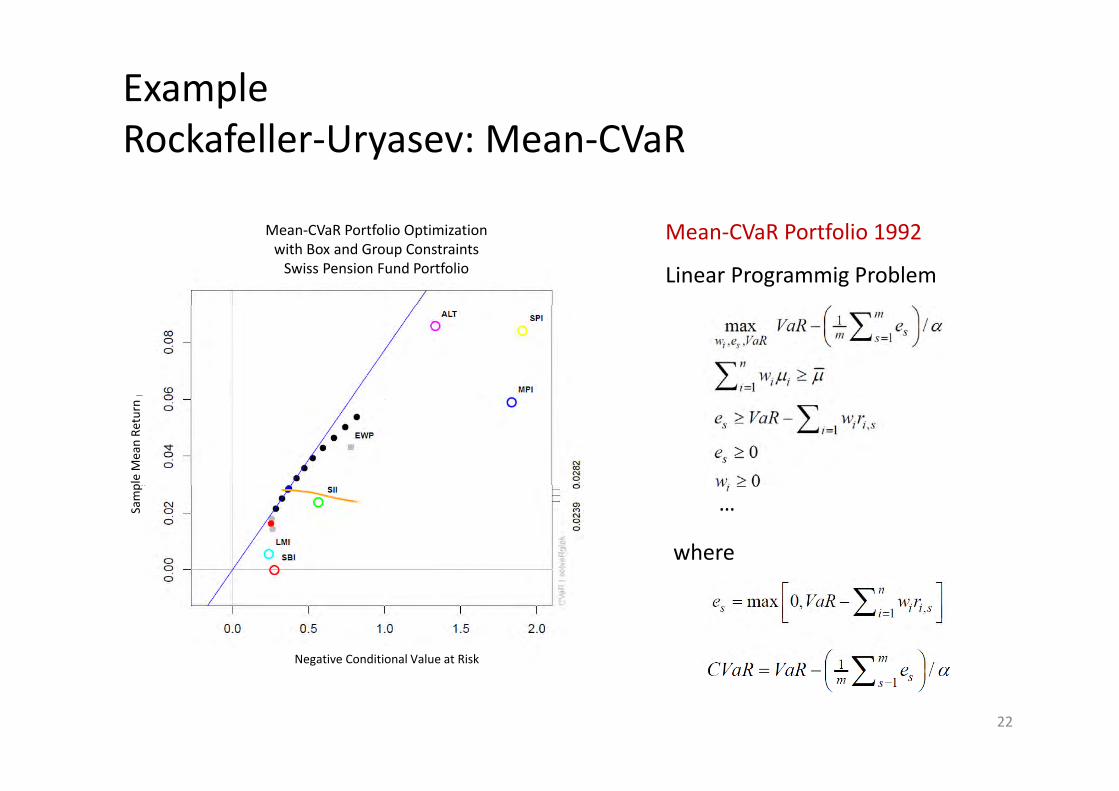
ExampleR k f ll U M CV RRockafeller‐Uryasev: Mean‐CVaR
Mean‐CVaR Portfolio 1992
Linear Programmig Problem
Mean‐CVaR Portfolio Optimizationwith Box and Group Constraints Swiss Pension Fund Portfolio
ple Mean Re
turn
where
…Samp
Negative Conditional Value at Risk
22
g
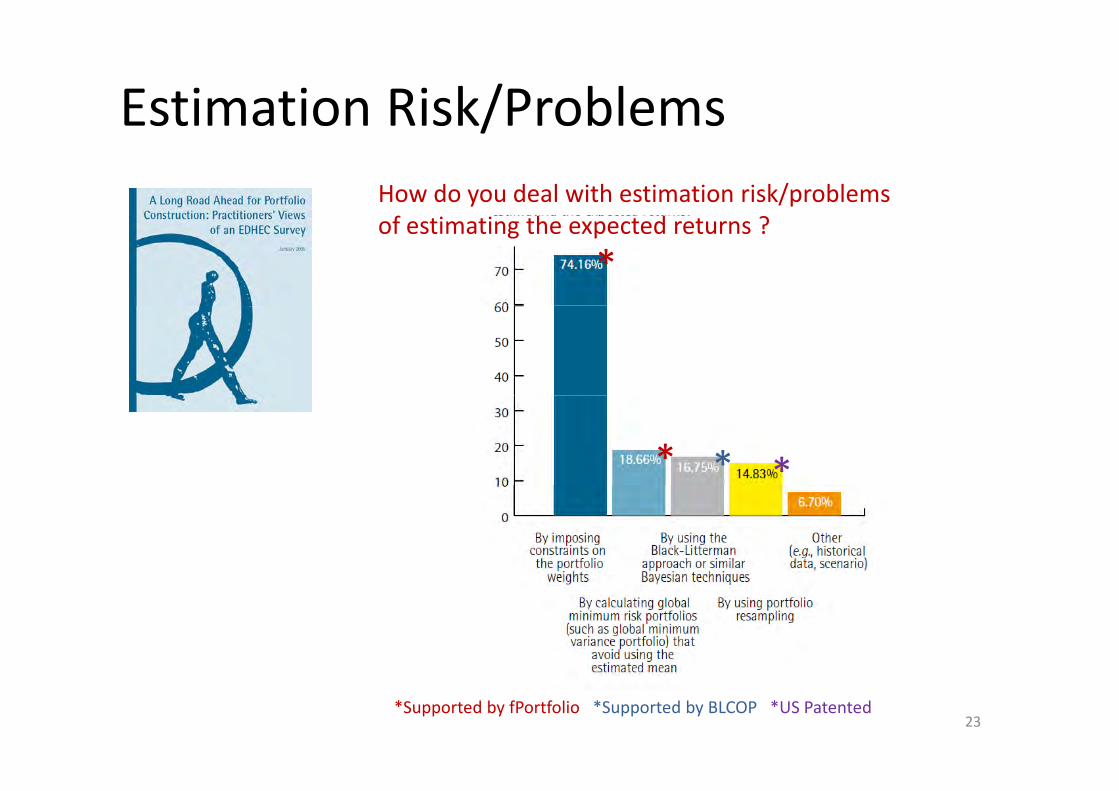
Estimation Risk/Problems/How do you deal with estimation risk/problemsf h d ?
*of estimating the expected returns ?
* **
23*Supported by fPortfolio *Supported by BLCOP *US Patented
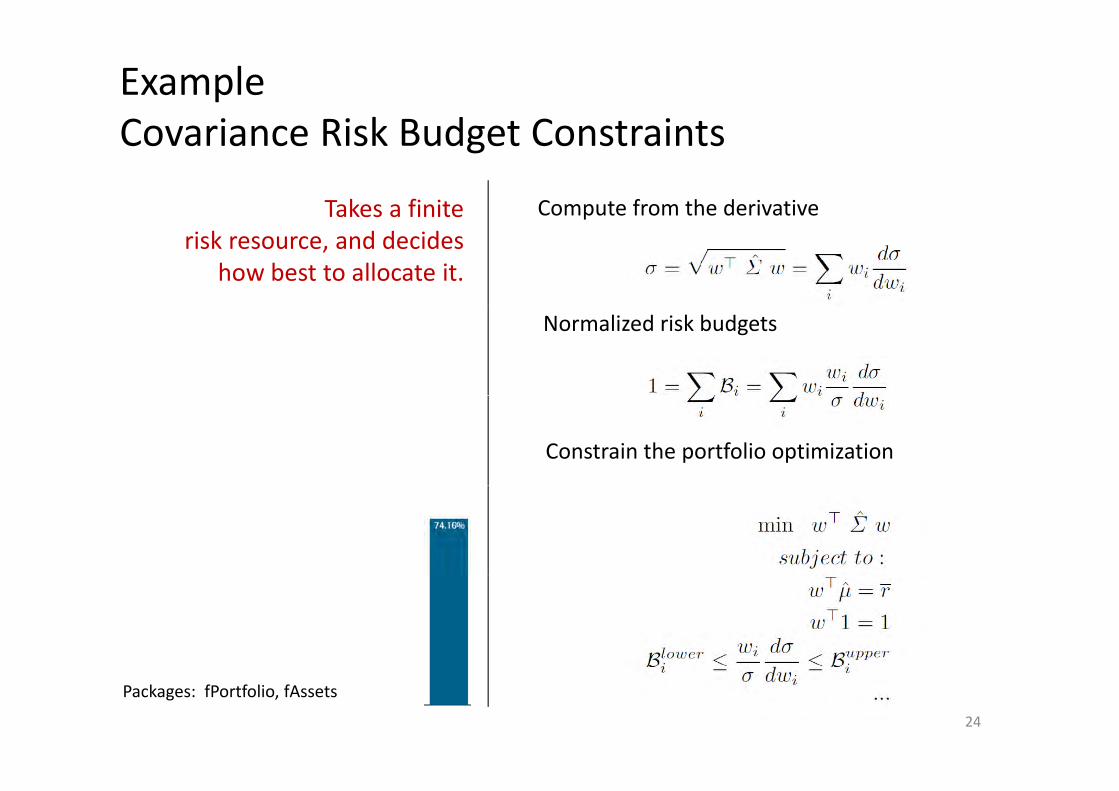
ExampleCovariance Risk Budget ConstraintsCovariance Risk Budget Constraints
Takes a finite Compute from the derivativeTakes a finite risk resource, and decides
how best to allocate it.
p
Normalized risk budgets
Constrain the portfolio optimization
24
Packages: fPortfolio, fAssets
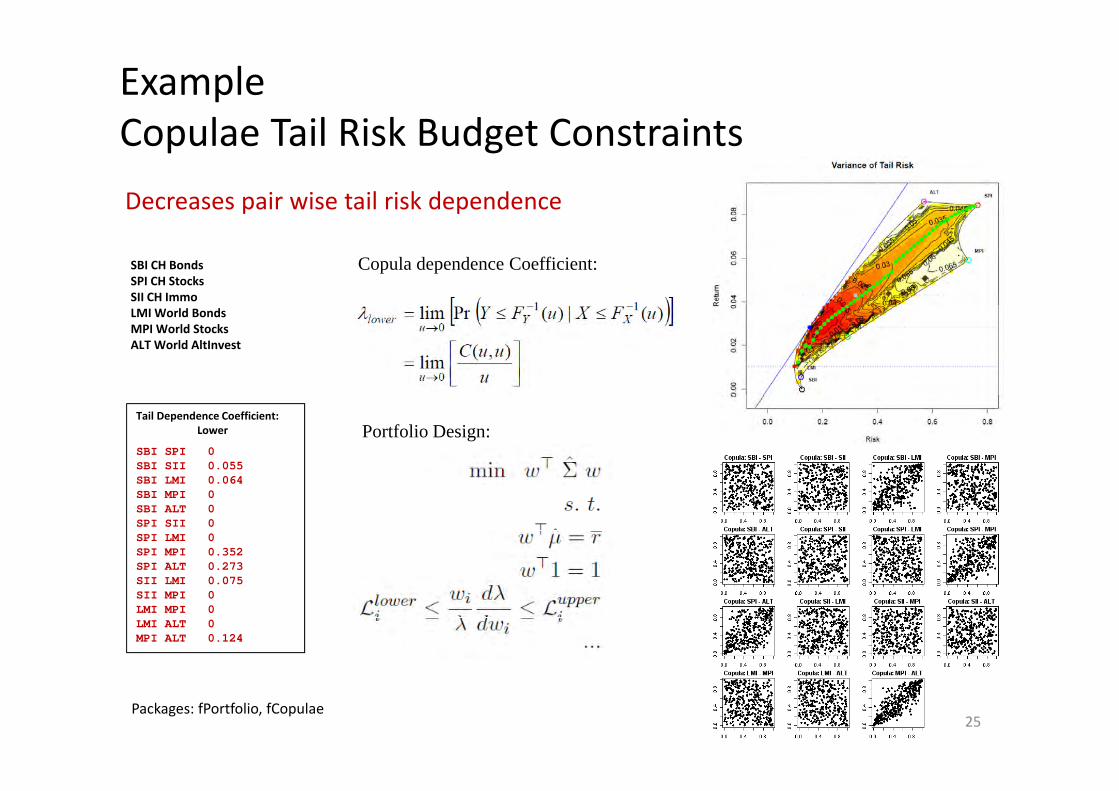
ExampleCopulae Tail Risk Budget ConstraintsCopulae Tail Risk Budget ConstraintsDecreases pair wise tail risk dependence
SBI CH BondsSPI CH StocksSII CH Immo
Copula dependence Coefficient:
LMI World BondsMPI World StocksALT World AltInvest
Tail Dependence Coefficient:Lower
SBI SPI 0 SBI SII 0.055 SBI LMI 0.064
Portfolio Design:
SBI MPI 0 SBI ALT 0 SPI SII 0 SPI LMI 0 SPI MPI 0.352 SPI ALT 0.273 SII LMI 0.075 SII MPI 0 LMI MPI 0 LMI ALT 0 MPI ALT 0.124
25Packages: fPortfolio, fCopulae
Part III
New Directions
• Portfolio Risk Surfaces & Risk Profile Lines• Rastered Motion Risk Surfaces• Portfolio Shape Pictograms• Stability Measures
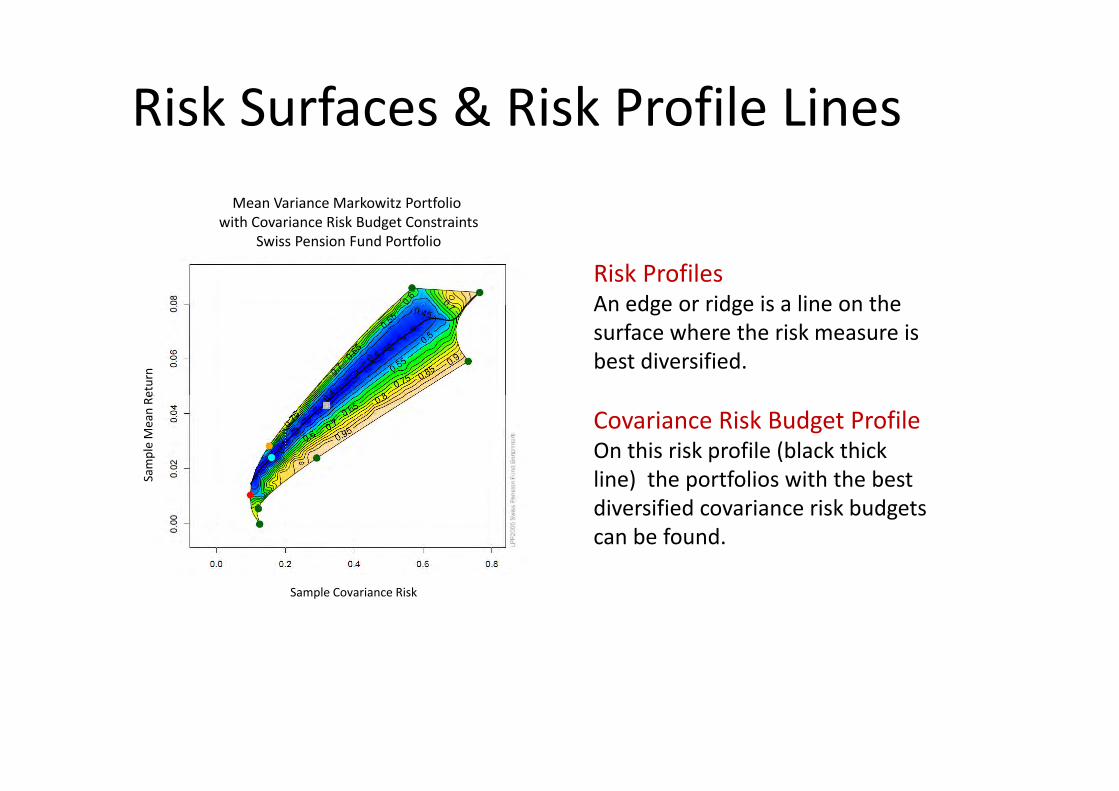
Risk Surfaces & Risk Profile Lines Mean Variance Markowitz Portfolio
Risk ProfilesAn edge or ridge is a line on the
with Covariance Risk Budget ConstraintsSwiss Pension Fund Portfolio
An edge or ridge is a line on the surface where the risk measure is best diversified.
eturn
Covariance Risk Budget ProfileOn this risk profile (black thick line) the portfolios with the bestSa
mple Mean Re
line) the portfolios with the best diversified covariance risk budgets can be found.
Sample Covariance Risk
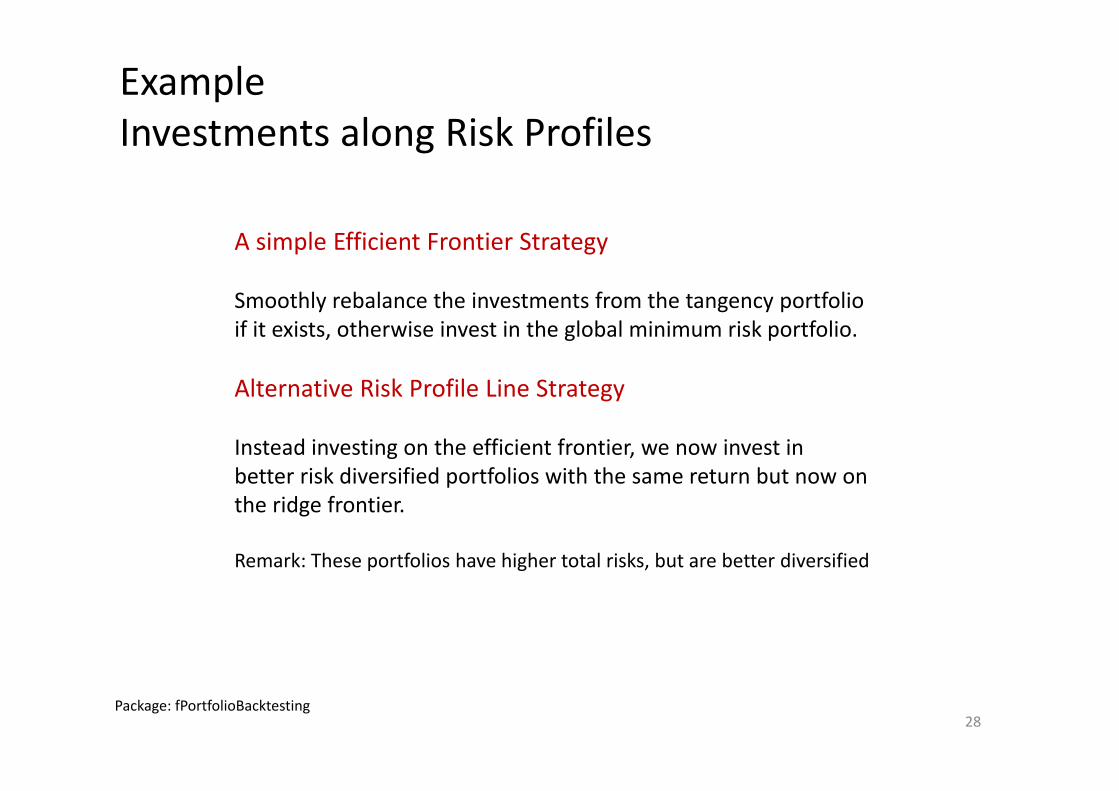
ExampleInvestments along Risk ProfilesInvestments along Risk Profiles
A simple Efficient Frontier Strategy
Smoothly rebalance the investments from the tangency portfolioSmoothly rebalance the investments from the tangency portfolio if it exists, otherwise invest in the global minimum risk portfolio.
Alternative Risk Profile Line StrategyAlternative Risk Profile Line Strategy
Instead investing on the efficient frontier, we now invest in better risk diversified portfolios with the same return but now on pthe ridge frontier.
Remark: These portfolios have higher total risks, but are better diversified
Package: fPortfolioBacktesting28
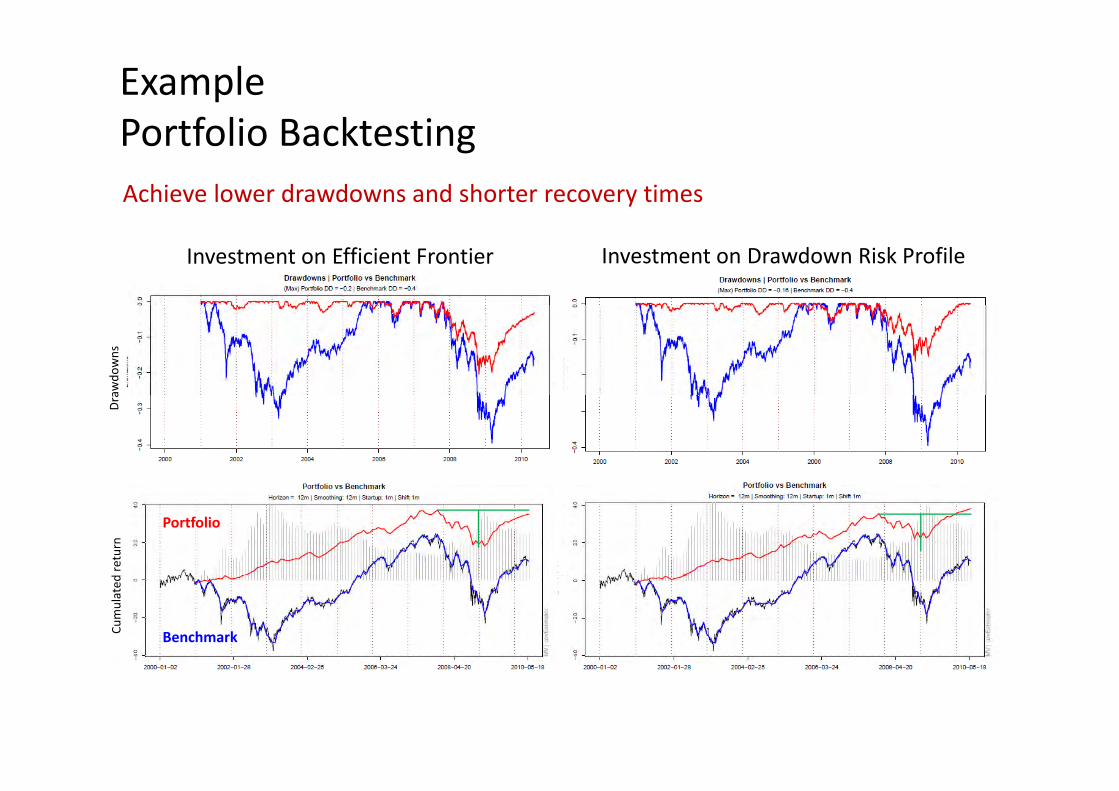
ExamplePortfolio BacktestingPortfolio BacktestingAchieve lower drawdowns and shorter recovery times
Investment on Efficient Frontier Investment on Drawdown Risk Profile
awdo
wns
Dra
return
Portfolio
Cumulated
Benchmark
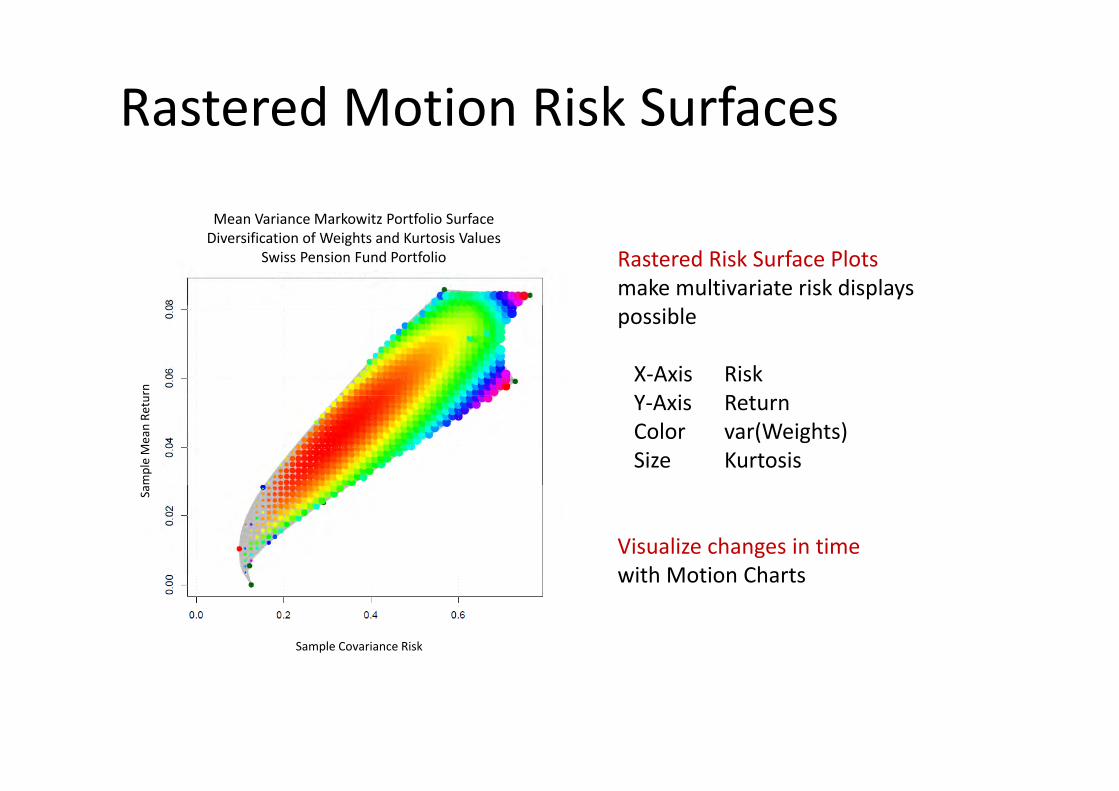
Rastered Motion Risk Surfaces
M V i M k it P tf li S f
Rastered Risk Surface Plots make multivariate risk displays
Mean Variance Markowitz Portfolio SurfaceDiversification of Weights and Kurtosis Values
Swiss Pension Fund Portfolio
possible
X‐Axis RiskY A i Rrn Y‐Axis ReturnColor var(Weights)Size Kurtosis
mple Mean Re
tu
Visualize changes in timewith Motion Charts
Sa
with Motion Charts
Sample Covariance Risk
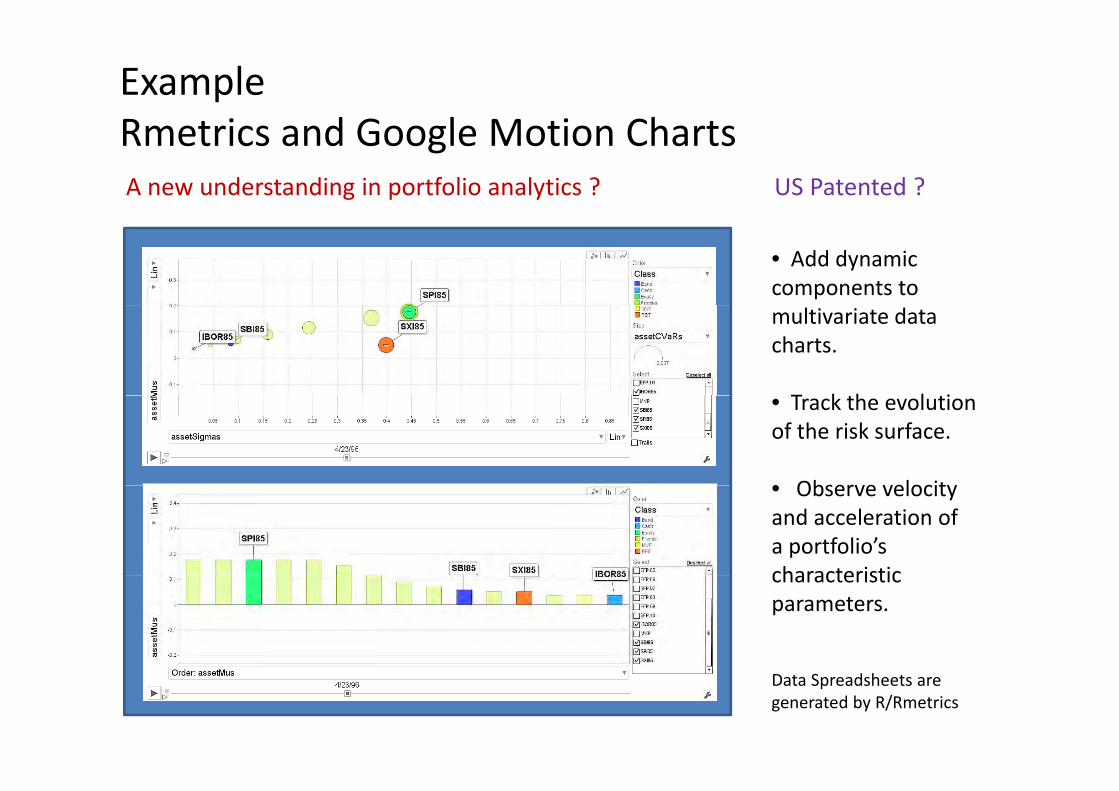
ExampleRmetrics and Google Motion ChartsRmetrics and Google Motion ChartsA new understanding in portfolio analytics ? US Patented ?
• Add dynamic components tomultivariate data charts.
T k h l i• Track the evolution of the risk surface.
• Observe velocity• Observe velocity and acceleration of a portfolio’s characteristiccharacteristic parameters.
Data Spreadsheets are generated by R/Rmetrics
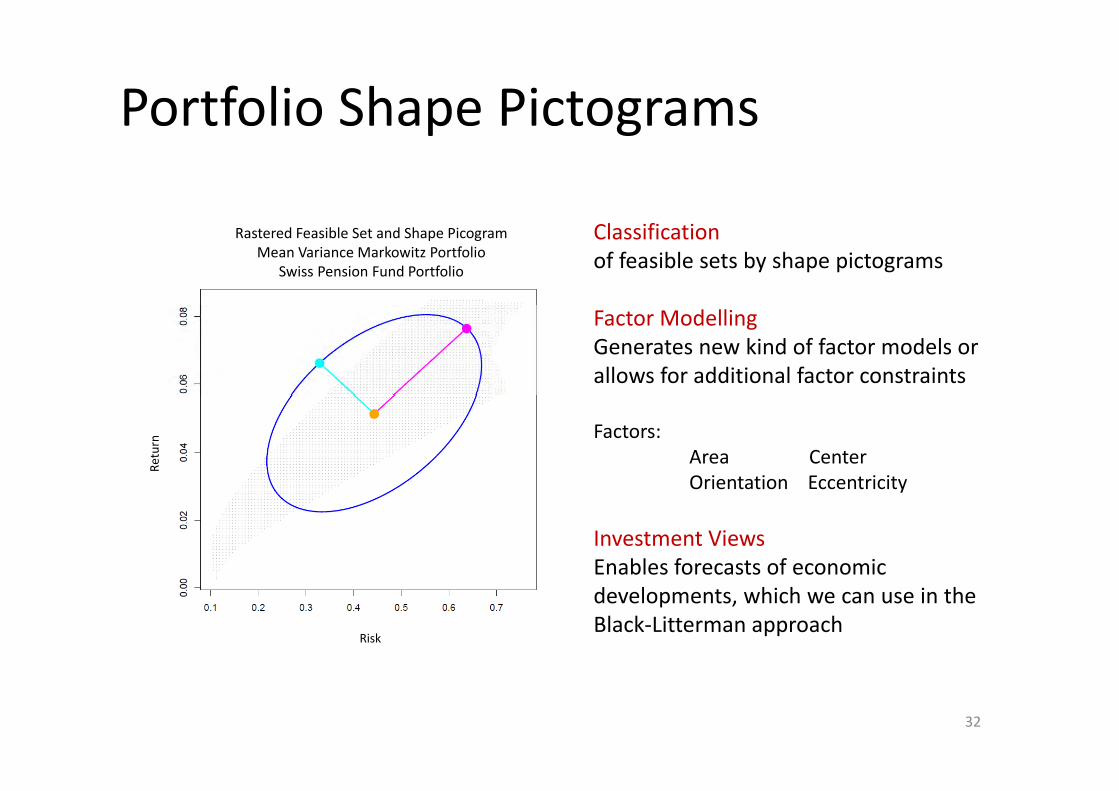
Portfolio Shape Pictogramsp g
Classification of feasible sets by shape pictograms
Rastered Feasible Set and Shape PicogramMean Variance Markowitz Portfolio
Swiss Pension Fund Portfolio
Factor ModellingGenerates new kind of factor models or allows for additional factor constraints
Factors:Area CenterOrientation Eccentricity
Return
Orientation Eccentricity
Investment ViewsEnables forecasts of economic developments, which we can use in the Black‐Litterman approach
Risk
32
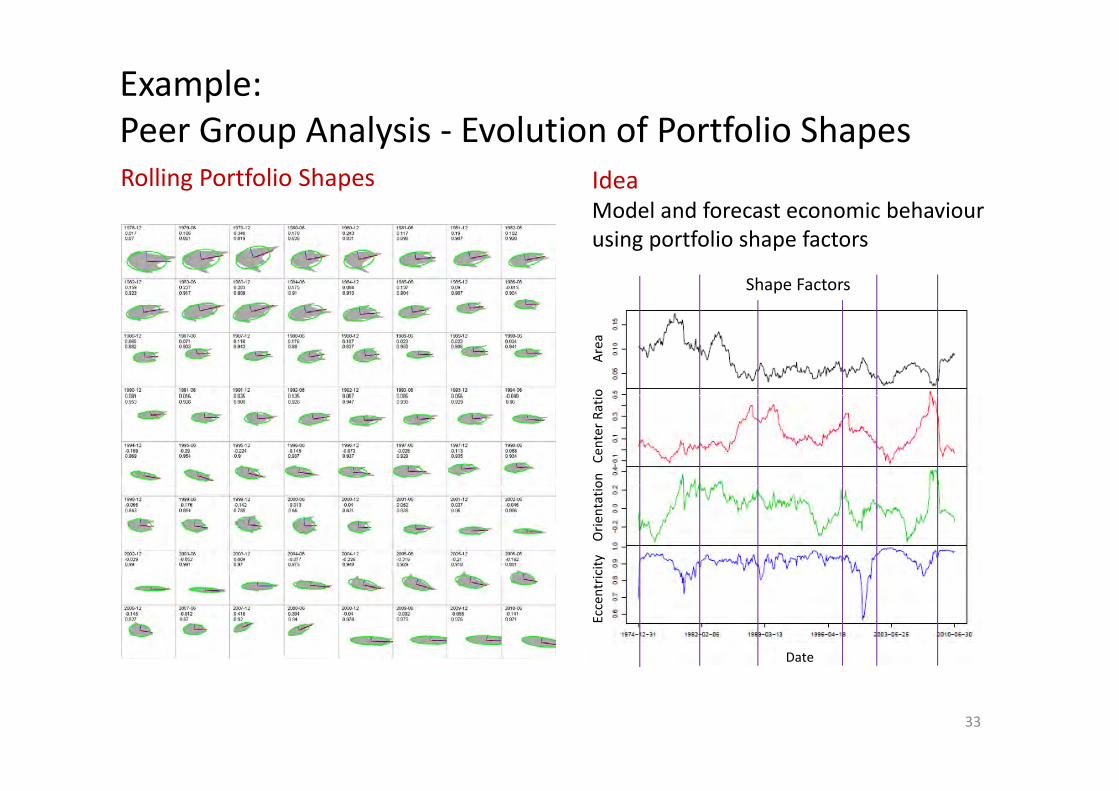
Example:Peer Group Analysis Evolution of Portfolio ShapesPeer Group Analysis ‐ Evolution of Portfolio Shapes
IdeaModel and forecast economic behaviour
Rolling Portfolio ShapesModel and forecast economic behaviourusing portfolio shape factors
Shape Factors
o Area
on Ce
nter
Ratio
city Orie
ntatio
Date
Eccentri
33
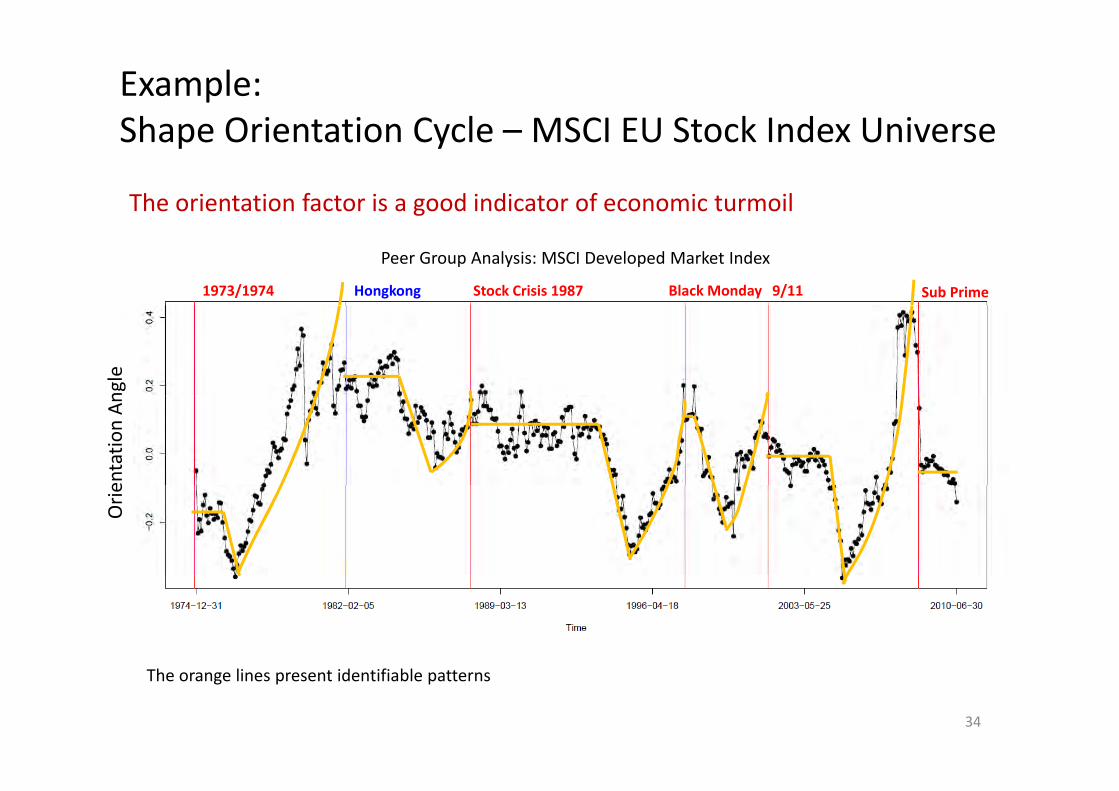
Example:Shape Orientation Cycle MSCI EU Stock Index UniverseShape Orientation Cycle – MSCI EU Stock Index Universe
The orientation factor is a good indicator of economic turmoil
Peer Group Analysis: MSCI Developed Market Index
Hongkong Sub Prime9/11Black MondayStock Crisis 19871973/1974
ngle
entatio
n An
Orie
34
The orange lines present identifiable patterns
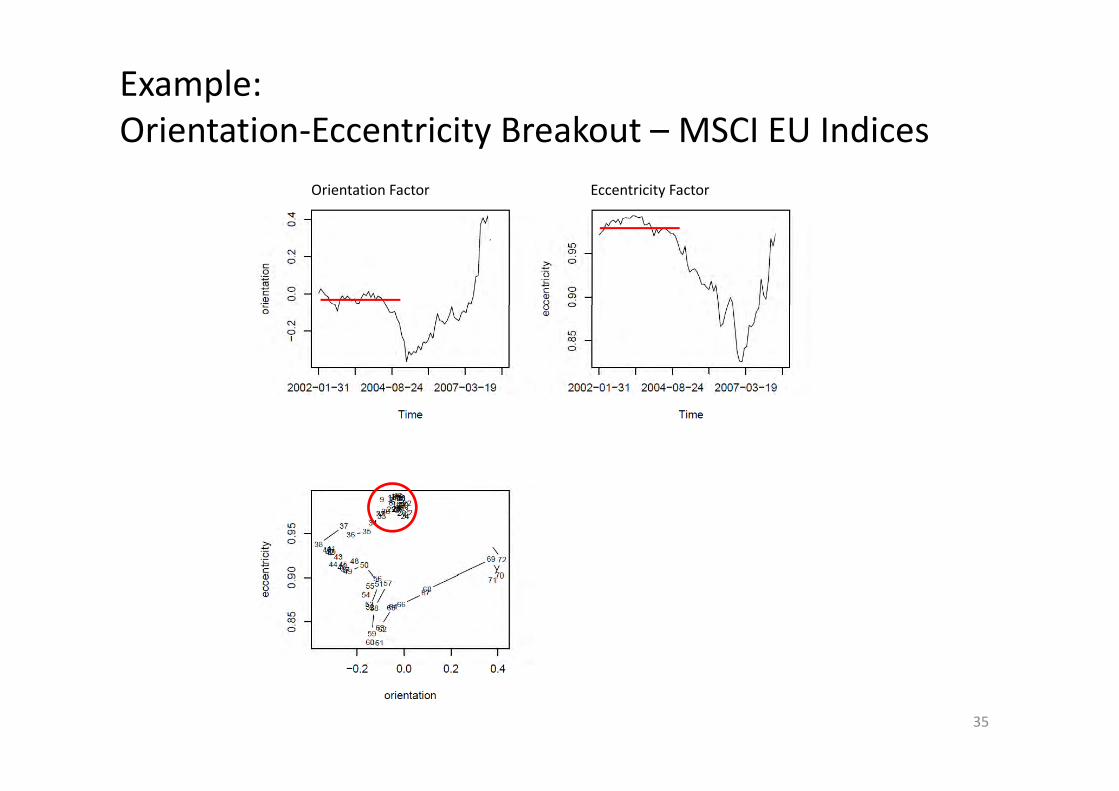
Example:Orientation Eccentricity Breakout MSCI EU IndicesOrientation‐Eccentricity Breakout – MSCI EU Indices
Orientation Factor Eccentricity Factor
35
Stability Measuresy
Value ViewStructural Changes Breakpoint Detection
Volatility ViewVolatility and Extreme Value ClusteringStress Scenario Library
l lMultiresolution ViewTime/Frequency AnalysisWavelet Analysis
Stability ViewPhase Space EmbeddingR b S i i
36
Robust Statistics
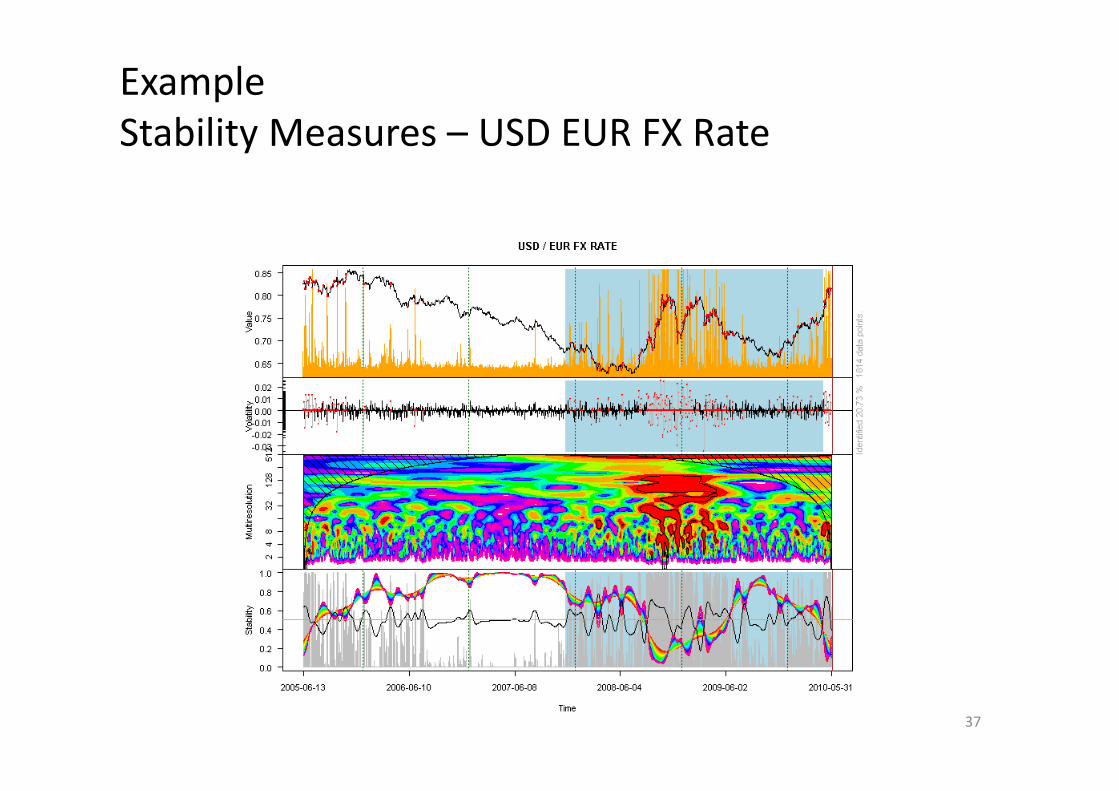
ExampleStability Measures USD EUR FX RateStability Measures – USD EUR FX Rate
37
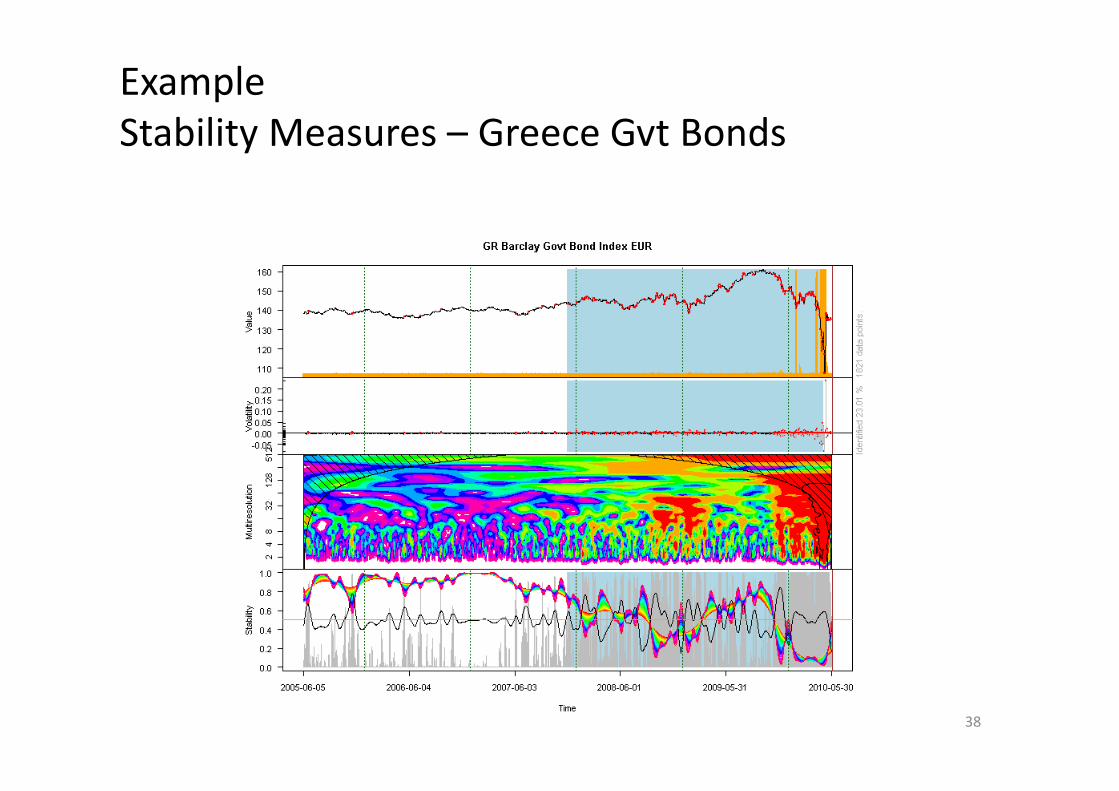
ExampleStability Measures Greece Gvt BondsStability Measures – Greece Gvt Bonds
38
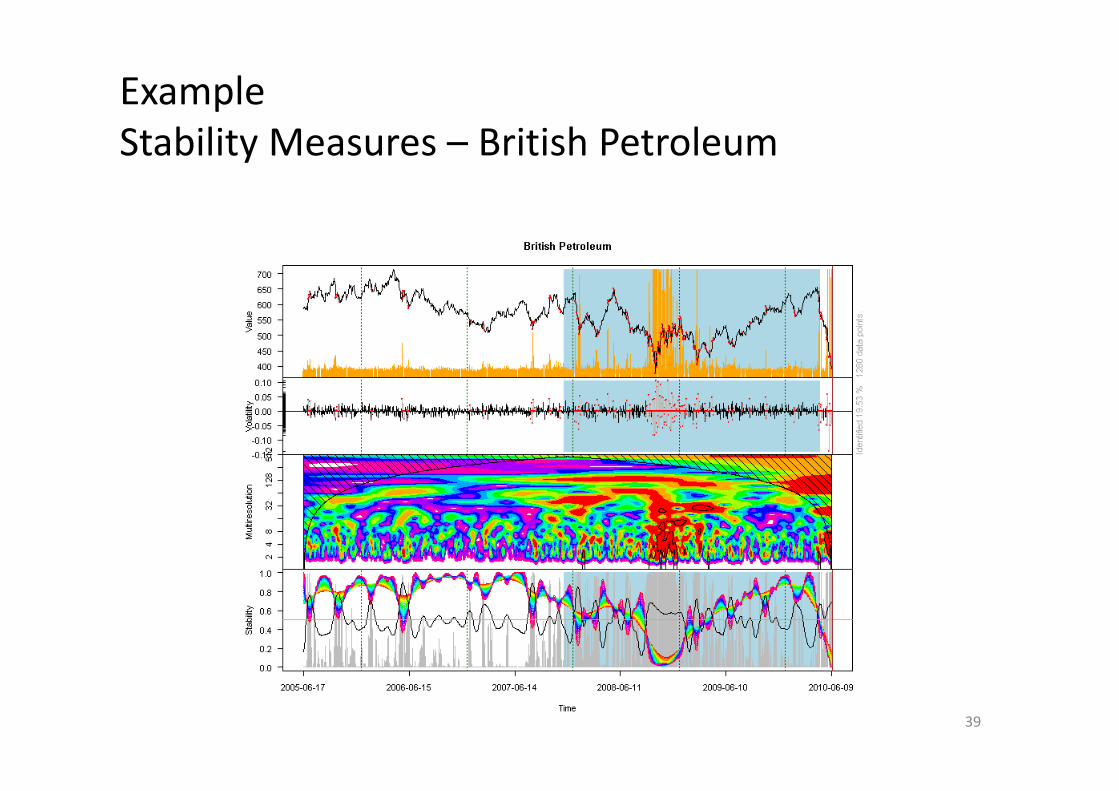
ExampleStability Measures – British Petroleum
39
Our ProposalfStability as New Peer Group & Portfolio Objectives
ObjectiveMaximize Stability
Subject to:jReturn ConstraintsRisk ConstraintsStress Resistance ConstraintsStress Resistance Constraints
40
www.rmetrics.orgwww.ethz.chJoint work with:
Yohan Chalabi
h h h
Yohan ChalabiWilliam ChenChristine DongA d Elli
Thank [email protected] Ellis
Sebastian Pérez SaaibiDavid Scott Thank YouStefan Theussl


![Optimizing for Aesthetically Pleasing Quadrotor Camera Motion · gradient descent and penalizing distance between possible solutions and the feasible hull. Like [Liu et al. 2006],](https://img.pdfslide.us/doc/110x75/5f721644d6702a6f5649e700/optimizing-for-aesthetically-pleasing-quadrotor-camera-motion-gradient-descent-and.jpg)