Embed Size (px)
Citation preview
41 • Spanish Colonial Cartography, 1450–1700David Buisseret
1143
In all of history, very few powers have so rapidly acquiredas much apparently uncharted territory as the Spaniardsdid in the first half of the sixteenth century. This acquisi-tion posed huge administrative, military, and politicalproblems, among which was the problem of how the areamight be mapped. The early sixteenth-century Spain of theCatholic Monarchs, Ferdinand II and Isabella I, initiallyresponded to this problem by establishing at Seville a greatcartographic center whose activities are described in chap-ter 40 in this volume by Alison Sandman. However, astime went by, other mapping groups emerged, and it istheir work that will be described in this chapter. Afterconsidering the nature of these groups, we will discusstheir activities in the main areas of Spain’s overseaspossessions.
These areas will be defined by the same geographical re-gions as those used by the map catalogers of the ArchivoGeneral de Indias (AGI) in Seville. This immense collec-tion, originally brought together in the eighteenth centuryfrom a variety of earlier collections, is the richest deposi-tory for Spain’s early colonial cartography.1 The mainheadings are nine in number, covering the following areas:Santo Domingo, Florida/Louisiana, Mexico, Guatemala,Panama, Venezuela, Peru /Chile, Buenos Aires, and thePhilippines. The maps of the area of Santo Domingo, cov-ering essentially the Caribbean Sea and its islands, numbera few over one hundred for the period before 1700.2 Thesemaps include delineations of whole islands, but also manyplans of great cities such as Havana and Santo Domingo,drawn by the military engineers. Plans of this kind mayalso be found scattered through depositories in Spain andother countries.3
The maps of Florida/Louisiana number only about 60for our period, as might be expected for a region that asyet was of little interest to Spain’s rulers.4 Mexico is an-other matter, for this was one of the richest and best-mapped of early regions. Not only are there the 135 or somaps in the AGI, but there are many maps in other repos-itories such as the archives of Valladolid, as well as in theArchivo General de la Nación in Mexico City.5 More-over, the Jesuits were very active in this area, particularlyin the more remote provinces, and there was a lively in-digenous mapping tradition.6
The maps of Guatemala are relatively few,7 but those ofPanama are numerous, no doubt because the isthmus was
I would like to acknowledge the help of Anne Godlewska, Juan Gil,Brian Harley, John Hébert, and Richard Kagan in the preparation of thischapter.
Abbreviations used in this chapter include: AGI for Archivo Generalde Indias, Seville.
1. Between 1900 and 1921, Pedro Torres Lanzas produced a series ofcatalogs for the AGI. These have been reprinted under different titlesand, along with other map catalogs, are now being replaced by a com-puterized general list. See Pedro Torres Lanzas, Catálogo de mapas yplanos de México, 2 vols. (reprinted [Madrid]: Ministerio de Cultura,Dirección General de Bellas Artes y Archivos, 1985); idem, Catálogo demapas y planos: Guatemala (Guatemala, San Salvador, Honduras,Nicaragua y Costa Rica) (reprinted [Spain]: Ministerio de Cultura, Di-rección General de Bellas Artes y Archivos, 1985); idem, Catálogo demapas y planos: Audiencias de Panamá, Santa Fe y Quito (reprinted[Spain]: Ministerio de Cultura, Dirección General de Bellas Artes yArchivos, 1985); idem, Catálogo de mapas y planos: Virreinato del Perú(Perú y Chile) (reprinted [Spain]: Ministerio de Cultura, Dirección Ge-neral de Bellas Artes y Archivos, 1985); and Pedro Torres Lanzas andJosé Torre Revello, Catálogo de mapas y planos: Buenos Aires, 2 vols.(reprinted [Madrid]: Ministerio de Cultura, Dirección General de BellasArtes y Archivos, 1988). See also Archivo General de Simancas, Mapas,planos y dibujos, 2 vols., by Concepción Alvarez Terán and María delCarmen Fernández Gómez (Valladolid: El Archivo; [Madrid]: Ministe-rio de Cultura, Dirección General de Bellas Artes, Archivos y Bibliote-cas, 1980–90), and Pilar León Tello, Mapas, planos y dibujos de la Sec-ción de Estado del Archivo Histórico Nacional, 2d ed. (Madrid:Ministerio de Cultura, Dirección General del Patrimonio Artístico,Archivos y Museos, 1979).
2. Julio González, Catálogo de mapas y planos de Santo Domingo(Madrid: Dirección General de Archivos y Bibliotecas, 1973).
3. Many are listed and reproduced in the invaluable catalog by JulioGonzález, Planos de ciudades iberoamericanas y filipinas existentes enel Archivo de Indias, 2 vols. ([Madrid]: Instituto de Estudios de Ad-ministración Local, 1951).
4. Julio González, Catálogo de mapas y planos de la Florida y laLuisiana (Madrid: Dirección General del Patrimonio Artístico, Archivosy Museos, 1979).
5. Torres Lanzas, Catálogo de mapas y planos de México. See ArchivoGeneral de la Nación, Catálogo de ilustraciones, 14 vols. (Mexico City:Centro de Información Gráfica del Archivo General de la Nación,1979–82), which, with its many reproductions, gives a remarkable con-spectus of the holdings.
6. See Ernest J. Burrus, La obra cartográfica de la Provincia Mexicanade la Compañía de Jesús (1567–1967) (Madrid: Ediciones José PorrúaTuranzas, 1967), and Barbara E. Mundy, “Mesoamerican Cartogra-phy,” in HC 2.3:183–256.
7. Torres Lanzas, Catálogo de mapas y planos: Guatemala.
the central communications point between Spain’s posses-sions in the Atlantic and those in the Pacific. In SouthAmerica, there are three divisions: Venezuela, Peru /Chile,and Buenos Aires.8 These three areas were not yet centralto Spain’s ambitions in the New World, and the number ofmaps consequently ranges up and down from fifty or so.However, they did contain great cities such as Cartagenaand Lima, which attracted military cartographers, and intheir more remote reaches the Jesuits were often active.9
Finally, there are the Philippines, an even more remote re-gion, for which fewer than twenty maps have survived.10
It might seem from this enumeration that a good manymaps have survived, and that is indeed the case, even ifthey are much scattered. But it is also the case that a hugenumber have perished, both in archival accidents and inmishaps that occurred even before they reached thearchives. We are thus in the situation of attempting to de-scribe a phenomenon without having any clear idea of itsoriginal extent, and this must always be borne in mindwhen trying to make generalizations. However, studentsof Spanish colonial cartography have a remarkable ad-vantage in terms of the number of excellent collections ofmap facsimiles that have been published over the past onehundred years.11
The Various Groups of Cartographers Working on Maps
of Spain’s Overseas Territories
Sandman has described the activities of the navigationschool at the Casa de la Contratación as far as nauticalcartography is concerned, explaining how the patternmap was generated and the nature of the institutionalarrangements. As time went by, leading members of theschool began to produce land cartography of the overseasterritories. The first of these was Alonso de Santa Cruz,whose title was “cosmógrafo de hacer cartas y fabricarinstrumentos para la navegación.” Born about 1505 inSeville, Santa Cruz accompanied Sebastian Cabot on hisexpedition of 1526 –30, then settled back in Seville,where he was named royal cosmographer in 1536.12
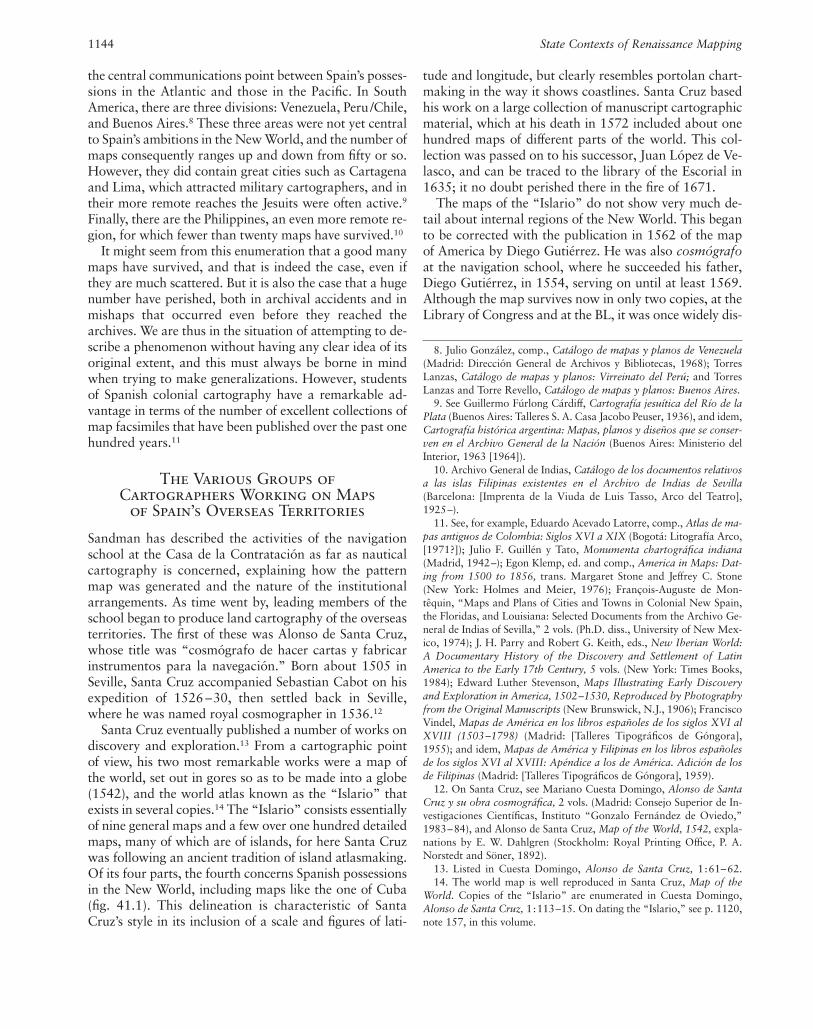
Santa Cruz eventually published a number of works ondiscovery and exploration.13 From a cartographic pointof view, his two most remarkable works were a map ofthe world, set out in gores so as to be made into a globe(1542), and the world atlas known as the “Islario” thatexists in several copies.14 The “Islario” consists essentiallyof nine general maps and a few over one hundred detailedmaps, many of which are of islands, for here Santa Cruzwas following an ancient tradition of island atlasmaking.Of its four parts, the fourth concerns Spanish possessionsin the New World, including maps like the one of Cuba(fig. 41.1). This delineation is characteristic of SantaCruz’s style in its inclusion of a scale and figures of lati-
1144 State Contexts of Renaissance Mapping
8. Julio González, comp., Catálogo de mapas y planos de Venezuela(Madrid: Dirección General de Archivos y Bibliotecas, 1968); TorresLanzas, Catálogo de mapas y planos: Virreinato del Perú; and TorresLanzas and Torre Revello, Catálogo de mapas y planos: Buenos Aires.
9. See Guillermo Fúrlong Cárdiff, Cartografía jesuítica del Río de laPlata (Buenos Aires: Talleres S. A. Casa Jacobo Peuser, 1936), and idem,Cartografía histórica argentina: Mapas, planos y diseños que se conser-ven en el Archivo General de la Nación (Buenos Aires: Ministerio delInterior, 1963 [1964]).
10. Archivo General de Indias, Catálogo de los documentos relativosa las islas Filipinas existentes en el Archivo de Indias de Sevilla(Barcelona: [Imprenta de la Viuda de Luis Tasso, Arco del Teatro],1925–).
11. See, for example, Eduardo Acevado Latorre, comp., Atlas de ma-pas antiguos de Colombia: Siglos XVI a XIX (Bogotá: Litografía Arco,[1971?]); Julio F. Guillén y Tato, Monumenta chartográfica indiana(Madrid, 1942–); Egon Klemp, ed. and comp., America in Maps: Dat-ing from 1500 to 1856, trans. Margaret Stone and Jeffrey C. Stone(New York: Holmes and Meier, 1976); François-Auguste de Mon-têquin, “Maps and Plans of Cities and Towns in Colonial New Spain,the Floridas, and Louisiana: Selected Documents from the Archivo Ge-neral de Indias of Sevilla,” 2 vols. (Ph.D. diss., University of New Mex-ico, 1974); J. H. Parry and Robert G. Keith, eds., New Iberian World:A Documentary History of the Discovery and Settlement of LatinAmerica to the Early 17th Century, 5 vols. (New York: Times Books,1984); Edward Luther Stevenson, Maps Illustrating Early Discoveryand Exploration in America, 1502–1530, Reproduced by Photographyfrom the Original Manuscripts (New Brunswick, N.J., 1906); FranciscoVindel, Mapas de América en los libros españoles de los siglos XVI alXVIII (1503–1798) (Madrid: [Talleres Tipográficos de Góngora],1955); and idem, Mapas de América y Filipinas en los libros españolesde los siglos XVI al XVIII: Apéndice a los de América. Adición de losde Filipinas (Madrid: [Talleres Tipográficos de Góngora], 1959).
12. On Santa Cruz, see Mariano Cuesta Domingo, Alonso de SantaCruz y su obra cosmográfica, 2 vols. (Madrid: Consejo Superior de In-vestigaciones Científicas, Instituto “Gonzalo Fernández de Oviedo,”1983–84), and Alonso de Santa Cruz, Map of the World, 1542, expla-nations by E. W. Dahlgren (Stockholm: Royal Printing Office, P. A.Norstedt and Söner, 1892).
13. Listed in Cuesta Domingo, Alonso de Santa Cruz, 1:61–62.14. The world map is well reproduced in Santa Cruz, Map of the
World. Copies of the “Islario” are enumerated in Cuesta Domingo,Alonso de Santa Cruz, 1:113–15. On dating the “Islario,” see p. 1120,note 157, in this volume.
tude and longitude, but clearly resembles portolan chart-making in the way it shows coastlines. Santa Cruz basedhis work on a large collection of manuscript cartographicmaterial, which at his death in 1572 included about onehundred maps of different parts of the world. This col-lection was passed on to his successor, Juan López de Ve-lasco, and can be traced to the library of the Escorial in1635; it no doubt perished there in the fire of 1671.
The maps of the “Islario” do not show very much de-tail about internal regions of the New World. This beganto be corrected with the publication in 1562 of the mapof America by Diego Gutiérrez. He was also cosmógrafoat the navigation school, where he succeeded his father,Diego Gutiérrez, in 1554, serving on until at least 1569.Although the map survives now in only two copies, at theLibrary of Congress and at the BL, it was once widely dis-
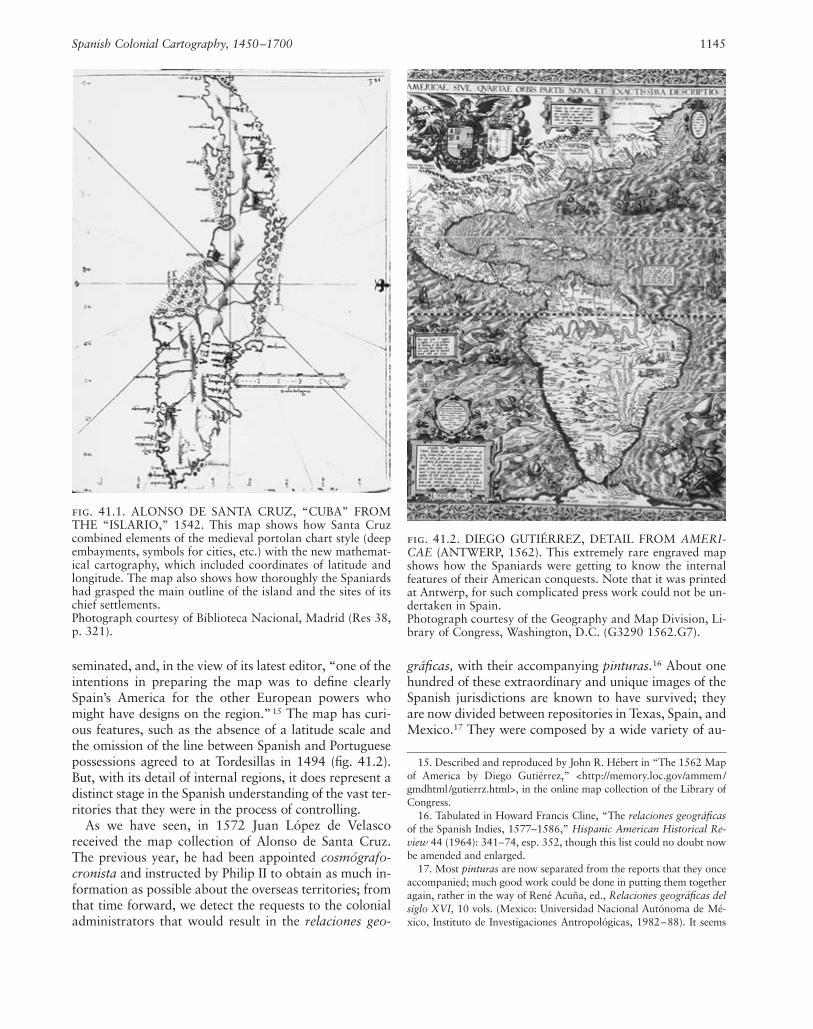
seminated, and, in the view of its latest editor, “one of theintentions in preparing the map was to define clearlySpain’s America for the other European powers whomight have designs on the region.”15 The map has curi-ous features, such as the absence of a latitude scale andthe omission of the line between Spanish and Portuguesepossessions agreed to at Tordesillas in 1494 (fig. 41.2).But, with its detail of internal regions, it does represent adistinct stage in the Spanish understanding of the vast ter-ritories that they were in the process of controlling.
As we have seen, in 1572 Juan López de Velasco received the map collection of Alonso de Santa Cruz. The previous year, he had been appointed cosmógrafo-cronista and instructed by Philip II to obtain as much in-formation as possible about the overseas territories; fromthat time forward, we detect the requests to the colonialadministrators that would result in the relaciones geo-
gráficas, with their accompanying pinturas.16 About onehundred of these extraordinary and unique images of theSpanish jurisdictions are known to have survived; theyare now divided between repositories in Texas, Spain, andMexico.17 They were composed by a wide variety of au-
Spanish Colonial Cartography, 1450–1700 1145
fig. 41.1. ALONSO DE SANTA CRUZ, “CUBA” FROMTHE “ISLARIO,” 1542. This map shows how Santa Cruzcombined elements of the medieval portolan chart style (deepembayments, symbols for cities, etc.) with the new mathemat-ical cartography, which included coordinates of latitude andlongitude. The map also shows how thoroughly the Spaniardshad grasped the main outline of the island and the sites of itschief settlements. Photograph courtesy of Biblioteca Nacional, Madrid (Res 38,p. 321).
fig. 41.2. DIEGO GUTIÉRREZ, DETAIL FROM AMERI-CAE (ANTWERP, 1562). This extremely rare engraved mapshows how the Spaniards were getting to know the internalfeatures of their American conquests. Note that it was printedat Antwerp, for such complicated press work could not be un-dertaken in Spain.Photograph courtesy of the Geography and Map Division, Li-brary of Congress, Washington, D.C. (G3290 1562.G7).
15. Described and reproduced by John R. Hébert in “The 1562 Mapof America by Diego Gutiérrez,” <http://memory.loc.gov/ammem/gmdhtml /gutierrz.html>, in the online map collection of the Library ofCongress.
16. Tabulated in Howard Francis Cline, “The relaciones geográficasof the Spanish Indies, 1577–1586,” Hispanic American Historical Re-view 44 (1964): 341–74, esp. 352, though this list could no doubt nowbe amended and enlarged.
17. Most pinturas are now separated from the reports that they onceaccompanied; much good work could be done in putting them togetheragain, rather in the way of René Acuña, ed., Relaciones geográficas delsiglo XVI, 10 vols. (Mexico: Universidad Nacional Autónoma de Mé-xico, Instituto de Investigaciones Antropológicas, 1982–88). It seems
thors. A few of them had formal European training, butmany seem to have been extemporary mapmakers, andsome retained a purely indigenous style. Of course, thisgreat variety of presentation made it very difficult forLópez de Velasco to combine the information into a setof detailed maps.
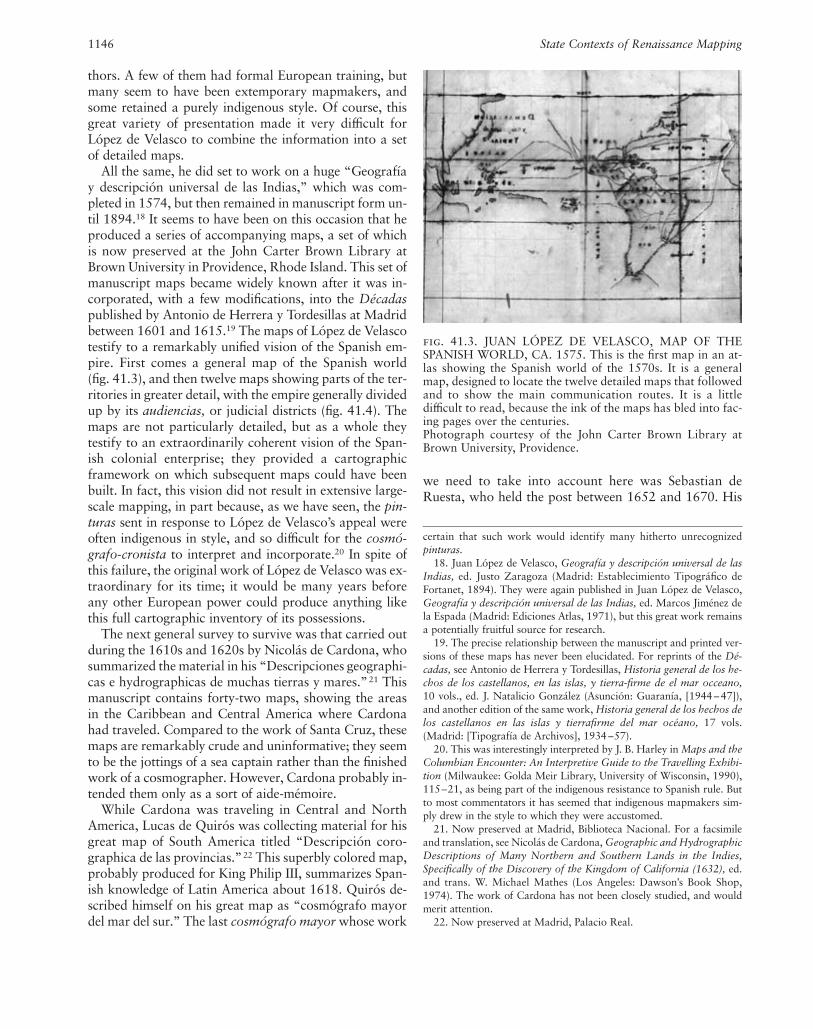
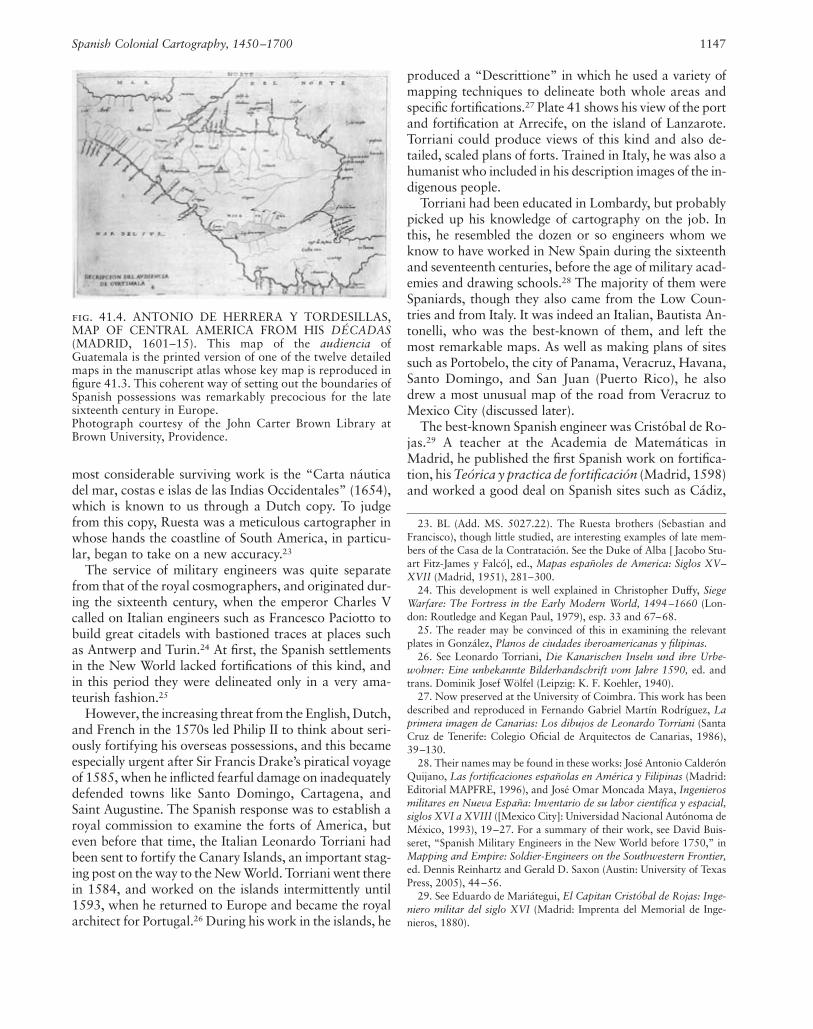
All the same, he did set to work on a huge “Geografíay descripción universal de las Indias,” which was com-pleted in 1574, but then remained in manuscript form un-til 1894.18 It seems to have been on this occasion that heproduced a series of accompanying maps, a set of whichis now preserved at the John Carter Brown Library atBrown University in Providence, Rhode Island. This set ofmanuscript maps became widely known after it was in-corporated, with a few modifications, into the Décadaspublished by Antonio de Herrera y Tordesillas at Madridbetween 1601 and 1615.19 The maps of López de Velascotestify to a remarkably unified vision of the Spanish em-pire. First comes a general map of the Spanish world(fig. 41.3), and then twelve maps showing parts of the ter-ritories in greater detail, with the empire generally dividedup by its audiencias, or judicial districts (fig. 41.4). Themaps are not particularly detailed, but as a whole theytestify to an extraordinarily coherent vision of the Span-ish colonial enterprise; they provided a cartographicframework on which subsequent maps could have beenbuilt. In fact, this vision did not result in extensive large-scale mapping, in part because, as we have seen, the pin-turas sent in response to López de Velasco’s appeal wereoften indigenous in style, and so difficult for the cosmó-grafo-cronista to interpret and incorporate.20 In spite ofthis failure, the original work of López de Velasco was ex-traordinary for its time; it would be many years beforeany other European power could produce anything likethis full cartographic inventory of its possessions.
The next general survey to survive was that carried outduring the 1610s and 1620s by Nicolás de Cardona, whosummarized the material in his “Descripciones geographi-cas e hydrographicas de muchas tierras y mares.”21 Thismanuscript contains forty-two maps, showing the areasin the Caribbean and Central America where Cardonahad traveled. Compared to the work of Santa Cruz, thesemaps are remarkably crude and uninformative; they seemto be the jottings of a sea captain rather than the finishedwork of a cosmographer. However, Cardona probably in-tended them only as a sort of aide-mémoire.
While Cardona was traveling in Central and NorthAmerica, Lucas de Quirós was collecting material for hisgreat map of South America titled “Descripción coro-graphica de las provincias.”22 This superbly colored map,probably produced for King Philip III, summarizes Span-ish knowledge of Latin America about 1618. Quirós de-scribed himself on his great map as “cosmógrafo mayordel mar del sur.” The last cosmógrafo mayor whose work
we need to take into account here was Sebastian deRuesta, who held the post between 1652 and 1670. His
1146 State Contexts of Renaissance Mapping
fig. 41.3. JUAN LÓPEZ DE VELASCO, MAP OF THESPANISH WORLD, CA. 1575. This is the first map in an at-las showing the Spanish world of the 1570s. It is a generalmap, designed to locate the twelve detailed maps that followedand to show the main communication routes. It is a littledifficult to read, because the ink of the maps has bled into fac-ing pages over the centuries.Photograph courtesy of the John Carter Brown Library atBrown University, Providence.
certain that such work would identify many hitherto unrecognizedpinturas.
18. Juan López de Velasco, Geografía y descripción universal de lasIndias, ed. Justo Zaragoza (Madrid: Establecimiento Tipográfico deFortanet, 1894). They were again published in Juan López de Velasco,Geografía y descripción universal de las Indias, ed. Marcos Jiménez dela Espada (Madrid: Ediciones Atlas, 1971), but this great work remainsa potentially fruitful source for research.
19. The precise relationship between the manuscript and printed ver-sions of these maps has never been elucidated. For reprints of the Dé-cadas, see Antonio de Herrera y Tordesillas, Historia general de los he-chos de los castellanos, en las islas, y tierra-firme de el mar occeano,10 vols., ed. J. Natalicio González (Asunción: Guaranía, [1944 – 47]),and another edition of the same work, Historia general de los hechos delos castellanos en las islas y tierrafirme del mar océano, 17 vols.(Madrid: [Tipografía de Archivos], 1934 –57).
20. This was interestingly interpreted by J. B. Harley in Maps and theColumbian Encounter: An Interpretive Guide to the Travelling Exhibi-tion (Milwaukee: Golda Meir Library, University of Wisconsin, 1990),115–21, as being part of the indigenous resistance to Spanish rule. Butto most commentators it has seemed that indigenous mapmakers sim-ply drew in the style to which they were accustomed.
21. Now preserved at Madrid, Biblioteca Nacional. For a facsimileand translation, see Nicolás de Cardona, Geographic and HydrographicDescriptions of Many Northern and Southern Lands in the Indies,Specifically of the Discovery of the Kingdom of California (1632), ed.and trans. W. Michael Mathes (Los Angeles: Dawson’s Book Shop,1974). The work of Cardona has not been closely studied, and wouldmerit attention.
22. Now preserved at Madrid, Palacio Real.
most considerable surviving work is the “Carta náuticadel mar, costas e islas de las Indias Occidentales” (1654),which is known to us through a Dutch copy. To judgefrom this copy, Ruesta was a meticulous cartographer inwhose hands the coastline of South America, in particu-lar, began to take on a new accuracy.23
The service of military engineers was quite separatefrom that of the royal cosmographers, and originated dur-ing the sixteenth century, when the emperor Charles Vcalled on Italian engineers such as Francesco Paciotto tobuild great citadels with bastioned traces at places suchas Antwerp and Turin.24 At first, the Spanish settlementsin the New World lacked fortifications of this kind, andin this period they were delineated only in a very ama-teurish fashion.25
However, the increasing threat from the English, Dutch,and French in the 1570s led Philip II to think about seri-ously fortifying his overseas possessions, and this becameespecially urgent after Sir Francis Drake’s piratical voyageof 1585, when he inflicted fearful damage on inadequatelydefended towns like Santo Domingo, Cartagena, andSaint Augustine. The Spanish response was to establish aroyal commission to examine the forts of America, buteven before that time, the Italian Leonardo Torriani hadbeen sent to fortify the Canary Islands, an important stag-ing post on the way to the New World. Torriani went therein 1584, and worked on the islands intermittently until1593, when he returned to Europe and became the royalarchitect for Portugal.26 During his work in the islands, he
produced a “Descrittione” in which he used a variety ofmapping techniques to delineate both whole areas andspecific fortifications.27 Plate 41 shows his view of the portand fortification at Arrecife, on the island of Lanzarote.Torriani could produce views of this kind and also de-tailed, scaled plans of forts. Trained in Italy, he was also ahumanist who included in his description images of the in-digenous people.
Torriani had been educated in Lombardy, but probablypicked up his knowledge of cartography on the job. Inthis, he resembled the dozen or so engineers whom weknow to have worked in New Spain during the sixteenthand seventeenth centuries, before the age of military acad-emies and drawing schools.28 The majority of them wereSpaniards, though they also came from the Low Coun-tries and from Italy. It was indeed an Italian, Bautista An-tonelli, who was the best-known of them, and left themost remarkable maps. As well as making plans of sitessuch as Portobelo, the city of Panama, Veracruz, Havana,Santo Domingo, and San Juan (Puerto Rico), he alsodrew a most unusual map of the road from Veracruz toMexico City (discussed later).
The best-known Spanish engineer was Cristóbal de Ro-jas.29 A teacher at the Academia de Matemáticas inMadrid, he published the first Spanish work on fortifica-tion, his Teórica y practica de fortificación (Madrid, 1598)and worked a good deal on Spanish sites such as Cádiz,
Spanish Colonial Cartography, 1450–1700 1147
fig. 41.4. ANTONIO DE HERRERA Y TORDESILLAS,MAP OF CENTRAL AMERICA FROM HIS DÉCADAS(MADRID, 1601–15). This map of the audiencia ofGuatemala is the printed version of one of the twelve detailedmaps in the manuscript atlas whose key map is reproduced infigure 41.3. This coherent way of setting out the boundaries ofSpanish possessions was remarkably precocious for the latesixteenth century in Europe.Photograph courtesy of the John Carter Brown Library atBrown University, Providence.
23. BL (Add. MS. 5027.22). The Ruesta brothers (Sebastian andFrancisco), though little studied, are interesting examples of late mem-bers of the Casa de la Contratación. See the Duke of Alba [ Jacobo Stu-art Fitz-James y Falcó], ed., Mapas españoles de America: Siglos XV–XVII (Madrid, 1951), 281–300.
24. This development is well explained in Christopher Duffy, SiegeWarfare: The Fortress in the Early Modern World, 1494 –1660 (Lon-don: Routledge and Kegan Paul, 1979), esp. 33 and 67–68.
25. The reader may be convinced of this in examining the relevantplates in González, Planos de ciudades iberoamericanas y filipinas.
26. See Leonardo Torriani, Die Kanarischen Inseln und ihre Urbe-wohner: Eine unbekannte Bilderhandschrift vom Jahre 1590, ed. andtrans. Dominik Josef Wölfel (Leipzig: K. F. Koehler, 1940).
27. Now preserved at the University of Coimbra. This work has beendescribed and reproduced in Fernando Gabriel Martín Rodríguez, Laprimera imagen de Canarias: Los dibujos de Leonardo Torriani (SantaCruz de Tenerife: Colegio Oficial de Arquitectos de Canarias, 1986),39–130.
28. Their names may be found in these works: José Antonio CalderónQuijano, Las fortificaciones españolas en América y Filipinas (Madrid:Editorial MAPFRE, 1996), and José Omar Moncada Maya, Ingenierosmilitares en Nueva España: Inventario de su labor científica y espacial,siglos XVI a XVIII ([Mexico City]: Universidad Nacional Autónoma deMéxico, 1993), 19–27. For a summary of their work, see David Buis-seret, “Spanish Military Engineers in the New World before 1750,” inMapping and Empire: Soldier-Engineers on the Southwestern Frontier,ed. Dennis Reinhartz and Gerald D. Saxon (Austin: University of TexasPress, 2005), 44 –56.
29. See Eduardo de Mariátegui, El Capitan Cristóbal de Rojas: Inge-niero militar del siglo XVI (Madrid: Imprenta del Memorial de Inge-nieros, 1880).
Coruna, and Gibraltar. In the early seventeenth century,he compiled plans of the main Spanish strongholds in theNew World: Cartagena, Havana, the city of Panama, andPortobelo. Like Antonelli, Rojas was acquainted with thelatest European cartographic practices, producing cityplans that were complete with scales and orientation, incontrast to the work of the years before the 1580s. Theother seventeenth-century engineers produced plans thatwere technically correct, and would eventually be of greatinterest to historians who wished to understand the devel-opment of the great cities of Spanish America.
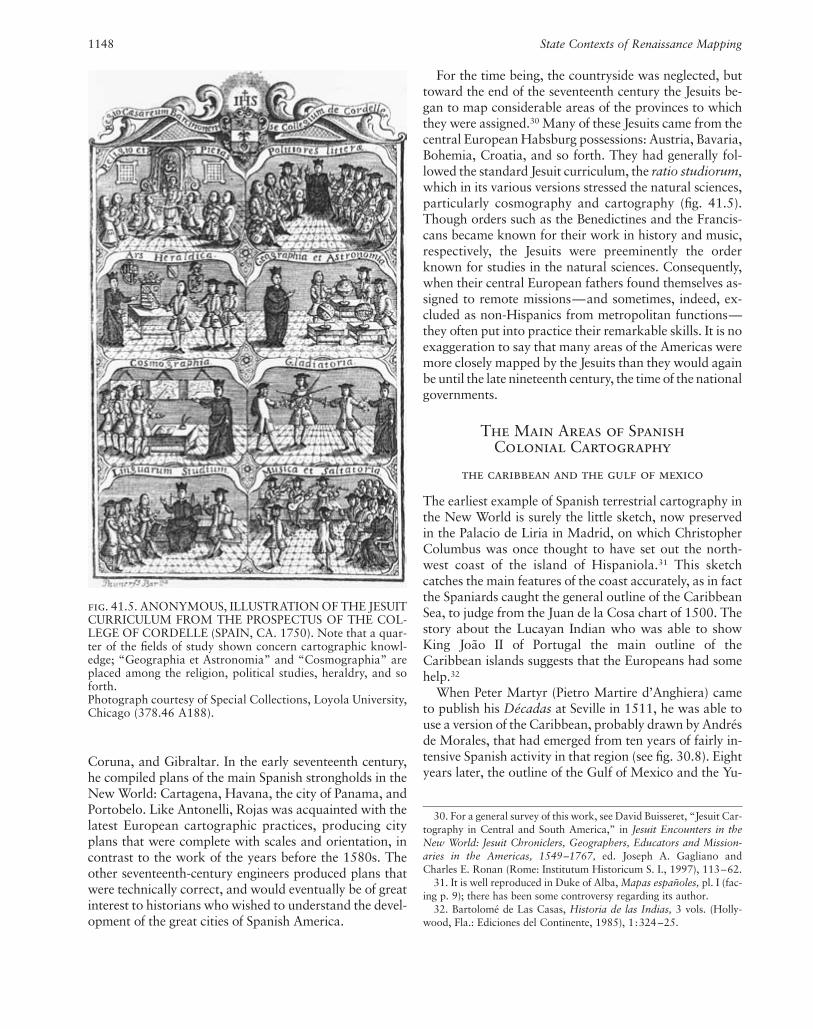
For the time being, the countryside was neglected, buttoward the end of the seventeenth century the Jesuits be-gan to map considerable areas of the provinces to whichthey were assigned.30 Many of these Jesuits came from thecentral European Habsburg possessions: Austria, Bavaria,Bohemia, Croatia, and so forth. They had generally fol-lowed the standard Jesuit curriculum, the ratio studiorum,which in its various versions stressed the natural sciences,particularly cosmography and cartography (fig. 41.5).Though orders such as the Benedictines and the Francis-cans became known for their work in history and music,respectively, the Jesuits were preeminently the orderknown for studies in the natural sciences. Consequently,when their central European fathers found themselves as-signed to remote missions—and sometimes, indeed, ex-cluded as non-Hispanics from metropolitan functions—they often put into practice their remarkable skills. It is noexaggeration to say that many areas of the Americas weremore closely mapped by the Jesuits than they would againbe until the late nineteenth century, the time of the nationalgovernments.
The Main Areas of Spanish Colonial Cartography
the caribbean and the gulf of mexico
The earliest example of Spanish terrestrial cartography inthe New World is surely the little sketch, now preservedin the Palacio de Liria in Madrid, on which ChristopherColumbus was once thought to have set out the north-west coast of the island of Hispaniola.31 This sketchcatches the main features of the coast accurately, as in factthe Spaniards caught the general outline of the CaribbeanSea, to judge from the Juan de la Cosa chart of 1500. Thestory about the Lucayan Indian who was able to showKing João II of Portugal the main outline of theCaribbean islands suggests that the Europeans had somehelp.32
When Peter Martyr (Pietro Martire d’Anghiera) cameto publish his Décadas at Seville in 1511, he was able touse a version of the Caribbean, probably drawn by Andrésde Morales, that had emerged from ten years of fairly in-tensive Spanish activity in that region (see fig. 30.8). Eightyears later, the outline of the Gulf of Mexico and the Yu-
1148 State Contexts of Renaissance Mapping
fig. 41.5. ANONYMOUS, ILLUSTRATION OF THE JESUITCURRICULUM FROM THE PROSPECTUS OF THE COL-LEGE OF CORDELLE (SPAIN, CA. 1750). Note that a quar-ter of the fields of study shown concern cartographic knowl-edge; “Geographia et Astronomia” and “Cosmographia” areplaced among the religion, political studies, heraldry, and soforth.Photograph courtesy of Special Collections, Loyola University,Chicago (378.46 A188).
30. For a general survey of this work, see David Buisseret, “Jesuit Car-tography in Central and South America,” in Jesuit Encounters in theNew World: Jesuit Chroniclers, Geographers, Educators and Mission-aries in the Americas, 1549–1767, ed. Joseph A. Gagliano andCharles E. Ronan (Rome: Institutum Historicum S. I., 1997), 113–62.
31. It is well reproduced in Duke of Alba, Mapas españoles, pl. I (fac-ing p. 9); there has been some controversy regarding its author.
32. Bartolomé de Las Casas, Historia de las Indias, 3 vols. (Holly-wood, Fla.: Ediciones del Continente, 1985), 1:324 –25.
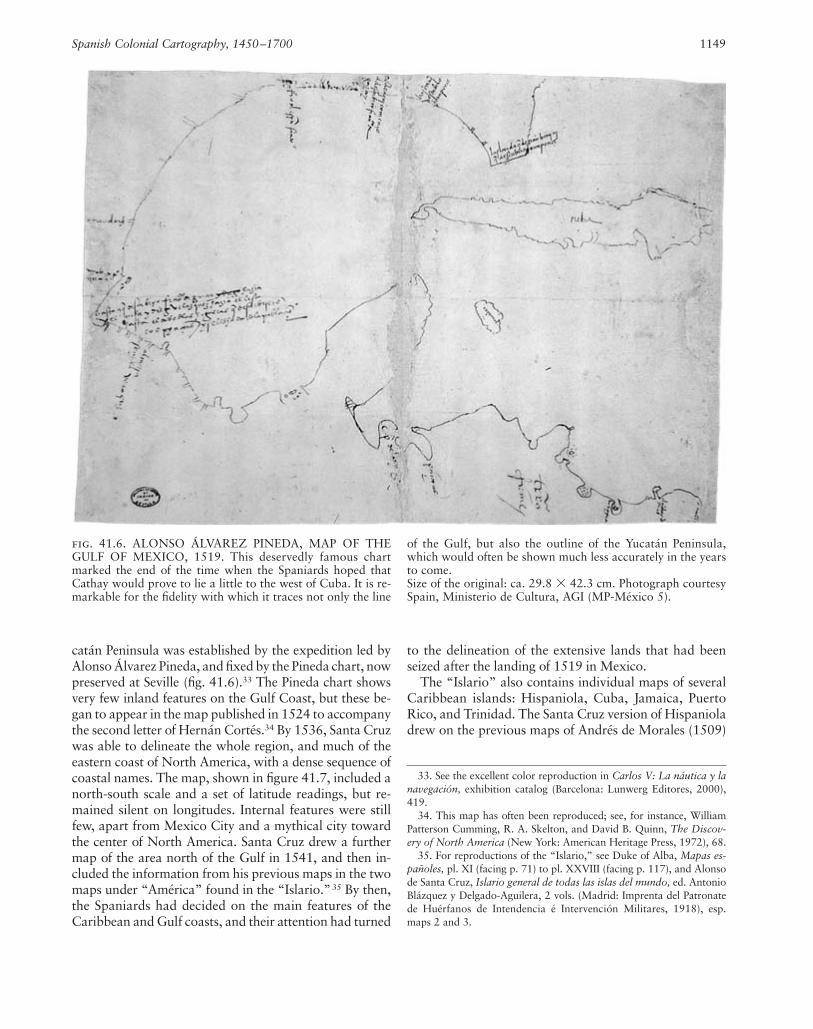
catán Peninsula was established by the expedition led byAlonso Álvarez Pineda, and fixed by the Pineda chart, nowpreserved at Seville (fig. 41.6).33 The Pineda chart showsvery few inland features on the Gulf Coast, but these be-gan to appear in the map published in 1524 to accompanythe second letter of Hernán Cortés.34 By 1536, Santa Cruzwas able to delineate the whole region, and much of theeastern coast of North America, with a dense sequence ofcoastal names. The map, shown in figure 41.7, included anorth-south scale and a set of latitude readings, but re-mained silent on longitudes. Internal features were stillfew, apart from Mexico City and a mythical city towardthe center of North America. Santa Cruz drew a furthermap of the area north of the Gulf in 1541, and then in-cluded the information from his previous maps in the twomaps under “América” found in the “Islario.”35 By then,the Spaniards had decided on the main features of theCaribbean and Gulf coasts, and their attention had turned
to the delineation of the extensive lands that had beenseized after the landing of 1519 in Mexico.
The “Islario” also contains individual maps of severalCaribbean islands: Hispaniola, Cuba, Jamaica, PuertoRico, and Trinidad. The Santa Cruz version of Hispanioladrew on the previous maps of Andrés de Morales (1509)
Spanish Colonial Cartography, 1450–1700 1149
fig. 41.6. ALONSO ÁLVAREZ PINEDA, MAP OF THEGULF OF MEXICO, 1519. This deservedly famous chartmarked the end of the time when the Spaniards hoped thatCathay would prove to lie a little to the west of Cuba. It is re-markable for the fidelity with which it traces not only the line
of the Gulf, but also the outline of the Yucatán Peninsula,which would often be shown much less accurately in the yearsto come.Size of the original: ca. 29.8 � 42.3 cm. Photograph courtesySpain, Ministerio de Cultura, AGI (MP-México 5).
33. See the excellent color reproduction in Carlos V: La náutica y lanavegación, exhibition catalog (Barcelona: Lunwerg Editores, 2000),419.
34. This map has often been reproduced; see, for instance, WilliamPatterson Cumming, R. A. Skelton, and David B. Quinn, The Discov-ery of North America (New York: American Heritage Press, 1972), 68.
35. For reproductions of the “Islario,” see Duke of Alba, Mapas es-pañoles, pl. XI (facing p. 71) to pl. XXVIII (facing p. 117), and Alonsode Santa Cruz, Islario general de todas las islas del mundo, ed. AntonioBlázquez y Delgado-Aguilera, 2 vols. (Madrid: Imprenta del Patronatede Huérfanos de Intendencia é Intervención Militares, 1918), esp.maps 2 and 3.

and an anonymous cartographer (1516).36 The Moralesmap was remarkably full for so early a date, including atleast a dozen cities, indicated with characteristic symbols,as well as offshore islands. The coast is shown without theembayments characteristic of the portolan chart style,and the sea is enlivened with what may be representationsof the ships of Columbus. A sort of latitude scale, begin-ning at zero degrees at the eastern end of the island, runsalong the bottom edge of the map. The anonymous mapof 1516 marks a regression in some ways, for its coastaldelineation is less accurate. But it does make some at-tempt to show the internal topography.
Although Santa Cruz used these two maps when he de-lineated the island, his coastline is characteristically shownwith deep embayments. He offered a greater wealth ofplace-names than his predecessors, but he was working
on this map at a time when Spanish interest had decid-edly shifted away from the Caribbean. This is shown veryplainly in the next map, by Montemayor de Cuenca in1658; the coastal outline is very approximate, and thenumber of place-names fewer than in the map by SantaCruz.37
The map by Morales shows the city of Santo Domingoon the southwestern coast; this considerable center (nowcapital of the Dominican Republic) was several timesmapped in the sixteenth century.38 After Drake’s raid, itwas carefully delineated by the engineer Bautista Antonelli(fig. 41.8). Antonelli showed the outlines of two possiblelines of walls and bastions, as well as the position of themain monuments within the walls. This plan also containsa bar scale and comments on the work to be undertaken;it is an excellent example of a plan designed to enable themembers of the Council of the Indies to come to a decisionabout future building. Santo Domingo continued to be ofimportance to the Spanish crown, and many more planswere made of it, but few matched the elegance of An-tonelli’s work.39
1150 State Contexts of Renaissance Mapping
fig. 41.7. ALONSO DE SANTA CRUZ, MAP OF CENTRALAMERICA AND THE CARIBBEAN SEA, CA. 1536. Thismap shows how the Spanish cosmographers were drawing to-gether information from a wide variety of sources to build upa list of the coastal toponyms in their newly acquired empire.Once this phase of investigation was over, succeeding cosmo-graphers would turn to delineating the individual provinces indetail.PhotographcourtesySpain,MinisteriodeCultura,ArchivoHis-tórico Nacional, Madrid (Diversos Colecciones, car. 1, u. 2).
fig. 41.8. BAUTISTA ANTONELLI, PLAN OF SANTODOMINGO, CA. 1592. The Antonellis were a family of Ital-ian engineers who were very active in the realms of both PhilipII and Philip III. They are good examples of the way in whichthe Spanish monarchs could call on a very wide range of tech-nocrats throughout their extensive European empire.Photograph courtesy of Biblioteca Nacional, Madrid(MN 235).
36. For reproductions of these maps, see Emilio Rodríguez Demorizi,comp., Mapas y planos de Santo Domingo (Santo Domingo: EditoraTaller, 1979), 5–9.
37. Vindel, Mapas de América en los libros españoles, 123–26.38. Reproduced in Rodríguez Demorizi, Mapas y planos de Santo
Domingo, pls. 8–11.39. See the plates in González, Planos de ciudades iberoamericanas y
filipinas, 1:310–14.
The second Caribbean island to receive separate treat-ment in the “Islario” of Santa Cruz was Cuba.40 The ear-liest charts (Juan de la Cosa’s chart of 1500 and the Can-tino map of 1502) show this island as having a curiousscorpion’s-tail curve to its west end. Santa Cruz correctedthese erroneous versions, giving a remarkably accurateoutline of the island (see fig. 41.1). He also showed eightor so towns, and his version was followed both by DiegoGutiérrez (1562) and by Juan López de Velasco (1575).They did not show any further internal detail, because af-ter 1519 Cuba had become a backwater in the Spanishempire. The land was relatively lacking in value, so thegreater estancias defined their territory in terms of a cer-tain radius from the main house; the resulting circles wereimpressed into some of the roads, and may still be de-tected today.
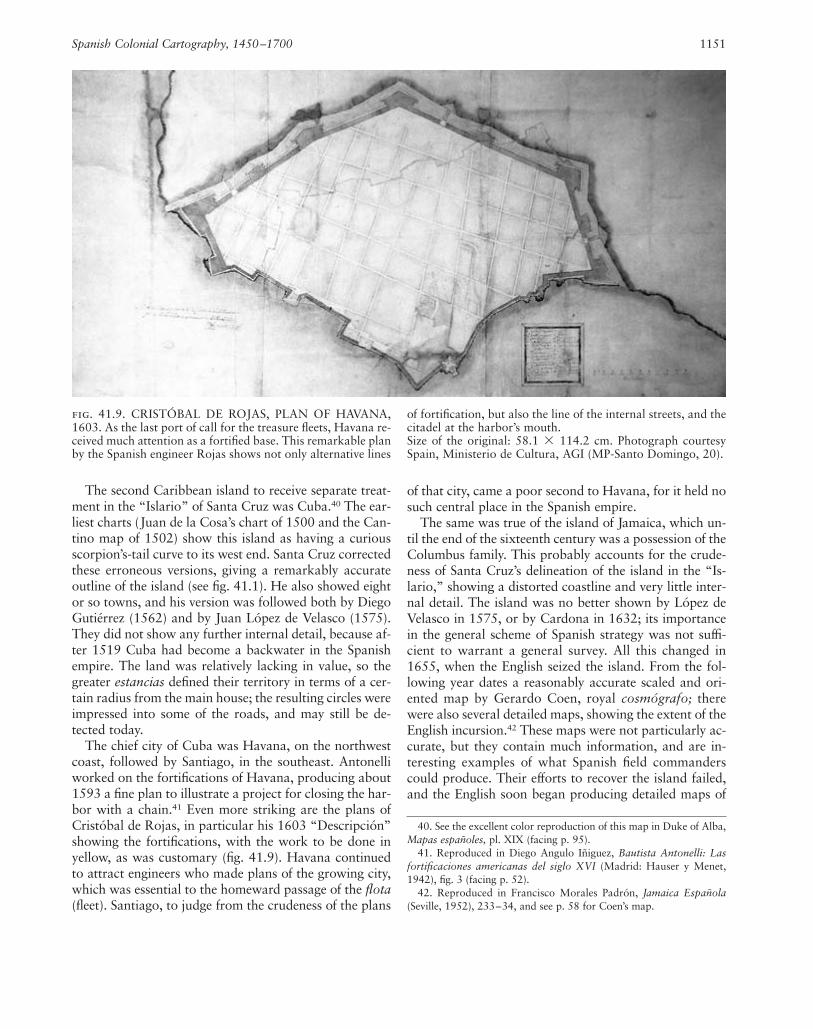
The chief city of Cuba was Havana, on the northwestcoast, followed by Santiago, in the southeast. Antonelliworked on the fortifications of Havana, producing about1593 a fine plan to illustrate a project for closing the har-bor with a chain.41 Even more striking are the plans ofCristóbal de Rojas, in particular his 1603 “Descripción”showing the fortifications, with the work to be done inyellow, as was customary (fig. 41.9). Havana continuedto attract engineers who made plans of the growing city,which was essential to the homeward passage of the flota(fleet). Santiago, to judge from the crudeness of the plans
of that city, came a poor second to Havana, for it held nosuch central place in the Spanish empire.
The same was true of the island of Jamaica, which un-til the end of the sixteenth century was a possession of theColumbus family. This probably accounts for the crude-ness of Santa Cruz’s delineation of the island in the “Is-lario,” showing a distorted coastline and very little inter-nal detail. The island was no better shown by López deVelasco in 1575, or by Cardona in 1632; its importancein the general scheme of Spanish strategy was not suffi-cient to warrant a general survey. All this changed in1655, when the English seized the island. From the fol-lowing year dates a reasonably accurate scaled and ori-ented map by Gerardo Coen, royal cosmógrafo; therewere also several detailed maps, showing the extent of theEnglish incursion.42 These maps were not particularly ac-curate, but they contain much information, and are in-teresting examples of what Spanish field commanderscould produce. Their efforts to recover the island failed,and the English soon began producing detailed maps of
Spanish Colonial Cartography, 1450–1700 1151
fig. 41.9. CRISTÓBAL DE ROJAS, PLAN OF HAVANA,1603. As the last port of call for the treasure fleets, Havana re-ceived much attention as a fortified base. This remarkable planby the Spanish engineer Rojas shows not only alternative lines
of fortification, but also the line of the internal streets, and thecitadel at the harbor’s mouth.Size of the original: 58.1 � 114.2 cm. Photograph courtesySpain, Ministerio de Cultura, AGI (MP-Santo Domingo, 20).
40. See the excellent color reproduction of this map in Duke of Alba,Mapas españoles, pl. XIX (facing p. 95).
41. Reproduced in Diego Angulo Iñiguez, Bautista Antonelli: Lasfortificaciones americanas del siglo XVI (Madrid: Hauser y Menet,1942), fig. 3 (facing p. 52).
42. Reproduced in Francisco Morales Padrón, Jamaica Española(Seville, 1952), 233–34, and see p. 58 for Coen’s map.
their new possession, which came to have great economicand strategic importance.43
Santa Cruz’s map of Puerto Rico (San Juan, as it wasthen called) was more accurate than his version of Ja-maica, but the island as a whole was very poorly served bySpanish cartographers up to 1700.44 Attention centered,in fact, on the city of San Juan, for which four sixteenth-century plans survive at the AGI. They are relatively crude,having presumably been drawn by local soldiers.45 Thelast island shown in some detail by Santa Cruz wasTrinidad. Its general outline was relatively accurate, in-deed, better then it would be on the López de Velasco mapof 1575. Trinidad never enjoyed the prominence in theSpanish empire attained by Puerto Rico, and had no cityto compare with San Juan, so its cartography was ne-glected right up until the eighteenth century.
Considering the history of Spanish mapping of His-paniola, Cuba, Jamaica, Puerto Rico, and Trinidad (theGreater Antilles), we might well be tempted to concludethat it was characterized by neglect. This is understand-able, because after a lively start, particularly in SantoDomingo, the islands failed to live up to the Spaniards’expectations and were consequently almost disregarded,apart from the great ports, while great effort went into theconquest and delineation of the mainland.
florida and louisiana (north america)
The seas to the west of the Caribbean islands were pro-gressively investigated between 1508 and 1519, the datewhen Alonso Álvarez Pineda drew his map. With the lineof the Gulf of Mexico fixed, various expeditions were sentto the north of it, in the hope that civilizations as rich asthat of Mexico might be discovered. All these expeditionsfailed to find easy wealth, so for many years the perma-nent Spanish presence north of the Gulf was confined tothe fortress at Saint Augustine, with a few neighboringmissions, and eventually to settlements on the upperreaches of the Rio Grande. Maps were made of these ar-eas, and some survived from the various expeditions. Thecartography of the area at the mouth of the MississippiRiver began to emerge once the Spaniards had beenalerted to French ambitions in that region by the voyageof Robert Cavelier de La Salle in 1682.46
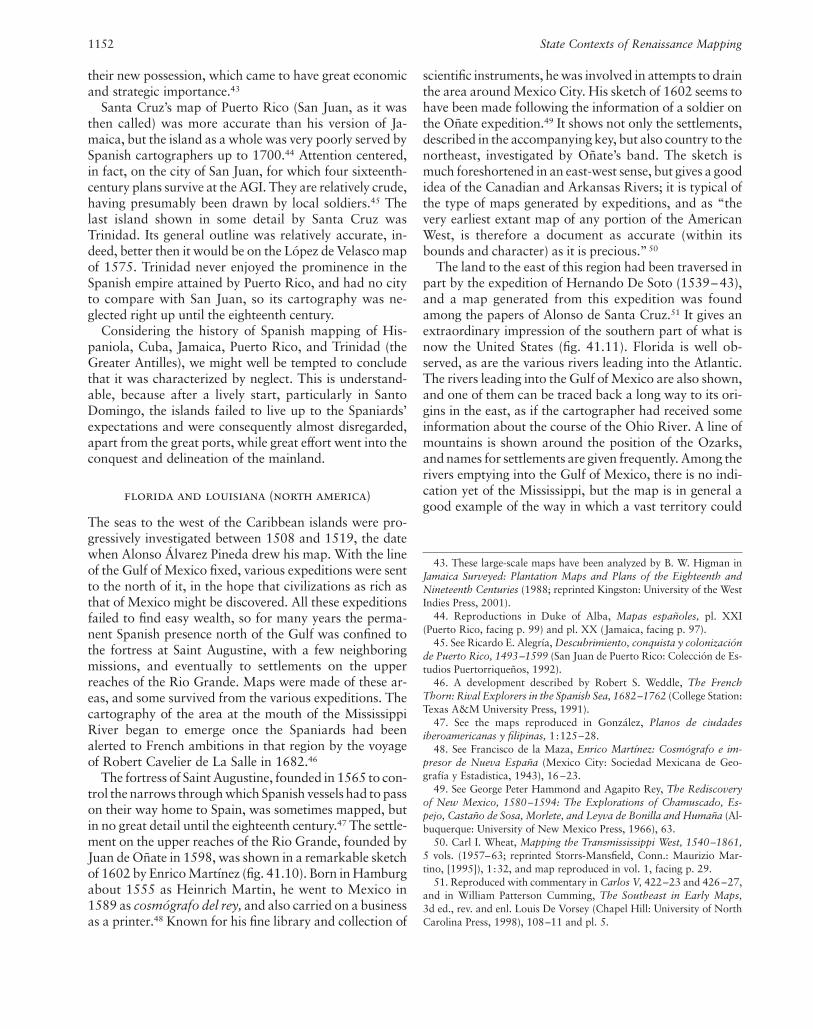
The fortress of Saint Augustine, founded in 1565 to con-trol the narrows through which Spanish vessels had to passon their way home to Spain, was sometimes mapped, butin no great detail until the eighteenth century.47 The settle-ment on the upper reaches of the Rio Grande, founded byJuan de Oñate in 1598, was shown in a remarkable sketchof 1602 by Enrico Martínez (fig. 41.10). Born in Hamburgabout 1555 as Heinrich Martin, he went to Mexico in1589 as cosmógrafo del rey, and also carried on a businessas a printer.48 Known for his fine library and collection of
scientific instruments, he was involved in attempts to drainthe area around Mexico City. His sketch of 1602 seems tohave been made following the information of a soldier onthe Oñate expedition.49 It shows not only the settlements,described in the accompanying key, but also country to thenortheast, investigated by Oñate’s band. The sketch ismuch foreshortened in an east-west sense, but gives a goodidea of the Canadian and Arkansas Rivers; it is typical ofthe type of maps generated by expeditions, and as “thevery earliest extant map of any portion of the AmericanWest, is therefore a document as accurate (within itsbounds and character) as it is precious.”50
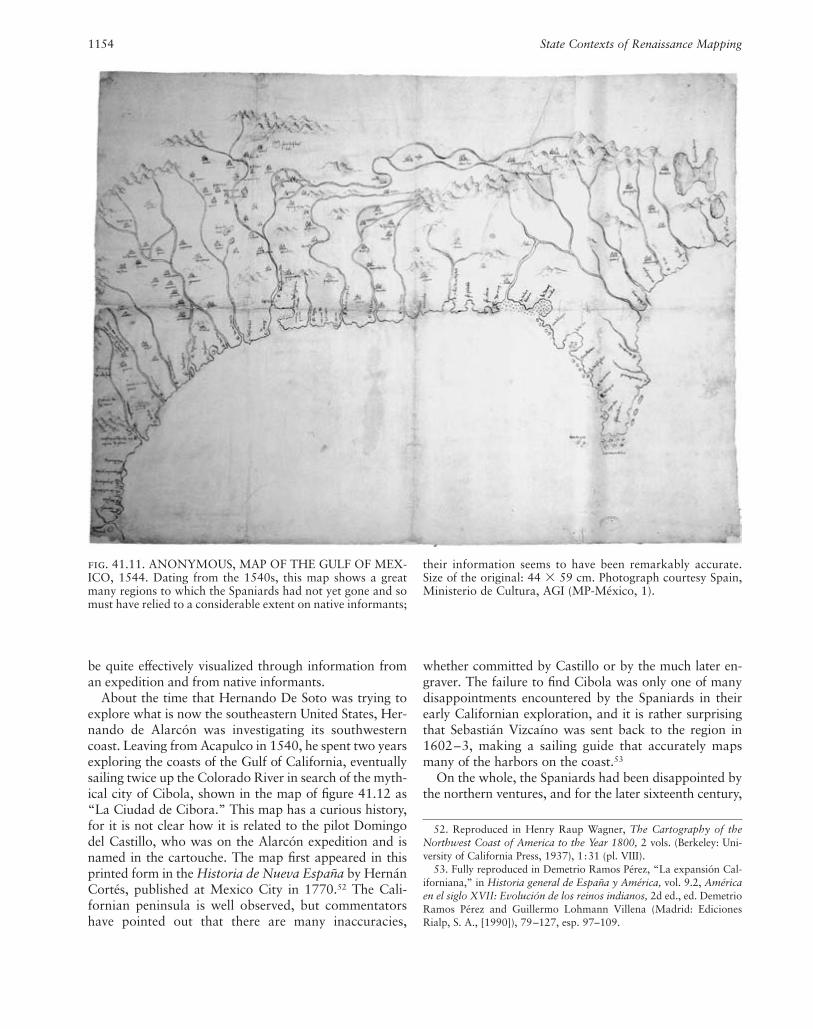
The land to the east of this region had been traversed inpart by the expedition of Hernando De Soto (1539– 43),and a map generated from this expedition was foundamong the papers of Alonso de Santa Cruz.51 It gives anextraordinary impression of the southern part of what isnow the United States (fig. 41.11). Florida is well ob-served, as are the various rivers leading into the Atlantic.The rivers leading into the Gulf of Mexico are also shown,and one of them can be traced back a long way to its ori-gins in the east, as if the cartographer had received someinformation about the course of the Ohio River. A line ofmountains is shown around the position of the Ozarks,and names for settlements are given frequently. Among therivers emptying into the Gulf of Mexico, there is no indi-cation yet of the Mississippi, but the map is in general agood example of the way in which a vast territory could
1152 State Contexts of Renaissance Mapping
43. These large-scale maps have been analyzed by B. W. Higman inJamaica Surveyed: Plantation Maps and Plans of the Eighteenth andNineteenth Centuries (1988; reprinted Kingston: University of the WestIndies Press, 2001).
44. Reproductions in Duke of Alba, Mapas españoles, pl. XXI(Puerto Rico, facing p. 99) and pl. XX (Jamaica, facing p. 97).
45. See Ricardo E. Alegría, Descubrimiento, conquista y colonizaciónde Puerto Rico, 1493–1599 (San Juan de Puerto Rico: Colección de Es-tudios Puertorriqueños, 1992).
46. A development described by Robert S. Weddle, The FrenchThorn: Rival Explorers in the Spanish Sea, 1682–1762 (College Station:Texas A&M University Press, 1991).
47. See the maps reproduced in González, Planos de ciudadesiberoamericanas y filipinas, 1:125–28.
48. See Francisco de la Maza, Enrico Martínez: Cosmógrafo e im-presor de Nueva España (Mexico City: Sociedad Mexicana de Geo-grafía y Estadistica, 1943), 16 –23.
49. See George Peter Hammond and Agapito Rey, The Rediscoveryof New Mexico, 1580–1594: The Explorations of Chamuscado, Es-pejo, Castaño de Sosa, Morlete, and Leyva de Bonilla and Humaña (Al-buquerque: University of New Mexico Press, 1966), 63.
50. Carl I. Wheat, Mapping the Transmississippi West, 1540–1861,5 vols. (1957–63; reprinted Storrs-Mansfield, Conn.: Maurizio Mar-tino, [1995]), 1:32, and map reproduced in vol. 1, facing p. 29.
51. Reproduced with commentary in Carlos V, 422–23 and 426 –27,and in William Patterson Cumming, The Southeast in Early Maps,3d ed., rev. and enl. Louis De Vorsey (Chapel Hill: University of NorthCarolina Press, 1998), 108–11 and pl. 5.
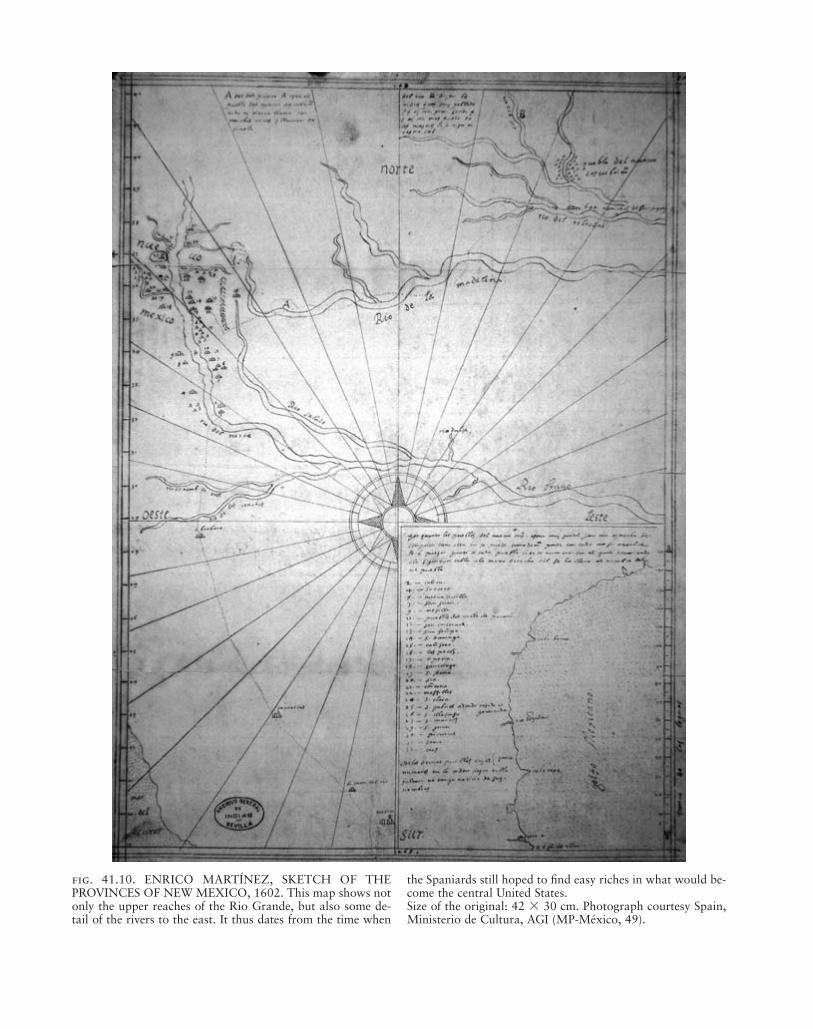
fig. 41.10. ENRICO MARTÍNEZ, SKETCH OF THEPROVINCES OF NEW MEXICO, 1602. This map shows notonly the upper reaches of the Rio Grande, but also some de-tail of the rivers to the east. It thus dates from the time when
the Spaniards still hoped to find easy riches in what would be-come the central United States.Size of the original: 42 � 30 cm. Photograph courtesy Spain,Ministerio de Cultura, AGI (MP-México, 49).
be quite effectively visualized through information froman expedition and from native informants.
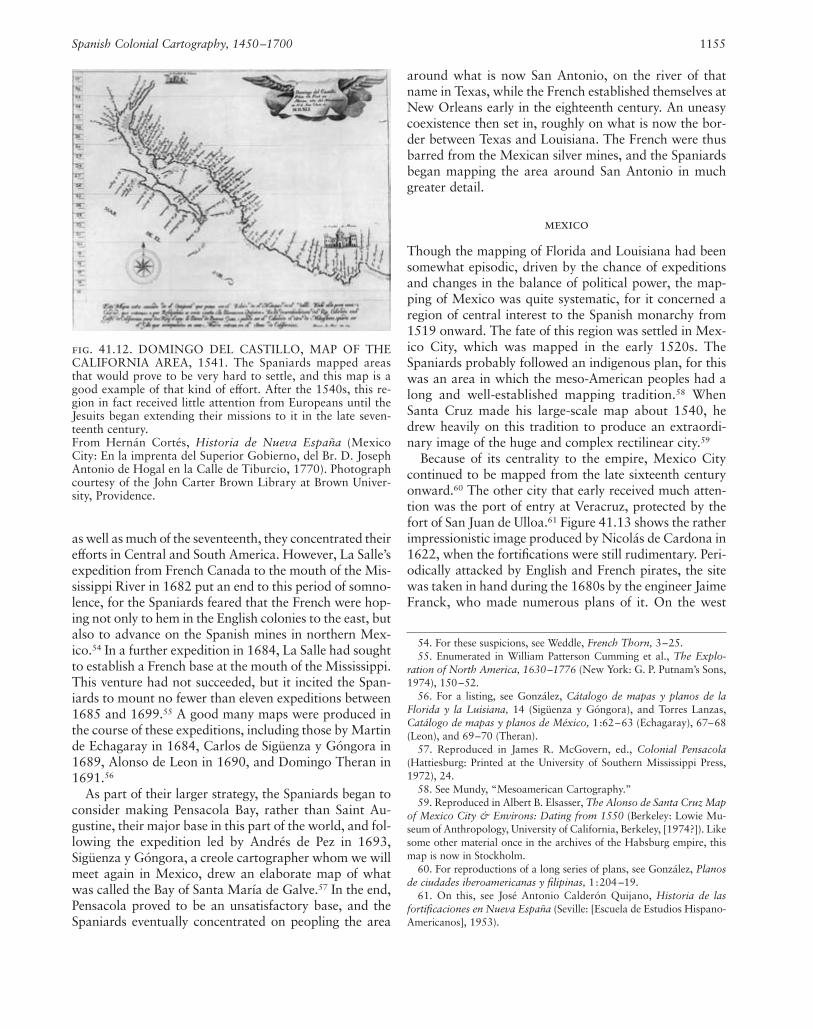
About the time that Hernando De Soto was trying toexplore what is now the southeastern United States, Her-nando de Alarcón was investigating its southwesterncoast. Leaving from Acapulco in 1540, he spent two yearsexploring the coasts of the Gulf of California, eventuallysailing twice up the Colorado River in search of the myth-ical city of Cibola, shown in the map of figure 41.12 as“La Ciudad de Cibora.” This map has a curious history,for it is not clear how it is related to the pilot Domingodel Castillo, who was on the Alarcón expedition and isnamed in the cartouche. The map first appeared in thisprinted form in the Historia de Nueva España by HernánCortés, published at Mexico City in 1770.52 The Cali-fornian peninsula is well observed, but commentatorshave pointed out that there are many inaccuracies,
whether committed by Castillo or by the much later en-graver. The failure to find Cibola was only one of manydisappointments encountered by the Spaniards in theirearly Californian exploration, and it is rather surprisingthat Sebastián Vizcaíno was sent back to the region in1602–3, making a sailing guide that accurately mapsmany of the harbors on the coast.53
On the whole, the Spaniards had been disappointed bythe northern ventures, and for the later sixteenth century,
1154 State Contexts of Renaissance Mapping
fig. 41.11. ANONYMOUS, MAP OF THE GULF OF MEX-ICO, 1544. Dating from the 1540s, this map shows a greatmany regions to which the Spaniards had not yet gone and somust have relied to a considerable extent on native informants;
their information seems to have been remarkably accurate.Size of the original: 44 � 59 cm. Photograph courtesy Spain,Ministerio de Cultura, AGI (MP-México, 1).
52. Reproduced in Henry Raup Wagner, The Cartography of theNorthwest Coast of America to the Year 1800, 2 vols. (Berkeley: Uni-versity of California Press, 1937), 1:31 (pl. VIII).
53. Fully reproduced in Demetrio Ramos Pérez, “La expansión Cal-iforniana,” in Historia general de España y América, vol. 9.2, Américaen el siglo XVII: Evolución de los reinos indianos, 2d ed., ed. DemetrioRamos Pérez and Guillermo Lohmann Villena (Madrid: Ediciones Rialp, S. A., [1990]), 79–127, esp. 97–109.
as well as much of the seventeenth, they concentrated theirefforts in Central and South America. However, La Salle’sexpedition from French Canada to the mouth of the Mis-sissippi River in 1682 put an end to this period of somno-lence, for the Spaniards feared that the French were hop-ing not only to hem in the English colonies to the east, butalso to advance on the Spanish mines in northern Mex-ico.54 In a further expedition in 1684, La Salle had soughtto establish a French base at the mouth of the Mississippi.This venture had not succeeded, but it incited the Span-iards to mount no fewer than eleven expeditions between1685 and 1699.55 A good many maps were produced inthe course of these expeditions, including those by Martinde Echagaray in 1684, Carlos de Sigüenza y Góngora in1689, Alonso de Leon in 1690, and Domingo Theran in1691.56
As part of their larger strategy, the Spaniards began toconsider making Pensacola Bay, rather than Saint Au-gustine, their major base in this part of the world, and fol-lowing the expedition led by Andrés de Pez in 1693,Sigüenza y Góngora, a creole cartographer whom we willmeet again in Mexico, drew an elaborate map of whatwas called the Bay of Santa María de Galve.57 In the end,Pensacola proved to be an unsatisfactory base, and theSpaniards eventually concentrated on peopling the area
around what is now San Antonio, on the river of thatname in Texas, while the French established themselves atNew Orleans early in the eighteenth century. An uneasycoexistence then set in, roughly on what is now the bor-der between Texas and Louisiana. The French were thusbarred from the Mexican silver mines, and the Spaniardsbegan mapping the area around San Antonio in muchgreater detail.
mexico
Though the mapping of Florida and Louisiana had beensomewhat episodic, driven by the chance of expeditionsand changes in the balance of political power, the map-ping of Mexico was quite systematic, for it concerned aregion of central interest to the Spanish monarchy from1519 onward. The fate of this region was settled in Mex-ico City, which was mapped in the early 1520s. TheSpaniards probably followed an indigenous plan, for thiswas an area in which the meso-American peoples had along and well-established mapping tradition.58 WhenSanta Cruz made his large-scale map about 1540, hedrew heavily on this tradition to produce an extraordi-nary image of the huge and complex rectilinear city.59
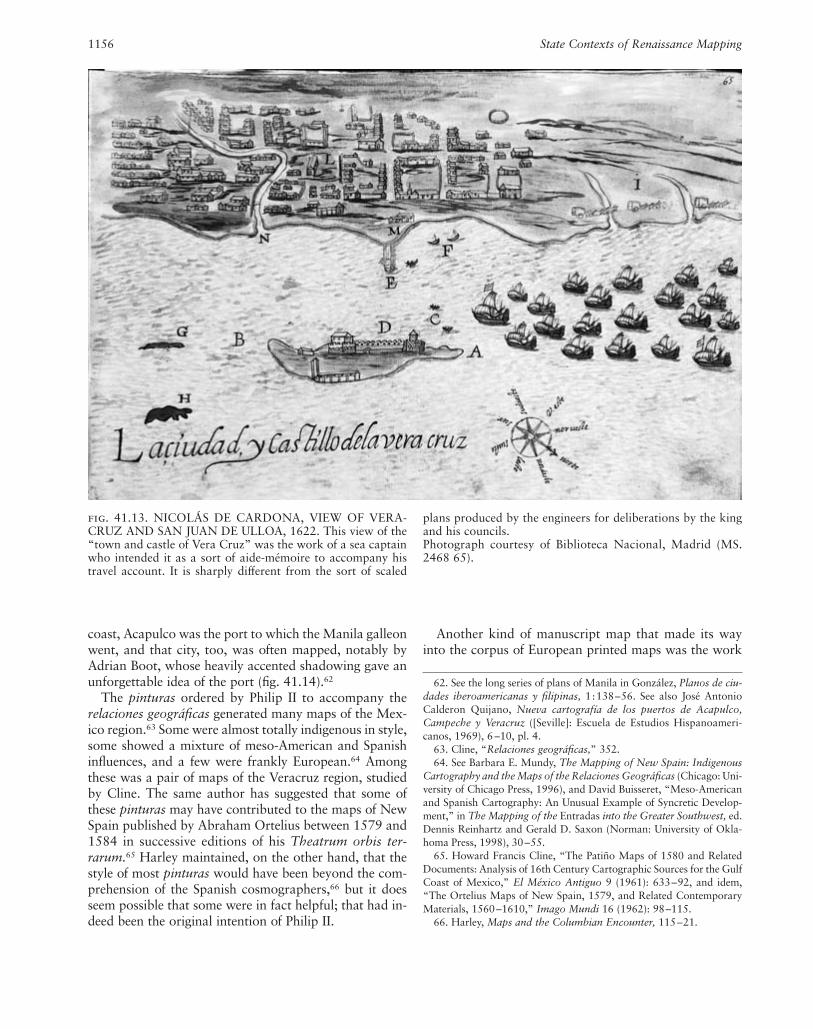
Because of its centrality to the empire, Mexico Citycontinued to be mapped from the late sixteenth centuryonward.60 The other city that early received much atten-tion was the port of entry at Veracruz, protected by thefort of San Juan de Ulloa.61 Figure 41.13 shows the ratherimpressionistic image produced by Nicolás de Cardona in1622, when the fortifications were still rudimentary. Peri-odically attacked by English and French pirates, the sitewas taken in hand during the 1680s by the engineer JaimeFranck, who made numerous plans of it. On the west
Spanish Colonial Cartography, 1450–1700 1155
fig. 41.12. DOMINGO DEL CASTILLO, MAP OF THECALIFORNIA AREA, 1541. The Spaniards mapped areasthat would prove to be very hard to settle, and this map is agood example of that kind of effort. After the 1540s, this re-gion in fact received little attention from Europeans until theJesuits began extending their missions to it in the late seven-teenth century.From Hernán Cortés, Historia de Nueva España (MexicoCity: En la imprenta del Superior Gobierno, del Br. D. JosephAntonio de Hogal en la Calle de Tiburcio, 1770). Photographcourtesy of the John Carter Brown Library at Brown Univer-sity, Providence.
54. For these suspicions, see Weddle, French Thorn, 3–25.55. Enumerated in William Patterson Cumming et al., The Explo-
ration of North America, 1630–1776 (New York: G. P. Putnam’s Sons,1974), 150–52.
56. For a listing, see González, Cátalogo de mapas y planos de laFlorida y la Luisiana, 14 (Sigüenza y Góngora), and Torres Lanzas,Catálogo de mapas y planos de México, 1:62–63 (Echagaray), 67–68(Leon), and 69–70 (Theran).
57. Reproduced in James R. McGovern, ed., Colonial Pensacola(Hattiesburg: Printed at the University of Southern Mississippi Press,1972), 24.
58. See Mundy, “Mesoamerican Cartography.”59. Reproduced in Albert B. Elsasser, The Alonso de Santa Cruz Map
of Mexico City & Environs: Dating from 1550 (Berkeley: Lowie Mu-seum of Anthropology, University of California, Berkeley, [1974?]). Likesome other material once in the archives of the Habsburg empire, thismap is now in Stockholm.
60. For reproductions of a long series of plans, see González, Planosde ciudades iberoamericanas y filipinas, 1:204 –19.
61. On this, see José Antonio Calderón Quijano, Historia de lasfortificaciones en Nueva España (Seville: [Escuela de Estudios Hispano-Americanos], 1953).
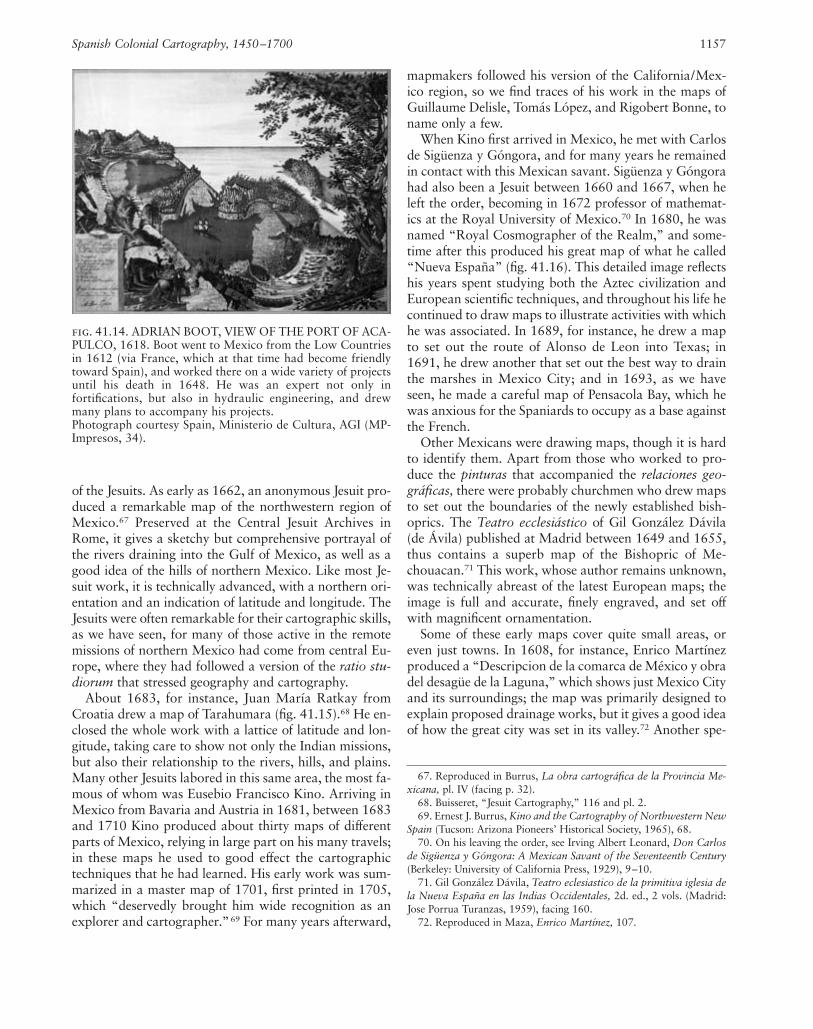
coast, Acapulco was the port to which the Manila galleonwent, and that city, too, was often mapped, notably byAdrian Boot, whose heavily accented shadowing gave anunforgettable idea of the port (fig. 41.14).62
The pinturas ordered by Philip II to accompany therelaciones geográficas generated many maps of the Mex-ico region.63 Some were almost totally indigenous in style,some showed a mixture of meso-American and Spanishinfluences, and a few were frankly European.64 Amongthese was a pair of maps of the Veracruz region, studiedby Cline. The same author has suggested that some ofthese pinturas may have contributed to the maps of NewSpain published by Abraham Ortelius between 1579 and1584 in successive editions of his Theatrum orbis ter-rarum.65 Harley maintained, on the other hand, that thestyle of most pinturas would have been beyond the com-prehension of the Spanish cosmographers,66 but it doesseem possible that some were in fact helpful; that had in-deed been the original intention of Philip II.
Another kind of manuscript map that made its wayinto the corpus of European printed maps was the work
1156 State Contexts of Renaissance Mapping
fig. 41.13. NICOLÁS DE CARDONA, VIEW OF VERA-CRUZ AND SAN JUAN DE ULLOA, 1622. This view of the“town and castle of Vera Cruz” was the work of a sea captainwho intended it as a sort of aide-mémoire to accompany histravel account. It is sharply different from the sort of scaled
plans produced by the engineers for deliberations by the kingand his councils.Photograph courtesy of Biblioteca Nacional, Madrid (MS.2468 65).
62. See the long series of plans of Manila in González, Planos de ciu-dades iberoamericanas y filipinas, 1:138–56. See also José AntonioCalderon Quijano, Nueva cartografía de los puertos de Acapulco,Campeche y Veracruz ([Seville]: Escuela de Estudios Hispanoameri-canos, 1969), 6 –10, pl. 4.
63. Cline, “Relaciones geográficas,” 352.64. See Barbara E. Mundy, The Mapping of New Spain: Indigenous
Cartography and the Maps of the Relaciones Geográficas (Chicago: Uni-versity of Chicago Press, 1996), and David Buisseret, “Meso-Americanand Spanish Cartography: An Unusual Example of Syncretic Develop-ment,” in The Mapping of the Entradas into the Greater Southwest, ed.Dennis Reinhartz and Gerald D. Saxon (Norman: University of Okla-homa Press, 1998), 30–55.
65. Howard Francis Cline, “The Patiño Maps of 1580 and RelatedDocuments: Analysis of 16th Century Cartographic Sources for the GulfCoast of Mexico,” El México Antiguo 9 (1961): 633–92, and idem,“The Ortelius Maps of New Spain, 1579, and Related ContemporaryMaterials, 1560–1610,” Imago Mundi 16 (1962): 98–115.
66. Harley, Maps and the Columbian Encounter, 115–21.
of the Jesuits. As early as 1662, an anonymous Jesuit pro-duced a remarkable map of the northwestern region ofMexico.67 Preserved at the Central Jesuit Archives inRome, it gives a sketchy but comprehensive portrayal ofthe rivers draining into the Gulf of Mexico, as well as agood idea of the hills of northern Mexico. Like most Je-suit work, it is technically advanced, with a northern ori-entation and an indication of latitude and longitude. TheJesuits were often remarkable for their cartographic skills,as we have seen, for many of those active in the remotemissions of northern Mexico had come from central Eu-rope, where they had followed a version of the ratio stu-diorum that stressed geography and cartography.
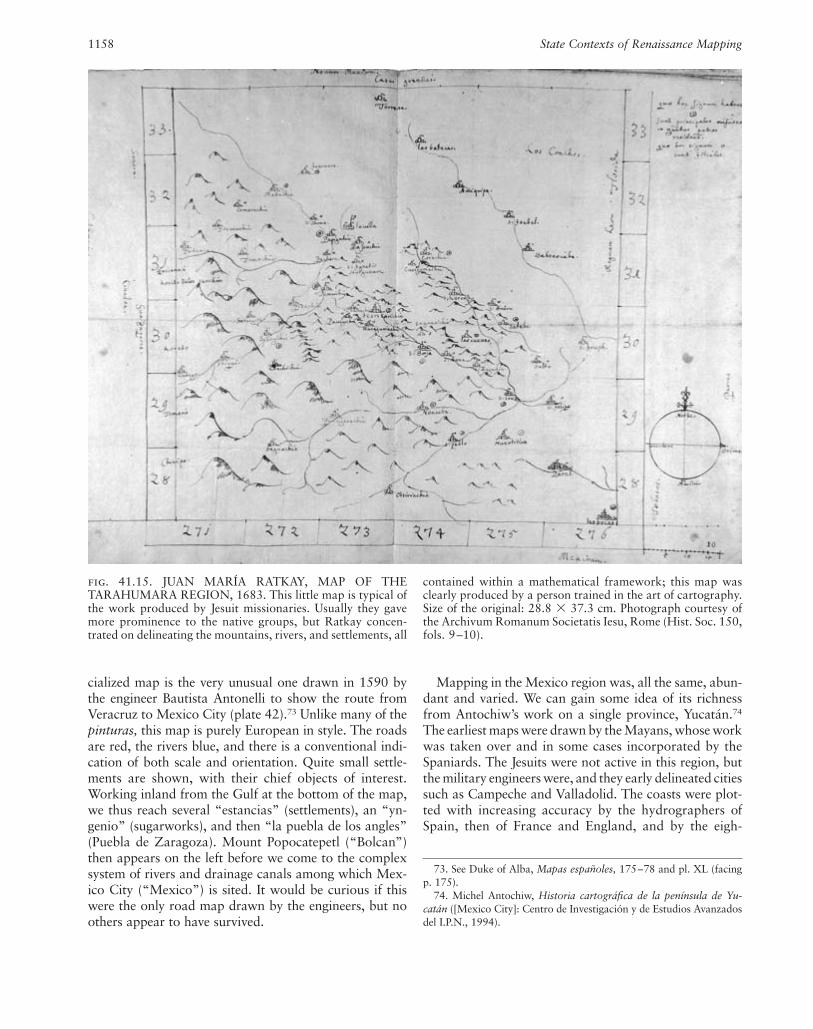
About 1683, for instance, Juan María Ratkay fromCroatia drew a map of Tarahumara (fig. 41.15).68 He en-closed the whole work with a lattice of latitude and lon-gitude, taking care to show not only the Indian missions,but also their relationship to the rivers, hills, and plains.Many other Jesuits labored in this same area, the most fa-mous of whom was Eusebio Francisco Kino. Arriving inMexico from Bavaria and Austria in 1681, between 1683and 1710 Kino produced about thirty maps of differentparts of Mexico, relying in large part on his many travels;in these maps he used to good effect the cartographictechniques that he had learned. His early work was sum-marized in a master map of 1701, first printed in 1705,which “deservedly brought him wide recognition as anexplorer and cartographer.”69 For many years afterward,
mapmakers followed his version of the California/Mex-ico region, so we find traces of his work in the maps ofGuillaume Delisle, Tomás López, and Rigobert Bonne, toname only a few.
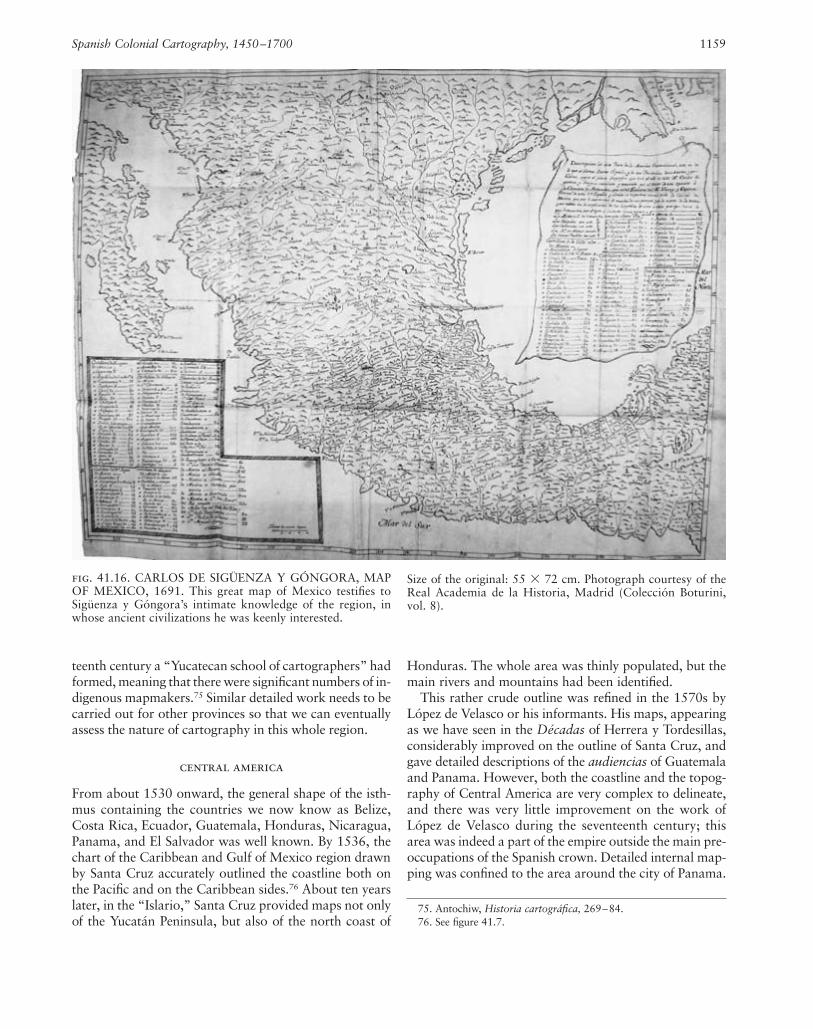
When Kino first arrived in Mexico, he met with Carlosde Sigüenza y Góngora, and for many years he remainedin contact with this Mexican savant. Sigüenza y Góngorahad also been a Jesuit between 1660 and 1667, when heleft the order, becoming in 1672 professor of mathemat-ics at the Royal University of Mexico.70 In 1680, he wasnamed “Royal Cosmographer of the Realm,” and some-time after this produced his great map of what he called“Nueva España” (fig. 41.16). This detailed image reflectshis years spent studying both the Aztec civilization andEuropean scientific techniques, and throughout his life hecontinued to draw maps to illustrate activities with whichhe was associated. In 1689, for instance, he drew a mapto set out the route of Alonso de Leon into Texas; in1691, he drew another that set out the best way to drainthe marshes in Mexico City; and in 1693, as we haveseen, he made a careful map of Pensacola Bay, which hewas anxious for the Spaniards to occupy as a base againstthe French.
Other Mexicans were drawing maps, though it is hardto identify them. Apart from those who worked to pro-duce the pinturas that accompanied the relaciones geo-gráficas, there were probably churchmen who drew mapsto set out the boundaries of the newly established bish-oprics. The Teatro ecclesiástico of Gil González Dávila(de Ávila) published at Madrid between 1649 and 1655,thus contains a superb map of the Bishopric of Me-chouacan.71 This work, whose author remains unknown,was technically abreast of the latest European maps; theimage is full and accurate, finely engraved, and set offwith magnificent ornamentation.
Some of these early maps cover quite small areas, oreven just towns. In 1608, for instance, Enrico Martínezproduced a “Descripcion de la comarca de México y obradel desagüe de la Laguna,” which shows just Mexico Cityand its surroundings; the map was primarily designed toexplain proposed drainage works, but it gives a good ideaof how the great city was set in its valley.72 Another spe-
Spanish Colonial Cartography, 1450–1700 1157
fig. 41.14. ADRIAN BOOT, VIEW OF THE PORT OF ACA-PULCO, 1618. Boot went to Mexico from the Low Countriesin 1612 (via France, which at that time had become friendlytoward Spain), and worked there on a wide variety of projectsuntil his death in 1648. He was an expert not only infortifications, but also in hydraulic engineering, and drewmany plans to accompany his projects.Photograph courtesy Spain, Ministerio de Cultura, AGI (MP-Impresos, 34).
67. Reproduced in Burrus, La obra cartográfica de la Provincia Me-xicana, pl. IV (facing p. 32).
68. Buisseret, “Jesuit Cartography,” 116 and pl. 2.69. Ernest J. Burrus, Kino and the Cartography of Northwestern New
Spain (Tucson: Arizona Pioneers’ Historical Society, 1965), 68.70. On his leaving the order, see Irving Albert Leonard, Don Carlos
de Sigüenza y Góngora: A Mexican Savant of the Seventeenth Century(Berkeley: University of California Press, 1929), 9–10.
71. Gil González Dávila, Teatro eclesiastico de la primitiva iglesia dela Nueva España en las Indias Occidentales, 2d. ed., 2 vols. (Madrid:Jose Porrua Turanzas, 1959), facing 160.
72. Reproduced in Maza, Enrico Martínez, 107.
cialized map is the very unusual one drawn in 1590 bythe engineer Bautista Antonelli to show the route fromVeracruz to Mexico City (plate 42).73 Unlike many of thepinturas, this map is purely European in style. The roadsare red, the rivers blue, and there is a conventional indi-cation of both scale and orientation. Quite small settle-ments are shown, with their chief objects of interest.Working inland from the Gulf at the bottom of the map,we thus reach several “estancias” (settlements), an “yn-genio” (sugarworks), and then “la puebla de los angles”(Puebla de Zaragoza). Mount Popocatepetl (“Bolcan”)then appears on the left before we come to the complexsystem of rivers and drainage canals among which Mex-ico City (“Mexico”) is sited. It would be curious if thiswere the only road map drawn by the engineers, but noothers appear to have survived.
Mapping in the Mexico region was, all the same, abun-dant and varied. We can gain some idea of its richnessfrom Antochiw’s work on a single province, Yucatán.74
The earliest maps were drawn by the Mayans, whose workwas taken over and in some cases incorporated by theSpaniards. The Jesuits were not active in this region, butthe military engineers were, and they early delineated citiessuch as Campeche and Valladolid. The coasts were plot-ted with increasing accuracy by the hydrographers ofSpain, then of France and England, and by the eigh-
1158 State Contexts of Renaissance Mapping
fig. 41.15. JUAN MARÍA RATKAY, MAP OF THETARAHUMARA REGION, 1683. This little map is typical ofthe work produced by Jesuit missionaries. Usually they gavemore prominence to the native groups, but Ratkay concen-trated on delineating the mountains, rivers, and settlements, all
contained within a mathematical framework; this map wasclearly produced by a person trained in the art of cartography.Size of the original: 28.8 � 37.3 cm. Photograph courtesy ofthe Archivum Romanum Societatis Iesu, Rome (Hist. Soc. 150,fols. 9–10).
73. See Duke of Alba, Mapas españoles, 175–78 and pl. XL (facingp. 175).
74. Michel Antochiw, Historia cartográfica de la península de Yu-catán ([Mexico City]: Centro de Investigación y de Estudios Avanzadosdel I.P.N., 1994).
teenth century a “Yucatecan school of cartographers” hadformed, meaning that there were significant numbers of in-digenous mapmakers.75 Similar detailed work needs to becarried out for other provinces so that we can eventuallyassess the nature of cartography in this whole region.
central america
From about 1530 onward, the general shape of the isth-mus containing the countries we now know as Belize,Costa Rica, Ecuador, Guatemala, Honduras, Nicaragua,Panama, and El Salvador was well known. By 1536, thechart of the Caribbean and Gulf of Mexico region drawnby Santa Cruz accurately outlined the coastline both onthe Pacific and on the Caribbean sides.76 About ten yearslater, in the “Islario,” Santa Cruz provided maps not onlyof the Yucatán Peninsula, but also of the north coast of
Honduras. The whole area was thinly populated, but themain rivers and mountains had been identified.
This rather crude outline was refined in the 1570s byLópez de Velasco or his informants. His maps, appearingas we have seen in the Décadas of Herrera y Tordesillas,considerably improved on the outline of Santa Cruz, andgave detailed descriptions of the audiencias of Guatemalaand Panama. However, both the coastline and the topog-raphy of Central America are very complex to delineate,and there was very little improvement on the work ofLópez de Velasco during the seventeenth century; thisarea was indeed a part of the empire outside the main pre-occupations of the Spanish crown. Detailed internal map-ping was confined to the area around the city of Panama.
Spanish Colonial Cartography, 1450–1700 1159
fig. 41.16. CARLOS DE SIGÜENZA Y GÓNGORA, MAPOF MEXICO, 1691. This great map of Mexico testifies toSigüenza y Góngora’s intimate knowledge of the region, inwhose ancient civilizations he was keenly interested.
Size of the original: 55 � 72 cm. Photograph courtesy of theReal Academia de la Historia, Madrid (Colección Boturini,vol. 8).
75. Antochiw, Historia cartográfica, 269–84.76. See figure 41.7.
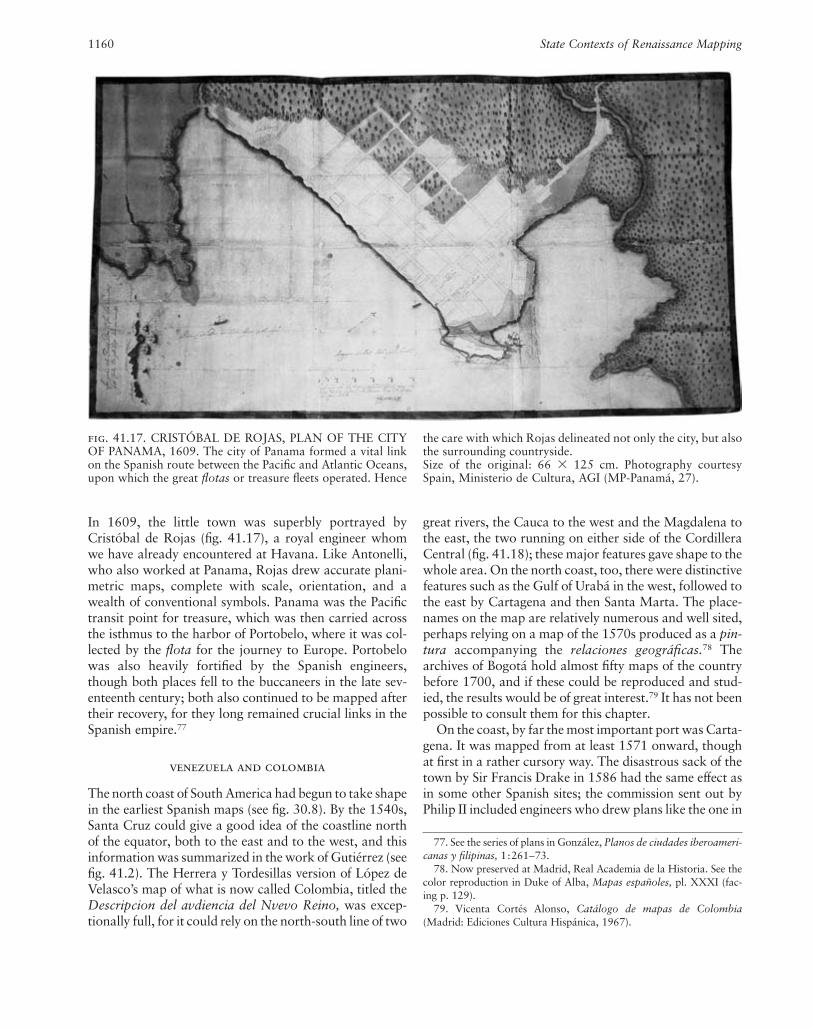
In 1609, the little town was superbly portrayed byCristóbal de Rojas (fig. 41.17), a royal engineer whom we have already encountered at Havana. Like Antonelli,who also worked at Panama, Rojas drew accurate plani-metric maps, complete with scale, orientation, and awealth of conventional symbols. Panama was the Pacifictransit point for treasure, which was then carried acrossthe isthmus to the harbor of Portobelo, where it was col-lected by the flota for the journey to Europe. Portobelowas also heavily fortified by the Spanish engineers,though both places fell to the buccaneers in the late sev-enteenth century; both also continued to be mapped aftertheir recovery, for they long remained crucial links in theSpanish empire.77
venezuela and colombia
The north coast of South America had begun to take shapein the earliest Spanish maps (see fig. 30.8). By the 1540s,Santa Cruz could give a good idea of the coastline northof the equator, both to the east and to the west, and thisinformation was summarized in the work of Gutiérrez (seefig. 41.2). The Herrera y Tordesillas version of López deVelasco’s map of what is now called Colombia, titled theDescripcion del avdiencia del Nvevo Reino, was excep-tionally full, for it could rely on the north-south line of two
great rivers, the Cauca to the west and the Magdalena tothe east, the two running on either side of the CordilleraCentral (fig. 41.18); these major features gave shape to thewhole area. On the north coast, too, there were distinctivefeatures such as the Gulf of Urabá in the west, followed tothe east by Cartagena and then Santa Marta. The place-names on the map are relatively numerous and well sited,perhaps relying on a map of the 1570s produced as a pin-tura accompanying the relaciones geográficas.78 Thearchives of Bogotá hold almost fifty maps of the countrybefore 1700, and if these could be reproduced and stud-ied, the results would be of great interest.79 It has not beenpossible to consult them for this chapter.
On the coast, by far the most important port was Carta-gena. It was mapped from at least 1571 onward, thoughat first in a rather cursory way. The disastrous sack of thetown by Sir Francis Drake in 1586 had the same effect asin some other Spanish sites; the commission sent out byPhilip II included engineers who drew plans like the one in
1160 State Contexts of Renaissance Mapping
fig. 41.17. CRISTÓBAL DE ROJAS, PLAN OF THE CITYOF PANAMA, 1609. The city of Panama formed a vital linkon the Spanish route between the Pacific and Atlantic Oceans,upon which the great flotas or treasure fleets operated. Hence
the care with which Rojas delineated not only the city, but alsothe surrounding countryside.Size of the original: 66 � 125 cm. Photography courtesySpain, Ministerio de Cultura, AGI (MP-Panamá, 27).
77. See the series of plans in González, Planos de ciudades iberoameri-canas y filipinas, 1:261–73.
78. Now preserved at Madrid, Real Academia de la Historia. See thecolor reproduction in Duke of Alba, Mapas españoles, pl. XXXI (fac-ing p. 129).
79. Vicenta Cortés Alonso, Catálogo de mapas de Colombia(Madrid: Ediciones Cultura Hispánica, 1967).
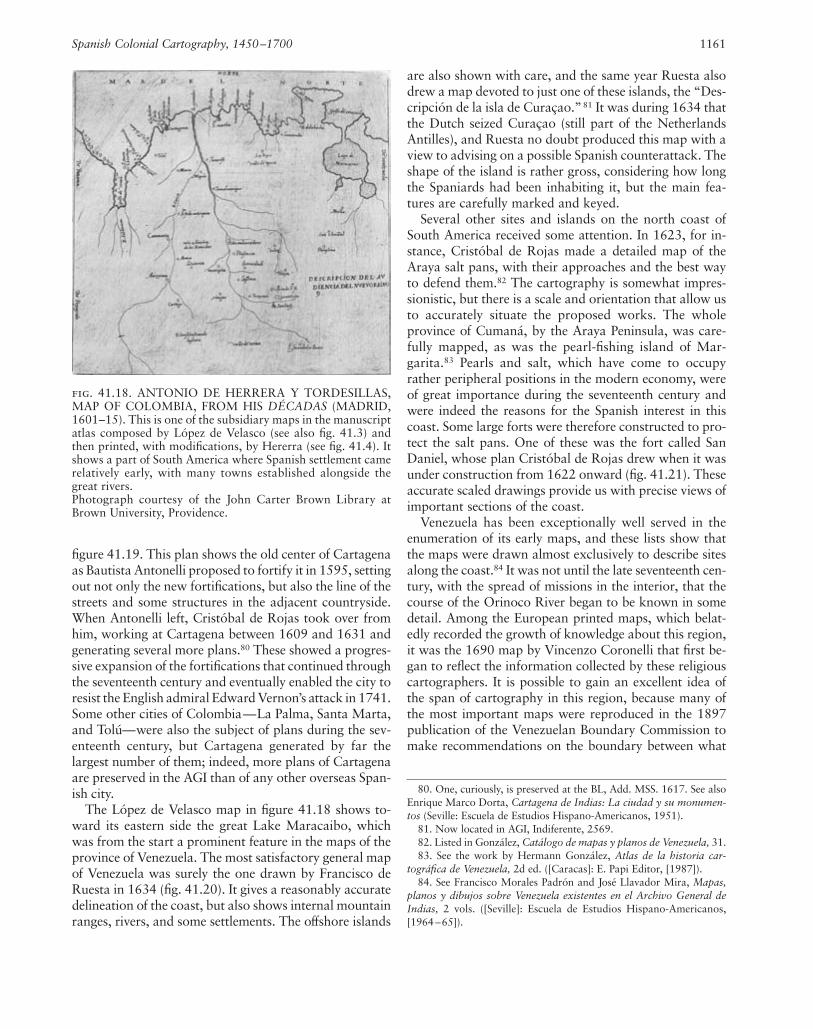
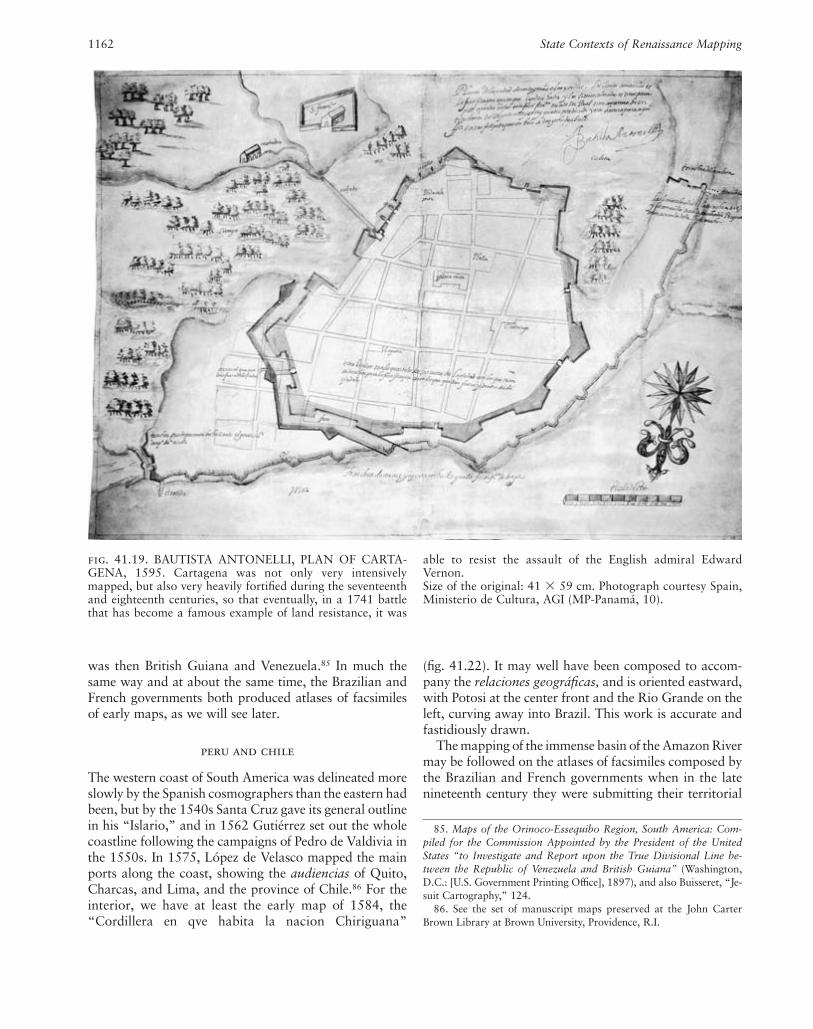
figure 41.19. This plan shows the old center of Cartagenaas Bautista Antonelli proposed to fortify it in 1595, settingout not only the new fortifications, but also the line of thestreets and some structures in the adjacent countryside.When Antonelli left, Cristóbal de Rojas took over fromhim, working at Cartagena between 1609 and 1631 andgenerating several more plans.80 These showed a progres-sive expansion of the fortifications that continued throughthe seventeenth century and eventually enabled the city toresist the English admiral Edward Vernon’s attack in 1741.Some other cities of Colombia—La Palma, Santa Marta,and Tolú—were also the subject of plans during the sev-enteenth century, but Cartagena generated by far thelargest number of them; indeed, more plans of Cartagenaare preserved in the AGI than of any other overseas Span-ish city.
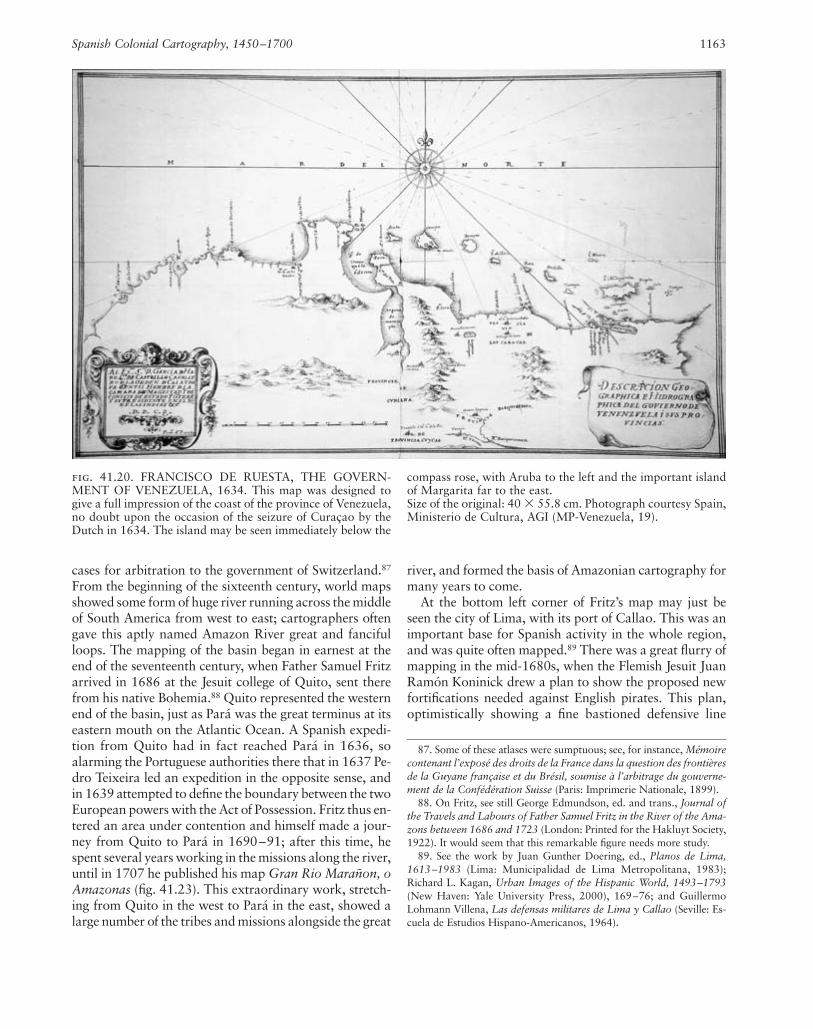
The López de Velasco map in figure 41.18 shows to-ward its eastern side the great Lake Maracaibo, whichwas from the start a prominent feature in the maps of theprovince of Venezuela. The most satisfactory general mapof Venezuela was surely the one drawn by Francisco deRuesta in 1634 (fig. 41.20). It gives a reasonably accuratedelineation of the coast, but also shows internal mountainranges, rivers, and some settlements. The offshore islands
are also shown with care, and the same year Ruesta alsodrew a map devoted to just one of these islands, the “Des-cripción de la isla de Curaçao.”81 It was during 1634 thatthe Dutch seized Curaçao (still part of the NetherlandsAntilles), and Ruesta no doubt produced this map with aview to advising on a possible Spanish counterattack. Theshape of the island is rather gross, considering how longthe Spaniards had been inhabiting it, but the main fea-tures are carefully marked and keyed.
Several other sites and islands on the north coast ofSouth America received some attention. In 1623, for in-stance, Cristóbal de Rojas made a detailed map of theAraya salt pans, with their approaches and the best wayto defend them.82 The cartography is somewhat impres-sionistic, but there is a scale and orientation that allow usto accurately situate the proposed works. The wholeprovince of Cumaná, by the Araya Peninsula, was care-fully mapped, as was the pearl-fishing island of Mar-garita.83 Pearls and salt, which have come to occupyrather peripheral positions in the modern economy, wereof great importance during the seventeenth century andwere indeed the reasons for the Spanish interest in thiscoast. Some large forts were therefore constructed to pro-tect the salt pans. One of these was the fort called SanDaniel, whose plan Cristóbal de Rojas drew when it wasunder construction from 1622 onward (fig. 41.21). Theseaccurate scaled drawings provide us with precise views ofimportant sections of the coast.
Venezuela has been exceptionally well served in theenumeration of its early maps, and these lists show thatthe maps were drawn almost exclusively to describe sitesalong the coast.84 It was not until the late seventeenth cen-tury, with the spread of missions in the interior, that thecourse of the Orinoco River began to be known in somedetail. Among the European printed maps, which belat-edly recorded the growth of knowledge about this region,it was the 1690 map by Vincenzo Coronelli that first be-gan to reflect the information collected by these religiouscartographers. It is possible to gain an excellent idea ofthe span of cartography in this region, because many ofthe most important maps were reproduced in the 1897publication of the Venezuelan Boundary Commission tomake recommendations on the boundary between what
Spanish Colonial Cartography, 1450–1700 1161
fig. 41.18. ANTONIO DE HERRERA Y TORDESILLAS,MAP OF COLOMBIA, FROM HIS DÉCADAS (MADRID,1601–15). This is one of the subsidiary maps in the manuscriptatlas composed by López de Velasco (see also fig. 41.3) andthen printed, with modifications, by Hererra (see fig. 41.4). Itshows a part of South America where Spanish settlement camerelatively early, with many towns established alongside thegreat rivers.Photograph courtesy of the John Carter Brown Library atBrown University, Providence.
80. One, curiously, is preserved at the BL, Add. MSS. 1617. See alsoEnrique Marco Dorta, Cartagena de Indias: La ciudad y su monumen-tos (Seville: Escuela de Estudios Hispano-Americanos, 1951).
81. Now located in AGI, Indiferente, 2569.82. Listed in González, Catálogo de mapas y planos de Venezuela, 31.83. See the work by Hermann González, Atlas de la historia car-
tográfica de Venezuela, 2d ed. ([Caracas]: E. Papi Editor, [1987]).84. See Francisco Morales Padrón and José Llavador Mira, Mapas,
planos y dibujos sobre Venezuela existentes en el Archivo General de Indias, 2 vols. ([Seville]: Escuela de Estudios Hispano-Americanos,[1964 –65]).
was then British Guiana and Venezuela.85 In much thesame way and at about the same time, the Brazilian andFrench governments both produced atlases of facsimilesof early maps, as we will see later.
peru and chile
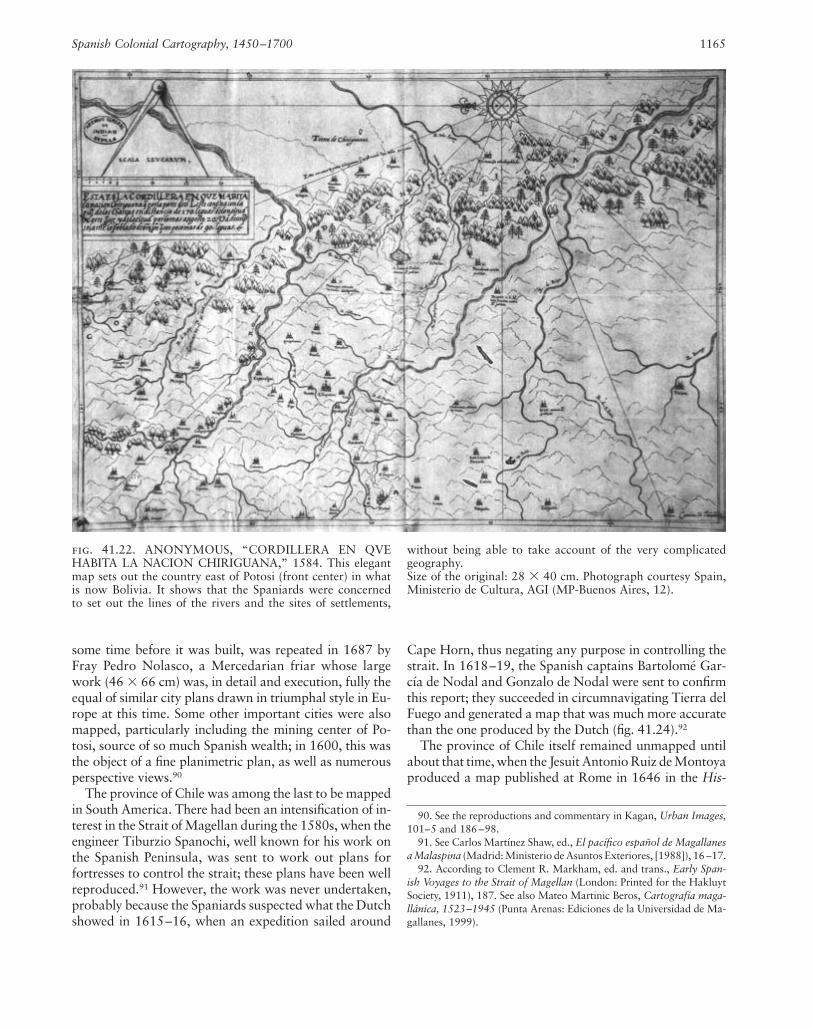
The western coast of South America was delineated moreslowly by the Spanish cosmographers than the eastern hadbeen, but by the 1540s Santa Cruz gave its general outlinein his “Islario,” and in 1562 Gutiérrez set out the wholecoastline following the campaigns of Pedro de Valdivia inthe 1550s. In 1575, López de Velasco mapped the mainports along the coast, showing the audiencias of Quito,Charcas, and Lima, and the province of Chile.86 For the interior, we have at least the early map of 1584, the“Cordillera en qve habita la nacion Chiriguana”
(fig. 41.22). It may well have been composed to accom-pany the relaciones geográficas, and is oriented eastward,with Potosi at the center front and the Rio Grande on theleft, curving away into Brazil. This work is accurate andfastidiously drawn.
The mapping of the immense basin of the Amazon Rivermay be followed on the atlases of facsimiles composed bythe Brazilian and French governments when in the latenineteenth century they were submitting their territorial
1162 State Contexts of Renaissance Mapping
fig. 41.19. BAUTISTA ANTONELLI, PLAN OF CARTA-GENA, 1595. Cartagena was not only very intensivelymapped, but also very heavily fortified during the seventeenthand eighteenth centuries, so that eventually, in a 1741 battlethat has become a famous example of land resistance, it was
able to resist the assault of the English admiral EdwardVernon.Size of the original: 41 � 59 cm. Photograph courtesy Spain,Ministerio de Cultura, AGI (MP-Panamá, 10).
85. Maps of the Orinoco-Essequibo Region, South America: Com-piled for the Commission Appointed by the President of the UnitedStates “to Investigate and Report upon the True Divisional Line be-tween the Republic of Venezuela and British Guiana” (Washington,D.C.: [U.S. Government Printing Office], 1897), and also Buisseret, “Je-suit Cartography,” 124.
86. See the set of manuscript maps preserved at the John CarterBrown Library at Brown University, Providence, R.I.
cases for arbitration to the government of Switzerland.87
From the beginning of the sixteenth century, world mapsshowed some form of huge river running across the middleof South America from west to east; cartographers oftengave this aptly named Amazon River great and fancifulloops. The mapping of the basin began in earnest at theend of the seventeenth century, when Father Samuel Fritzarrived in 1686 at the Jesuit college of Quito, sent therefrom his native Bohemia.88 Quito represented the westernend of the basin, just as Pará was the great terminus at itseastern mouth on the Atlantic Ocean. A Spanish expedi-tion from Quito had in fact reached Pará in 1636, soalarming the Portuguese authorities there that in 1637 Pe-dro Teixeira led an expedition in the opposite sense, andin 1639 attempted to define the boundary between the twoEuropean powers with the Act of Possession. Fritz thus en-tered an area under contention and himself made a jour-ney from Quito to Pará in 1690–91; after this time, hespent several years working in the missions along the river,until in 1707 he published his map Gran Rio Marañon, oAmazonas (fig. 41.23). This extraordinary work, stretch-ing from Quito in the west to Pará in the east, showed alarge number of the tribes and missions alongside the great
river, and formed the basis of Amazonian cartography formany years to come.
At the bottom left corner of Fritz’s map may just beseen the city of Lima, with its port of Callao. This was animportant base for Spanish activity in the whole region,and was quite often mapped.89 There was a great flurry ofmapping in the mid-1680s, when the Flemish Jesuit JuanRamón Koninick drew a plan to show the proposed newfortifications needed against English pirates. This plan,optimistically showing a fine bastioned defensive line
Spanish Colonial Cartography, 1450–1700 1163
fig. 41.20. FRANCISCO DE RUESTA, THE GOVERN-MENT OF VENEZUELA, 1634. This map was designed togive a full impression of the coast of the province of Venezuela,no doubt upon the occasion of the seizure of Curaçao by theDutch in 1634. The island may be seen immediately below the
compass rose, with Aruba to the left and the important islandof Margarita far to the east.Size of the original: 40 � 55.8 cm. Photograph courtesy Spain,Ministerio de Cultura, AGI (MP-Venezuela, 19).
87. Some of these atlases were sumptuous; see, for instance, Mémoirecontenant l’exposé des droits de la France dans la question des frontièresde la Guyane française et du Brésil, soumise à l’arbitrage du gouverne-ment de la Confédération Suisse (Paris: Imprimerie Nationale, 1899).
88. On Fritz, see still George Edmundson, ed. and trans., Journal ofthe Travels and Labours of Father Samuel Fritz in the River of the Ama-zons between 1686 and 1723 (London: Printed for the Hakluyt Society,1922). It would seem that this remarkable figure needs more study.
89. See the work by Juan Gunther Doering, ed., Planos de Lima,1613–1983 (Lima: Municipalidad de Lima Metropolitana, 1983);Richard L. Kagan, Urban Images of the Hispanic World, 1493–1793(New Haven: Yale University Press, 2000), 169–76; and GuillermoLohmann Villena, Las defensas militares de Lima y Callao (Seville: Es-cuela de Estudios Hispano-Americanos, 1964).
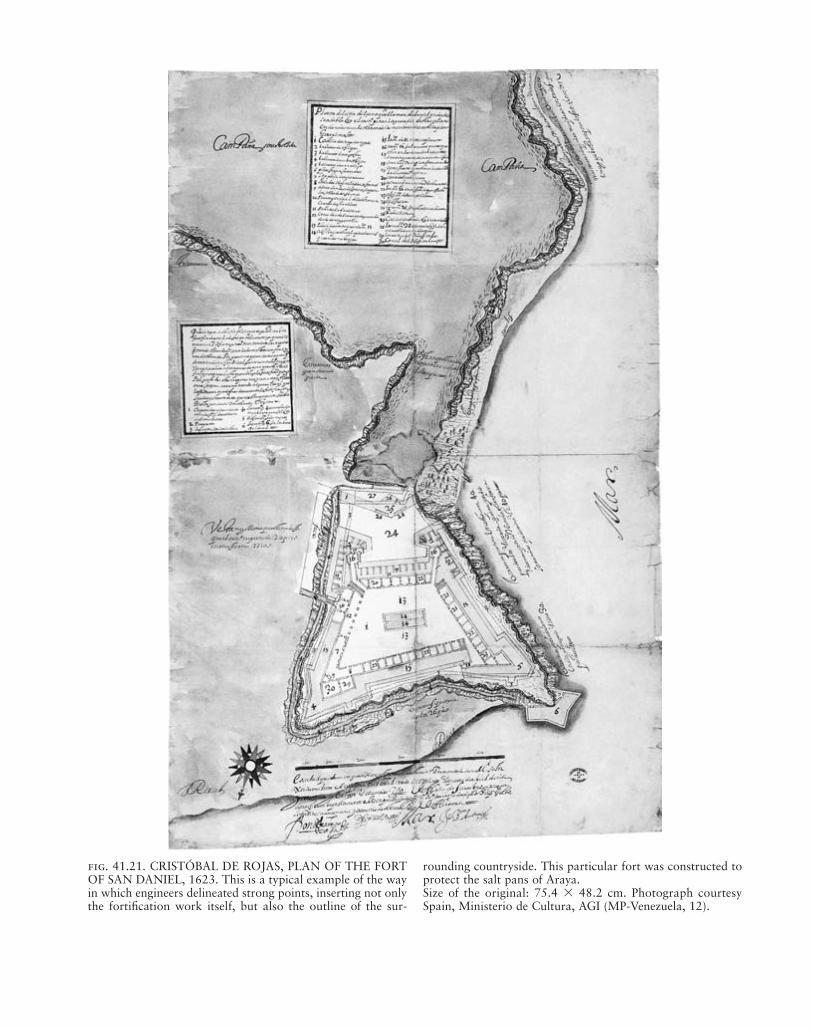
fig. 41.21. CRISTÓBAL DE ROJAS, PLAN OF THE FORTOF SAN DANIEL, 1623. This is a typical example of the wayin which engineers delineated strong points, inserting not onlythe fortification work itself, but also the outline of the sur-
rounding countryside. This particular fort was constructed toprotect the salt pans of Araya.Size of the original: 75.4 � 48.2 cm. Photograph courtesySpain, Ministerio de Cultura, AGI (MP-Venezuela, 12).
some time before it was built, was repeated in 1687 byFray Pedro Nolasco, a Mercedarian friar whose largework (46 � 66 cm) was, in detail and execution, fully theequal of similar city plans drawn in triumphal style in Eu-rope at this time. Some other important cities were alsomapped, particularly including the mining center of Po-tosi, source of so much Spanish wealth; in 1600, this wasthe object of a fine planimetric plan, as well as numerousperspective views.90
The province of Chile was among the last to be mappedin South America. There had been an intensification of in-terest in the Strait of Magellan during the 1580s, when theengineer Tiburzio Spanochi, well known for his work onthe Spanish Peninsula, was sent to work out plans forfortresses to control the strait; these plans have been wellreproduced.91 However, the work was never undertaken,probably because the Spaniards suspected what the Dutchshowed in 1615–16, when an expedition sailed around
Cape Horn, thus negating any purpose in controlling thestrait. In 1618–19, the Spanish captains Bartolomé Gar-cía de Nodal and Gonzalo de Nodal were sent to confirmthis report; they succeeded in circumnavigating Tierra delFuego and generated a map that was much more accuratethan the one produced by the Dutch (fig. 41.24).92
The province of Chile itself remained unmapped untilabout that time, when the Jesuit Antonio Ruiz de Montoyaproduced a map published at Rome in 1646 in the His-
Spanish Colonial Cartography, 1450–1700 1165
fig. 41.22. ANONYMOUS, “CORDILLERA EN QVEHABITA LA NACION CHIRIGUANA,” 1584. This elegantmap sets out the country east of Potosi (front center) in whatis now Bolivia. It shows that the Spaniards were concerned to set out the lines of the rivers and the sites of settlements,
without being able to take account of the very complicatedgeography.Size of the original: 28 � 40 cm. Photograph courtesy Spain,Ministerio de Cultura, AGI (MP-Buenos Aires, 12).
90. See the reproductions and commentary in Kagan, Urban Images,101–5 and 186 –98.
91. See Carlos Martínez Shaw, ed., El pacífico español de Magallanesa Malaspina (Madrid: Ministerio de Asuntos Exteriores, [1988]), 16 –17.
92. According to Clement R. Markham, ed. and trans., Early Span-ish Voyages to the Strait of Magellan (London: Printed for the HakluytSociety, 1911), 187. See also Mateo Martinic Beros, Cartografía maga-llánica, 1523–1945 (Punta Arenas: Ediciones de la Universidad de Ma-gallanes, 1999).
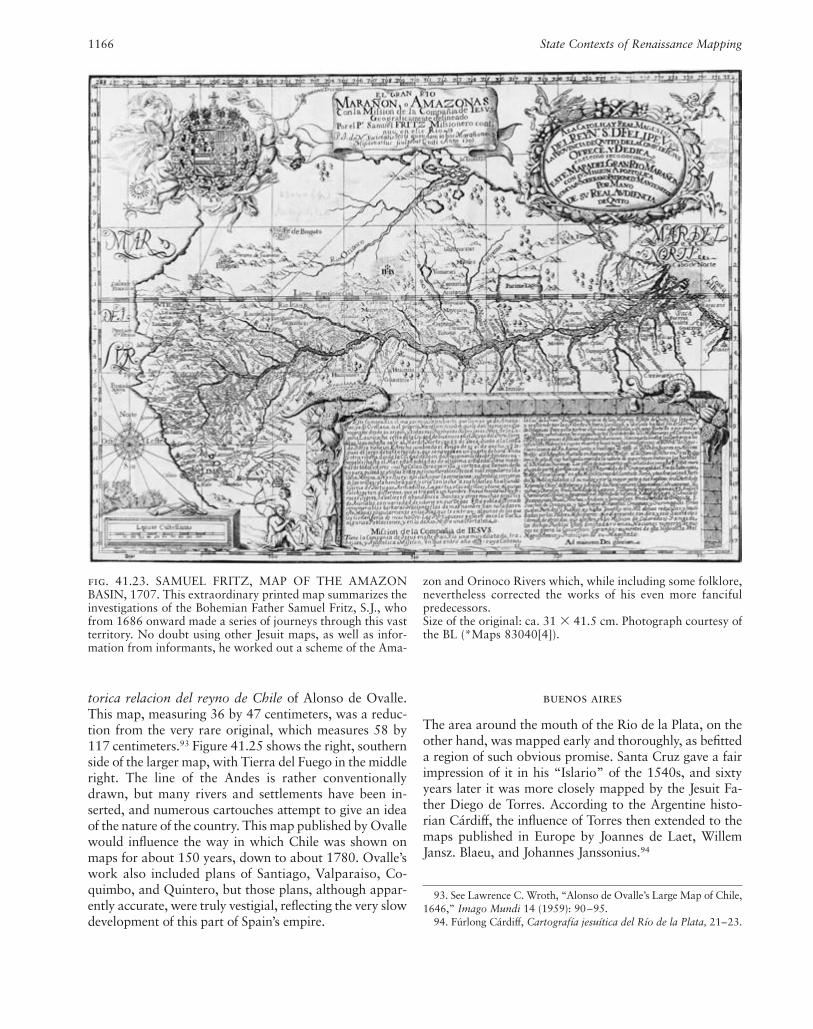
torica relacion del reyno de Chile of Alonso de Ovalle.This map, measuring 36 by 47 centimeters, was a reduc-tion from the very rare original, which measures 58 by117 centimeters.93 Figure 41.25 shows the right, southernside of the larger map, with Tierra del Fuego in the middleright. The line of the Andes is rather conventionallydrawn, but many rivers and settlements have been in-serted, and numerous cartouches attempt to give an ideaof the nature of the country. This map published by Ovallewould influence the way in which Chile was shown onmaps for about 150 years, down to about 1780. Ovalle’swork also included plans of Santiago, Valparaiso, Co-quimbo, and Quintero, but those plans, although appar-ently accurate, were truly vestigial, reflecting the very slowdevelopment of this part of Spain’s empire.
buenos aires
The area around the mouth of the Rio de la Plata, on theother hand, was mapped early and thoroughly, as befitteda region of such obvious promise. Santa Cruz gave a fairimpression of it in his “Islario” of the 1540s, and sixtyyears later it was more closely mapped by the Jesuit Fa-ther Diego de Torres. According to the Argentine histo-rian Cárdiff, the influence of Torres then extended to themaps published in Europe by Joannes de Laet, WillemJansz. Blaeu, and Johannes Janssonius.94
1166 State Contexts of Renaissance Mapping
fig. 41.23. SAMUEL FRITZ, MAP OF THE AMAZONBASIN, 1707. This extraordinary printed map summarizes theinvestigations of the Bohemian Father Samuel Fritz, S.J., whofrom 1686 onward made a series of journeys through this vastterritory. No doubt using other Jesuit maps, as well as infor-mation from informants, he worked out a scheme of the Ama-
zon and Orinoco Rivers which, while including some folklore,nevertheless corrected the works of his even more fancifulpredecessors.Size of the original: ca. 31 � 41.5 cm. Photograph courtesy ofthe BL (*Maps 83040[4]).
93. See Lawrence C. Wroth, “Alonso de Ovalle’s Large Map of Chile,1646,” Imago Mundi 14 (1959): 90–95.
94. Fúrlong Cárdiff, Cartografía jesuítica del Río de la Plata, 21–23.
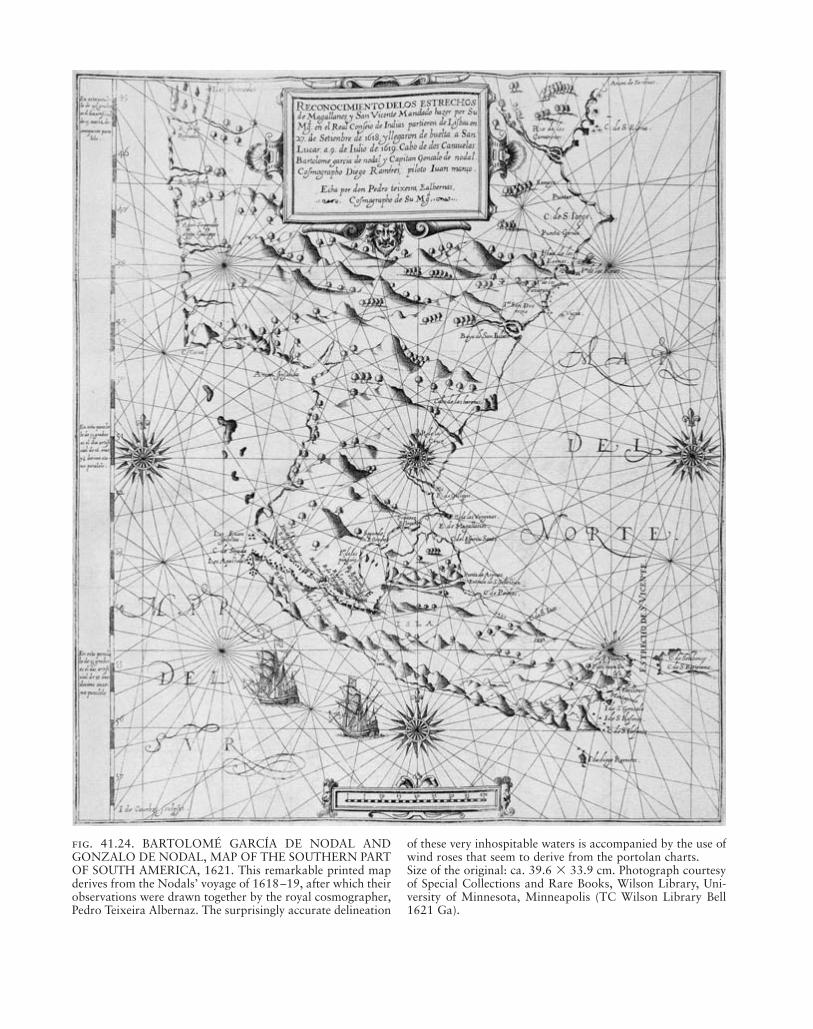
fig. 41.24. BARTOLOMÉ GARCÍA DE NODAL ANDGONZALO DE NODAL, MAP OF THE SOUTHERN PARTOF SOUTH AMERICA, 1621. This remarkable printed mapderives from the Nodals’ voyage of 1618–19, after which theirobservations were drawn together by the royal cosmographer,Pedro Teixeira Albernaz. The surprisingly accurate delineation
of these very inhospitable waters is accompanied by the use ofwind roses that seem to derive from the portolan charts.Size of the original: ca. 39.6 � 33.9 cm. Photograph courtesyof Special Collections and Rare Books, Wilson Library, Uni-versity of Minnesota, Minneapolis (TC Wilson Library Bell1621 Ga).
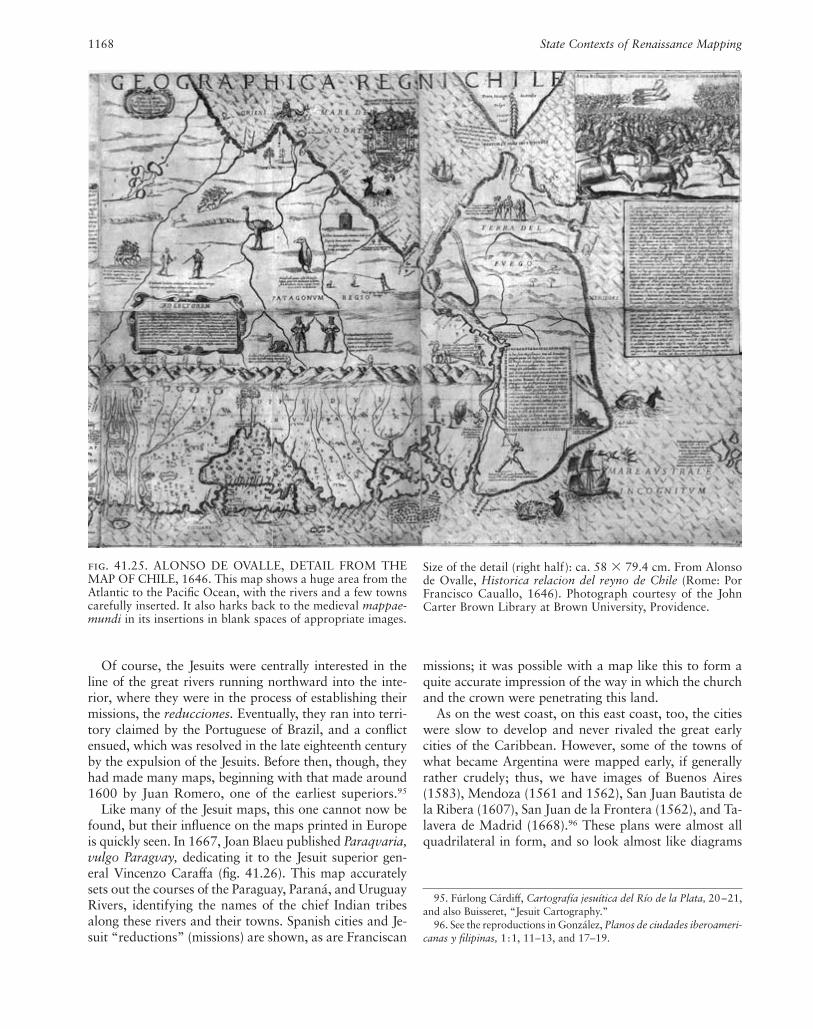
Of course, the Jesuits were centrally interested in theline of the great rivers running northward into the inte-rior, where they were in the process of establishing theirmissions, the reducciones. Eventually, they ran into terri-tory claimed by the Portuguese of Brazil, and a conflictensued, which was resolved in the late eighteenth centuryby the expulsion of the Jesuits. Before then, though, theyhad made many maps, beginning with that made around1600 by Juan Romero, one of the earliest superiors.95
Like many of the Jesuit maps, this one cannot now befound, but their influence on the maps printed in Europeis quickly seen. In 1667, Joan Blaeu published Paraqvaria,vulgo Paragvay, dedicating it to the Jesuit superior gen-eral Vincenzo Caraffa (fig. 41.26). This map accuratelysets out the courses of the Paraguay, Paraná, and UruguayRivers, identifying the names of the chief Indian tribesalong these rivers and their towns. Spanish cities and Je-suit “reductions” (missions) are shown, as are Franciscan
missions; it was possible with a map like this to form aquite accurate impression of the way in which the churchand the crown were penetrating this land.
As on the west coast, on this east coast, too, the citieswere slow to develop and never rivaled the great earlycities of the Caribbean. However, some of the towns ofwhat became Argentina were mapped early, if generallyrather crudely; thus, we have images of Buenos Aires(1583), Mendoza (1561 and 1562), San Juan Bautista dela Ribera (1607), San Juan de la Frontera (1562), and Ta-lavera de Madrid (1668).96 These plans were almost allquadrilateral in form, and so look almost like diagrams
1168 State Contexts of Renaissance Mapping
fig. 41.25. ALONSO DE OVALLE, DETAIL FROM THEMAP OF CHILE, 1646. This map shows a huge area from theAtlantic to the Pacific Ocean, with the rivers and a few townscarefully inserted. It also harks back to the medieval mappae-mundi in its insertions in blank spaces of appropriate images.
Size of the detail (right half): ca. 58 � 79.4 cm. From Alonsode Ovalle, Historica relacion del reyno de Chile (Rome: PorFrancisco Cauallo, 1646). Photograph courtesy of the JohnCarter Brown Library at Brown University, Providence.
95. Fúrlong Cárdiff, Cartografía jesuítica del Río de la Plata, 20–21,and also Buisseret, “Jesuit Cartography.”
96. See the reproductions in González, Planos de ciudades iberoameri-canas y filipinas, 1:1, 11–13, and 17–19.
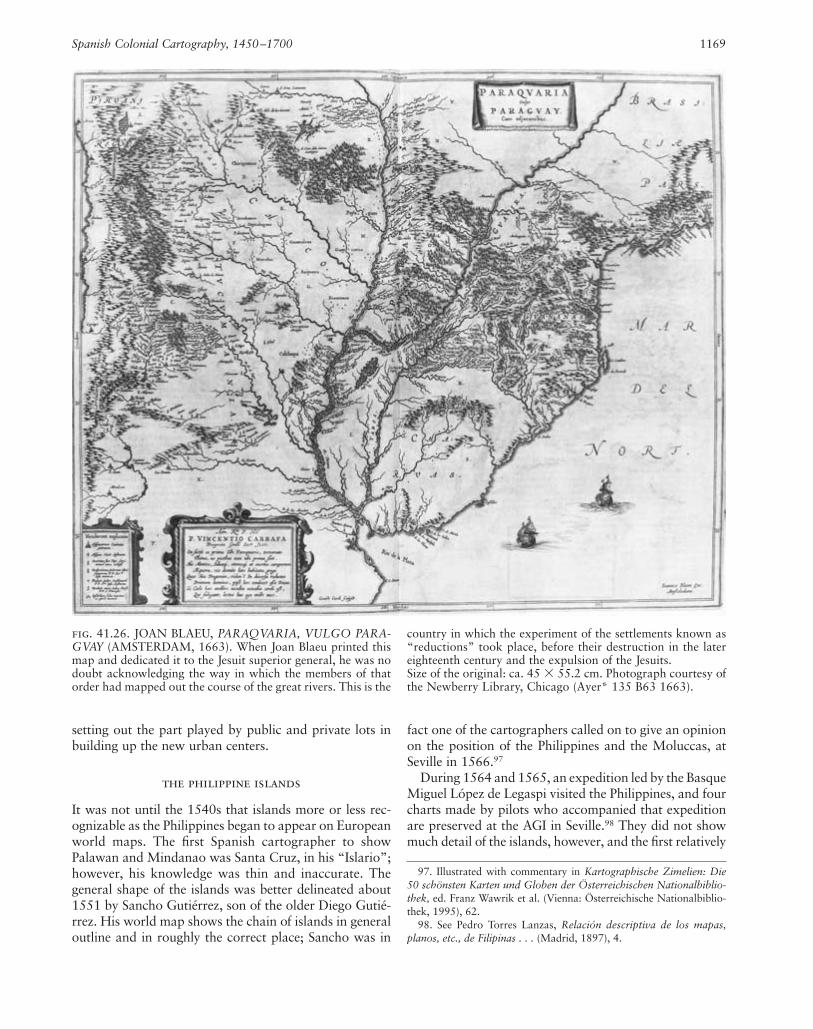
setting out the part played by public and private lots inbuilding up the new urban centers.
the philippine islands
It was not until the 1540s that islands more or less rec-ognizable as the Philippines began to appear on Europeanworld maps. The first Spanish cartographer to showPalawan and Mindanao was Santa Cruz, in his “Islario”;however, his knowledge was thin and inaccurate. Thegeneral shape of the islands was better delineated about1551 by Sancho Gutiérrez, son of the older Diego Gutié-rrez. His world map shows the chain of islands in generaloutline and in roughly the correct place; Sancho was in
fact one of the cartographers called on to give an opinionon the position of the Philippines and the Moluccas, atSeville in 1566.97
During 1564 and 1565, an expedition led by the BasqueMiguel López de Legaspi visited the Philippines, and fourcharts made by pilots who accompanied that expeditionare preserved at the AGI in Seville.98 They did not showmuch detail of the islands, however, and the first relatively
Spanish Colonial Cartography, 1450–1700 1169
fig. 41.26. JOAN BLAEU, PARAQVARIA, VULGO PARA-GVAY (AMSTERDAM, 1663). When Joan Blaeu printed thismap and dedicated it to the Jesuit superior general, he was nodoubt acknowledging the way in which the members of thatorder had mapped out the course of the great rivers. This is the
country in which the experiment of the settlements known as“reductions” took place, before their destruction in the latereighteenth century and the expulsion of the Jesuits.Size of the original: ca. 45 � 55.2 cm. Photograph courtesy ofthe Newberry Library, Chicago (Ayer* 135 B63 1663).
97. Illustrated with commentary in Kartographische Zimelien: Die50 schönsten Karten und Globen der Österreichischen Nationalbiblio-thek, ed. Franz Wawrik et al. (Vienna: Österreichische Nationalbiblio-thek, 1995), 62.
98. See Pedro Torres Lanzas, Relación descriptiva de los mapas,planos, etc., de Filipinas . . . (Madrid, 1897), 4.
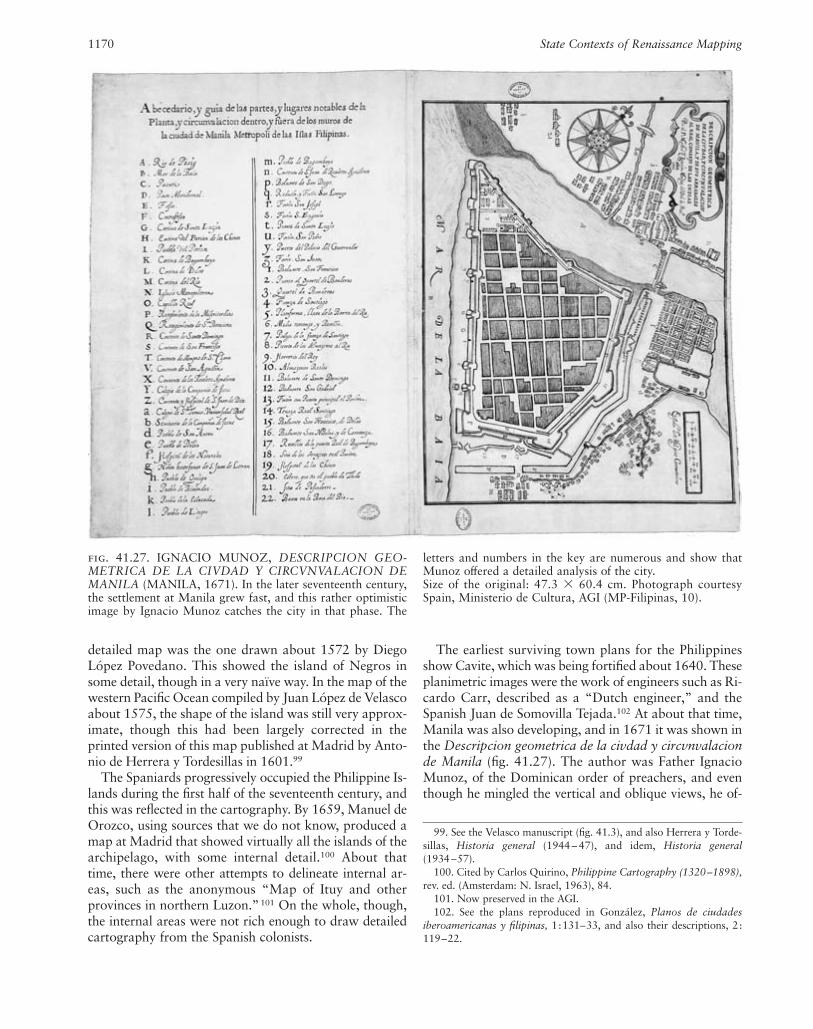
detailed map was the one drawn about 1572 by DiegoLópez Povedano. This showed the island of Negros insome detail, though in a very naïve way. In the map of thewestern Pacific Ocean compiled by Juan López de Velascoabout 1575, the shape of the island was still very approx-imate, though this had been largely corrected in theprinted version of this map published at Madrid by Anto-nio de Herrera y Tordesillas in 1601.99
The Spaniards progressively occupied the Philippine Is-lands during the first half of the seventeenth century, andthis was reflected in the cartography. By 1659, Manuel deOrozco, using sources that we do not know, produced amap at Madrid that showed virtually all the islands of thearchipelago, with some internal detail.100 About thattime, there were other attempts to delineate internal ar-eas, such as the anonymous “Map of Ituy and otherprovinces in northern Luzon.”101 On the whole, though,the internal areas were not rich enough to draw detailedcartography from the Spanish colonists.
The earliest surviving town plans for the Philippinesshow Cavite, which was being fortified about 1640. Theseplanimetric images were the work of engineers such as Ri-cardo Carr, described as a “Dutch engineer,” and theSpanish Juan de Somovilla Tejada.102 At about that time,Manila was also developing, and in 1671 it was shown inthe Descripcion geometrica de la civdad y circvnvalacionde Manila (fig. 41.27). The author was Father IgnacioMunoz, of the Dominican order of preachers, and eventhough he mingled the vertical and oblique views, he of-
1170 State Contexts of Renaissance Mapping
fig. 41.27. IGNACIO MUNOZ, DESCRIPCION GEO-METRICA DE LA CIVDAD Y CIRCVNVALACION DEMANILA (MANILA, 1671). In the later seventeenth century,the settlement at Manila grew fast, and this rather optimisticimage by Ignacio Munoz catches the city in that phase. The
letters and numbers in the key are numerous and show thatMunoz offered a detailed analysis of the city.Size of the original: 47.3 � 60.4 cm. Photograph courtesySpain, Ministerio de Cultura, AGI (MP-Filipinas, 10).
99. See the Velasco manuscript (fig. 41.3), and also Herrera y Torde-sillas, Historia general (1944 – 47), and idem, Historia general(1934 –57).
100. Cited by Carlos Quirino, Philippine Cartography (1320–1898),rev. ed. (Amsterdam: N. Israel, 1963), 84.
101. Now preserved in the AGI.102. See the plans reproduced in González, Planos de ciudades
iberoamericanas y filipinas, 1:131–33, and also their descriptions, 2:119–22.
fered scale and orientation and succeeded in giving a con-vincing impression of the emerging capital city. As the eco-nomic center of Spain’s Eastern trade, and home of theManila galleon, it would be mapped very often during theeighteenth century.103
Conclusion
The task facing the Spaniards in the spatial representationof their territories was immense. The Portuguese, it istrue, had expanded as far and as fast, but they were notconcerned to establish colonies of settlement, and so werecontent with accurately charting the sea lanes from Por-tugal. There was no need for Portuguese mapmakers toproduce detailed images of territory that they did not in-tend to occupy. The one exception to this was Brazil,where indeed they eventually established a well-mappedcolony of settlement. When the other European powersbegan to expand in the later sixteenth century, they didso more gradually, and mapped their new possessionsmuch less systematically than the Spaniards. In the caseof the English, cartography was left to private enterprise,and the French never attempted, for instance, to establishanything like the equivalent to the Casa de la Contra-tación at Le Havre or Marseille. Only the Dutch followedthe Iberian lead, with their navigation schools at Amster-dam and at Batavia.
By the end of the sixteenth century, the work of theCasa de la Contratación had established the outlines ofthe Spanish New World, and López de Velasco hadshown how it was possible to map all these regions in auniform fashion. Philip II undoubtedly wanted to carrythis work further and to use the pinturas accompanyingthe relaciones geográficas to work out detailed maps ofthe whole empire. This ambitious project failed, not onlybecause of the nature of the pinturas, whose informationwas often inaccessible to cartographers of the Europeantradition, but also because toward the end of the centuryPhilip II and his successors were increasingly diverted bytheir problems in Europe.
The intrusion of foreign powers into the New Worldduring the 1580s had the paradoxical effect of forcing theSpaniards seriously to fortify their major cities for the firsttime, and that, in turn, led to the work of engineers who
could not only plan bastioned traces around them, butalso delineate their main features, often set into the adja-cent countryside. From 1517 onward, a series of laws hadset out the ways in which cities were to be founded in theNew World. They were to be located near fresh water andnot too far from the sea, with the streets oriented to thefour cardinal points, provision left for two main squares,and so forth. We thus find great numbers of town plansin which the old quadrilateral city centers—laid out inaccordance with these laws of the Indies—were now tobe surrounded by powerful walls and bastions. This pro-cess of fortification and its corresponding maps wouldlast down to the end of Spanish overseas power.
At first there had been little prospect that the country-side would be closely mapped, following the failure ofPhilip II’s venture of the 1570s. But then came the arrivalof the Jesuits, toward the end of that century. Trained inmathematics and cartography at many of their colleges,which began to dot Catholic Europe, they brought theirskills even to the most remote missions. This was true notonly in the Spanish world, in places such as northernMexico, the Orinoco River Valley, and the region ofParaguay, but also in French Canada and PortugueseBrazil. Their work, which came about as an almost acci-dental meeting of their skills and unexpected opportuni-ties, meant that many regions were better known in theirmanuscript maps than they would be until the twentiethcentury, with its great advance in cartographic tech-niques. The Jesuits were eventually expelled from theoverseas possessions in the 1770s, and their remarkablework came to an end.
At the beginning of the eighteenth century, the lastHabsburg king, Charles II (r. 1665–1700) died; his suc-cessor was the French prince known as Philip V (r. 1700–1746). Long before 1700, though, the influence of theFrench Bourbons had been felt in Spain, as the power ofthe Spanish Habsburgs ebbed away. One of the manyinviting subjects in the history of Spanish overseas car-tography is indeed the process by which Bourbon influ-ence penetrated the peninsula. But that is only one amongmany such potentially fruitful subjects for research.
Spanish Colonial Cartography, 1450–1700 1171
103. See González, Planos de ciudades iberoamericanas y filipinas, 1:138–56, for numerous plans of Manila.