Embed Size (px)
Citation preview
Transport Research Laboratory
The Highways Agency roadside air
pollution monitoring network report -
2009 Volume I
by J S Price, J Pittman and D Gardiner
CPR1094 (I)
396 (387) HTRL
CLIENT PROJECT REPORT
Transport Research Laboratory
PROJECT REPORT CPR1094 (I)
The Highways Agency roadside air pollution monitoring network report - 2009 Volume I
by J S Price, J Pittman and D Gardiner
Prepared for: Project Record: 396 (387) HTRL
Impact of reduced emissions on air quality -
2009 volume I
Client: Highways Agency
Andrew Bean
Copyright Transport Research Laboratory March 2011
The views expressed are those of the author(s) and not necessarily those of Highways
Agency.
Name Date
Approved
Project
Manager Julia Pittman 18/03/2010
Technical
Referee David Gardiner 18/03/2010

Client Project Report
TRL CPR1094 (I)
Contents Amendment Record
This report has been issued and amended as follows
Version Date Description Editor Technical
Referee
1 15/02/2011 Draft for client Jennifer Price / Julia Pittman David Gardiner
2 08/03/2011 Amended with client comments
Jennifer Price / Julia Pittman David Gardiner
Client Project Report
TRL CPR1094 (I)
Executive summary
This report is the ninth in a series summarising air pollutant concentrations,
meteorological data and traffic flows measured at sites across the Highways Agency long
term roadside monitoring network. The network comprises four monitoring sites located
on the M4, M25 and M60 motorways and in the Bell Common Tunnel on the M25
motorway. Concentrations of carbon monoxide (CO), oxides of nitrogen (NOX), nitric
oxide (NO), nitrogen dioxide (NO2), particulate matter (PM10 and PM2.5) and ozone (O3)
were measured at all sites. In addition, concentrations of total hydrocarbons (methane
(CH4) and non-methane hydrocarbons) and ammonia (NH3) were measured at the M4,
M25 and M60 motorway sites and concentrations of sulphur dioxide (SO2), hydrogen
sulphide (H2S), aromatic hydrocarbons, polycyclic aromatic hydrocarbons (PAH),
aldehydes and metals were measured at the M25 and M60 motorway sites.
Meteorological data (including wind speed, wind direction, temperature and relative
humidity) were collected at the M4, M25 and M60 motorway sites and solar radiation
was measured at the M25 site. Traffic flows were recorded at all four monitoring sites.
The air pollution monitoring equipment used at each site is comparable with equipment
used in similar monitoring stations within the UK National Air Quality Monitoring Network.
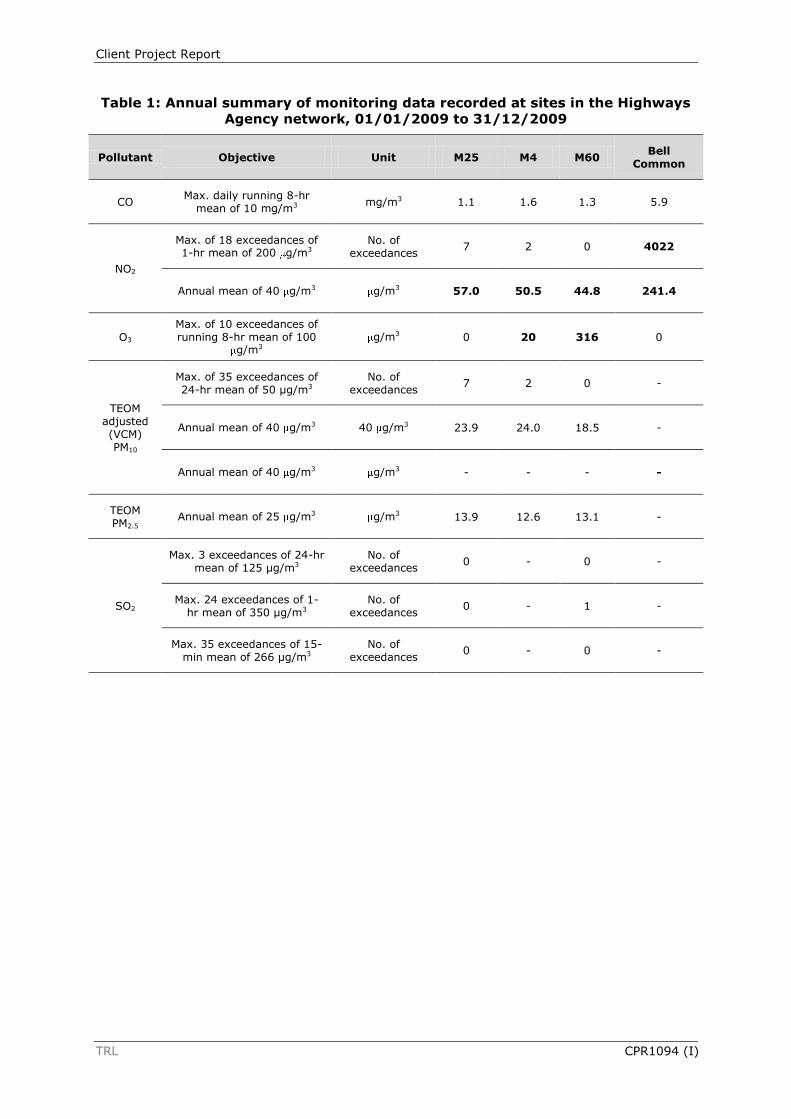
Table 1 provides a summary of statistics generated from data collected during 2009 at
each of the monitoring sites and compares this with objectives set out by the Air Quality
(England) Regulations 2000 (SI 2000 No. 928) and the Air Quality (England)
(Amendment) Regulations 2002 (SI 2002 No. 3043). Exceedance of the NO2 annual
mean objective concentration occurred at all four monitoring sites in the Highways
Agency network in 2009. Exceedance of the NO2 1-hour mean objective occurred at the
Bell Common Tunnel site in 2009. Exceedance of the running 8-hour mean objective for
O3 occurred at the M60 site in 2009. There were no exceedances of the relevant
objectives for SO2, PM2.5, PAH, benzene, CO or lead at any of the monitoring sites in
2009.
In addition to comparison with UK Air Quality Regulations, the monitoring data are also
presented as average hourly data to enable direct comparison with the full time series
data measured at each site and dating back to 1992 (i.e. the date of installation of the
first monitoring site on the M4 motorway).
Client Project Report
TRL CPR1094 (I)
Table 1: Annual summary of monitoring data recorded at sites in the Highways
Agency network, 01/01/2009 to 31/12/2009
Pollutant Objective Unit M25 M4 M60 Bell
Common
CO Max. daily running 8-hr
mean of 10 mg/m3 mg/m3 1.1 1.6 1.3 5.9
NO2
Max. of 18 exceedances of 1-hr mean of 200 g/m3
No. of exceedances
7 2 0 4022
Annual mean of 40 g/m3 g/m3 57.0 50.5 44.8 241.4
O3
Max. of 10 exceedances of running 8-hr mean of 100
g/m3 g/m3 0 20 316 0
TEOM adjusted (VCM) PM10
Max. of 35 exceedances of 24-hr mean of 50 µg/m3
No. of exceedances 7 2 0 -
Annual mean of 40 g/m3 40 g/m3 23.9 24.0 18.5 -
Annual mean of 40 g/m3 g/m3 - - - -
TEOM PM2.5
Annual mean of 25 g/m3 g/m3 13.9 12.6 13.1 -
SO2
Max. 3 exceedances of 24-hr mean of 125 µg/m3
No. of exceedances
0 - 0 -
Max. 24 exceedances of 1- hr mean of 350 µg/m3
No. of exceedances
0 - 1 -
Max. 35 exceedances of 15-min mean of 266 µg/m3
No. of exceedances
0 - 0 -

Client Project Report
TRL i RPN1446 (I)
Contents
List of Tables iii
1 Introduction 4
2 Data collection 5
2.1 M4 (Theale 2), Pinglewood 5
2.2 M25, Bell Common Tunnel 6
2.3 M25 (M25B), Staines 7
2.4 M60, Kirkhams 8
2.5 Quality assurance and quality control 9 2.5.1 Site visits 10 2.5.2 Data checking 10 2.5.3 Data calibration and ratification 10 2.5.4 Data analysis 10
3 Compliance with UK Air Quality objectives and permitted exceedances 11
3.1 Nitrogen dioxide 11
3.2 Sulphur dioxide 13
3.3 Ozone 14
3.4 Particulate Matter 16 3.4.1 PM10 16 3.4.2 PM2.5 17
3.5 Aromatic hydrocarbons (BTEX) 17
3.6 Carbon monoxide 18
3.7 Lead 19
3.8 Pollutants not covered by the UK Air Quality Regulations 19 3.8.1 Polycyclic aromatic hydrocarbons 19 3.8.2 Aldehydes 20 3.8.3 Total hydrocarbons 20 3.8.4 Ammonia 21 3.8.5 Heavy metals 21 3.8.6 Hydrogen sulphide 22
3.9 Traffic data 22
4 Summary 23
References 24
Appendix A Figures and locations of monitoring sites 25
Appendix B Calibration and maintenance records 33
Appendix C Meteorological data 39

Client Project Report
TRL ii RPN1446 (I)
Appendix D Air Quality Strategy objectives 40
Appendix E Conversion factors 41
Client Project Report
TRL iii RPN1446 (I)
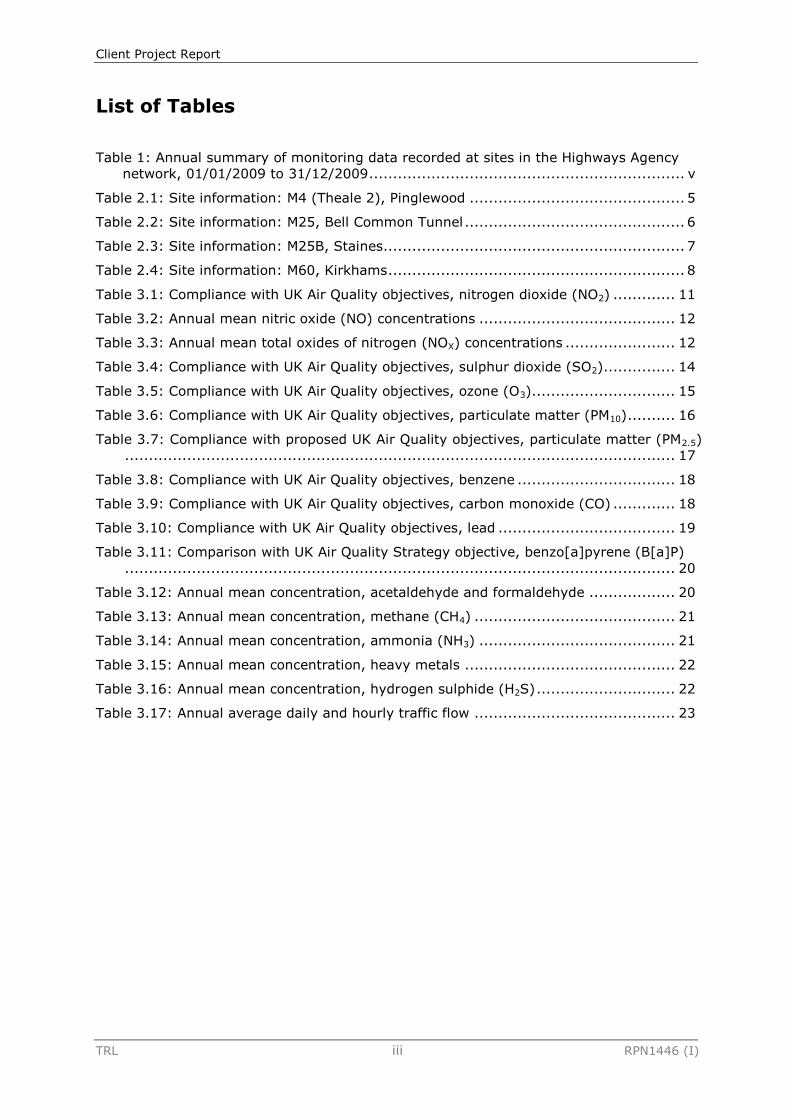
List of Tables
Table 1: Annual summary of monitoring data recorded at sites in the Highways Agency
network, 01/01/2009 to 31/12/2009 .................................................................. v
Table 2.1: Site information: M4 (Theale 2), Pinglewood ............................................. 5
Table 2.2: Site information: M25, Bell Common Tunnel .............................................. 6
Table 2.3: Site information: M25B, Staines............................................................... 7
Table 2.4: Site information: M60, Kirkhams .............................................................. 8
Table 3.1: Compliance with UK Air Quality objectives, nitrogen dioxide (NO2) ............. 11
Table 3.2: Annual mean nitric oxide (NO) concentrations ......................................... 12
Table 3.3: Annual mean total oxides of nitrogen (NOX) concentrations ....................... 12
Table 3.4: Compliance with UK Air Quality objectives, sulphur dioxide (SO2)............... 14
Table 3.5: Compliance with UK Air Quality objectives, ozone (O3).............................. 15
Table 3.6: Compliance with UK Air Quality objectives, particulate matter (PM10) .......... 16
Table 3.7: Compliance with proposed UK Air Quality objectives, particulate matter (PM2.5)
................................................................................................................... 17
Table 3.8: Compliance with UK Air Quality objectives, benzene ................................. 18
Table 3.9: Compliance with UK Air Quality objectives, carbon monoxide (CO) ............. 18
Table 3.10: Compliance with UK Air Quality objectives, lead ..................................... 19
Table 3.11: Comparison with UK Air Quality Strategy objective, benzo[a]pyrene (B[a]P)
................................................................................................................... 20
Table 3.12: Annual mean concentration, acetaldehyde and formaldehyde .................. 20
Table 3.13: Annual mean concentration, methane (CH4) .......................................... 21
Table 3.14: Annual mean concentration, ammonia (NH3) ......................................... 21
Table 3.15: Annual mean concentration, heavy metals ............................................ 22
Table 3.16: Annual mean concentration, hydrogen sulphide (H2S) ............................. 22
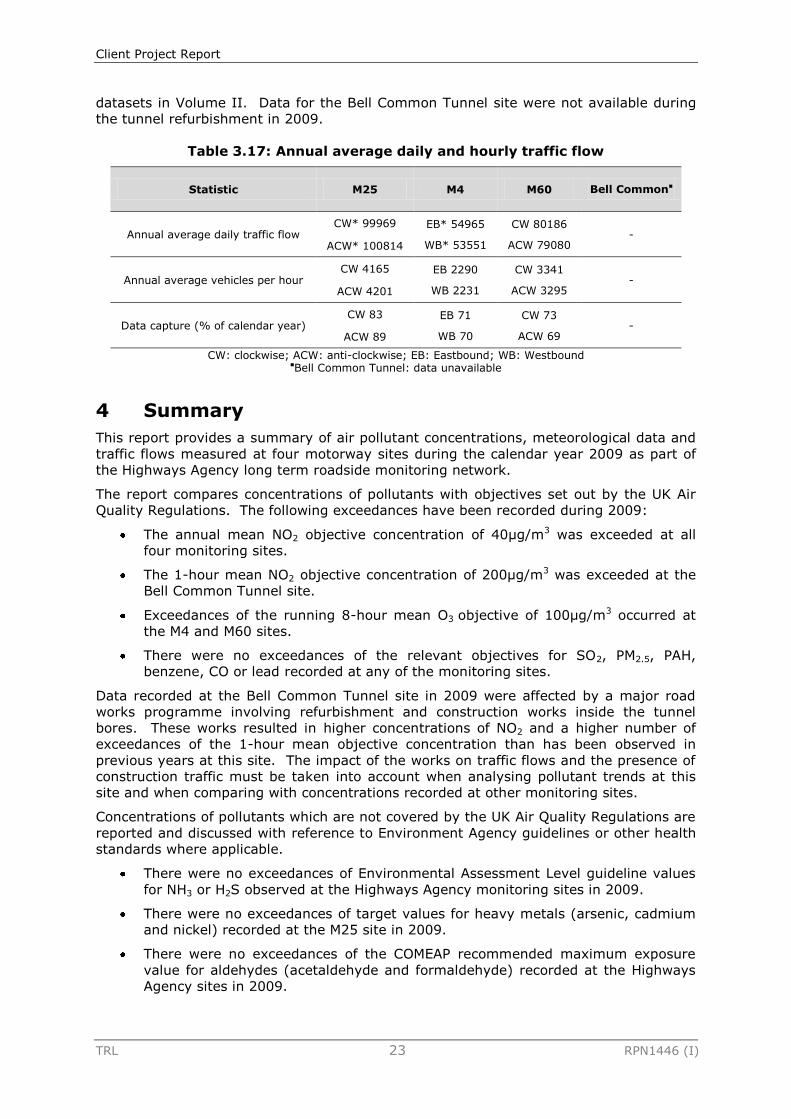
Table 3.17: Annual average daily and hourly traffic flow .......................................... 23
Client Project Report
TRL 4 RPN1446 (I)
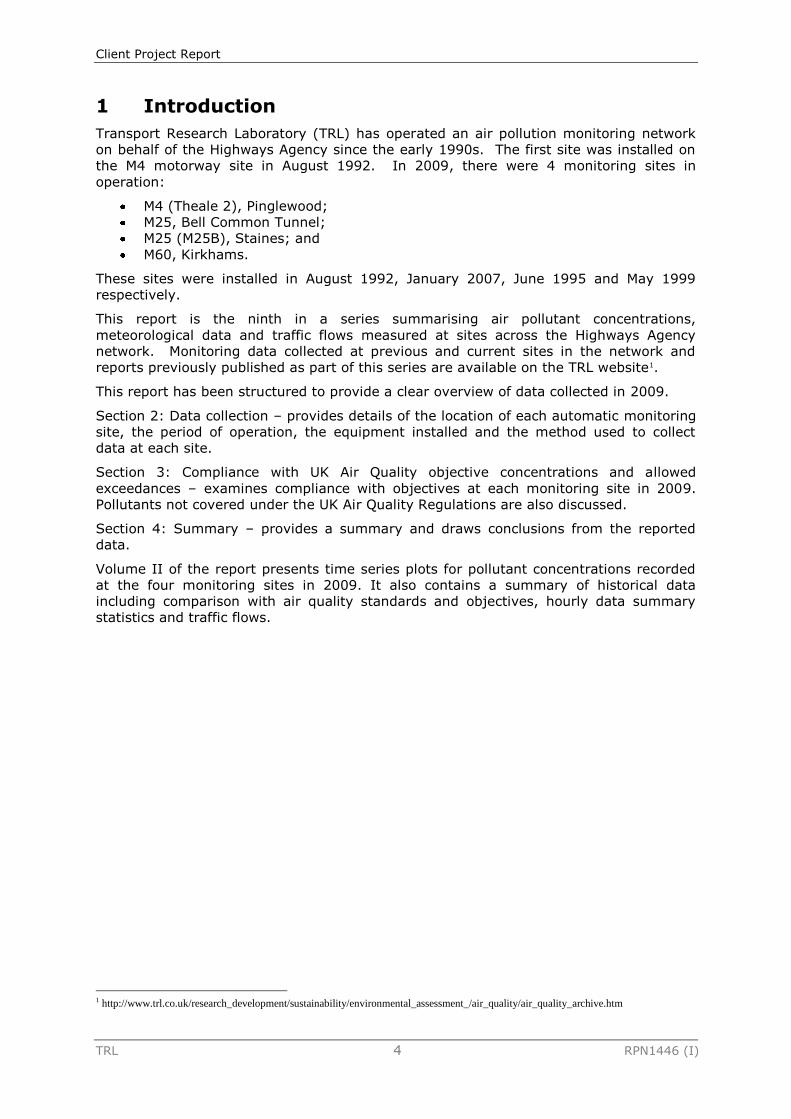
1 Introduction
Transport Research Laboratory (TRL) has operated an air pollution monitoring network
on behalf of the Highways Agency since the early 1990s. The first site was installed on
the M4 motorway site in August 1992. In 2009, there were 4 monitoring sites in
operation:
M4 (Theale 2), Pinglewood;
M25, Bell Common Tunnel;
M25 (M25B), Staines; and
M60, Kirkhams.
These sites were installed in August 1992, January 2007, June 1995 and May 1999
respectively.
This report is the ninth in a series summarising air pollutant concentrations,
meteorological data and traffic flows measured at sites across the Highways Agency
network. Monitoring data collected at previous and current sites in the network and
reports previously published as part of this series are available on the TRL website1.
This report has been structured to provide a clear overview of data collected in 2009.
Section 2: Data collection – provides details of the location of each automatic monitoring
site, the period of operation, the equipment installed and the method used to collect
data at each site.
Section 3: Compliance with UK Air Quality objective concentrations and allowed
exceedances – examines compliance with objectives at each monitoring site in 2009.
Pollutants not covered under the UK Air Quality Regulations are also discussed.
Section 4: Summary – provides a summary and draws conclusions from the reported
data.
Volume II of the report presents time series plots for pollutant concentrations recorded
at the four monitoring sites in 2009. It also contains a summary of historical data
including comparison with air quality standards and objectives, hourly data summary
statistics and traffic flows.
1 http://www.trl.co.uk/research_development/sustainability/environmental_assessment_/air_quality/air_quality_archive.htm
Client Project Report
TRL 5 RPN1446 (I)
2 Data collection
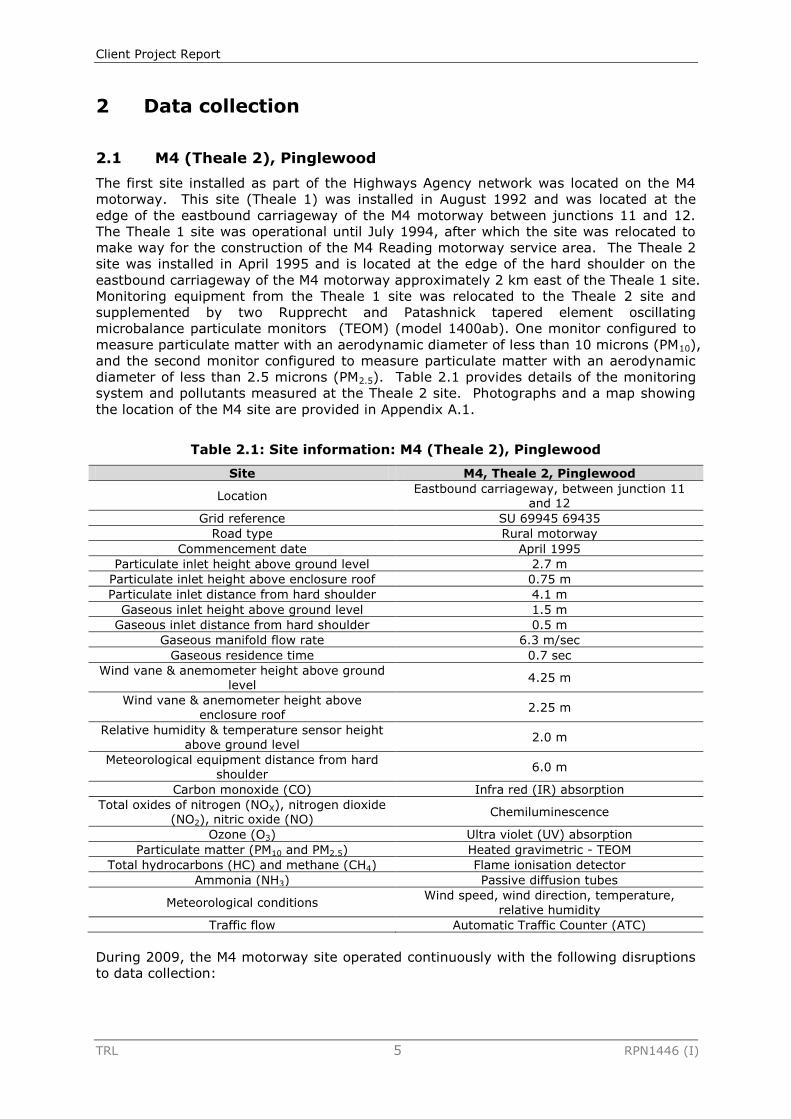
2.1 M4 (Theale 2), Pinglewood
The first site installed as part of the Highways Agency network was located on the M4
motorway. This site (Theale 1) was installed in August 1992 and was located at the
edge of the eastbound carriageway of the M4 motorway between junctions 11 and 12.
The Theale 1 site was operational until July 1994, after which the site was relocated to
make way for the construction of the M4 Reading motorway service area. The Theale 2
site was installed in April 1995 and is located at the edge of the hard shoulder on the
eastbound carriageway of the M4 motorway approximately 2 km east of the Theale 1 site.
Monitoring equipment from the Theale 1 site was relocated to the Theale 2 site and
supplemented by two Rupprecht and Patashnick tapered element oscillating
microbalance particulate monitors (TEOM) (model 1400ab). One monitor configured to
measure particulate matter with an aerodynamic diameter of less than 10 microns (PM10),
and the second monitor configured to measure particulate matter with an aerodynamic
diameter of less than 2.5 microns (PM2.5). Table 2.1 provides details of the monitoring
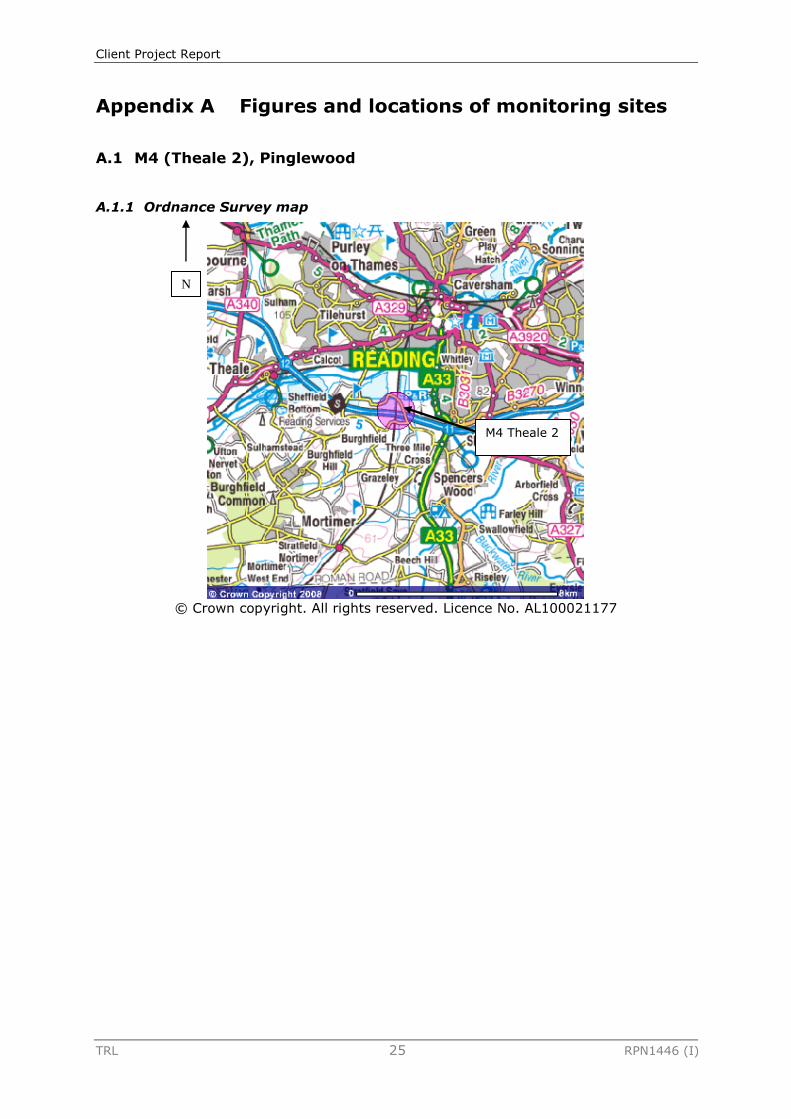
system and pollutants measured at the Theale 2 site. Photographs and a map showing
the location of the M4 site are provided in Appendix A.1.
Table 2.1: Site information: M4 (Theale 2), Pinglewood
Site M4, Theale 2, Pinglewood
Location Eastbound carriageway, between junction 11
and 12
Grid reference SU 69945 69435
Road type Rural motorway
Commencement date April 1995
Particulate inlet height above ground level 2.7 m
Particulate inlet height above enclosure roof 0.75 m
Particulate inlet distance from hard shoulder 4.1 m
Gaseous inlet height above ground level 1.5 m
Gaseous inlet distance from hard shoulder 0.5 m
Gaseous manifold flow rate 6.3 m/sec
Gaseous residence time 0.7 sec
Wind vane & anemometer height above ground level
4.25 m
Wind vane & anemometer height above enclosure roof
2.25 m
Relative humidity & temperature sensor height above ground level
2.0 m
Meteorological equipment distance from hard shoulder
6.0 m
Carbon monoxide (CO) Infra red (IR) absorption
Total oxides of nitrogen (NOX), nitrogen dioxide (NO2), nitric oxide (NO)
Chemiluminescence
Ozone (O3) Ultra violet (UV) absorption
Particulate matter (PM10 and PM2.5) Heated gravimetric - TEOM
Total hydrocarbons (HC) and methane (CH4) Flame ionisation detector
Ammonia (NH3) Passive diffusion tubes
Meteorological conditions Wind speed, wind direction, temperature,
relative humidity
Traffic flow Automatic Traffic Counter (ATC)
During 2009, the M4 motorway site operated continuously with the following disruptions
to data collection:
Client Project Report
TRL 6 RPN1446 (I)
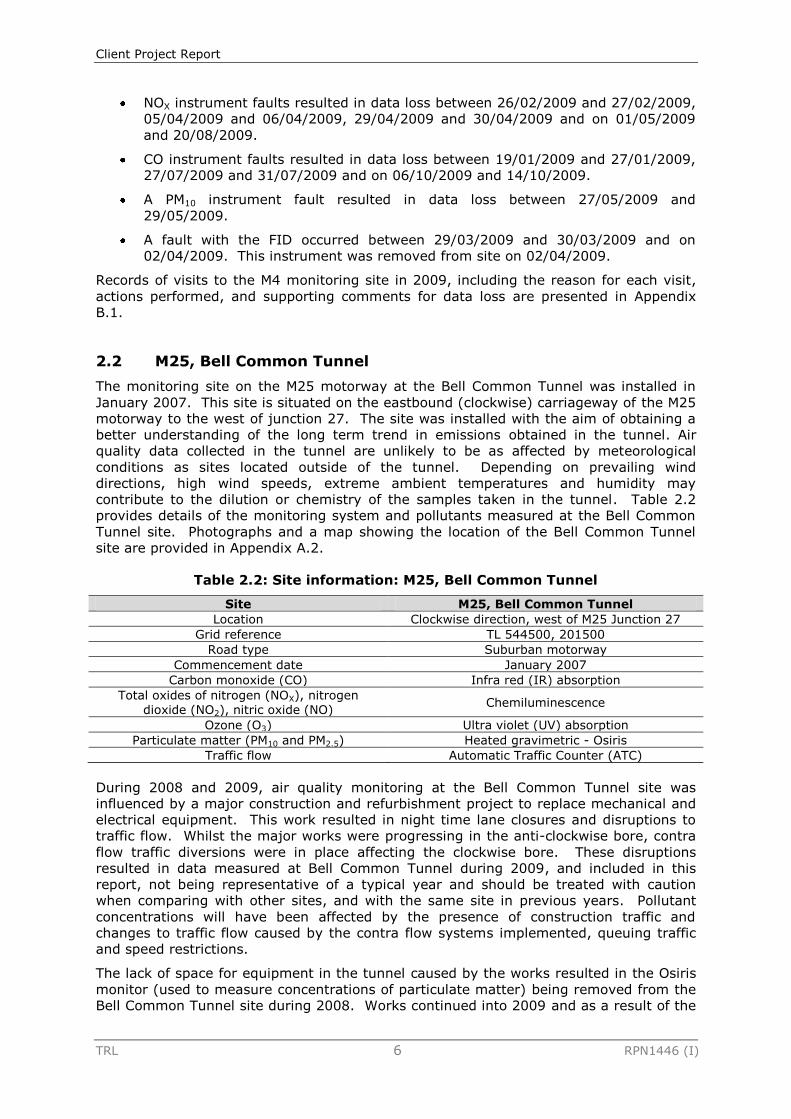
NOX instrument faults resulted in data loss between 26/02/2009 and 27/02/2009,
05/04/2009 and 06/04/2009, 29/04/2009 and 30/04/2009 and on 01/05/2009
and 20/08/2009.
CO instrument faults resulted in data loss between 19/01/2009 and 27/01/2009,
27/07/2009 and 31/07/2009 and on 06/10/2009 and 14/10/2009.
A PM10 instrument fault resulted in data loss between 27/05/2009 and
29/05/2009.
A fault with the FID occurred between 29/03/2009 and 30/03/2009 and on
02/04/2009. This instrument was removed from site on 02/04/2009.
Records of visits to the M4 monitoring site in 2009, including the reason for each visit,
actions performed, and supporting comments for data loss are presented in Appendix
B.1.
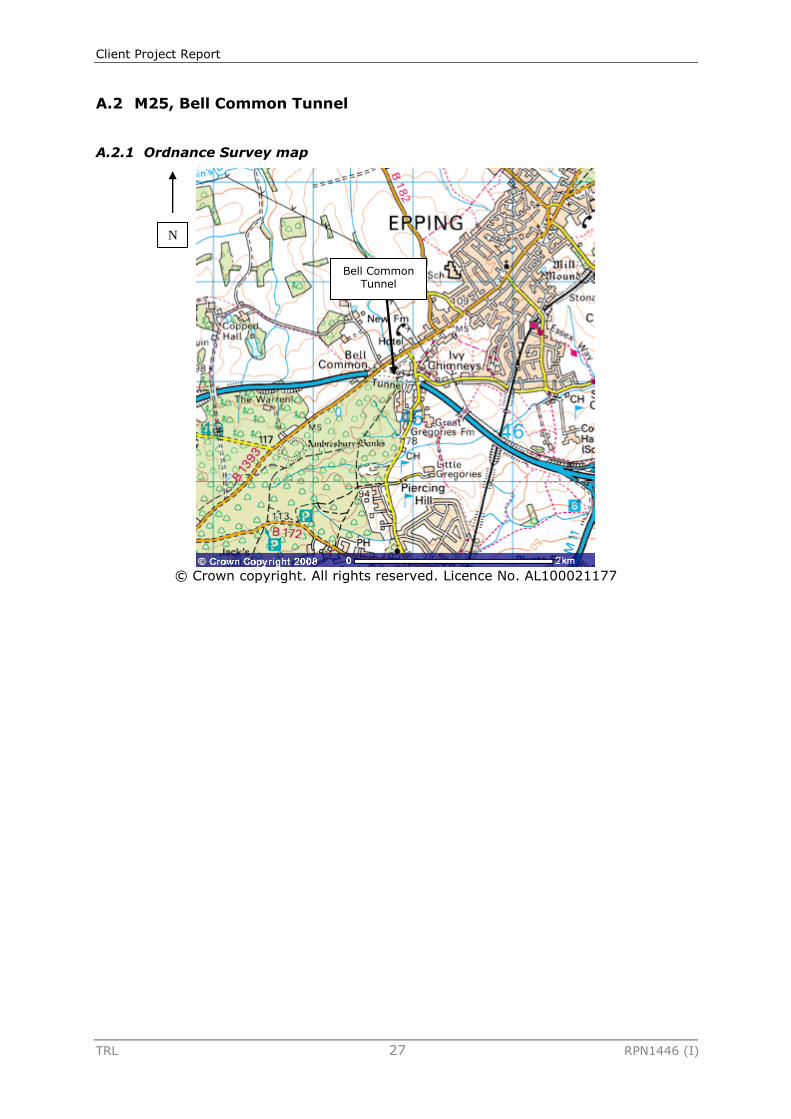
2.2 M25, Bell Common Tunnel
The monitoring site on the M25 motorway at the Bell Common Tunnel was installed in
January 2007. This site is situated on the eastbound (clockwise) carriageway of the M25
motorway to the west of junction 27. The site was installed with the aim of obtaining a
better understanding of the long term trend in emissions obtained in the tunnel. Air
quality data collected in the tunnel are unlikely to be as affected by meteorological
conditions as sites located outside of the tunnel. Depending on prevailing wind
directions, high wind speeds, extreme ambient temperatures and humidity may
contribute to the dilution or chemistry of the samples taken in the tunnel. Table 2.2
provides details of the monitoring system and pollutants measured at the Bell Common
Tunnel site. Photographs and a map showing the location of the Bell Common Tunnel
site are provided in Appendix A.2.
Table 2.2: Site information: M25, Bell Common Tunnel
Site M25, Bell Common Tunnel
Location Clockwise direction, west of M25 Junction 27
Grid reference TL 544500, 201500
Road type Suburban motorway
Commencement date January 2007
Carbon monoxide (CO) Infra red (IR) absorption
Total oxides of nitrogen (NOX), nitrogen dioxide (NO2), nitric oxide (NO)
Chemiluminescence
Ozone (O3) Ultra violet (UV) absorption
Particulate matter (PM10 and PM2.5) Heated gravimetric - Osiris
Traffic flow Automatic Traffic Counter (ATC)
During 2008 and 2009, air quality monitoring at the Bell Common Tunnel site was
influenced by a major construction and refurbishment project to replace mechanical and
electrical equipment. This work resulted in night time lane closures and disruptions to
traffic flow. Whilst the major works were progressing in the anti-clockwise bore, contra
flow traffic diversions were in place affecting the clockwise bore. These disruptions
resulted in data measured at Bell Common Tunnel during 2009, and included in this
report, not being representative of a typical year and should be treated with caution
when comparing with other sites, and with the same site in previous years. Pollutant
concentrations will have been affected by the presence of construction traffic and
changes to traffic flow caused by the contra flow systems implemented, queuing traffic
and speed restrictions.
The lack of space for equipment in the tunnel caused by the works resulted in the Osiris
monitor (used to measure concentrations of particulate matter) being removed from the
Bell Common Tunnel site during 2008. Works continued into 2009 and as a result of the
Client Project Report
TRL 7 RPN1446 (I)
walk way being removed, additional lane development, and the tunnel being used for
contra flow during the west bound bore refurbished, it was not possible to reinstall the
Osiris monitor. The major works moved into the clockwise east bound bore of the Bell
Common Tunnel on 30/09/2009. Once work commenced in the East bound bore the
location of the equipment in the access stairwell adjacent to the tunnel was subject to
significant amounts of cement dust and debris produced by the construction contractors
and demolition work. This contributing to the analysers developing ‘over temperature’
faults. The use of plastic sheeting to protect the analysers helped to reduce the amount
of dust getting into the analysers but continued to produce failures. Contractors using
the stairwell were asked to respect the equipment but the nature of equipment being
transported through the stairwell resulted in some damage to the equipment. A decision
was taken to remove the monitoring systems shortly after the 30/9/2009.
The statistics calculated from pollutant data recorded at the Bell Common Tunnel site in
2009 cover the period 01/01/2009 to 30/09/2009. To allow for comparison with air
quality standards and guidelines, period mean concentrations have been annualised such
that they can be compared against annual mean objective values. Where relevant, the
annual mean and period mean are both reported. The statistics presented in Volume II
of this report refer to annualised means to allow for comparison with historical data (this
is indicated in the text where relevant). When comparing mean concentrations recorded
in 2009 with concentrations from previous years, the effect of the tunnel works should
considered. Data reported for the Bell Common Tunnel monitoring site in 2009 do not
represent a typical year.
Up to the removal of the equipment in 2009, some disruptions to data collection resulted
from:
A NOX instrument fault between 21/07/2009 and 24/07/09.
An O3 instrument fault between 21/07/2009 and 24/07/2009.
CO instrument faults between 20/03/2009 and 07/04/2009 and 27/05/2009 and
12/08/2009.
Records of visits to the Bell Common Tunnel monitoring site in 2009, including the
reason for each visit, actions performed, and supporting comments for data loss are
presented in Appendix B.2.
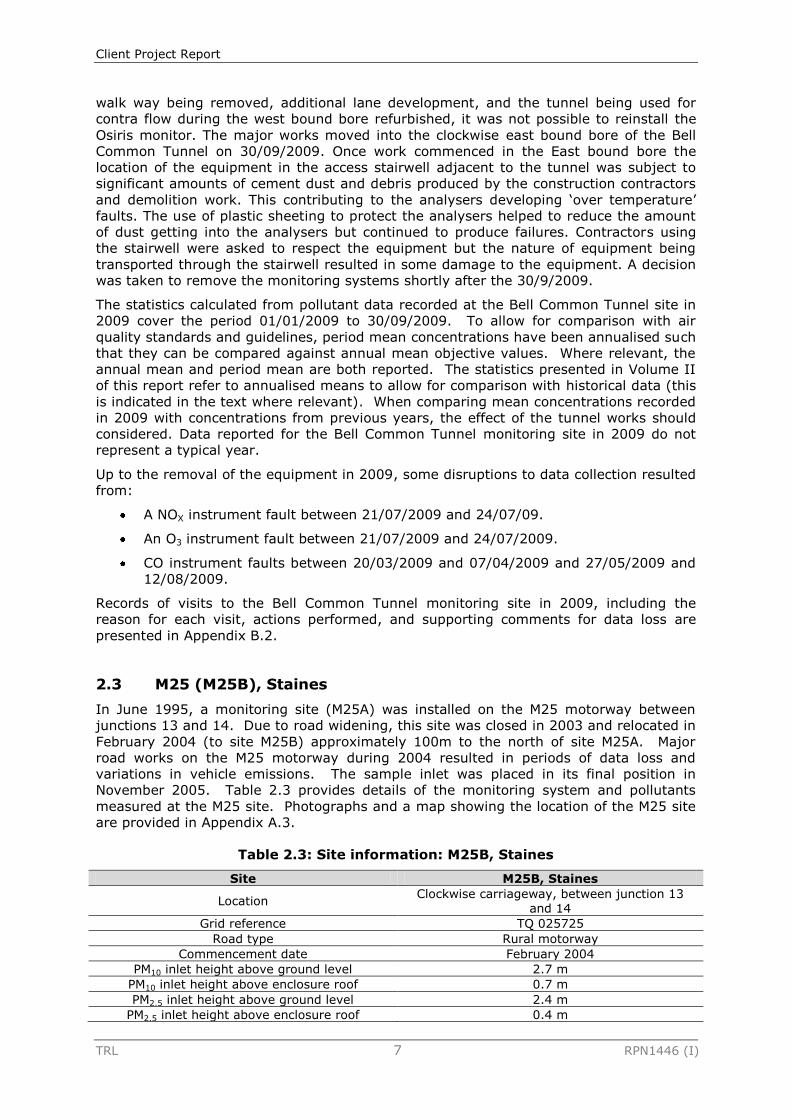
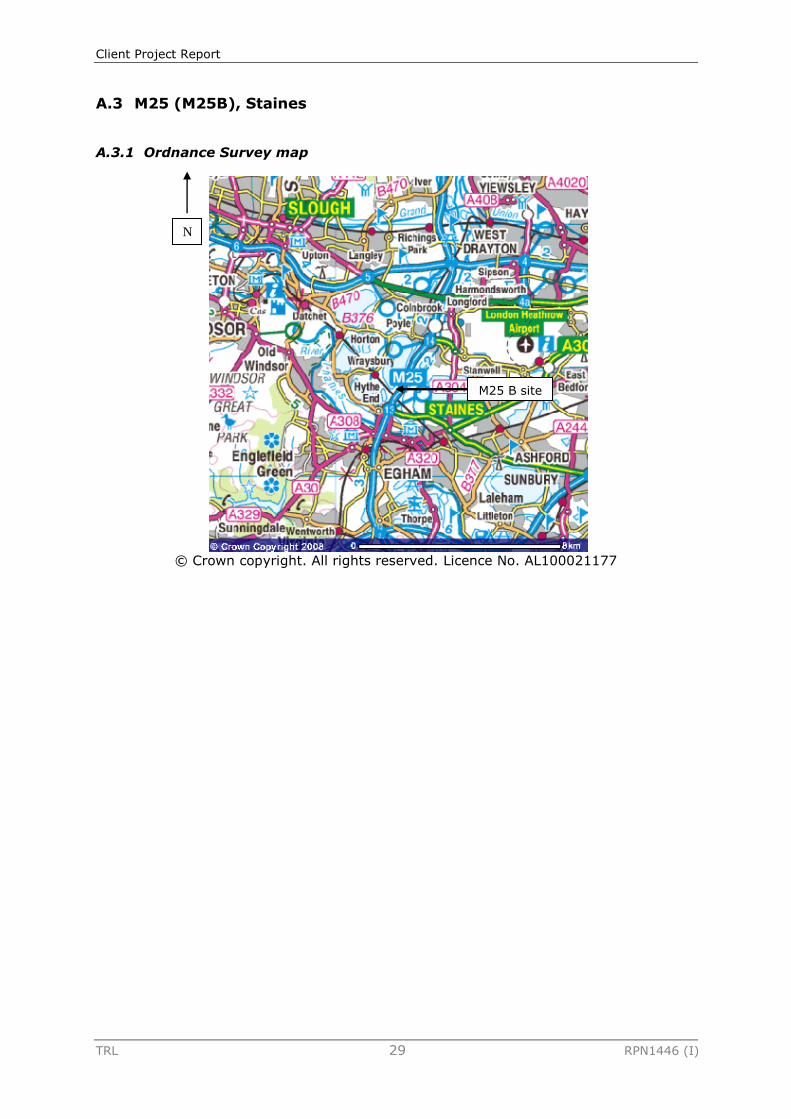
2.3 M25 (M25B), Staines
In June 1995, a monitoring site (M25A) was installed on the M25 motorway between
junctions 13 and 14. Due to road widening, this site was closed in 2003 and relocated in
February 2004 (to site M25B) approximately 100m to the north of site M25A. Major
road works on the M25 motorway during 2004 resulted in periods of data loss and
variations in vehicle emissions. The sample inlet was placed in its final position in
November 2005. Table 2.3 provides details of the monitoring system and pollutants
measured at the M25 site. Photographs and a map showing the location of the M25 site
are provided in Appendix A.3.
Table 2.3: Site information: M25B, Staines
Site M25B, Staines
Location Clockwise carriageway, between junction 13
and 14
Grid reference TQ 025725
Road type Rural motorway
Commencement date February 2004
PM10 inlet height above ground level 2.7 m
PM10 inlet height above enclosure roof 0.7 m
PM2.5 inlet height above ground level 2.4 m
PM2.5 inlet height above enclosure roof 0.4 m
Client Project Report
TRL 8 RPN1446 (I)
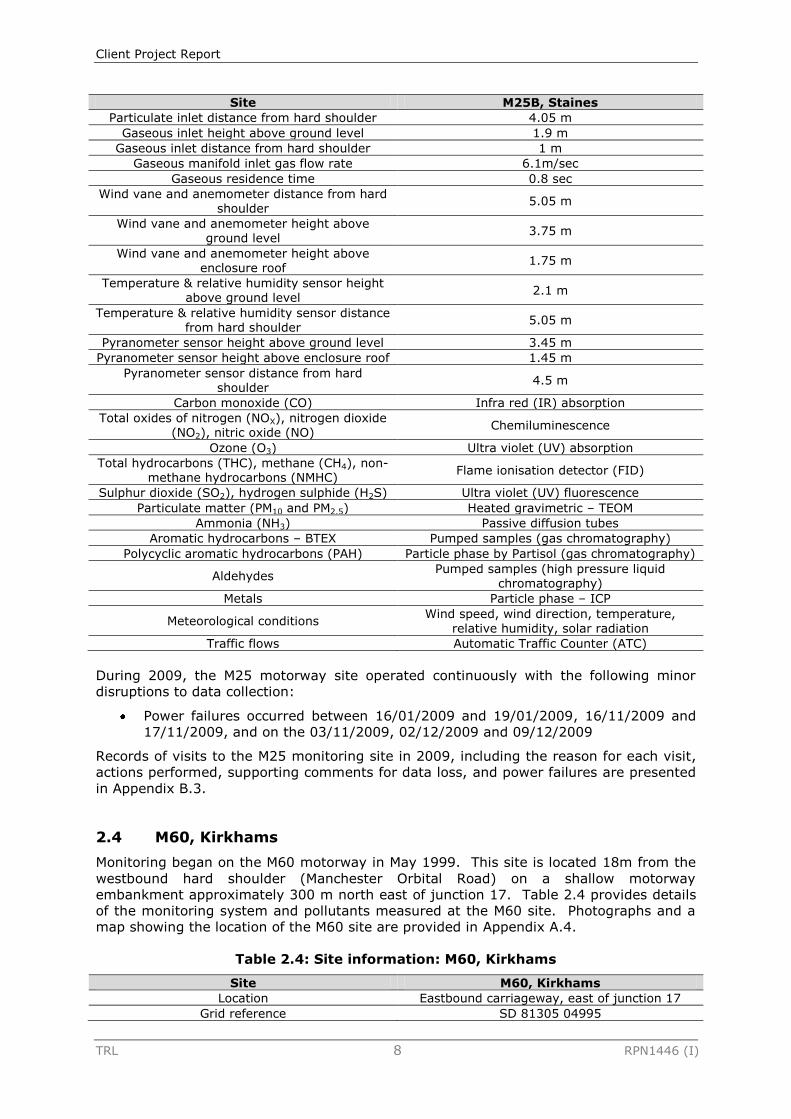
Site M25B, Staines
Particulate inlet distance from hard shoulder 4.05 m
Gaseous inlet height above ground level 1.9 m
Gaseous inlet distance from hard shoulder 1 m
Gaseous manifold inlet gas flow rate 6.1m/sec
Gaseous residence time 0.8 sec
Wind vane and anemometer distance from hard shoulder
5.05 m
Wind vane and anemometer height above ground level
3.75 m
Wind vane and anemometer height above enclosure roof
1.75 m
Temperature & relative humidity sensor height above ground level
2.1 m
Temperature & relative humidity sensor distance from hard shoulder
5.05 m
Pyranometer sensor height above ground level 3.45 m
Pyranometer sensor height above enclosure roof 1.45 m
Pyranometer sensor distance from hard shoulder
4.5 m
Carbon monoxide (CO) Infra red (IR) absorption
Total oxides of nitrogen (NOX), nitrogen dioxide (NO2), nitric oxide (NO)
Chemiluminescence
Ozone (O3) Ultra violet (UV) absorption
Total hydrocarbons (THC), methane (CH4), non-methane hydrocarbons (NMHC)
Flame ionisation detector (FID)
Sulphur dioxide (SO2), hydrogen sulphide (H2S) Ultra violet (UV) fluorescence
Particulate matter (PM10 and PM2.5) Heated gravimetric – TEOM
Ammonia (NH3) Passive diffusion tubes
Aromatic hydrocarbons – BTEX Pumped samples (gas chromatography)
Polycyclic aromatic hydrocarbons (PAH) Particle phase by Partisol (gas chromatography)
Aldehydes Pumped samples (high pressure liquid
chromatography)
Metals Particle phase – ICP
Meteorological conditions Wind speed, wind direction, temperature,
relative humidity, solar radiation
Traffic flows Automatic Traffic Counter (ATC)
During 2009, the M25 motorway site operated continuously with the following minor
disruptions to data collection:
Power failures occurred between 16/01/2009 and 19/01/2009, 16/11/2009 and
17/11/2009, and on the 03/11/2009, 02/12/2009 and 09/12/2009
Records of visits to the M25 monitoring site in 2009, including the reason for each visit,
actions performed, supporting comments for data loss, and power failures are presented
in Appendix B.3.
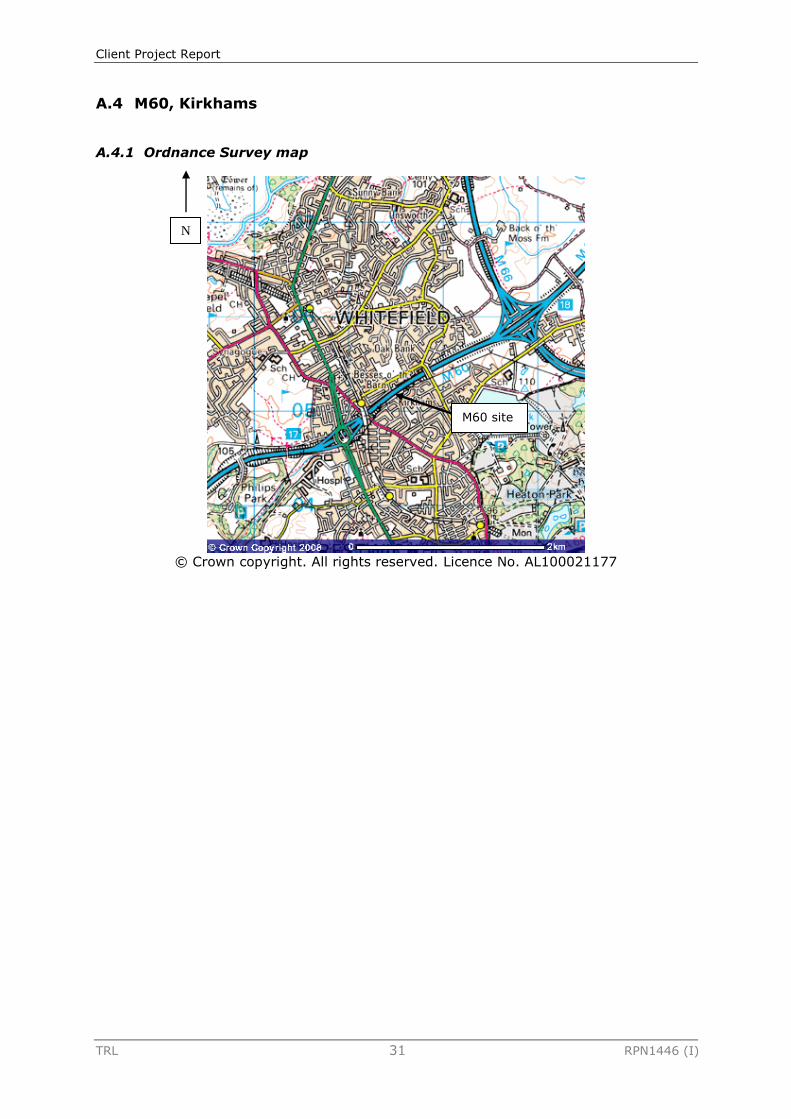
2.4 M60, Kirkhams
Monitoring began on the M60 motorway in May 1999. This site is located 18m from the
westbound hard shoulder (Manchester Orbital Road) on a shallow motorway
embankment approximately 300 m north east of junction 17. Table 2.4 provides details
of the monitoring system and pollutants measured at the M60 site. Photographs and a
map showing the location of the M60 site are provided in Appendix A.4.
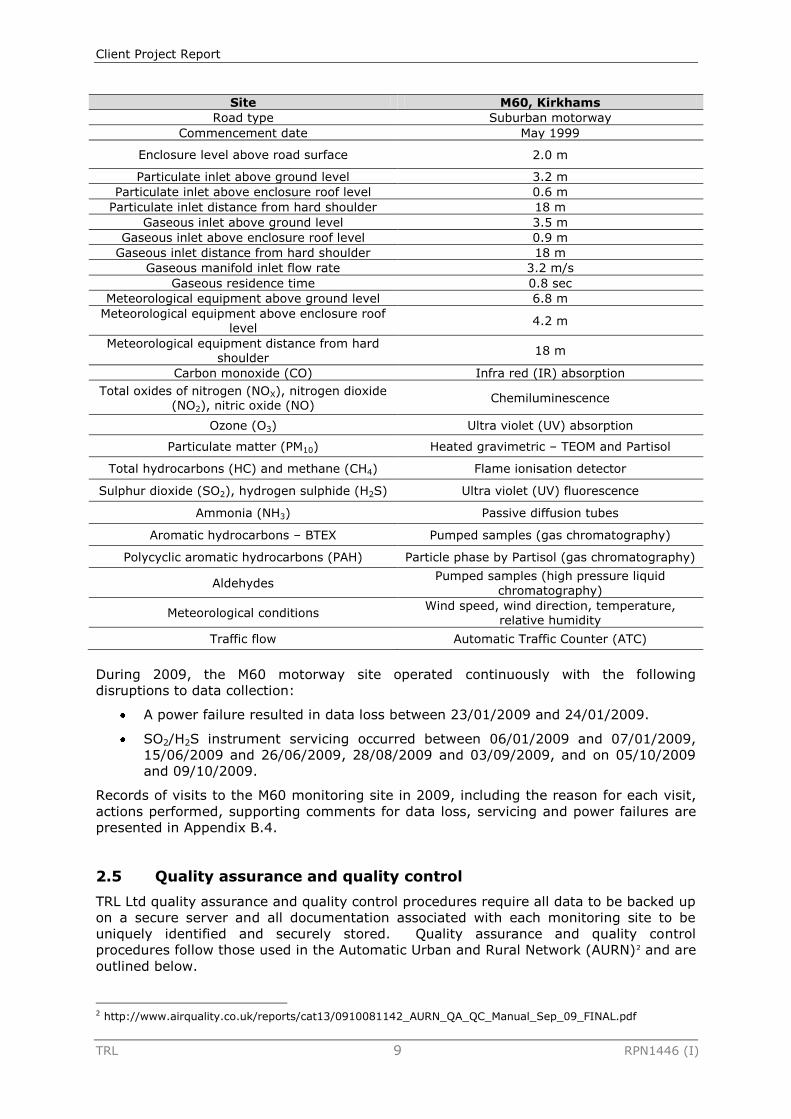
Table 2.4: Site information: M60, Kirkhams
Site M60, Kirkhams
Location Eastbound carriageway, east of junction 17
Grid reference SD 81305 04995
Client Project Report
TRL 9 RPN1446 (I)
Site M60, Kirkhams
Road type Suburban motorway
Commencement date May 1999
Enclosure level above road surface 2.0 m
Particulate inlet above ground level 3.2 m
Particulate inlet above enclosure roof level 0.6 m
Particulate inlet distance from hard shoulder 18 m
Gaseous inlet above ground level 3.5 m
Gaseous inlet above enclosure roof level 0.9 m
Gaseous inlet distance from hard shoulder 18 m
Gaseous manifold inlet flow rate 3.2 m/s
Gaseous residence time 0.8 sec
Meteorological equipment above ground level 6.8 m
Meteorological equipment above enclosure roof level
4.2 m
Meteorological equipment distance from hard shoulder
18 m
Carbon monoxide (CO) Infra red (IR) absorption
Total oxides of nitrogen (NOX), nitrogen dioxide (NO2), nitric oxide (NO)
Chemiluminescence
Ozone (O3) Ultra violet (UV) absorption
Particulate matter (PM10) Heated gravimetric – TEOM and Partisol
Total hydrocarbons (HC) and methane (CH4) Flame ionisation detector
Sulphur dioxide (SO2), hydrogen sulphide (H2S) Ultra violet (UV) fluorescence
Ammonia (NH3) Passive diffusion tubes
Aromatic hydrocarbons – BTEX Pumped samples (gas chromatography)
Polycyclic aromatic hydrocarbons (PAH) Particle phase by Partisol (gas chromatography)
Aldehydes Pumped samples (high pressure liquid
chromatography)
Meteorological conditions Wind speed, wind direction, temperature,
relative humidity
Traffic flow Automatic Traffic Counter (ATC)
During 2009, the M60 motorway site operated continuously with the following
disruptions to data collection:
A power failure resulted in data loss between 23/01/2009 and 24/01/2009.
SO2/H2S instrument servicing occurred between 06/01/2009 and 07/01/2009,
15/06/2009 and 26/06/2009, 28/08/2009 and 03/09/2009, and on 05/10/2009
and 09/10/2009.
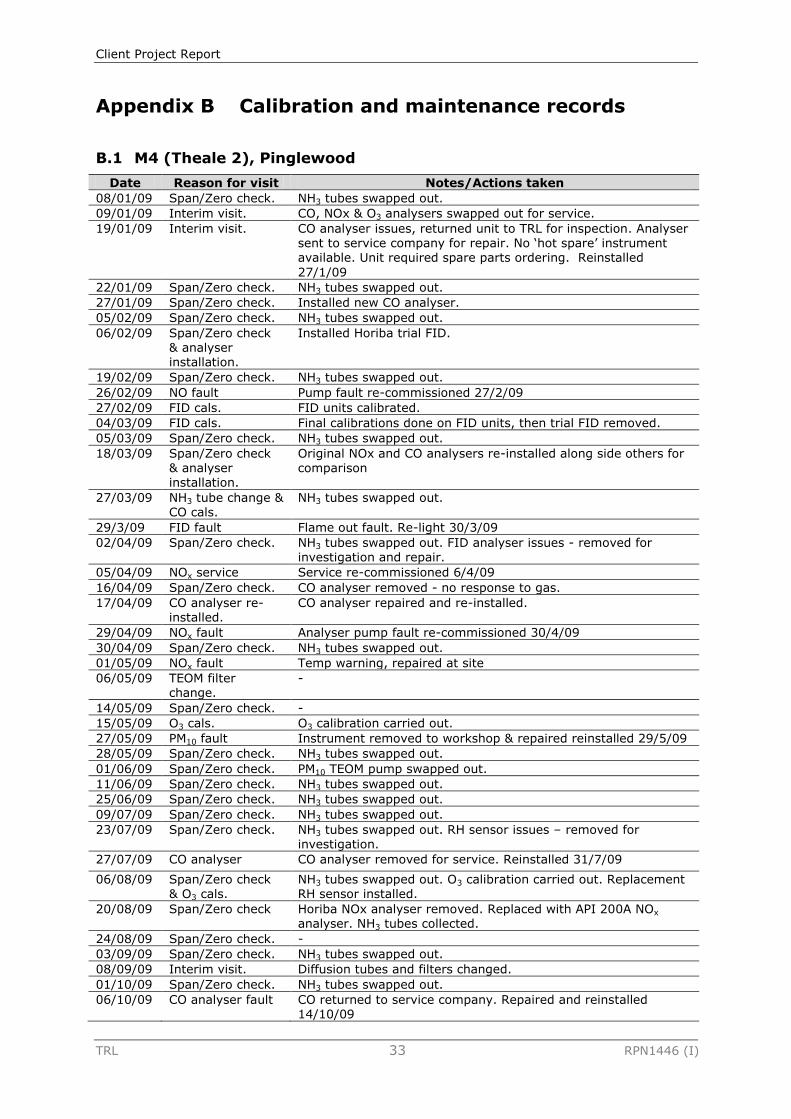
Records of visits to the M60 monitoring site in 2009, including the reason for each visit,
actions performed, supporting comments for data loss, servicing and power failures are
presented in Appendix B.4.
2.5 Quality assurance and quality control
TRL Ltd quality assurance and quality control procedures require all data to be backed up
on a secure server and all documentation associated with each monitoring site to be
uniquely identified and securely stored. Quality assurance and quality control
procedures follow those used in the Automatic Urban and Rural Network (AURN)2 and are
outlined below.
2 http://www.airquality.co.uk/reports/cat13/0910081142_AURN_QA_QC_Manual_Sep_09_FINAL.pdf
Client Project Report
TRL 10 RPN1446 (I)
2.5.1 Site visits
TRL undertakes regular site visits to calibrate the equipment at each monitoring site.
Procedures follow those outlined in the Site Operators Manual for the DEFRA AURN 3
(Automatic Urban Rural Network). Zero and span checking of the equipment were
completed on a fortnightly basis. Equipment is routinely serviced by TRL and external
contractors as required in line with manufacturer’s recommendations. Records of site
visits at each monitoring site, including the reason for each visit and actions undertaken
are presented in Appendix B.
2.5.2 Data checking
TRL central data communication and logging facility (Enview 2000) has been externally
audited by the Environment Agency. This system is used to undertake daily data
inspections during office hours. Three-day plots of data recorded at each monitoring site
are inspected for accurate date and time readings, continuous power supply, continuity
and validity of measurements and maximum and minimum data values. Any anomalies
or queries arising from the daily inspections are brought to the attention of the Project
Manager, who will initiate any necessary action (e.g. a site visit).
On a weekly basis, data collected by the management system are examined using
summary statistics and outlier analysis. Any unusual episodes are recorded and
examined over longer data periods to determine the impact on long term trends.
Exceedances of objective concentrations are cross-referenced with peaks measured at
other national monitoring sites or pollution episodes recorded by the London Air Quality
Network or sites in the DEFRA AURN where possible. Trends in the data are also
compared with other sites in the AURN.
2.5.3 Data calibration and ratification
Air pollutant data are ratified as per DEFRA AURN recommended procedures 4 . The
calibration and ratification process for automatic gas analysers corrects the raw dataset
for ‘drift’ in the zero baselines and the upper range of the instrument. The zero reading
recorded during the calibration exercise is used to adjust any offset of the baseline. The
difference between the span values obtained at two subsequent calibration visits is used
to calculate a linear scaling factor, which is applied to data collected between these two
visits. Following application of the scaling factor and adjustment of the baseline, data
are validated by visual inspection.
2.5.4 Data analysis
Statistical analysis has been carried out to allow for comparison with UK Air Quality
objective values set out by the Air Quality (England) Regulations 2000 (SI 2000 No. 928)
and the Air Quality (England) (Amendment) Regulations 2002 (SI 2002 No. 3043).
Compliance with the relevant objective has been assessed for each pollutant covered by
the Regulations (see Section 3). A number of pollutants monitored at the sites within
the Highways Agency network are not covered by the UK Air Quality Regulations. The
concentrations of these pollutants have been compared with Environment Agency
Guidelines. Although the pollutants are not covered by UK legislation, guidance values
for safe levels of human exposure exist and it is therefore considered useful to monitor
concentrations.
Statistical analysis of hourly data collected at each monitoring site has also been
undertaken. Minimum, maximum, mean and standard deviation values have been
calculated for each pollutant at each monitoring site for the year 2009. This allows for 3 http://www.airquality.co.uk/reports/empire/lsoman/lsoman.html 4 http://www.airquality.co.uk/reports/empire/lsoman/lsoman.html
Client Project Report
TRL 11 RPN1446 (I)
comparison with data collected in previous years and the analysis of long term trends in
pollutant concentrations. Data for 2009 are presented together with historical datasets
in Volume II of this report.
3 Compliance with UK Air Quality objectives and permitted exceedances
This section compares data collected at the four Highways Agency monitoring sites
operating in 2009 with UK Air Quality objective concentrations and permitted numbers of
exceedances. A summary of UK Air Quality objectives and numbers of permitted
exceedances is provided in Appendix D. It is important to note that these objectives do
not apply at the monitoring sites in the Highways Agency network as these sites are
classified as areas not accessible to the public and no relevant exposure therefore exists.
It is, however, still considered useful to compare the monitored data with these criteria.
Each pollutant covered by the UK Air Quality Regulations is discussed in turn.
Percentage capture rates for calibrated data are also provided. Concentrations of non-
regulated pollutants are also presented and discussed in comparison with guidance
values recommended by the Environment Agency5.
3.1 Nitrogen dioxide
Nitrogen dioxide (NO2) concentrations are recorded by the continuous analysers as 15-
minute means. 1-hour means have been calculated from the 15-minute data to allow
for comparison with annual average and 1-hour mean UK Air Quality objectives. Time-
series plots of hourly NO2 concentrations are presented in Volume II of this report.
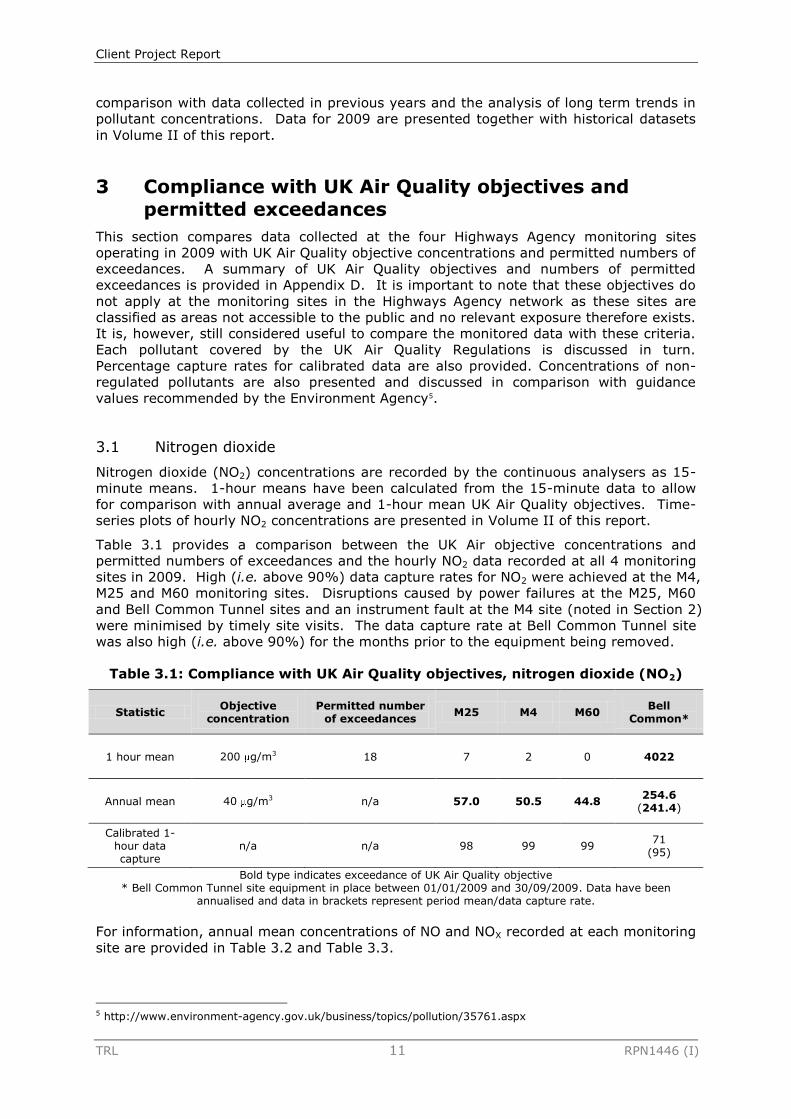
Table 3.1 provides a comparison between the UK Air objective concentrations and
permitted numbers of exceedances and the hourly NO2 data recorded at all 4 monitoring
sites in 2009. High (i.e. above 90%) data capture rates for NO2 were achieved at the M4,
M25 and M60 monitoring sites. Disruptions caused by power failures at the M25, M60
and Bell Common Tunnel sites and an instrument fault at the M4 site (noted in Section 2)
were minimised by timely site visits. The data capture rate at Bell Common Tunnel site
was also high (i.e. above 90%) for the months prior to the equipment being removed.
Table 3.1: Compliance with UK Air Quality objectives, nitrogen dioxide (NO2)
Statistic Objective
concentration Permitted number
of exceedances M25 M4 M60
Bell Common*
1 hour mean 200 g/m3 18 7 2 0 4022
Annual mean 40 g/m3 n/a 57.0 50.5 44.8 254.6
(241.4)
Calibrated 1-hour data capture
n/a n/a 98 99 99 71
(95)
Bold type indicates exceedance of UK Air Quality objective * Bell Common Tunnel site equipment in place between 01/01/2009 and 30/09/2009. Data have been
annualised and data in brackets represent period mean/data capture rate.
For information, annual mean concentrations of NO and NOX recorded at each monitoring
site are provided in Table 3.2 and Table 3.3.
5 http://www.environment-agency.gov.uk/business/topics/pollution/35761.aspx
Client Project Report
TRL 12 RPN1446 (I)
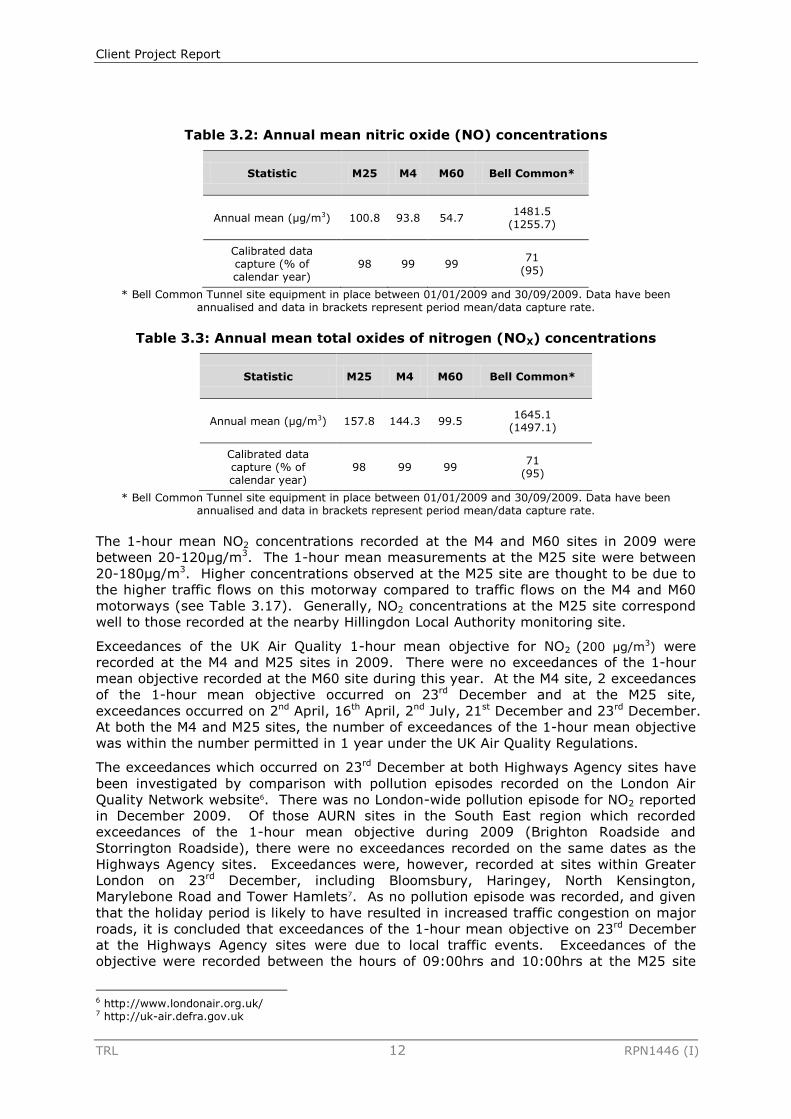
Table 3.2: Annual mean nitric oxide (NO) concentrations
Statistic M25 M4 M60 Bell Common*
Annual mean (µg/m3) 100.8 93.8 54.7 1481.5
(1255.7)
Calibrated data capture (% of calendar year)
98 99 99 71
(95)
* Bell Common Tunnel site equipment in place between 01/01/2009 and 30/09/2009. Data have been annualised and data in brackets represent period mean/data capture rate.
Table 3.3: Annual mean total oxides of nitrogen (NOX) concentrations
Statistic M25 M4 M60 Bell Common*
Annual mean (µg/m3) 157.8 144.3 99.5 1645.1
(1497.1)
Calibrated data capture (% of calendar year)
98 99 99 71
(95)
* Bell Common Tunnel site equipment in place between 01/01/2009 and 30/09/2009. Data have been annualised and data in brackets represent period mean/data capture rate.
The 1-hour mean NO2 concentrations recorded at the M4 and M60 sites in 2009 were
between 20-120µg/m3. The 1-hour mean measurements at the M25 site were between
20-180µg/m3. Higher concentrations observed at the M25 site are thought to be due to
the higher traffic flows on this motorway compared to traffic flows on the M4 and M60
motorways (see Table 3.17). Generally, NO2 concentrations at the M25 site correspond
well to those recorded at the nearby Hillingdon Local Authority monitoring site.
Exceedances of the UK Air Quality 1-hour mean objective for NO2 (200 μg/m3) were
recorded at the M4 and M25 sites in 2009. There were no exceedances of the 1-hour
mean objective recorded at the M60 site during this year. At the M4 site, 2 exceedances
of the 1-hour mean objective occurred on 23rd December and at the M25 site,
exceedances occurred on 2nd April, 16th April, 2nd July, 21st December and 23rd December.
At both the M4 and M25 sites, the number of exceedances of the 1-hour mean objective
was within the number permitted in 1 year under the UK Air Quality Regulations.
The exceedances which occurred on 23rd December at both Highways Agency sites have
been investigated by comparison with pollution episodes recorded on the London Air
Quality Network website6. There was no London-wide pollution episode for NO2 reported
in December 2009. Of those AURN sites in the South East region which recorded
exceedances of the 1-hour mean objective during 2009 (Brighton Roadside and
Storrington Roadside), there were no exceedances recorded on the same dates as the
Highways Agency sites. Exceedances were, however, recorded at sites within Greater
London on 23rd December, including Bloomsbury, Haringey, North Kensington,
Marylebone Road and Tower Hamlets7. As no pollution episode was recorded, and given
that the holiday period is likely to have resulted in increased traffic congestion on major
roads, it is concluded that exceedances of the 1-hour mean objective on 23rd December
at the Highways Agency sites were due to local traffic events. Exceedances of the
objective were recorded between the hours of 09:00hrs and 10:00hrs at the M25 site
6 http://www.londonair.org.uk/ 7 http://uk-air.defra.gov.uk
Client Project Report
TRL 13 RPN1446 (I)
and between the hours of 16:00hrs and 18:00hrs at the M4 site, which correspond to
peak traffic hours.
Other exceedances at the M25 site have also been investigated by comparison with data
from AURN sites. On the 16th April, exceedances of the 1-hour mean objective also
occurred at Camden Kerbside and London Marylebone Road sites. This date was during
the Easter holiday period and it is therefore likely that increased traffic congestion
caused these exceedances and those at the M25 site. Exceedances on 2nd April, 16th
April and 2nd July at the M25 site were recorded during peak traffic hours i.e. 16:00hrs to
18:00hrs. On 21st December, exceedances were also recorded at Tower Hamlets
roadside site and Camden kerbside site. As above, these exceedances are likely to have
been caused by traffic congestion on major roads during the holiday period.
During 2009, the annual mean NO2 objective value was exceeded at all 4 monitoring
sites. The annual means at the M4 and M60 sites were 50.5 and 44.8µg/m3 respectively,
the M25 annual mean was higher at 57.0µg/m3 and the Bell Common Tunnel annual
mean was highest at 241.4µg/m3. The higher annual mean concentration recorded at
the M25 site is supported by higher volumes of traffic using this motorway compared
with the M4 and M60 sites (see Table 3.17).
NO2 concentrations at the Bell Common Tunnel site were between 100-700µg/m3, with a
large number of exceedances of the 1-hour mean recorded at this site (see Table 3.1).
Whilst it was expected that relatively high concentrations would be recorded at this site
given that this has been observed in previous years (as a result of limited air dispersion
and dilution conditions in tunnel environments, as described in the previous year’s
monitoring report (Highways Agency, 2008)), the concentrations recorded in 2009 were
observed to be higher than those in previous years. This is likely to be due to the major
road works which resulted in a lane of contra flow traffic in the clockwise bore where the
monitoring equipment is located. Changes to traffic speeds and congestion in the
clockwise bore are likely to have resulted in increased emissions and higher pollutant
concentrations due to the limited scope for dispersion in the tunnel environment. The
presence of construction traffic in the tunnel during 2009 will also have contributed to
higher pollutant concentrations. During the road works, there were significant traffic
queues resulting in slow moving traffic through the tunnel. A large number of peaks in
pollutant concentrations occurred during rush hour traffic periods (07:00hrs to 09:00hrs
and 16:00hrs to 18:00hrs).
Concentrations of NO2 have also been compared with concentrations of ozone (O3) to
determine if peaks in NO2 occur at the same time as reductions in O3 concentrations.
This is discussed further in section 3.3.
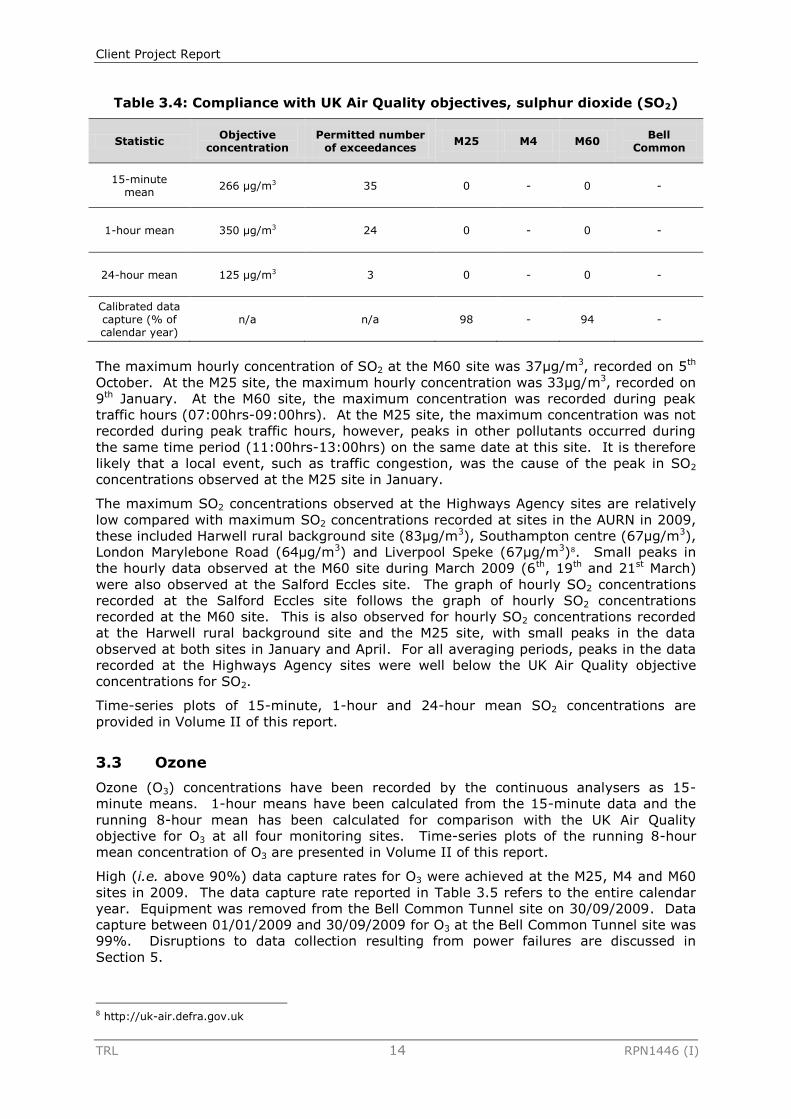
3.2 Sulphur dioxide
Sulphur dioxide (SO2) concentrations have been recorded by the continuous analysers as
15-minute means at two of the four monitoring sites: the M25 and M60 motorways. The
UK Air Quality Regulations provide three objective concentrations for SO2 (measured as
15-minute, 1-hour and 24-hour means). Table 3.4 shows that there were no
exceedances of the SO2 objectives at either monitoring site in 2009. High (i.e. above
90%) data capture rates for SO2 were achieved at both the M25 and M60 sites in 2009.
Disruptions to data collection caused by power failures at both sites and instrument
faults at the M60 site are described in Section 2 with additional details in
A.1.1.1Appendix B.
Client Project Report
TRL 14 RPN1446 (I)
Table 3.4: Compliance with UK Air Quality objectives, sulphur dioxide (SO2)
Statistic Objective
concentration Permitted number
of exceedances M25 M4 M60
Bell Common
15-minute mean
266 µg/m3 35 0 - 0 -
1-hour mean 350 µg/m3 24 0 - 0 -
24-hour mean 125 µg/m3 3 0 - 0 -
Calibrated data capture (% of calendar year)
n/a n/a 98 - 94 -
The maximum hourly concentration of SO2 at the M60 site was 37µg/m3, recorded on 5th
October. At the M25 site, the maximum hourly concentration was 33µg/m3, recorded on
9th January. At the M60 site, the maximum concentration was recorded during peak
traffic hours (07:00hrs-09:00hrs). At the M25 site, the maximum concentration was not
recorded during peak traffic hours, however, peaks in other pollutants occurred during
the same time period (11:00hrs-13:00hrs) on the same date at this site. It is therefore
likely that a local event, such as traffic congestion, was the cause of the peak in SO2
concentrations observed at the M25 site in January.
The maximum SO2 concentrations observed at the Highways Agency sites are relatively
low compared with maximum SO2 concentrations recorded at sites in the AURN in 2009,
these included Harwell rural background site (83µg/m3), Southampton centre (67µg/m3),
London Marylebone Road (64µg/m3) and Liverpool Speke (67µg/m3)8. Small peaks in
the hourly data observed at the M60 site during March 2009 (6th, 19th and 21st March)
were also observed at the Salford Eccles site. The graph of hourly SO2 concentrations
recorded at the Salford Eccles site follows the graph of hourly SO2 concentrations
recorded at the M60 site. This is also observed for hourly SO2 concentrations recorded
at the Harwell rural background site and the M25 site, with small peaks in the data
observed at both sites in January and April. For all averaging periods, peaks in the data
recorded at the Highways Agency sites were well below the UK Air Quality objective
concentrations for SO2.
Time-series plots of 15-minute, 1-hour and 24-hour mean SO2 concentrations are
provided in Volume II of this report.
3.3 Ozone
Ozone (O3) concentrations have been recorded by the continuous analysers as 15-
minute means. 1-hour means have been calculated from the 15-minute data and the
running 8-hour mean has been calculated for comparison with the UK Air Quality
objective for O3 at all four monitoring sites. Time-series plots of the running 8-hour
mean concentration of O3 are presented in Volume II of this report.
High (i.e. above 90%) data capture rates for O3 were achieved at the M25, M4 and M60
sites in 2009. The data capture rate reported in Table 3.5 refers to the entire calendar
year. Equipment was removed from the Bell Common Tunnel site on 30/09/2009. Data
capture between 01/01/2009 and 30/09/2009 for O3 at the Bell Common Tunnel site was
99%. Disruptions to data collection resulting from power failures are discussed in
Section 5.
8 http://uk-air.defra.gov.uk
Client Project Report
TRL 15 RPN1446 (I)
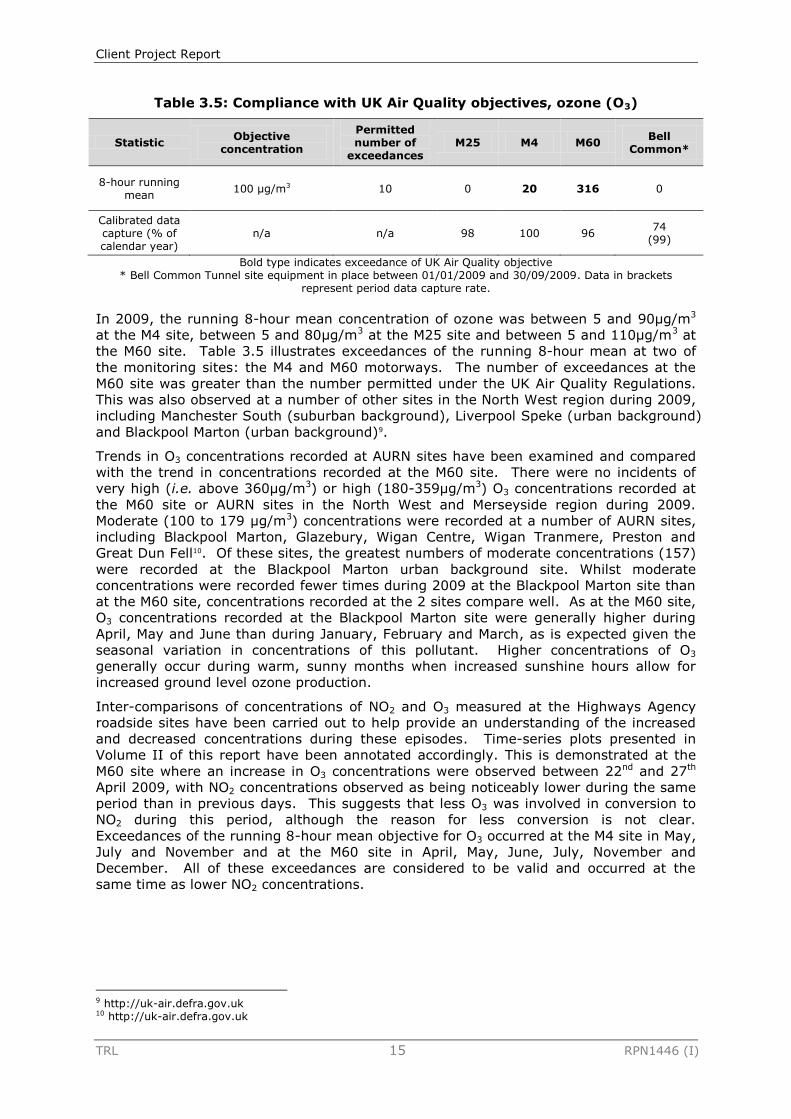
Table 3.5: Compliance with UK Air Quality objectives, ozone (O3)
Statistic Objective
concentration
Permitted number of
exceedances M25 M4 M60
Bell Common*
8-hour running mean
100 µg/m3 10 0 20 316 0
Calibrated data capture (% of calendar year)
n/a n/a 98 100 96 74
(99)
Bold type indicates exceedance of UK Air Quality objective * Bell Common Tunnel site equipment in place between 01/01/2009 and 30/09/2009. Data in brackets
represent period data capture rate.
In 2009, the running 8-hour mean concentration of ozone was between 5 and 90µg/m3
at the M4 site, between 5 and 80µg/m3 at the M25 site and between 5 and 110µg/m3 at
the M60 site. Table 3.5 illustrates exceedances of the running 8-hour mean at two of
the monitoring sites: the M4 and M60 motorways. The number of exceedances at the
M60 site was greater than the number permitted under the UK Air Quality Regulations.
This was also observed at a number of other sites in the North West region during 2009,
including Manchester South (suburban background), Liverpool Speke (urban background)
and Blackpool Marton (urban background)9.
Trends in O3 concentrations recorded at AURN sites have been examined and compared
with the trend in concentrations recorded at the M60 site. There were no incidents of
very high (i.e. above 360µg/m3) or high (180-359µg/m3) O3 concentrations recorded at
the M60 site or AURN sites in the North West and Merseyside region during 2009.
Moderate (100 to 179 µg/m3) concentrations were recorded at a number of AURN sites,
including Blackpool Marton, Glazebury, Wigan Centre, Wigan Tranmere, Preston and
Great Dun Fell10. Of these sites, the greatest numbers of moderate concentrations (157)
were recorded at the Blackpool Marton urban background site. Whilst moderate
concentrations were recorded fewer times during 2009 at the Blackpool Marton site than
at the M60 site, concentrations recorded at the 2 sites compare well. As at the M60 site,
O3 concentrations recorded at the Blackpool Marton site were generally higher during
April, May and June than during January, February and March, as is expected given the
seasonal variation in concentrations of this pollutant. Higher concentrations of O3
generally occur during warm, sunny months when increased sunshine hours allow for
increased ground level ozone production.
Inter-comparisons of concentrations of NO2 and O3 measured at the Highways Agency
roadside sites have been carried out to help provide an understanding of the increased
and decreased concentrations during these episodes. Time-series plots presented in
Volume II of this report have been annotated accordingly. This is demonstrated at the
M60 site where an increase in O3 concentrations were observed between 22nd and 27th
April 2009, with NO2 concentrations observed as being noticeably lower during the same
period than in previous days. This suggests that less O3 was involved in conversion to
NO2 during this period, although the reason for less conversion is not clear.
Exceedances of the running 8-hour mean objective for O3 occurred at the M4 site in May,
July and November and at the M60 site in April, May, June, July, November and
December. All of these exceedances are considered to be valid and occurred at the
same time as lower NO2 concentrations.
9 http://uk-air.defra.gov.uk 10 http://uk-air.defra.gov.uk
Client Project Report
TRL 16 RPN1446 (I)
3.4 Particulate Matter
Concentrations of particulate matter (PM10 and PM2.5) are recorded as 15-minute means
at each monitoring site. 1-hour and 24-hour means have been calculated from the 15-
minute data to allow for comparison with the UK Air Quality objectives for PM10 and the
proposed objectives for PM2.5.
High (i.e. above 90%) data capture rates for PM10 and PM2.5 were achieved at the M25,
M4 and M60 motorway sites. This report does not contain PM10 or PM2.5 data collected at
the Bell Common Tunnel site in 2009 because the Osiris monitor was removed in July
2008 due to lack of space in the tunnel caused by the major construction and
refurbishment programme. As mentioned previously, this work continued into 2009 and
as a result, the Osiris monitor was not re-installed.
3.4.1 PM10
As discussed in the previous monitoring report (Highways Agency, 2008) prior to
processing and ratification, the raw PM10 concentrations have been adjusted to a
gravimetric equivalent using the Volatile Correction Model (VCM) as recommended
by Defra (2009). This adjusts the TEOM data using the "purge" concentration
measured by an FDMS analyser, assuming this represents the volatile component that
has been lost. A "VCM web portal" has been established that allows this correction to be
derived from the mean of up to three, nearby FDMS analysers in the national network.
Data presented in Table 3.6 have been corrected using this method. For consistency
with previous reports, PM10 data collected by TEOM analysers have also been adjusted by
*1.3 and these statistics are presented in Volume II (Section 6) of this report. As
observed from the 2008 data, the annual means obtained from the VCM method are
lower than those obtained using TEOM *1.3.
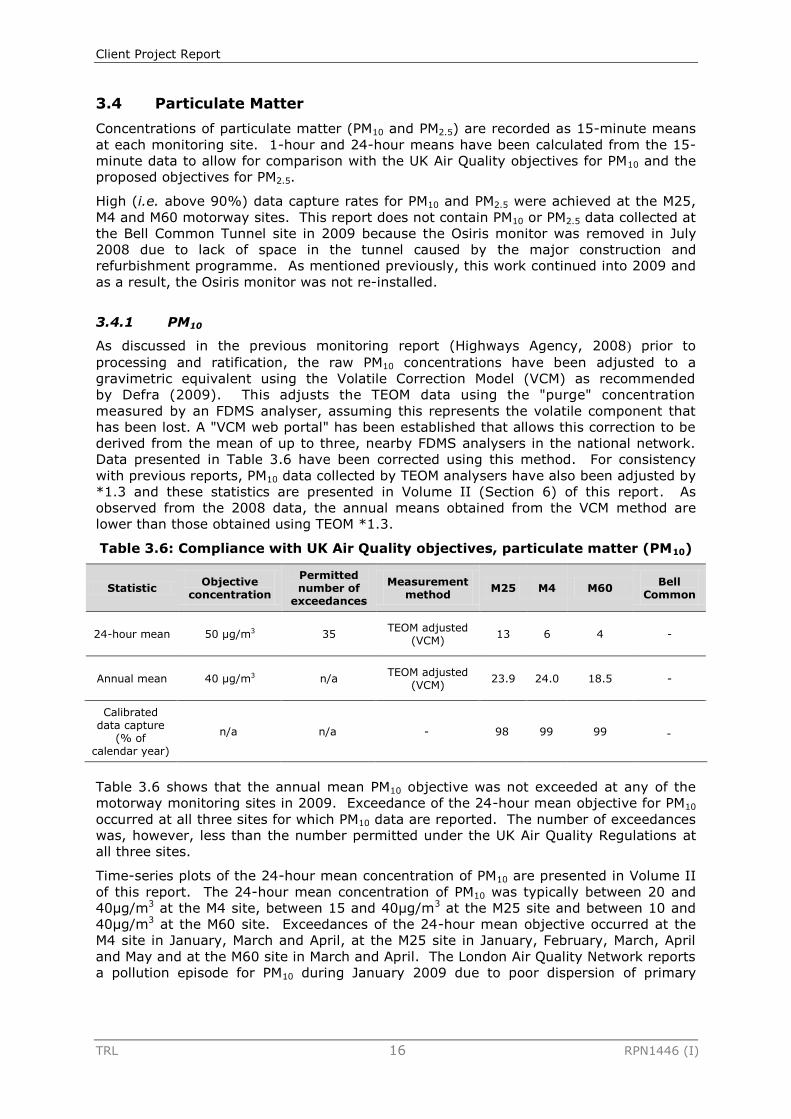
Table 3.6: Compliance with UK Air Quality objectives, particulate matter (PM10)
Statistic Objective
concentration
Permitted number of
exceedances
Measurement method
M25 M4 M60 Bell
Common
24-hour mean 50 µg/m3 35 TEOM adjusted
(VCM) 13 6 4 -
Annual mean 40 µg/m3 n/a TEOM adjusted
(VCM) 23.9 24.0 18.5 -
Calibrated data capture
(% of calendar year)
n/a n/a - 98 99 99
-
Table 3.6 shows that the annual mean PM10 objective was not exceeded at any of the
motorway monitoring sites in 2009. Exceedance of the 24-hour mean objective for PM10
occurred at all three sites for which PM10 data are reported. The number of exceedances
was, however, less than the number permitted under the UK Air Quality Regulations at
all three sites.
Time-series plots of the 24-hour mean concentration of PM10 are presented in Volume II
of this report. The 24-hour mean concentration of PM10 was typically between 20 and
40µg/m3 at the M4 site, between 15 and 40µg/m3 at the M25 site and between 10 and
40µg/m3 at the M60 site. Exceedances of the 24-hour mean objective occurred at the
M4 site in January, March and April, at the M25 site in January, February, March, April
and May and at the M60 site in March and April. The London Air Quality Network reports
a pollution episode for PM10 during January 2009 due to poor dispersion of primary
Client Project Report
TRL 17 RPN1446 (I)
pollution emissions and (to a lesser extent), the input of PM10 from continental sources11.
It is likely that this episode affected PM10 concentrations at the M4 and M25 sites in
January 2009.
The 24-hour mean concentration of PM10 recorded at the M25 site corresponds well to
data recorded at Harwell rural background site12. Concentrations at the M25 site are
typically higher, due to the significant traffic source at this site. A similar trend in
concentrations is observed. Similarly, PM10 concentrations recorded at the M60 site
correspond well to those recorded at Bury roadside. Concentrations recorded at the M60
site are, however, generally lower than those at the Bury roadside site, which could be
explained by traffic at the M60 site being more free-flowing than at Bury roadside.
The annual mean PM10 concentration recorded at the M4 site was higher than the M25
and M60 sites despite lower traffic flows along the M4 during 2009. Work on the M4
Junction 11 & Mereoak Improvement Scheme was ongoing during 2009. The air quality
monitoring site is situated outside of the control area for these works, but it is likely that
changes to traffic flow influenced vehicle emissions and concentrations recorded at the
M4 site in 2009.
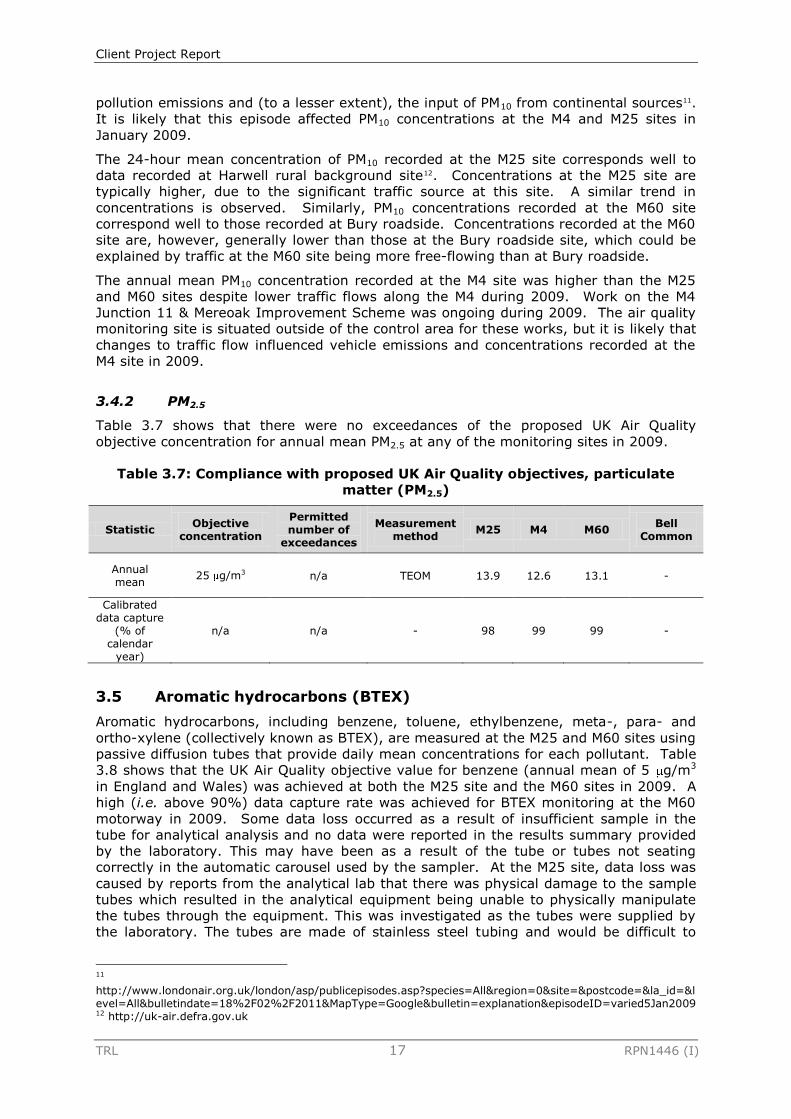
3.4.2 PM2.5
Table 3.7 shows that there were no exceedances of the proposed UK Air Quality
objective concentration for annual mean PM2.5 at any of the monitoring sites in 2009.
Table 3.7: Compliance with proposed UK Air Quality objectives, particulate
matter (PM2.5)
Statistic Objective
concentration
Permitted number of
exceedances
Measurement method
M25 M4 M60 Bell
Common
Annual mean
25 g/m3 n/a TEOM 13.9 12.6 13.1 -
Calibrated data capture
(% of calendar
year)
n/a n/a - 98 99 99 -
3.5 Aromatic hydrocarbons (BTEX)
Aromatic hydrocarbons, including benzene, toluene, ethylbenzene, meta-, para- and
ortho-xylene (collectively known as BTEX), are measured at the M25 and M60 sites using
passive diffusion tubes that provide daily mean concentrations for each pollutant. Table
3.8 shows that the UK Air Quality objective value for benzene (annual mean of 5 g/m3
in England and Wales) was achieved at both the M25 site and the M60 sites in 2009. A
high (i.e. above 90%) data capture rate was achieved for BTEX monitoring at the M60
motorway in 2009. Some data loss occurred as a result of insufficient sample in the
tube for analytical analysis and no data were reported in the results summary provided
by the laboratory. This may have been as a result of the tube or tubes not seating
correctly in the automatic carousel used by the sampler. At the M25 site, data loss was
caused by reports from the analytical lab that there was physical damage to the sample
tubes which resulted in the analytical equipment being unable to physically manipulate
the tubes through the equipment. This was investigated as the tubes were supplied by
the laboratory. The tubes are made of stainless steel tubing and would be difficult to
11 http://www.londonair.org.uk/london/asp/publicepisodes.asp?species=All®ion=0&site=&postcode=&la_id=&level=All&bulletindate=18%2F02%2F2011&MapType=Google&bulletin=explanation&episodeID=varied5Jan2009 12 http://uk-air.defra.gov.uk
Client Project Report
TRL 18 RPN1446 (I)
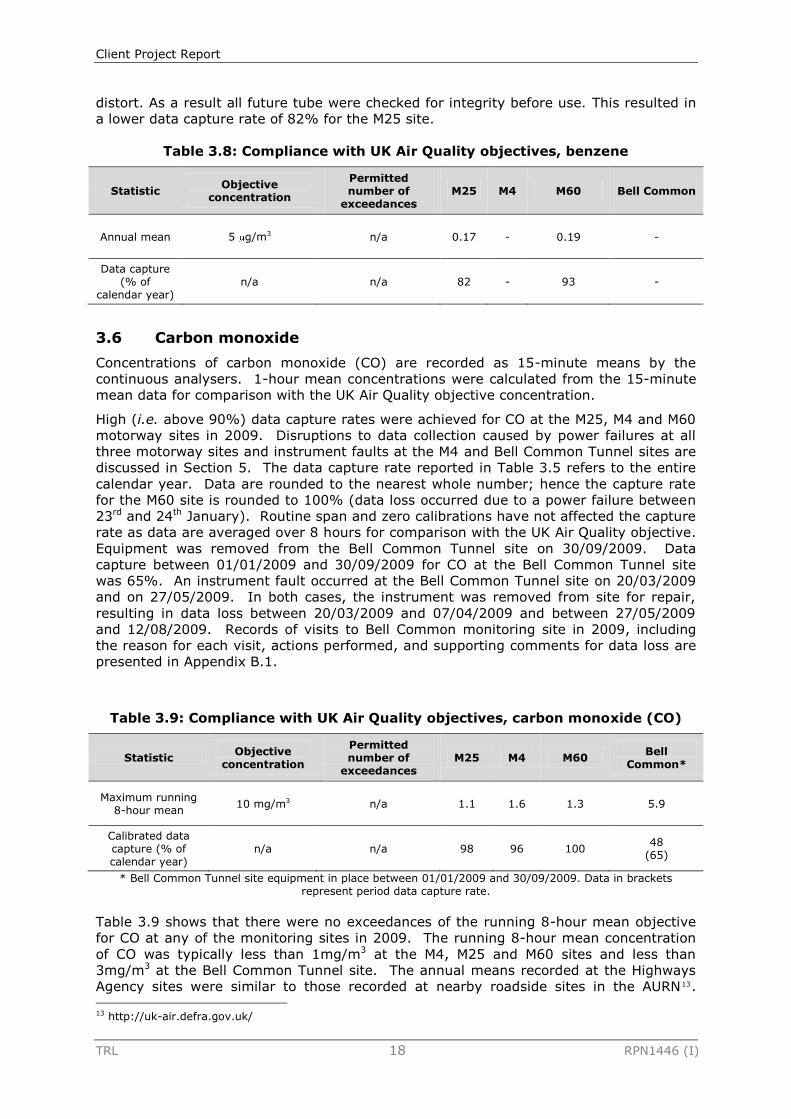
distort. As a result all future tube were checked for integrity before use. This resulted in
a lower data capture rate of 82% for the M25 site.
Table 3.8: Compliance with UK Air Quality objectives, benzene
Statistic Objective
concentration
Permitted number of
exceedances M25 M4 M60 Bell Common
Annual mean 5 g/m3 n/a 0.17 - 0.19 -
Data capture (% of
calendar year) n/a n/a 82 - 93 -
3.6 Carbon monoxide
Concentrations of carbon monoxide (CO) are recorded as 15-minute means by the
continuous analysers. 1-hour mean concentrations were calculated from the 15-minute
mean data for comparison with the UK Air Quality objective concentration.
High (i.e. above 90%) data capture rates were achieved for CO at the M25, M4 and M60
motorway sites in 2009. Disruptions to data collection caused by power failures at all
three motorway sites and instrument faults at the M4 and Bell Common Tunnel sites are
discussed in Section 5. The data capture rate reported in Table 3.5 refers to the entire
calendar year. Data are rounded to the nearest whole number; hence the capture rate
for the M60 site is rounded to 100% (data loss occurred due to a power failure between
23rd and 24th January). Routine span and zero calibrations have not affected the capture
rate as data are averaged over 8 hours for comparison with the UK Air Quality objective.
Equipment was removed from the Bell Common Tunnel site on 30/09/2009. Data
capture between 01/01/2009 and 30/09/2009 for CO at the Bell Common Tunnel site
was 65%. An instrument fault occurred at the Bell Common Tunnel site on 20/03/2009
and on 27/05/2009. In both cases, the instrument was removed from site for repair,
resulting in data loss between 20/03/2009 and 07/04/2009 and between 27/05/2009
and 12/08/2009. Records of visits to Bell Common monitoring site in 2009, including
the reason for each visit, actions performed, and supporting comments for data loss are
presented in Appendix B.1.
Table 3.9: Compliance with UK Air Quality objectives, carbon monoxide (CO)
Statistic Objective
concentration
Permitted number of
exceedances M25 M4 M60
Bell Common*
Maximum running 8-hour mean
10 mg/m3 n/a 1.1 1.6 1.3 5.9
Calibrated data capture (% of calendar year)
n/a n/a 98 96 100 48
(65)
* Bell Common Tunnel site equipment in place between 01/01/2009 and 30/09/2009. Data in brackets represent period data capture rate.
Table 3.9 shows that there were no exceedances of the running 8-hour mean objective
for CO at any of the monitoring sites in 2009. The running 8-hour mean concentration
of CO was typically less than 1mg/m3 at the M4, M25 and M60 sites and less than
3mg/m3 at the Bell Common Tunnel site. The annual means recorded at the Highways
Agency sites were similar to those recorded at nearby roadside sites in the AURN 13. 13 http://uk-air.defra.gov.uk/
Client Project Report
TRL 19 RPN1446 (I)
Annual mean concentrations of 0.3mg/m3 were recorded at both the M60 and Bury
roadside sites in 2009 and annual means of 0.4mg/m3 were recorded at both the M4 and
Cromwell Road sites in 2009. The annual mean concentration recorded at the M25 site
was slightly lower at 0.3mg/m3. These concentrations are all well below levels which are
deemed harmful to human health14.
3.7 Lead
Concentrations of selected heavy metals are monitored at the M25 motorway site. The
measurement method follows that employed on the UK Heavy Metals Monitoring
Network in line with Directive 2004/107/EC (EC, 2004). The UK Air Quality Regulations
set an objective annual mean concentration for lead equal to or less than 0.25µg/m3.
Concentrations of other heavy metals which are not covered by the UK Air Quality
Regulations are discussed in Section 3.8.5.
The annual mean concentration of lead recorded at the M25 site in 2009 was below the
UK Air Quality objective. A high (i.e. above 90%) data capture rate was achieved for
lead monitoring in 2009.
Table 3.10: Compliance with UK Air Quality objectives, lead
Statistic Objective
concentration Permitted number
of exceedances M25 M4 M60 Bell Common
Annual mean 0.25 g/m3 n/a 0.0079 - - -
Data capture (% of calendar year)
n/a n/a 100 - - -
3.8 Pollutants not covered by the UK Air Quality Regulations
3.8.1 Polycyclic aromatic hydrocarbons
Polycyclic aromatic hydrocarbons (PAH) monitoring in the Highways Agency network
began in 2003 at the M25 site and in 2004 at the M60 site. Benzo[a]pyrene (B[a]P) is
the compound that is considered to be representative for the cancer risk associated with
the whole PAH mixture (EPAQS, 1999). An annual mean concentration for B[a]P of 0.25
ng/m3 is the value listed in the UK Air Quality Strategy (Defra, 2007) as an objective for
PAH. This pollutant is not, however, covered by EU Daughter Directives on Air Quality
and is not therefore transposed into UK law through the UK Air Quality Regulations.
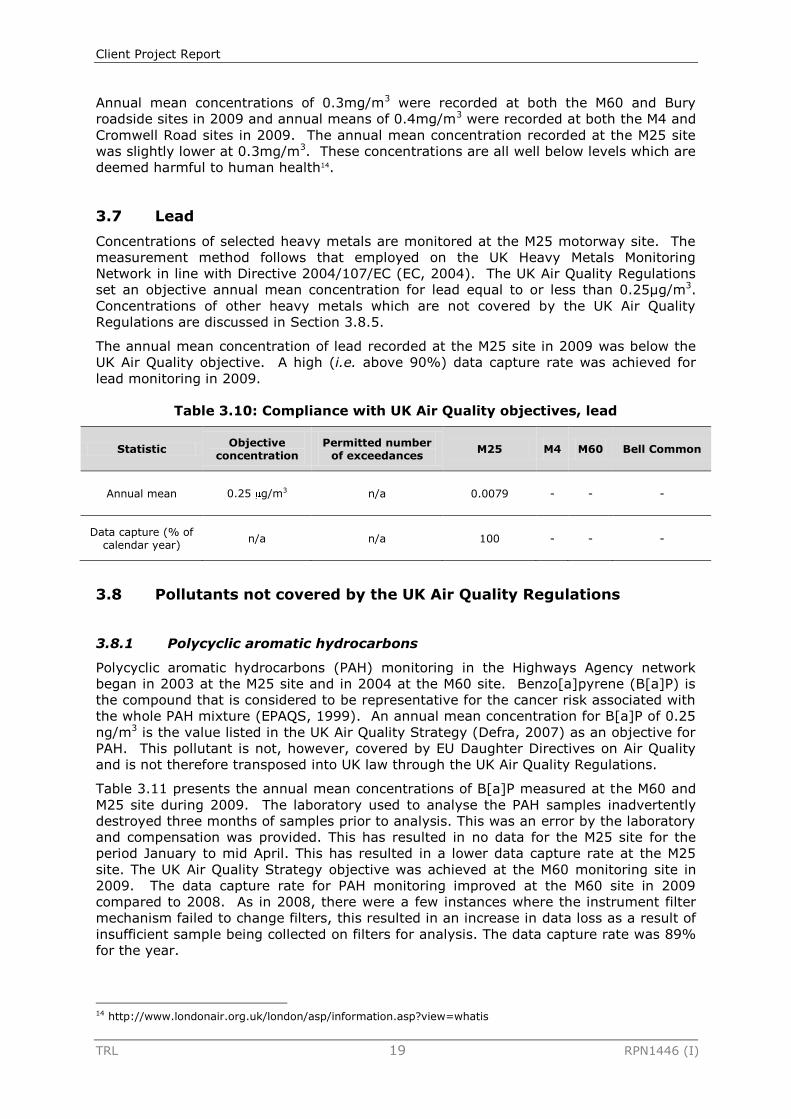
Table 3.11 presents the annual mean concentrations of B[a]P measured at the M60 and
M25 site during 2009. The laboratory used to analyse the PAH samples inadvertently
destroyed three months of samples prior to analysis. This was an error by the laboratory
and compensation was provided. This has resulted in no data for the M25 site for the
period January to mid April. This has resulted in a lower data capture rate at the M25
site. The UK Air Quality Strategy objective was achieved at the M60 monitoring site in
2009. The data capture rate for PAH monitoring improved at the M60 site in 2009
compared to 2008. As in 2008, there were a few instances where the instrument filter
mechanism failed to change filters, this resulted in an increase in data loss as a result of
insufficient sample being collected on filters for analysis. The data capture rate was 89%
for the year.
14 http://www.londonair.org.uk/london/asp/information.asp?view=whatis
Client Project Report
TRL 20 RPN1446 (I)
Table 3.11: Comparison with UK Air Quality Strategy objective, benzo[a]pyrene
(B[a]P)
Statistic Objective
concentration M25 M4 M60
Bell Common
Annual mean 0.25 ng/m3 0.16 - 0.19 -
Data capture (% of calendar year)
n/a 60 - 89 -
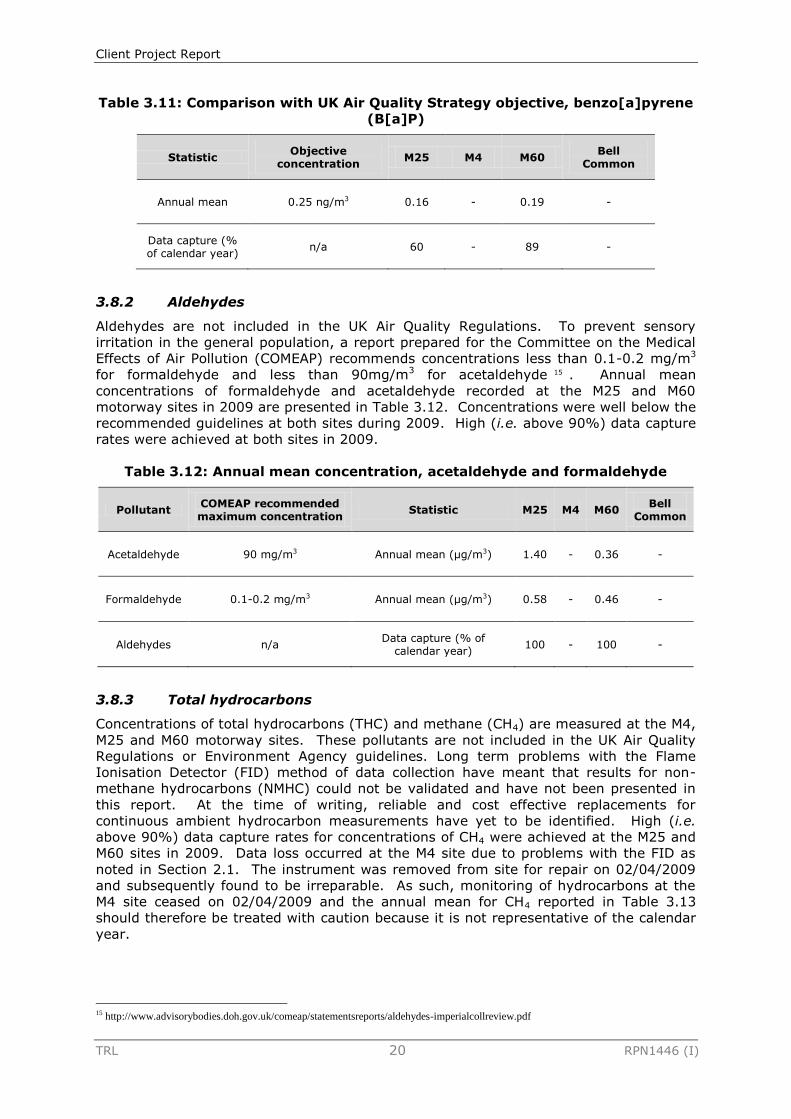
3.8.2 Aldehydes
Aldehydes are not included in the UK Air Quality Regulations. To prevent sensory
irritation in the general population, a report prepared for the Committee on the Medical
Effects of Air Pollution (COMEAP) recommends concentrations less than 0.1-0.2 mg/m3
for formaldehyde and less than 90mg/m3 for acetaldehyde 15 . Annual mean
concentrations of formaldehyde and acetaldehyde recorded at the M25 and M60
motorway sites in 2009 are presented in Table 3.12. Concentrations were well below the
recommended guidelines at both sites during 2009. High (i.e. above 90%) data capture
rates were achieved at both sites in 2009.
Table 3.12: Annual mean concentration, acetaldehyde and formaldehyde
Pollutant COMEAP recommended maximum concentration
Statistic M25 M4 M60 Bell
Common
Acetaldehyde 90 mg/m3 Annual mean (µg/m3) 1.40 - 0.36 -
Formaldehyde 0.1-0.2 mg/m3 Annual mean (µg/m3) 0.58 - 0.46 -
Aldehydes n/a Data capture (% of
calendar year) 100 - 100 -
3.8.3 Total hydrocarbons
Concentrations of total hydrocarbons (THC) and methane (CH4) are measured at the M4,
M25 and M60 motorway sites. These pollutants are not included in the UK Air Quality
Regulations or Environment Agency guidelines. Long term problems with the Flame
Ionisation Detector (FID) method of data collection have meant that results for non-
methane hydrocarbons (NMHC) could not be validated and have not been presented in
this report. At the time of writing, reliable and cost effective replacements for
continuous ambient hydrocarbon measurements have yet to be identified. High (i.e.
above 90%) data capture rates for concentrations of CH4 were achieved at the M25 and
M60 sites in 2009. Data loss occurred at the M4 site due to problems with the FID as
noted in Section 2.1. The instrument was removed from site for repair on 02/04/2009
and subsequently found to be irreparable. As such, monitoring of hydrocarbons at the
M4 site ceased on 02/04/2009 and the annual mean for CH4 reported in Table 3.13
should therefore be treated with caution because it is not representative of the calendar
year.
15 http://www.advisorybodies.doh.gov.uk/comeap/statementsreports/aldehydes-imperialcollreview.pdf
Client Project Report
TRL 21 RPN1446 (I)
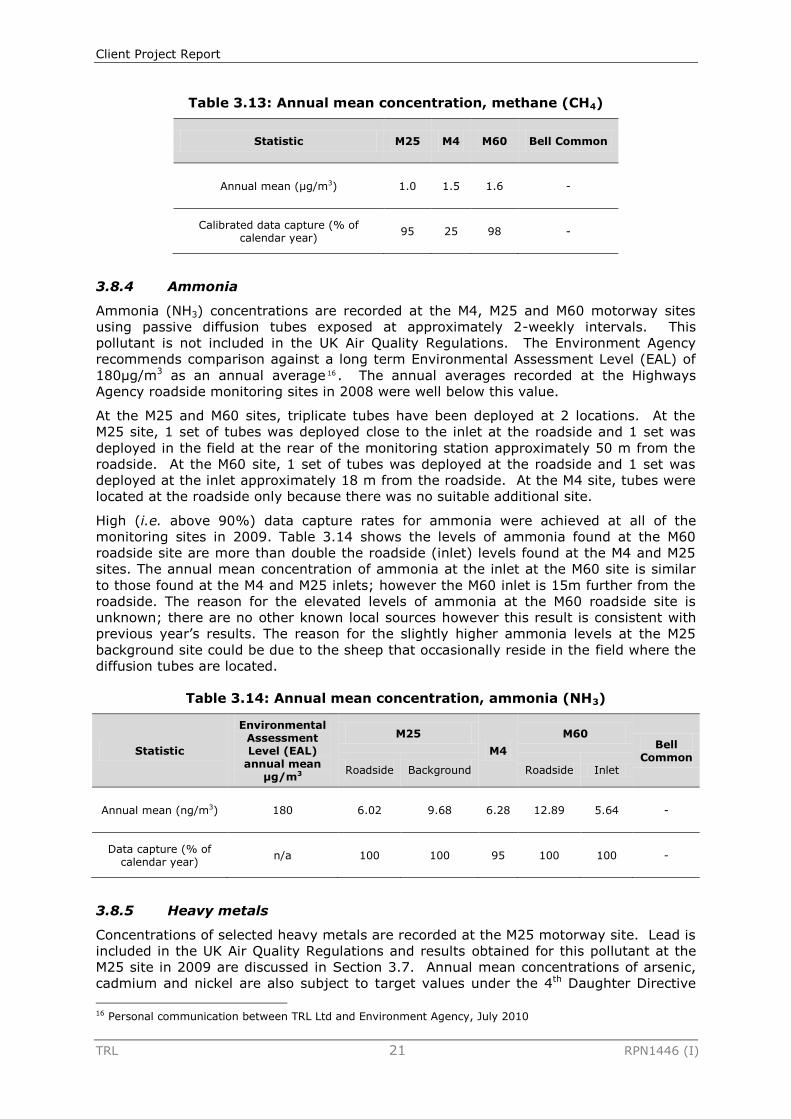
Table 3.13: Annual mean concentration, methane (CH4)
Statistic M25 M4 M60 Bell Common
Annual mean (µg/m3) 1.0 1.5 1.6 -
Calibrated data capture (% of calendar year)
95 25 98 -
3.8.4 Ammonia
Ammonia (NH3) concentrations are recorded at the M4, M25 and M60 motorway sites
using passive diffusion tubes exposed at approximately 2-weekly intervals. This
pollutant is not included in the UK Air Quality Regulations. The Environment Agency
recommends comparison against a long term Environmental Assessment Level (EAL) of
180µg/m3 as an annual average 16 . The annual averages recorded at the Highways
Agency roadside monitoring sites in 2008 were well below this value.
At the M25 and M60 sites, triplicate tubes have been deployed at 2 locations. At the
M25 site, 1 set of tubes was deployed close to the inlet at the roadside and 1 set was
deployed in the field at the rear of the monitoring station approximately 50 m from the
roadside. At the M60 site, 1 set of tubes was deployed at the roadside and 1 set was
deployed at the inlet approximately 18 m from the roadside. At the M4 site, tubes were
located at the roadside only because there was no suitable additional site.
High (i.e. above 90%) data capture rates for ammonia were achieved at all of the
monitoring sites in 2009. Table 3.14 shows the levels of ammonia found at the M60
roadside site are more than double the roadside (inlet) levels found at the M4 and M25
sites. The annual mean concentration of ammonia at the inlet at the M60 site is similar
to those found at the M4 and M25 inlets; however the M60 inlet is 15m further from the
roadside. The reason for the elevated levels of ammonia at the M60 roadside site is
unknown; there are no other known local sources however this result is consistent with
previous year’s results. The reason for the slightly higher ammonia levels at the M25
background site could be due to the sheep that occasionally reside in the field where the
diffusion tubes are located.
Table 3.14: Annual mean concentration, ammonia (NH3)
Statistic
Environmental Assessment Level (EAL)
annual mean µg/m3
M25
M4
M60 Bell
Common Roadside Background Roadside Inlet
Annual mean (ng/m3) 180 6.02 9.68 6.28 12.89 5.64 -
Data capture (% of calendar year)
n/a 100 100 95 100 100 -
3.8.5 Heavy metals
Concentrations of selected heavy metals are recorded at the M25 motorway site. Lead is
included in the UK Air Quality Regulations and results obtained for this pollutant at the
M25 site in 2009 are discussed in Section 3.7. Annual mean concentrations of arsenic,
cadmium and nickel are also subject to target values under the 4th Daughter Directive
16 Personal communication between TRL Ltd and Environment Agency, July 2010
Client Project Report
TRL 22 RPN1446 (I)
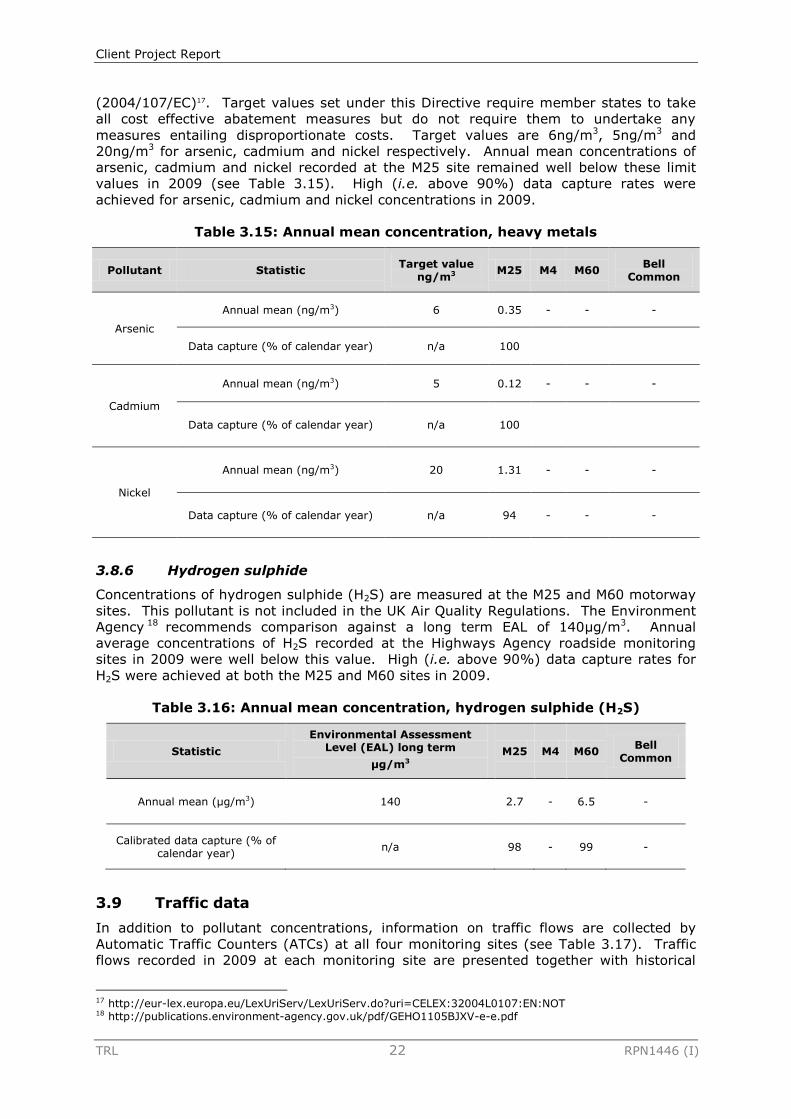
(2004/107/EC)17. Target values set under this Directive require member states to take
all cost effective abatement measures but do not require them to undertake any
measures entailing disproportionate costs. Target values are 6ng/m3, 5ng/m3 and
20ng/m3 for arsenic, cadmium and nickel respectively. Annual mean concentrations of
arsenic, cadmium and nickel recorded at the M25 site remained well below these limit
values in 2009 (see Table 3.15). High (i.e. above 90%) data capture rates were
achieved for arsenic, cadmium and nickel concentrations in 2009.
Table 3.15: Annual mean concentration, heavy metals
Pollutant Statistic Target value
ng/m3 M25 M4 M60
Bell Common
Arsenic
Annual mean (ng/m3) 6 0.35 - - -
Data capture (% of calendar year) n/a 100
Cadmium
Annual mean (ng/m3) 5 0.12 - - -
Data capture (% of calendar year) n/a 100
Nickel
Annual mean (ng/m3) 20 1.31 - - -
Data capture (% of calendar year) n/a 94 - - -
3.8.6 Hydrogen sulphide
Concentrations of hydrogen sulphide (H2S) are measured at the M25 and M60 motorway
sites. This pollutant is not included in the UK Air Quality Regulations. The Environment
Agency 18 recommends comparison against a long term EAL of 140µg/m3. Annual
average concentrations of H2S recorded at the Highways Agency roadside monitoring
sites in 2009 were well below this value. High (i.e. above 90%) data capture rates for
H2S were achieved at both the M25 and M60 sites in 2009.
Table 3.16: Annual mean concentration, hydrogen sulphide (H2S)
Statistic
Environmental Assessment Level (EAL) long term
µg/m3 M25 M4 M60
Bell Common
Annual mean (µg/m3) 140 2.7 - 6.5 -
Calibrated data capture (% of calendar year)
n/a 98 - 99 -
3.9 Traffic data
In addition to pollutant concentrations, information on traffic flows are collected by
Automatic Traffic Counters (ATCs) at all four monitoring sites (see Table 3.17). Traffic
flows recorded in 2009 at each monitoring site are presented together with historical
17 http://eur-lex.europa.eu/LexUriServ/LexUriServ.do?uri=CELEX:32004L0107:EN:NOT 18 http://publications.environment-agency.gov.uk/pdf/GEHO1105BJXV-e-e.pdf
Client Project Report
TRL 23 RPN1446 (I)
datasets in Volume II. Data for the Bell Common Tunnel site were not available during
the tunnel refurbishment in 2009.
Table 3.17: Annual average daily and hourly traffic flow
Statistic M25 M4 M60 Bell Common■
Annual average daily traffic flow CW* 99969 EB* 54965
WB* 53551
CW 80186
ACW 79080 -
ACW* 100814
Annual average vehicles per hour CW 4165 EB 2290
WB 2231
CW 3341
ACW 3295 -
ACW 4201
Data capture (% of calendar year) CW 83 EB 71
WB 70
CW 73
ACW 69 -
ACW 89
CW: clockwise; ACW: anti-clockwise; EB: Eastbound; WB: Westbound ■Bell Common Tunnel: data unavailable
4 Summary
This report provides a summary of air pollutant concentrations, meteorological data and
traffic flows measured at four motorway sites during the calendar year 2009 as part of
the Highways Agency long term roadside monitoring network.
The report compares concentrations of pollutants with objectives set out by the UK Air
Quality Regulations. The following exceedances have been recorded during 2009:
The annual mean NO2 objective concentration of 40µg/m3 was exceeded at all
four monitoring sites.
The 1-hour mean NO2 objective concentration of 200µg/m3 was exceeded at the
Bell Common Tunnel site.
Exceedances of the running 8-hour mean O3 objective of 100µg/m3 occurred at
the M4 and M60 sites.
There were no exceedances of the relevant objectives for SO2, PM2.5, PAH,
benzene, CO or lead recorded at any of the monitoring sites.
Data recorded at the Bell Common Tunnel site in 2009 were affected by a major road
works programme involving refurbishment and construction works inside the tunnel
bores. These works resulted in higher concentrations of NO2 and a higher number of
exceedances of the 1-hour mean objective concentration than has been observed in
previous years at this site. The impact of the works on traffic flows and the presence of
construction traffic must be taken into account when analysing pollutant trends at this
site and when comparing with concentrations recorded at other monitoring sites.
Concentrations of pollutants which are not covered by the UK Air Quality Regulations are
reported and discussed with reference to Environment Agency guidelines or other health
standards where applicable.
There were no exceedances of Environmental Assessment Level guideline values
for NH3 or H2S observed at the Highways Agency monitoring sites in 2009.
There were no exceedances of target values for heavy metals (arsenic, cadmium
and nickel) recorded at the M25 site in 2009.
There were no exceedances of the COMEAP recommended maximum exposure
value for aldehydes (acetaldehyde and formaldehyde) recorded at the Highways
Agency sites in 2009.
Client Project Report
TRL 24 RPN1446 (I)
References
Air Quality (England) Regulations 2000. Statutory Instrument 2000 No. 928.
http://www.opsi.gov.uk/si/si2000/20000928.htm
Air Quality (England) (Amendment) Regulations 2002. Statutory Instrument 2002. No.
3043. http://www.opsi.gov.uk/si/si2002/20023043.htm
Defra (2007). The Air Quality Strategy for England, Scotland, Wales and Northern
Ireland: July 2007, Cm 7169 NIA 61/07-07. Department for Environment, Food and
Rural Affairs, the Scottish Executive, Welsh Assembly Government and the Department
of the Environment for Northern Ireland. The Stationary Office, London.
EC (2004). Directive 2004/107/EC of the European Parliament and of the Council relating
to arsenic, cadmium, mercury, nickel and polycyclic aromatic hydrocarbons in ambient
air.
EPAQS (1999). Polycyclic aromatic hydrocarbons. Expert Panel on Air Quality Standards.
Report for the former Department of the Environment, Transport and the Regions. DETR,
London.
Highways Agency (2005). Impact of reduced emissions on air quality: the monitoring of
aromatics and aldehydes 1995 to 2003. TRL report UPR SEA/02/05. TRL, Wokingham.
Highways Agency (2007). The Highways Agency roadside air pollution monitoring
network 2005. TRL report PPR192. TRL, Wokingham.
Highways Agency (ITS Leeds), (2008). The Highways Agency roadside air pollution
monitoring network 2006. TRL report PPR371. TRL, Wokingham.
Highways Agency (2004). The Highways Agency roadside air pollution monitoring
network 2002. TRL report UPR SE/020/04. TRL, Crowthorne.
Highways Agency (2003). The Highways Agency roadside air pollution monitoring
network 1992 to 2001. TRL report PR SE/742/03. TRL, Crowthorne.
Highways Agency (2005). The Highways Agency roadside air pollution monitoring
network 2003. TRL report UPR SE/145/04. TRL, Wokingham.
Highways Agency (2010). The Highways Agency roadside air pollution monitoring
network 2008 Volume I. TRL report RPN 744. TRL, Wokingham.
Highways Agency (2010). The Highways Agency roadside air pollution monitoring
network 2008 Volume II. TRL report RPN 744. TRL, Wokingham.
Highways Agency (2010). The Highways Agency roadside air pollution monitoring
network 2009 Volume II. TRL report RPN 1446, TRL, Wokingham.
WHO (2000). Air quality guidelines for Europe, 2nd edition. World Health Organisation
Regional Publications, No. 91. WHO.
Client Project Report
TRL 25 RPN1446 (I)
Appendix A Figures and locations of monitoring sites
A.1 M4 (Theale 2), Pinglewood
A.1.1 Ordnance Survey map
© Crown copyright. All rights reserved. Licence No. AL100021177
M4 Theale 2
N
Client Project Report
TRL 26 RPN1446 (I)
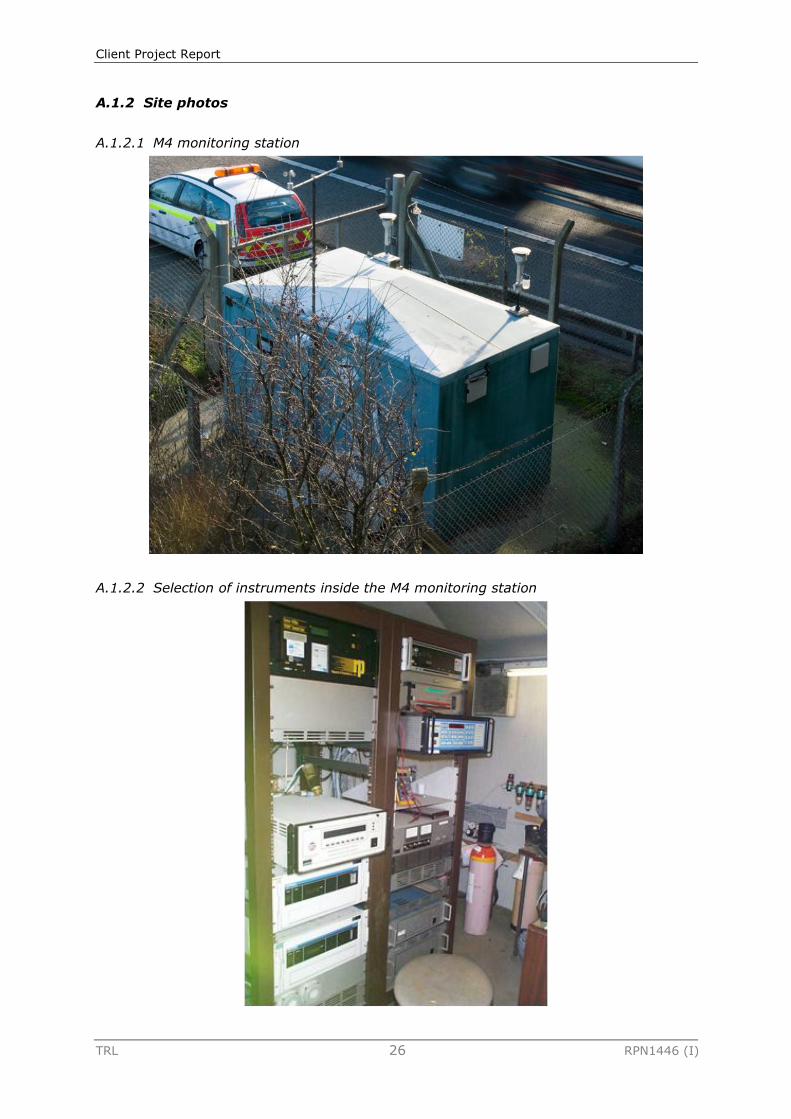
A.1.2 Site photos
A.1.2.1 M4 monitoring station
A.1.2.2 Selection of instruments inside the M4 monitoring station
Client Project Report
TRL 27 RPN1446 (I)
A.2 M25, Bell Common Tunnel
A.2.1 Ordnance Survey map
© Crown copyright. All rights reserved. Licence No. AL100021177
Bell Common Tunnel
N
Client Project Report
TRL 28 RPN1446 (I)
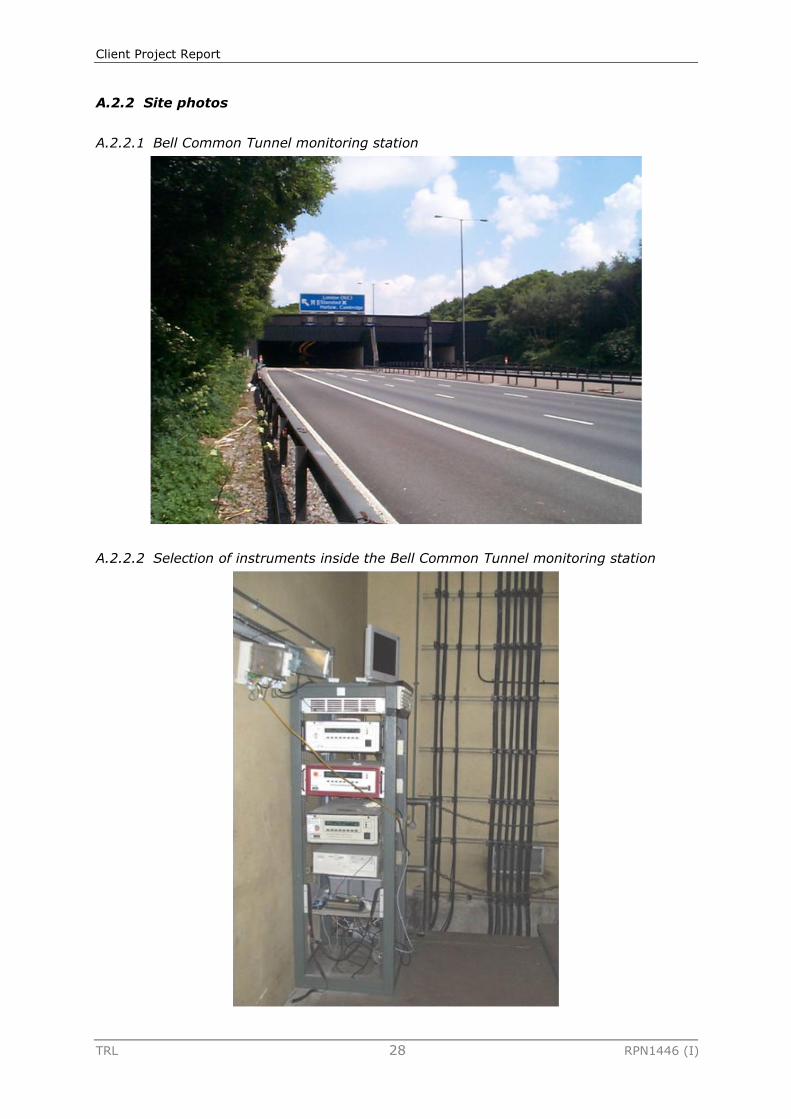
A.2.2 Site photos
A.2.2.1 Bell Common Tunnel monitoring station
A.2.2.2 Selection of instruments inside the Bell Common Tunnel monitoring station
Client Project Report
TRL 29 RPN1446 (I)
A.3 M25 (M25B), Staines
A.3.1 Ordnance Survey map
© Crown copyright. All rights reserved. Licence No. AL100021177
M25 B site
N
Client Project Report
TRL 30 RPN1446 (I)
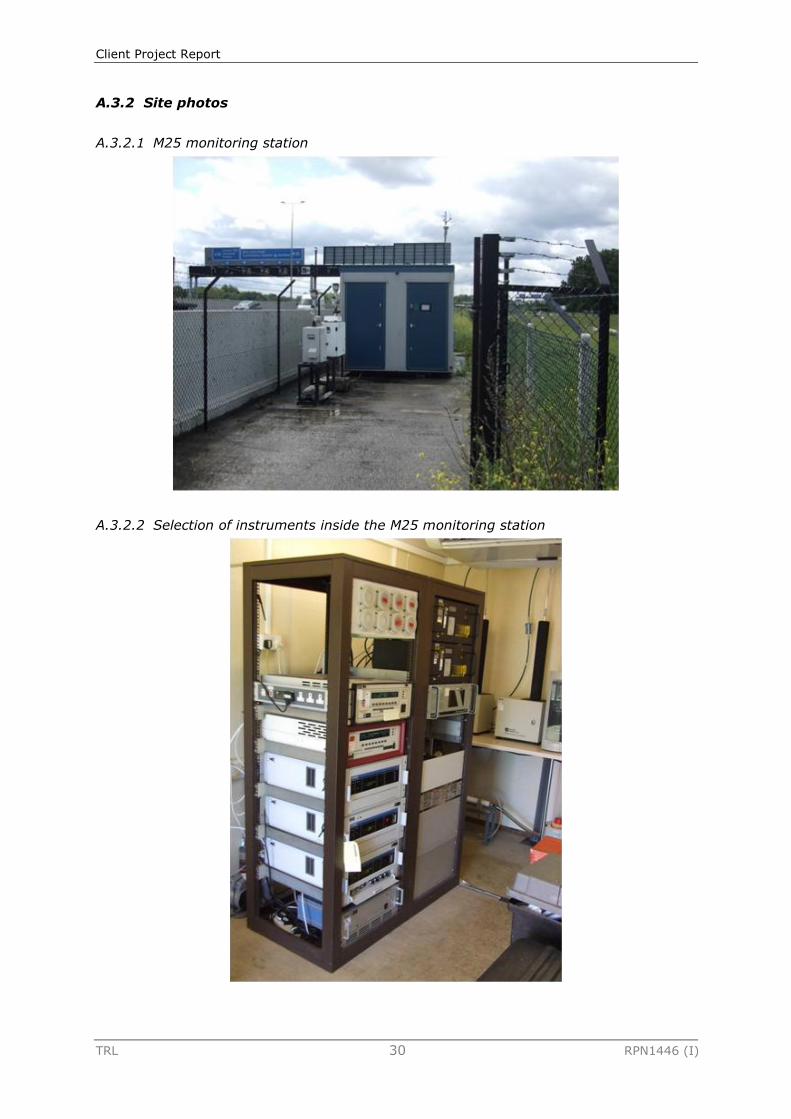
A.3.2 Site photos
A.3.2.1 M25 monitoring station
A.3.2.2 Selection of instruments inside the M25 monitoring station
Client Project Report
TRL 31 RPN1446 (I)
A.4 M60, Kirkhams
A.4.1 Ordnance Survey map
© Crown copyright. All rights reserved. Licence No. AL100021177
M60 site
N
Client Project Report
TRL 32 RPN1446 (I)
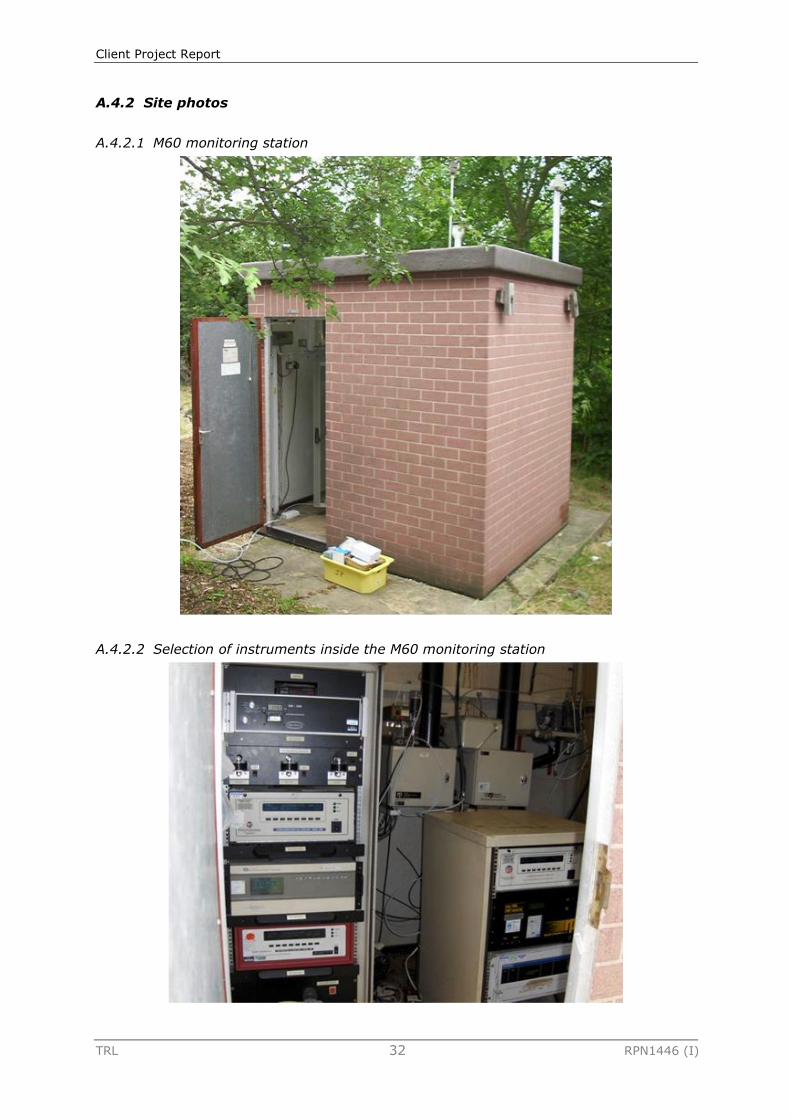
A.4.2 Site photos
A.4.2.1 M60 monitoring station
A.4.2.2 Selection of instruments inside the M60 monitoring station
Client Project Report
TRL 33 RPN1446 (I)
Appendix B Calibration and maintenance records
B.1 M4 (Theale 2), Pinglewood
Date Reason for visit Notes/Actions taken
08/01/09 Span/Zero check. NH3 tubes swapped out.
09/01/09 Interim visit. CO, NOx & O3 analysers swapped out for service.
19/01/09 Interim visit. CO analyser issues, returned unit to TRL for inspection. Analyser sent to service company for repair. No ‘hot spare’ instrument available. Unit required spare parts ordering. Reinstalled
27/1/09
22/01/09 Span/Zero check. NH3 tubes swapped out.
27/01/09 Span/Zero check. Installed new CO analyser.
05/02/09 Span/Zero check. NH3 tubes swapped out.
06/02/09 Span/Zero check & analyser installation.
Installed Horiba trial FID.
19/02/09 Span/Zero check. NH3 tubes swapped out.
26/02/09 NO fault Pump fault re-commissioned 27/2/09
27/02/09 FID cals. FID units calibrated.
04/03/09 FID cals. Final calibrations done on FID units, then trial FID removed.
05/03/09 Span/Zero check. NH3 tubes swapped out.
18/03/09 Span/Zero check & analyser installation.
Original NOx and CO analysers re-installed along side others for comparison
27/03/09
NH3 tube change & CO cals.
NH3 tubes swapped out.
29/3/09 FID fault Flame out fault. Re-light 30/3/09
02/04/09
Span/Zero check. NH3 tubes swapped out. FID analyser issues - removed for investigation and repair.
05/04/09 NOx service Service re-commissioned 6/4/09
16/04/09 Span/Zero check. CO analyser removed - no response to gas.
17/04/09 CO analyser re-installed.
CO analyser repaired and re-installed.
29/04/09 NOx fault Analyser pump fault re-commissioned 30/4/09
30/04/09 Span/Zero check. NH3 tubes swapped out.
01/05/09 NOx fault Temp warning, repaired at site
06/05/09 TEOM filter change.
-
14/05/09 Span/Zero check. -
15/05/09 O3 cals. O3 calibration carried out.
27/05/09 PM10 fault Instrument removed to workshop & repaired reinstalled 29/5/09
28/05/09 Span/Zero check. NH3 tubes swapped out.
01/06/09 Span/Zero check. PM10 TEOM pump swapped out.
11/06/09 Span/Zero check. NH3 tubes swapped out.
25/06/09 Span/Zero check. NH3 tubes swapped out.
09/07/09 Span/Zero check. NH3 tubes swapped out.
23/07/09 Span/Zero check. NH3 tubes swapped out. RH sensor issues – removed for investigation.
27/07/09 CO analyser CO analyser removed for service. Reinstalled 31/7/09
06/08/09 Span/Zero check & O3 cals.
NH3 tubes swapped out. O3 calibration carried out. Replacement RH sensor installed.
20/08/09 Span/Zero check Horiba NOx analyser removed. Replaced with API 200A NOx analyser. NH3 tubes collected.
24/08/09 Span/Zero check. -
03/09/09 Span/Zero check. NH3 tubes swapped out.
08/09/09 Interim visit. Diffusion tubes and filters changed.
01/10/09 Span/Zero check. NH3 tubes swapped out.
06/10/09 CO analyser fault CO returned to service company. Repaired and reinstalled 14/10/09
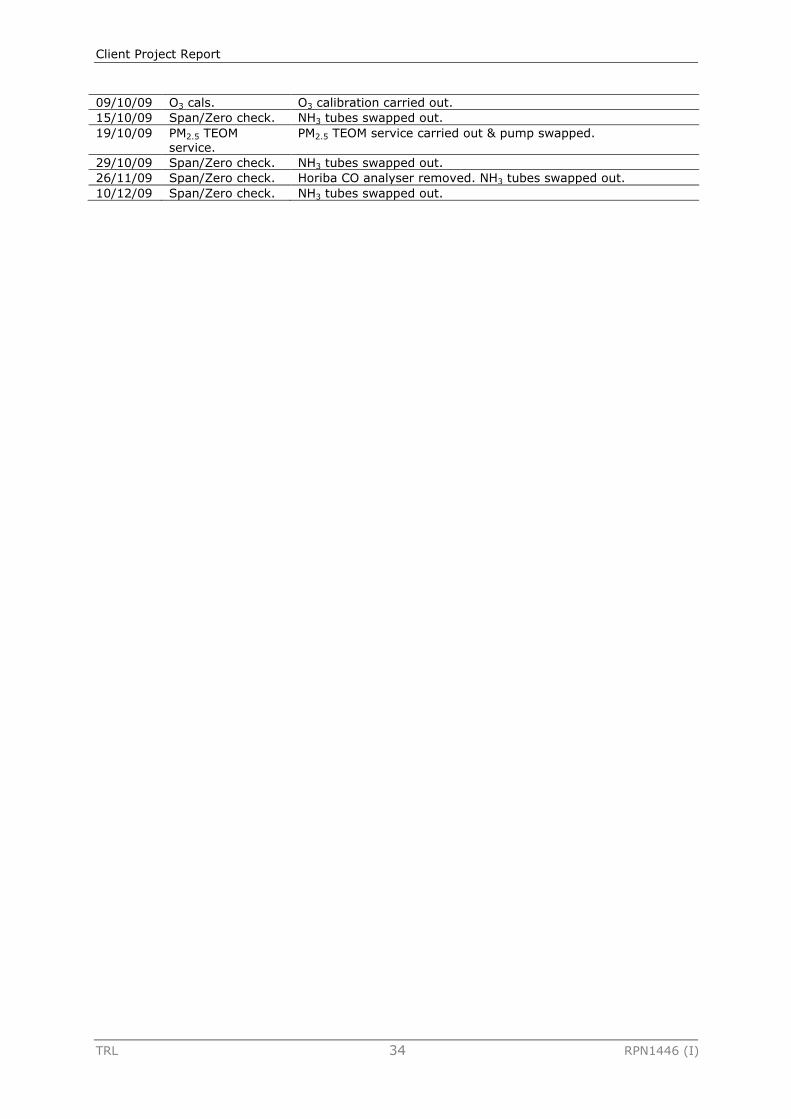
Client Project Report
TRL 34 RPN1446 (I)
09/10/09 O3 cals. O3 calibration carried out.
15/10/09 Span/Zero check. NH3 tubes swapped out.
19/10/09 PM2.5 TEOM service.
PM2.5 TEOM service carried out & pump swapped.
29/10/09 Span/Zero check. NH3 tubes swapped out.
26/11/09 Span/Zero check. Horiba CO analyser removed. NH3 tubes swapped out.
10/12/09 Span/Zero check. NH3 tubes swapped out.
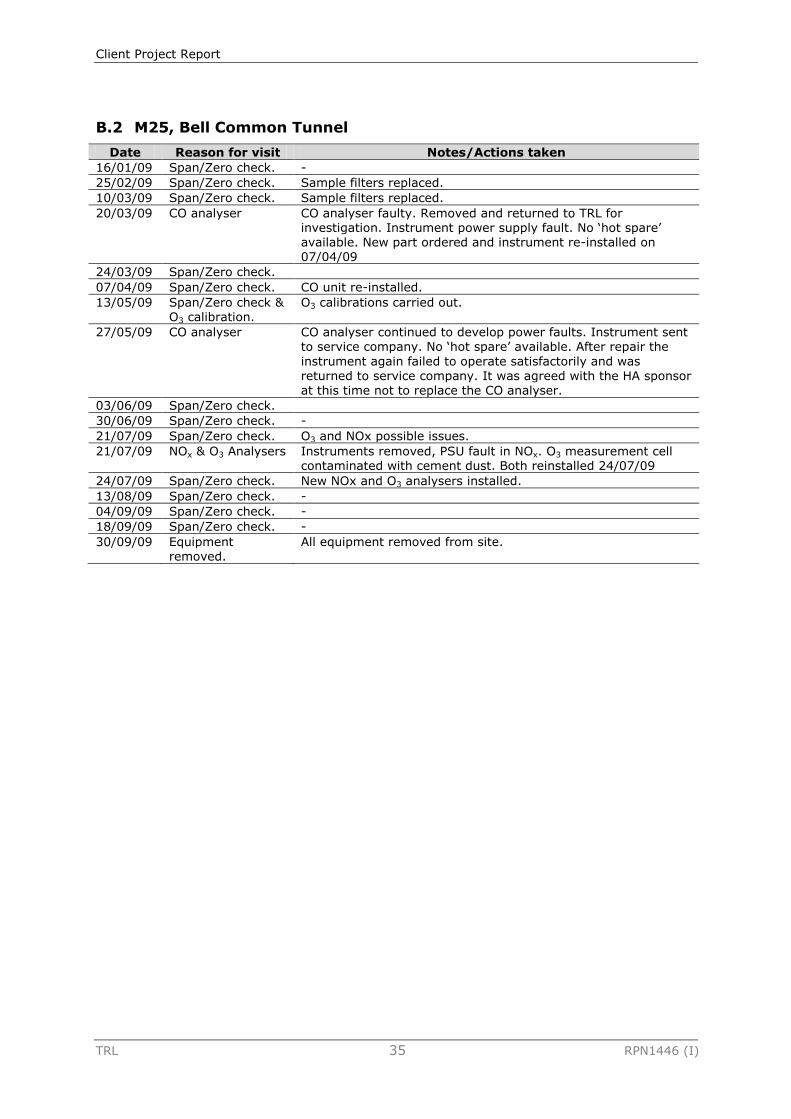
Client Project Report
TRL 35 RPN1446 (I)
B.2 M25, Bell Common Tunnel
Date Reason for visit Notes/Actions taken
16/01/09 Span/Zero check. -
25/02/09 Span/Zero check. Sample filters replaced.
10/03/09 Span/Zero check. Sample filters replaced.
20/03/09 CO analyser CO analyser faulty. Removed and returned to TRL for investigation. Instrument power supply fault. No ‘hot spare’ available. New part ordered and instrument re-installed on 07/04/09
24/03/09 Span/Zero check.
07/04/09 Span/Zero check. CO unit re-installed.
13/05/09 Span/Zero check & O3 calibration.
O3 calibrations carried out.
27/05/09 CO analyser CO analyser continued to develop power faults. Instrument sent to service company. No ‘hot spare’ available. After repair the
instrument again failed to operate satisfactorily and was
returned to service company. It was agreed with the HA sponsor at this time not to replace the CO analyser.
03/06/09 Span/Zero check.
30/06/09 Span/Zero check. -
21/07/09 Span/Zero check. O3 and NOx possible issues.
21/07/09 NOx & O3 Analysers Instruments removed, PSU fault in NOx. O3 measurement cell contaminated with cement dust. Both reinstalled 24/07/09
24/07/09 Span/Zero check. New NOx and O3 analysers installed.
13/08/09 Span/Zero check. -
04/09/09 Span/Zero check. -
18/09/09 Span/Zero check. -
30/09/09 Equipment removed.
All equipment removed from site.
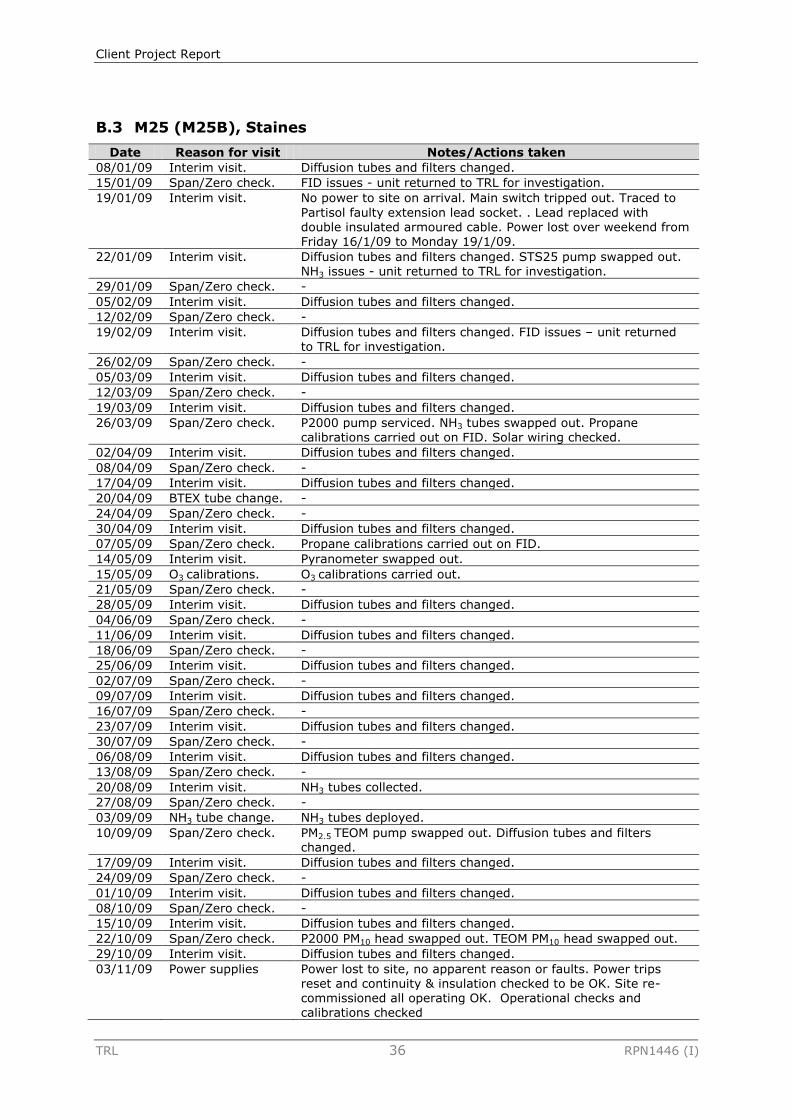
Client Project Report
TRL 36 RPN1446 (I)
B.3 M25 (M25B), Staines
Date Reason for visit Notes/Actions taken
08/01/09 Interim visit. Diffusion tubes and filters changed.
15/01/09 Span/Zero check. FID issues - unit returned to TRL for investigation.
19/01/09 Interim visit. No power to site on arrival. Main switch tripped out. Traced to
Partisol faulty extension lead socket. . Lead replaced with double insulated armoured cable. Power lost over weekend from Friday 16/1/09 to Monday 19/1/09.
22/01/09 Interim visit. Diffusion tubes and filters changed. STS25 pump swapped out. NH3 issues - unit returned to TRL for investigation.
29/01/09 Span/Zero check. -
05/02/09 Interim visit. Diffusion tubes and filters changed.
12/02/09 Span/Zero check. -
19/02/09 Interim visit. Diffusion tubes and filters changed. FID issues – unit returned to TRL for investigation.
26/02/09 Span/Zero check. -
05/03/09 Interim visit. Diffusion tubes and filters changed.
12/03/09 Span/Zero check. -
19/03/09 Interim visit. Diffusion tubes and filters changed.
26/03/09 Span/Zero check. P2000 pump serviced. NH3 tubes swapped out. Propane calibrations carried out on FID. Solar wiring checked.
02/04/09 Interim visit. Diffusion tubes and filters changed.
08/04/09 Span/Zero check. -
17/04/09 Interim visit. Diffusion tubes and filters changed.
20/04/09 BTEX tube change. -
24/04/09 Span/Zero check. -
30/04/09 Interim visit. Diffusion tubes and filters changed.
07/05/09 Span/Zero check. Propane calibrations carried out on FID.
14/05/09 Interim visit. Pyranometer swapped out.
15/05/09 O3 calibrations. O3 calibrations carried out.
21/05/09 Span/Zero check. -
28/05/09 Interim visit. Diffusion tubes and filters changed.
04/06/09 Span/Zero check. -
11/06/09 Interim visit. Diffusion tubes and filters changed.
18/06/09 Span/Zero check. -
25/06/09 Interim visit. Diffusion tubes and filters changed.
02/07/09 Span/Zero check. -
09/07/09 Interim visit. Diffusion tubes and filters changed.
16/07/09 Span/Zero check. -
23/07/09 Interim visit. Diffusion tubes and filters changed.
30/07/09 Span/Zero check. -
06/08/09 Interim visit. Diffusion tubes and filters changed.
13/08/09 Span/Zero check. -
20/08/09 Interim visit. NH3 tubes collected.
27/08/09 Span/Zero check. -
03/09/09 NH3 tube change. NH3 tubes deployed.
10/09/09 Span/Zero check. PM2.5 TEOM pump swapped out. Diffusion tubes and filters changed.
17/09/09 Interim visit. Diffusion tubes and filters changed.
24/09/09 Span/Zero check. -
01/10/09 Interim visit. Diffusion tubes and filters changed.
08/10/09 Span/Zero check. -
15/10/09 Interim visit. Diffusion tubes and filters changed.
22/10/09 Span/Zero check. P2000 PM10 head swapped out. TEOM PM10 head swapped out.
29/10/09 Interim visit. Diffusion tubes and filters changed.
03/11/09 Power supplies Power lost to site, no apparent reason or faults. Power trips reset and continuity & insulation checked to be OK. Site re-commissioned all operating OK. Operational checks and calibrations checked
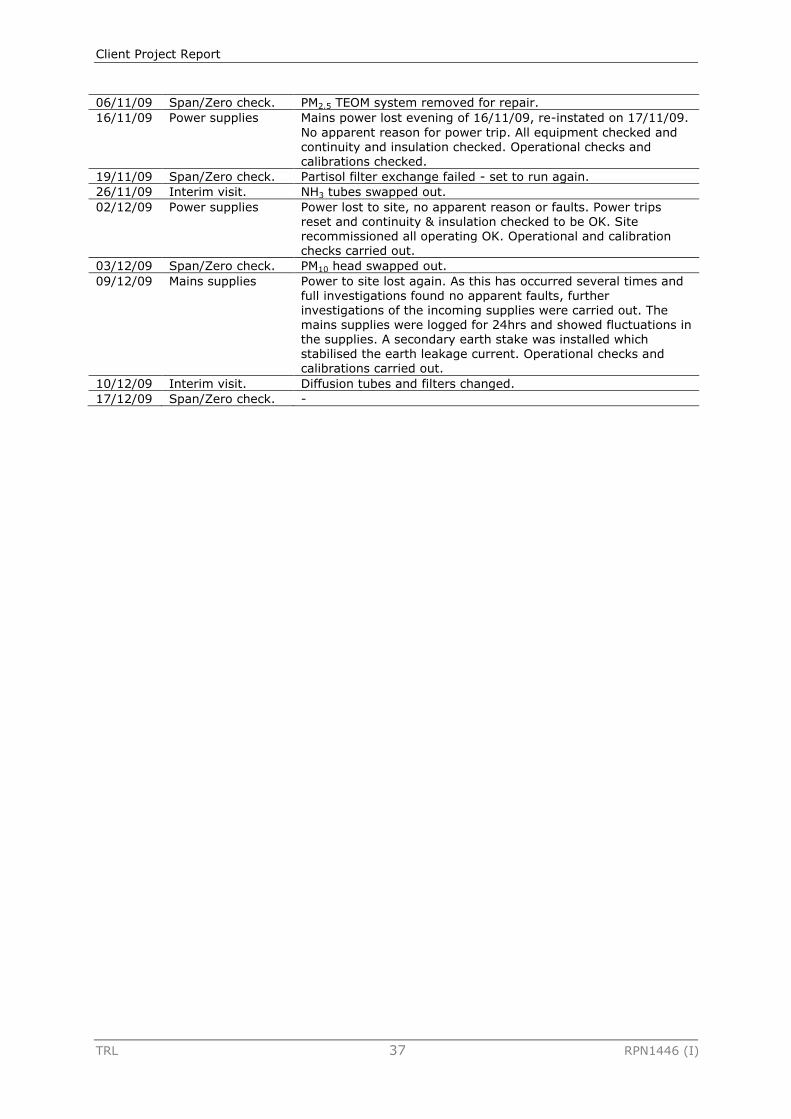
Client Project Report
TRL 37 RPN1446 (I)
06/11/09 Span/Zero check. PM2.5 TEOM system removed for repair.
16/11/09 Power supplies Mains power lost evening of 16/11/09, re-instated on 17/11/09.
No apparent reason for power trip. All equipment checked and continuity and insulation checked. Operational checks and calibrations checked.
19/11/09 Span/Zero check. Partisol filter exchange failed - set to run again.
26/11/09 Interim visit. NH3 tubes swapped out.
02/12/09 Power supplies Power lost to site, no apparent reason or faults. Power trips reset and continuity & insulation checked to be OK. Site recommissioned all operating OK. Operational and calibration checks carried out.
03/12/09 Span/Zero check. PM10 head swapped out.
09/12/09 Mains supplies Power to site lost again. As this has occurred several times and full investigations found no apparent faults, further investigations of the incoming supplies were carried out. The mains supplies were logged for 24hrs and showed fluctuations in the supplies. A secondary earth stake was installed which stabilised the earth leakage current. Operational checks and calibrations carried out.
10/12/09 Interim visit. Diffusion tubes and filters changed.
17/12/09 Span/Zero check. -
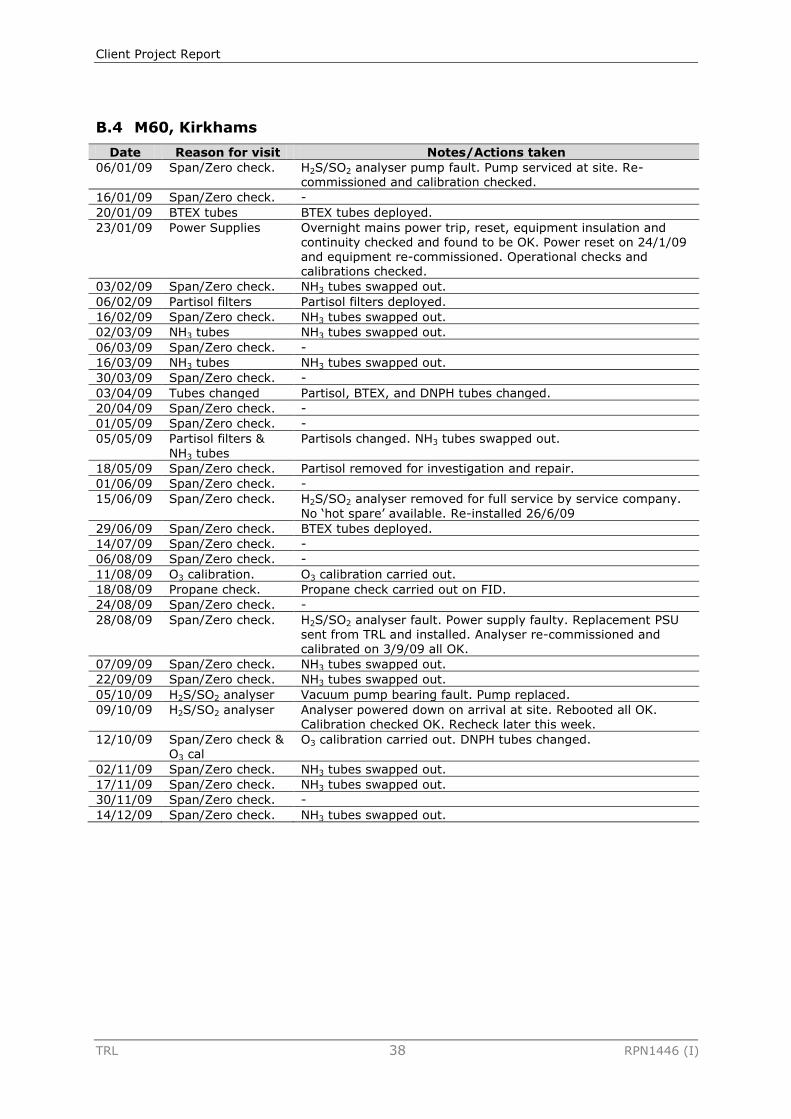
Client Project Report
TRL 38 RPN1446 (I)
B.4 M60, Kirkhams
Date Reason for visit Notes/Actions taken
06/01/09 Span/Zero check. H2S/SO2 analyser pump fault. Pump serviced at site. Re-commissioned and calibration checked.
16/01/09 Span/Zero check. -
20/01/09 BTEX tubes BTEX tubes deployed.
23/01/09 Power Supplies Overnight mains power trip, reset, equipment insulation and continuity checked and found to be OK. Power reset on 24/1/09 and equipment re-commissioned. Operational checks and calibrations checked.
03/02/09 Span/Zero check. NH3 tubes swapped out.
06/02/09 Partisol filters Partisol filters deployed.
16/02/09 Span/Zero check. NH3 tubes swapped out.
02/03/09 NH3 tubes NH3 tubes swapped out.
06/03/09 Span/Zero check. -
16/03/09 NH3 tubes NH3 tubes swapped out.
30/03/09 Span/Zero check. -
03/04/09 Tubes changed Partisol, BTEX, and DNPH tubes changed.
20/04/09 Span/Zero check. -
01/05/09 Span/Zero check. -
05/05/09 Partisol filters &
NH3 tubes
Partisols changed. NH3 tubes swapped out.
18/05/09 Span/Zero check. Partisol removed for investigation and repair.
01/06/09 Span/Zero check. -
15/06/09 Span/Zero check. H2S/SO2 analyser removed for full service by service company.
No ‘hot spare’ available. Re-installed 26/6/09
29/06/09 Span/Zero check. BTEX tubes deployed.
14/07/09 Span/Zero check. -
06/08/09 Span/Zero check. -
11/08/09 O3 calibration. O3 calibration carried out.
18/08/09 Propane check. Propane check carried out on FID.
24/08/09 Span/Zero check. -
28/08/09 Span/Zero check. H2S/SO2 analyser fault. Power supply faulty. Replacement PSU
sent from TRL and installed. Analyser re-commissioned and calibrated on 3/9/09 all OK.
07/09/09 Span/Zero check. NH3 tubes swapped out.
22/09/09 Span/Zero check. NH3 tubes swapped out.
05/10/09 H2S/SO2 analyser Vacuum pump bearing fault. Pump replaced.
09/10/09 H2S/SO2 analyser Analyser powered down on arrival at site. Rebooted all OK. Calibration checked OK. Recheck later this week.
12/10/09 Span/Zero check & O3 cal
O3 calibration carried out. DNPH tubes changed.
02/11/09 Span/Zero check. NH3 tubes swapped out.
17/11/09 Span/Zero check. NH3 tubes swapped out.
30/11/09 Span/Zero check. -
14/12/09 Span/Zero check. NH3 tubes swapped out.
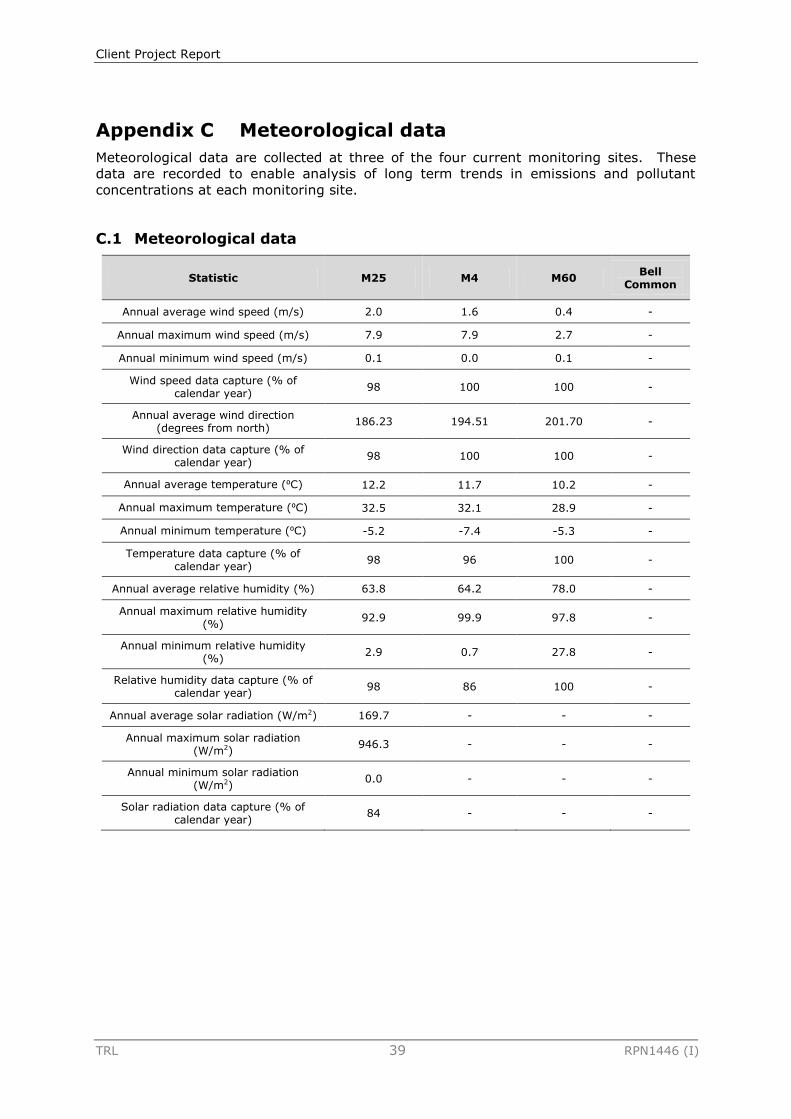
Client Project Report
TRL 39 RPN1446 (I)
Appendix C Meteorological data
Meteorological data are collected at three of the four current monitoring sites. These
data are recorded to enable analysis of long term trends in emissions and pollutant
concentrations at each monitoring site.
C.1 Meteorological data
Statistic M25 M4 M60 Bell
Common
Annual average wind speed (m/s) 2.0 1.6 0.4 -
Annual maximum wind speed (m/s) 7.9 7.9 2.7 -
Annual minimum wind speed (m/s) 0.1 0.0 0.1 -
Wind speed data capture (% of calendar year)
98 100 100 -
Annual average wind direction (degrees from north)
186.23 194.51 201.70 -
Wind direction data capture (% of calendar year)
98 100 100 -
Annual average temperature (⁰C) 12.2 11.7 10.2 -
Annual maximum temperature (⁰C) 32.5 32.1 28.9 -
Annual minimum temperature (⁰C) -5.2 -7.4 -5.3 -
Temperature data capture (% of calendar year)
98 96 100 -
Annual average relative humidity (%) 63.8 64.2 78.0 -
Annual maximum relative humidity (%)
92.9 99.9 97.8 -
Annual minimum relative humidity (%)
2.9 0.7 27.8 -
Relative humidity data capture (% of calendar year)
98 86 100 -
Annual average solar radiation (W/m2) 169.7 - - -
Annual maximum solar radiation (W/m2)
946.3 - - -
Annual minimum solar radiation (W/m2)
0.0 - - -
Solar radiation data capture (% of calendar year)
84 - - -
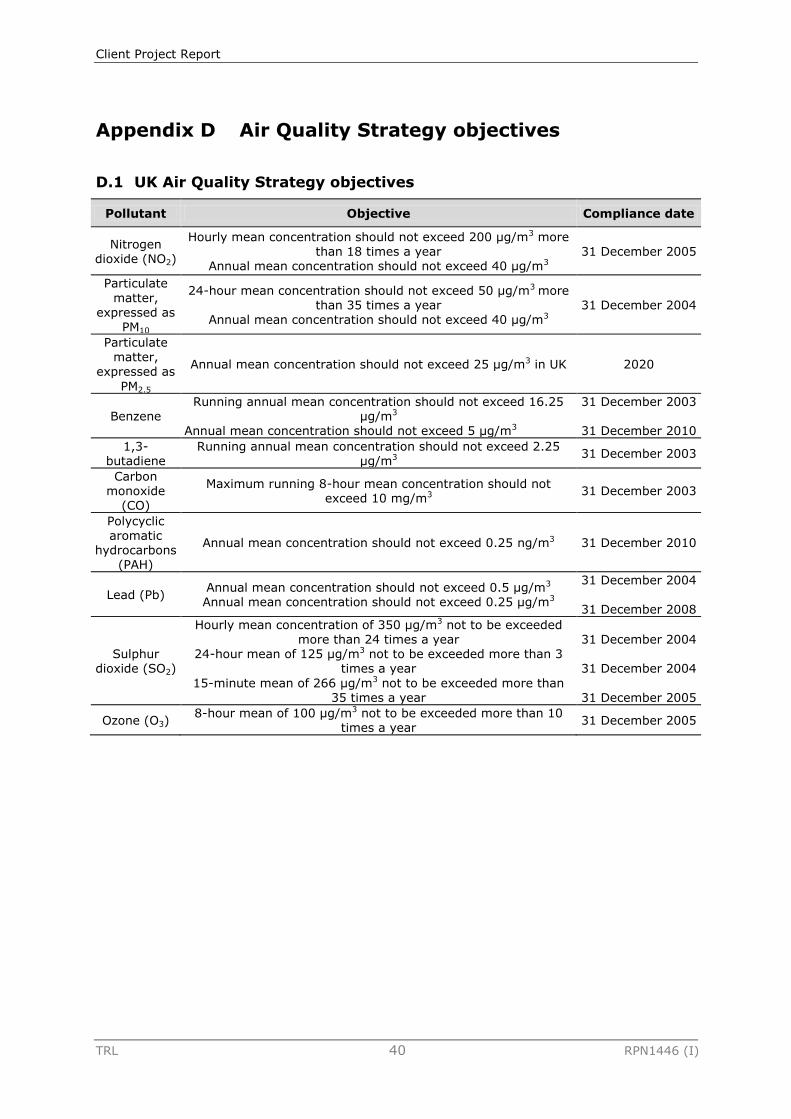
Client Project Report
TRL 40 RPN1446 (I)
Appendix D Air Quality Strategy objectives
D.1 UK Air Quality Strategy objectives
Pollutant Objective Compliance date
Nitrogen dioxide (NO2)
Hourly mean concentration should not exceed 200 μg/m3 more than 18 times a year
Annual mean concentration should not exceed 40 μg/m3 31 December 2005
Particulate
matter, expressed as
PM10
24-hour mean concentration should not exceed 50 μg/m3 more than 35 times a year
Annual mean concentration should not exceed 40 μg/m3 31 December 2004
Particulate matter,
expressed as
PM2.5
Annual mean concentration should not exceed 25 μg/m3 in UK 2020
Benzene Running annual mean concentration should not exceed 16.25
μg/m3 Annual mean concentration should not exceed 5 μg/m3
31 December 2003
31 December 2010
1,3-butadiene
Running annual mean concentration should not exceed 2.25 μg/m3
31 December 2003
Carbon monoxide
(CO)
Maximum running 8-hour mean concentration should not exceed 10 mg/m3
31 December 2003
Polycyclic aromatic
hydrocarbons (PAH)
Annual mean concentration should not exceed 0.25 ng/m3 31 December 2010
Lead (Pb) Annual mean concentration should not exceed 0.5 μg/m3 Annual mean concentration should not exceed 0.25 μg/m3
31 December 2004
31 December 2008
Sulphur dioxide (SO2)
Hourly mean concentration of 350 μg/m3 not to be exceeded more than 24 times a year
24-hour mean of 125 μg/m3 not to be exceeded more than 3 times a year
15-minute mean of 266 μg/m3 not to be exceeded more than 35 times a year
31 December 2004
31 December 2004
31 December 2005
Ozone (O3) 8-hour mean of 100 μg/m3 not to be exceeded more than 10
times a year 31 December 2005
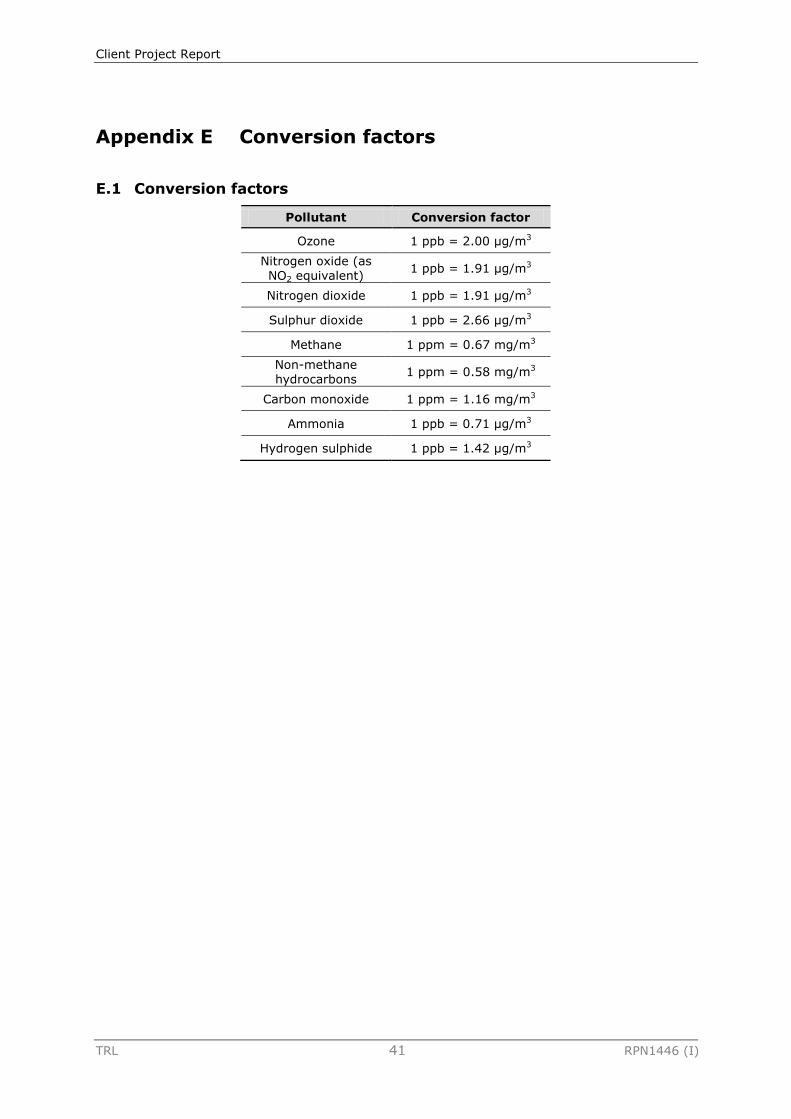
Client Project Report
TRL 41 RPN1446 (I)
Appendix E Conversion factors
E.1 Conversion factors
Pollutant Conversion factor
Ozone 1 ppb = 2.00 µg/m3
Nitrogen oxide (as NO2 equivalent)
1 ppb = 1.91 µg/m3
Nitrogen dioxide 1 ppb = 1.91 µg/m3
Sulphur dioxide 1 ppb = 2.66 µg/m3
Methane 1 ppm = 0.67 mg/m3
Non-methane
hydrocarbons 1 ppm = 0.58 mg/m3
Carbon monoxide 1 ppm = 1.16 mg/m3
Ammonia 1 ppb = 0.71 µg/m3
Hydrogen sulphide 1 ppb = 1.42 µg/m3