Embed Size (px)
Citation preview
1 Dr. Ismail Ibrahim / Almustansirya college of /physiology department / C.V.S.
1. Dr ismail alkaragully
CARDIOVASCULAR SYSTEM.
Functions of the heart: 1. Generating blood pressure: Contractions of the heart generate blood pressure, which is responsible for blood movement through the blood vessels. 2. Directing blood: The heart separates the pulmonary and systemic circulations and ensures better oxygenation of blood flowing to tissues. 3. Ensuring one-way blood flow: The valves of the heart ensure a one-way flow of blood through the heart and blood vessels. 4. Regulating blood supply: Changes in the rate and force of contraction match blood delivery to the changing metabolic needs of the tissues, such as during rest, exercise, and changes in body position.
The heart (the cardium) The valves of the heart are fibrous flaps of tissue covered with endothelium.
Those guarding the atrioventricular opening have strands of fibrous tissue (chordae
tendineae) connecting them to small muscles within the ventricles (papillary muscles)
which contract when the ventricular wall contract and strengthen the valves during
contraction by pull the chordae tendineae of the valves inward toward the ventricles to
prevent valves bulging too far backward toward the atria during ventricular contraction
and help the ventricle to empty later in the cycle. If a chorda tendinea becomes ruptured
or if one of the papillary muscles become paralyzed, the valve bulges far backward,
sometimes so far that it leaks severely and results in sever or even lethal cardiac
incapacity.
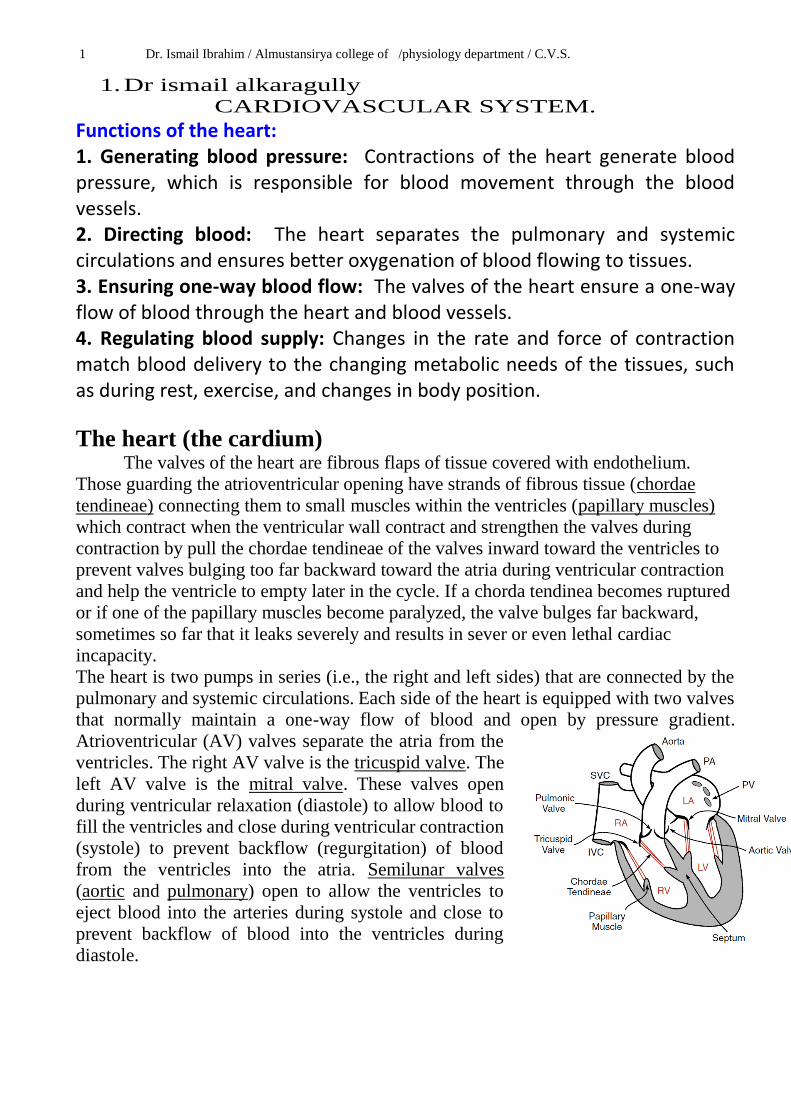
The heart is two pumps in series (i.e., the right and left sides) that are connected by the
pulmonary and systemic circulations. Each side of the heart is equipped with two valves
that normally maintain a one-way flow of blood and open by pressure gradient.
Atrioventricular (AV) valves separate the atria from the
ventricles. The right AV valve is the tricuspid valve. The
left AV valve is the mitral valve. These valves open
during ventricular relaxation (diastole) to allow blood to
fill the ventricles and close during ventricular contraction
(systole) to prevent backflow (regurgitation) of blood
from the ventricles into the atria. Semilunar valves
(aortic and pulmonary) open to allow the ventricles to
eject blood into the arteries during systole and close to
prevent backflow of blood into the ventricles during
diastole.

1 Dr. Ismail Ibrahim / Almustansirya college of /physiology department / C.V.S.
2
Physiological properties of the cardiac muscle:
Electrical properties. 1-Syncytium properties. 2-Automaticity & rhythmicity.[all the cells of heart have an inherent ability to
generate impulse]
3-Excitability &conductivity.[Ability Of excitable tissues to show change in
potential when stimulated.]
Mechanical properties.
1-Contractility. 2- all or non-law. [Action potential fails to occur if the stimulus is sub threshold ]
3- refractory period.[ Cardiac muscle is absolutely refractory to re stimulation during
most of the action potential]
4-Staircase phenomena or[ Treppe ]. [contain plateau phase]
Heart muscle cells have properties somewhere in between those of skeletal and smooth
muscle. They are small, striated and branching cells with a single nucleus. Each cell is
connected to its neighbor by intercalated discs, within which are gap junctions. These
junctions allow easy passage of electrical currents (action potentials) and small
molecules between adjacent cells. A piece of heart muscle therefore behaves as a single
unit (syncytium) to electrical stimulation, rather than a group of isolated units as does
skeletal muscle.
Refractory period (physiology), The amount of time it takes for an excitable membrane to be ready for a second stimulus once it returns to its resting state following excitation in the areas of biology, physiology, and cardiology. Refractory period of the cardiac muscles.[separated into absolute& relative] Absolute refractory period ( ARP ) Is the period in which the cardiac cell is resistance to second action potential in which the cardiac muscle can't be excited during the period of systole and early part of diastole to prevent tetanus so Cardiac muscle is absolutely refractory to re stimulation during most of the action potential. Relative refractory period ( RRP ). It is the interval during which a second action potential can be produced but a higher stimulus intensity i,e the heart respond only to stronger stimuli , it lasts from the end of ARP ( midrepolarization ) and ends shortly before complete before repolarization i.e it lasts for a short period during diastole,so the cardiac refractory period is separated into an absolute refractory period and a relative refractory period. During the absolute refractory period, a new action potential cannot be elicited. During the relative refractory period, a new action potential can be elicited under the correct circumstances.
1 Dr. Ismail Ibrahim / Almustansirya college of /physiology department / C.V.S.

1 Dr. Ismail Ibrahim / Almustansirya college of /physiology department / C.V.S.
3
The cardiac cycle: The period from the end of one heart contraction to the end of the next. The events of
the cardiac cycle are electrical and mechanical events. Cardiac muscle begins
to contract a few milliseconds after the action potential begins and continues to contract
for a few milliseconds after the action potential ends. Therefore, the normal duration of
cardiac cycle is 0.8 second at heart rate of 75/ min , so the duration of contraction of
cardiac muscle is mainly a function of the duration of the action potential, i.e., about 0.1
sec in atrial muscle[ atrial systole] and atrial diastole is 0.7 sec , ventricular diastole
0.5 sec and 0.3 sec is ventricular systole [ total duration of cardiac cycle 0.8sec]
The Electrical events of the cardiac cycle.
A- The specialized noncontractile cardiac cells capable of auto rhythmicity consist of.
[1] S.A NODE. It is the normal primary pacemaker of the heart in which rhythmic self-excitatory
impulse is generated (it has the property of automaticity). SA node located near the
junction of the superior vena cava and the right atrium and their fibers are continuous
with the atrial fibers so that any action potential that begins in the SA node spreads
immediately to the atria. The fibers of SA node characterized by
[a] The resting membrane potential is [ -55mV].
[b] The action potential is slower to develop
because of slow Ca channels are activated (while
the fast Na channels in SA node fibers are
actually inactivated) and slower to recover.
[c] The membrane of SA node fibers are quite
leaky to Na ions which causes the resting
potential to rise gradually between each two heart
beat (unstable membrane potential) until it finally
reaches the threshold voltage (-40 mV) for
opening of Ca channels, thus leading to action
potential.
It is under control of autonomic nervous system
mainly parasympathetic . Normally, vagal
activity (vagal tone) slows the firing rate of the SA node from its automatic rate of 90 –
120 beats / min to the actual heart rate of about 70 beats / min.
[2] Interatrial tract (Bachmann`s bundle): This band of specialized muscle fibers
runs from the SA node to the left atrium and causes almost simultaneous depolarization
and contraction of both atria because the conduction velocity through atrial muscle is
very fast [ 0.5m / second].
1 Dr. Ismail Ibrahim / Almustansirya college of /physiology department / C.V.S.
4 [3] Internodal tract: Three bundles of specialized cells (anterior, middle, and
posterior) connect the SA and AV nodes. The internodal tracts increase the likelihood
that impulses from SA node will reach the AV node and initiate ventricular
depolarization.
[4] AV (atrioventricular) node: Located just beneath the endocardium on the right
side of the interatrial septum near the tricuspid valve. The AV node is normally the only
path for excitation to proceed from the atria to the ventricles. The conduction velocity
through the AV node is extremely slow [0.05m / second], so that ventricular
depolarization is delayed after atrial depolarization. This delay provides time for atrial
contraction to occur,in which the atria to contract before the ventricles do which
enhances ventricular filling. The causes for the delayed conduction through AV node
are:
[a] Small size fibers (have higher resistance to conduction of ionic currents), also
diminish numbers of gap junctions between successive cells in the conducting pathways
[b] Their fibers have a high negative resting membrane potential and consequently most
of fast Na channels are inactivated and the action potential is initiated by the slow Ca
channels which are slow to open.
Because of the fact that the slow Ca channels are responsible for the action potential at
AV node, the slow closure of these channels will prolong greatly the refractory period
of the AV node fibers. This prolongation in refractory period helps in preventing the
development of potentially serious arrhythmias of the heart that might occur if a second
cardiac impulse were transmitted into the ventricular muscle too soon after the first. The
AV node is richly supplied by fibers from both the sympathetic and vagal nerves, which
affect the conduction of impulses. The AV node and the His-Perkinje system are latent
pacemakers of the heart that may exhibit automaticity and override the SA node if it
is suppressed.
[5] Bundle of His: It is the continuation of the AV node and is located in the
interventricular septum. The bundle of His divides into the right and left bundle
branches, then left bundle branch divided into anterior& posterior fascicles.
[6] The right and left bundle branches proceed on each side of the interventricular
septum to their respective ventricles.
[7] Purkinje fibers arise from both bundle branches and branch out extensively just
beneath the endocardium of both ventricles. Therefore, depolarization of ventricular
muscles occurs from the endocardium surface to the epicardium. They have functional
characteristics quite the opposite of those of the AV nodal fibers; they are very large
fibers with conduction velocity more than 4 times that in the usual cardiac muscles
[4m / sec]. This allows almost immediate transmission of the cardiac impulse
throughout the entire ventricular system so that both ventricles contract almost
simultaneously.

1 Dr. Ismail Ibrahim / Almustansirya college of /physiology department / C.V.S.
5
Table 7.1: The conduction velocity of the action potential at various parts of the conducting system of the heart.
1 Dr. Ismail Ibrahim / Almustansirya college of /physiology department / C.V.S.
6
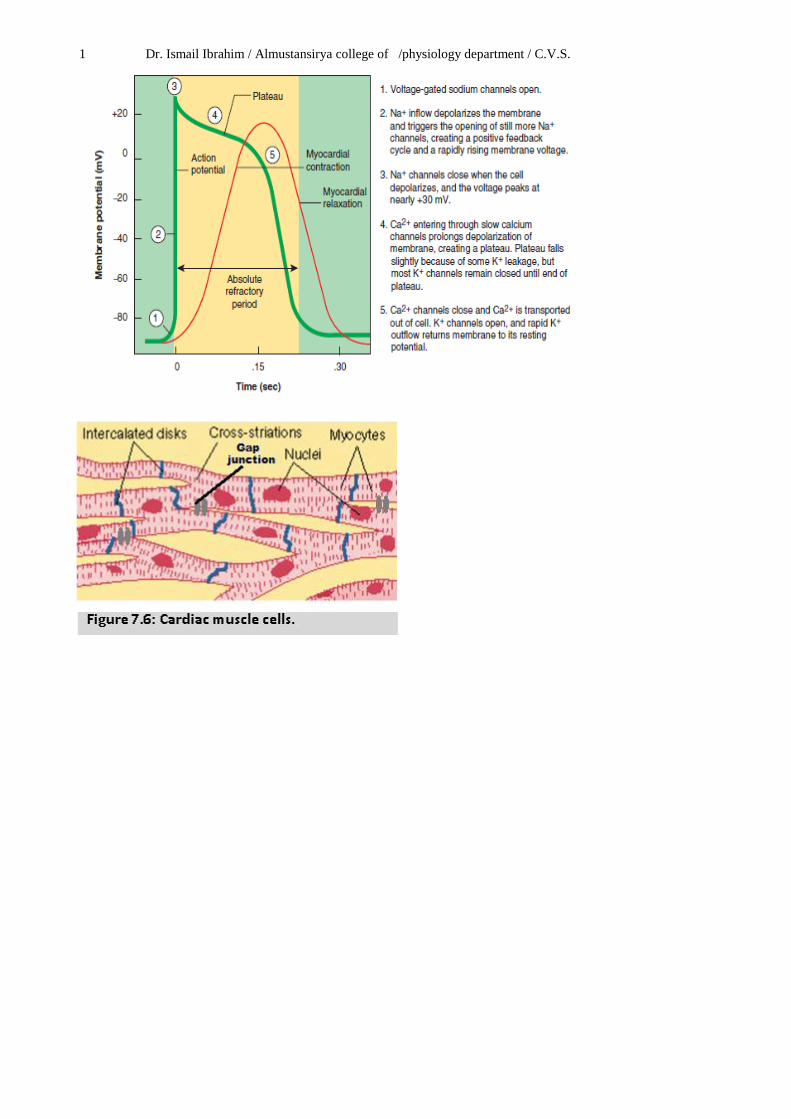
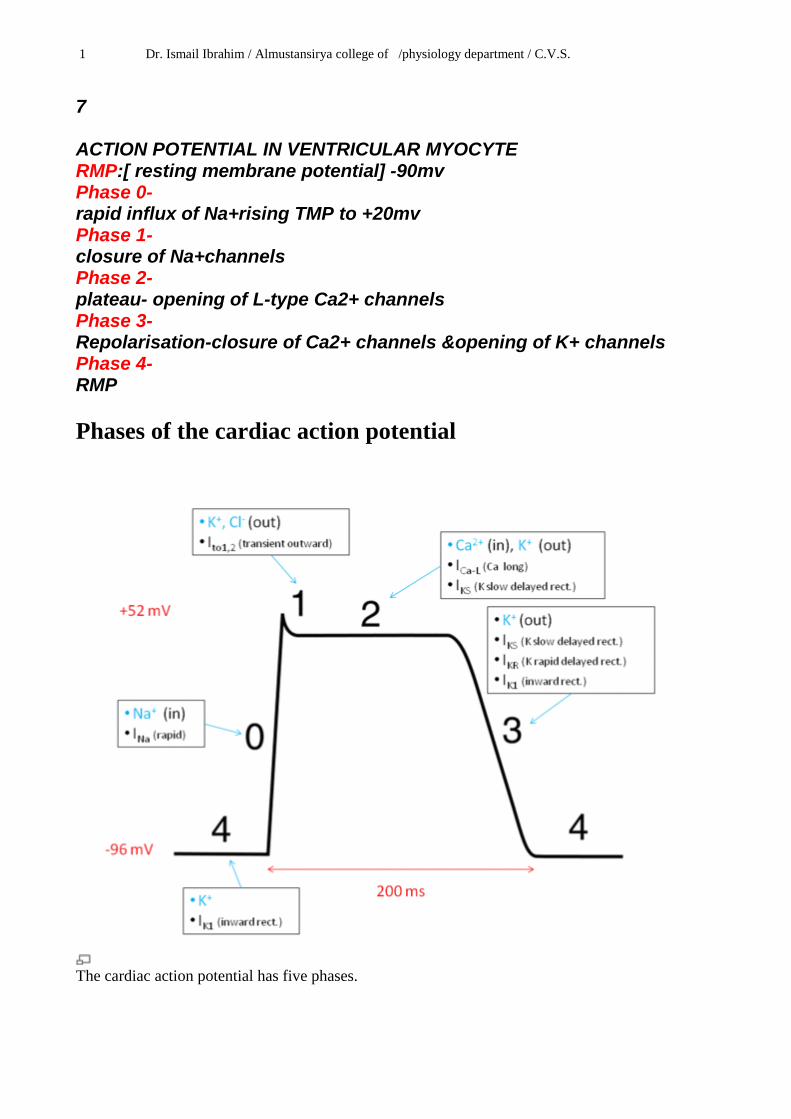
B-The contractile cardiac action potential [consist from Atria & ventricular muscles]. It may be divided into five phases:
[A] Phase 4: Resting membrane potential: It is about –90 mV. During this
phase the membrane is impermeable to Na ions (i.e voltage-gated Na-channels are
closed).
The ventricles, atria, and to certain extent the Purkinje system have stable resting
membrane potential of about -90 mV.
While sinoatrial (SA) node, atrioventricular (AV) node have unstable resting
membrane potential (i.e., show automaticity).
[B] Phase 0: Depolarization: Once the threshold potential in the atria, ventricles,
and Purkinje fibers is reached, voltage-gated Na channels are opened and allow
Na ions to rush into the cell along its electrochemical gradient. This process results in
depolarization of the cell membrane. The ionic basis for phase 0 in the SA and AV
nodes is due to inward of Ca ions due to opening of voltage-gated Ca
channels.
[C] Phase 1: Phase 1 is a brief period of initial repolarization and is caused an efflux
of K ions and a decrease of Na ions influx.
[D] Phase 2: Is the plateau of the action potential which is a sustained
depolarization. It is due to Ca influx (as a result of opening of slow Ca channels).
Phases 1 and 2 are not present in the SA node action potential
[E] Phase 3: Repolarization: This is achieved mainly by opening of voltage-
gated K channels in addition with closure of voltage-gated Na, Ca channels and the
activation of Na-K, and the Ca pumps.
The presence of the plateau causes action potential in cardiac muscles to be longer than in skeletal muscles and this is due:
[1] The presence of slow channels in cardiac muscle while no such channels present in skeletal muscles. The slow channel differs from the fast channel by being slower to open and remain open for more prolong time.
[2] The permeability of cardiac muscle membrane for K ions decreases immediately after depolarization which greatly decreases the out flux of K ions during the action potential plateau and thereby prevents early recovery. While the skeletal muscle membrane permeability for K ions increases immediately after depolarization which greatly increases the out flux of K ions during action potential and thereby enhances early recovery.
1 Dr. Ismail Ibrahim / Almustansirya college of /physiology department / C.V.S.
7 ACTION POTENTIAL IN VENTRICULAR MYOCYTE RMP:[ resting membrane potential] -90mv Phase 0- rapid influx of Na+rising TMP to +20mv Phase 1- closure of Na+channels Phase 2- plateau- opening of L-type Ca2+ channels Phase 3- Repolarisation-closure of Ca2+ channels &opening of K+ channels Phase 4- RMP
Phases of the cardiac action potential
The cardiac action potential has five phases.
1 Dr. Ismail Ibrahim / Almustansirya college of /physiology department / C.V.S.
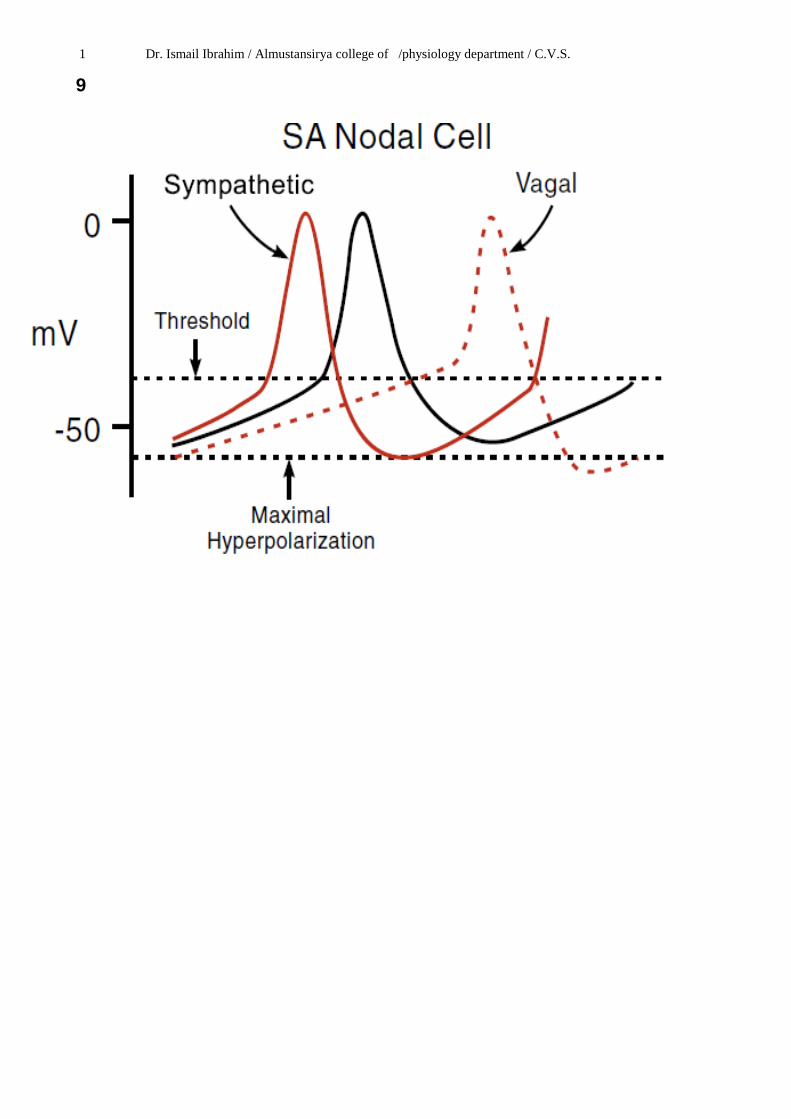
8 Modifying the basic rhythm: extrinsic innervation of the heart: Although the intrinsic conduction system sets the basic heart rate, fibers of the autonomic nervous system modify the marchlike beat and introduce a subtle variability from one beat to the next. The sympathetic nervous system the “accelerator” increases both the rate and the force of heartbeat. The parasympathetic activation the “brakes” slows the heart.
Sympathetic stimulation increases the overall activity of the heart. Maximal stimulation can almost triple the frequency of heartbeat and can increase the strength of heart contraction as much as twofold. Noradrenalin, released by the sympathetic nerve endings, or adrenaline circulating in the blood, have several effects on the heart mediated by β1 receptors. One of these is to increase inward Na+ and Ca2+ ions current, that causes a more positive resting potential and more steeper pacemaker potential slope (increased rate of upward drift of the membrane potential toward the threshold level) .
In the sinus node, both of these changes are accelerating the self-excitation and, therefore, increasing the heart rate (positive chronotropic effect).
In the A-V node and A-V bundles, increased sodium-calcium permeability makes it easier for the action potential to excite each succeeding portion of the conducting fiber bundles, thereby decreasing the conduction time from the atria to the ventricles (positive dromotropic effect). The increase in permeability to calcium ions is at least partially responsible for the increase in contractile strength of the cardiac muscle under the influence of sympathetic stimulation (positive inotropic effect), because calcium ions play a powerful role in exciting the contractile process of the myofibrils.
Parasympathetic vagus nerve through the neurotransmitter acetylcholine, acts on muscarinic receptors, greatly increases the permeability of the fiber membranes to potassium ions, which allows rapid leakage of potassium out of the conducting fibers. This causes increased negativity inside the fibers and less steeper of pacemaker potential slope, an effect called hyperpolarization, which makes this excitable tissue much less excitable .
In the sinus node, the state of hyperpolarization decreases the “resting” membrane potential of the sinus nodal fibers to a level considerably more negative than usual, to -65 to -75 millivolts rather than the normal level of -55 to -60 millivolts. Therefore, the initial rise of the sinus nodal membrane potential caused by inward sodium and calcium leakage requires much longer to reach the threshold potential for excitation. This greatly slows the rate of rhythmicity of these nodal fibers (negative chronotropic effect).
In the A-V node, a state of hyperpolarization caused by vagal stimulation makes it difficult for the small atrial fibers entering the node to generate enough electricity to excite the nodal fibers. Therefore, It also delays conduction velocity of the impulse at AV node (negative dromotropic effect). Parasympathetic stimulation has no significant effect on the ventricular muscles. Normally, vagal activity (vagal tone) slows the firing rate of the SA node from its automatic rate of 90 – 120 beats / min to the actual heart rate of about 70 beats / min. Strong vagal stimulation can completely eliminate SA node impulses (sinus arrest) leading to asystole (cardiac standstill) until an ectopic pacemaker begins to function.
1 Dr. Ismail Ibrahim / Almustansirya college of /physiology department / C.V.S.
9
1 Dr. Ismail Ibrahim / Almustansirya college of /physiology department / C.V.S.
10
The mechanical events of the cardiac cycle
: The heart as a pump:
A single cycle of cardiac activity can be divided into two basic phases – diastole[ relaxation] and systole.[ contraction].
Function of the atria as pumps:[ Atrial diastole& systole] The propagated action
potential precedes atrial contraction. The specialized interatrial tracts that carries the
excitation between the atria allows the two atria to contract almost simultaneously.
Blood normally flows continually from the great veins into the atria and about 70% of
this flows pass directly through the atria into the ventricles[ atrial diastole]
[ passive movement ].
Then, atrial contraction[ systole] causes an additional 20-30% filling of the ventricles
[ active movement].
The pressure in the right atrium is called the central venous pressure (CVP) and is
measured clinically from the level of the column of blood in the neck veins (jugular
veins) while the subject is reclining at an angle of about 45o where the heart and the
sternal angle (manubrium sterni) are at the same level. Normally at this position the
mean level will be invisible because it is below the clavicle, but some slight pulsation
may appear above the clavicle. At this level, the CVP is close to atmospheric pressure.
CVP can be measured accurately by inserting a catheter through the veins into the right
atrium. This catheter can then be connected to an appropriate pressure measuring
apparatus. CVP is decreased during inspiration (negative pressure breathing) and shock.
It is increased by expiration (positive pressure breathing), expansion of blood volume,
and heart failure.
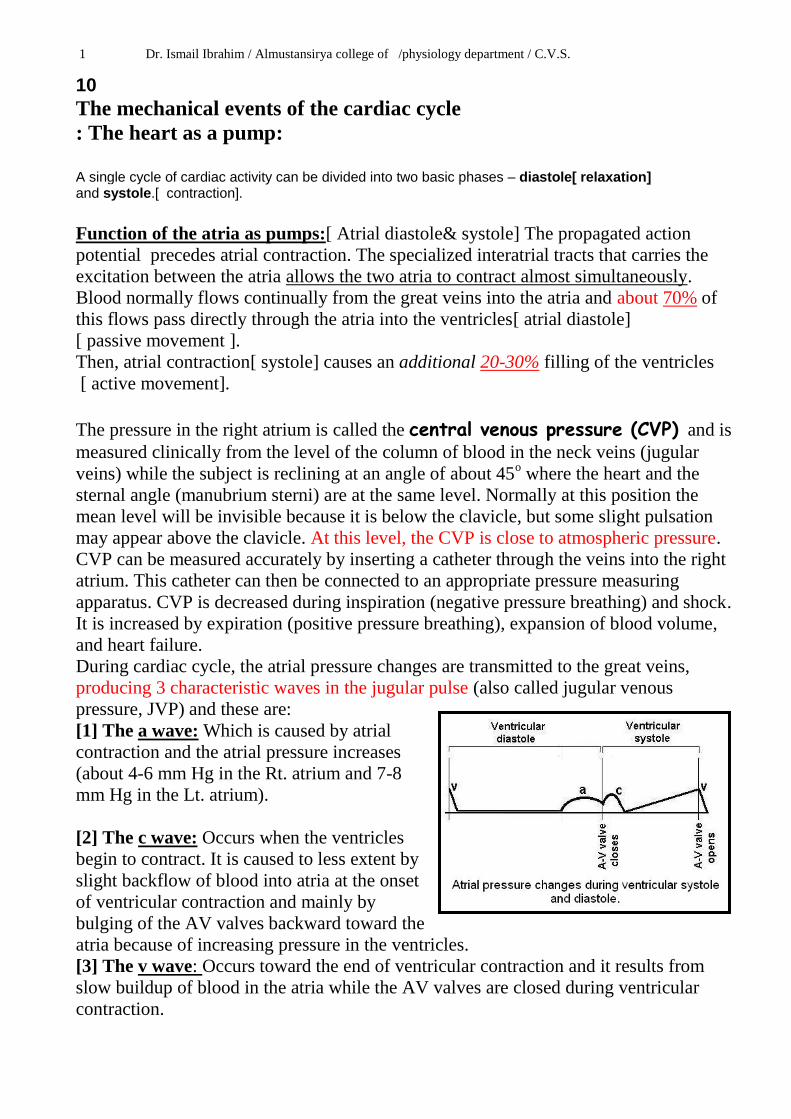
During cardiac cycle, the atrial pressure changes are transmitted to the great veins,
producing 3 characteristic waves in the jugular pulse (also called jugular venous
pressure, JVP) and these are:
[1] The a wave: Which is caused by atrial
contraction and the atrial pressure increases
(about 4-6 mm Hg in the Rt. atrium and 7-8
mm Hg in the Lt. atrium).
[2] The c wave: Occurs when the ventricles
begin to contract. It is caused to less extent by
slight backflow of blood into atria at the onset
of ventricular contraction and mainly by
bulging of the AV valves backward toward the
atria because of increasing pressure in the ventricles.
[3] The v wave: Occurs toward the end of ventricular contraction and it results from
slow buildup of blood in the atria while the AV valves are closed during ventricular
contraction.

1 Dr. Ismail Ibrahim / Almustansirya college of /physiology department / C.V.S.
11
Function of the ventricles as pumps: [1] Filling of the ventricles: Filling of ventricles during diastole can be divided into
three periods of time: A. rapid filling of Ventricles, B. Diastasis , C. Atrial contraction
[A] In the first third of ventricular diastolic time, the high pressure in the atria
immediately push the AV valves open and allow blood to flow rapidly into the
ventricles. This period of time is called the rapid filling of the ventricles.[ 70%- 80%]
[B] During the middle third of ventricular diastolic time only a small amount of blood
normally flows into the ventricles. This is the blood that continues to empty into the
atria from the veins and passes on through the atria directly into the ventricles [diastasis.
[C] During the last third of ventricular diastolic time, the atria contract and give an
additional 20%-30% of the filling of the ventricle during each cardiac cycle.
At the end of ventricular diastole, filling of the ventricles normally increases the
volume of each ventricle to about 120 to 130 ml. This volume is known as the end-
diastolic volume which is the volume of blood in the ventricle just before the onset of
ventricular contraction. When large amounts of blood flow into the ventricles during
diastole, their end-diastolic volume can become as great as 150 to 170 ml in the normal
heart. Filling of the ventricle is associated with intraventricular pressure changes from 0
mm Hg at the beginning of ventricular filling to about 12 mm Hg in the left ventricle
and 5 mm Hg in the right ventricle (end-diastolic pressure) at the end of ventricular
filling (i.e. at end-diastolic volume of about 120-130 mL) during ventricular diastole.
Above this volume, the end-diastolic pressure does increase rapidly, partly because of
fibrous tissue in the heart that will stretch no more, and partly because the pericardium
that surrounds the heart become stretched to near its limit.[ phase A-Bin diagram].
: Periods of ventricular filling.

1 Dr. Ismail Ibrahim / Almustansirya college of /physiology department / C.V.S.
12
[2] Emptying of the ventricles: Shortly after the QRS complex begins,
ventricular systole starts and the pressure in the ventricular cavities increases.
[A] Period of isovolumetric contraction: Immediately after ventricular contraction
begins, the ventricular pressure
abruptly rises causing the AV valves
to close, the ventricular chambers are
sealed from both the atria and the
arteries. The ventricular volume
during this time remains constant
(isovolumic) and the intraventricular
pressure rises to about 80 mm Hg.
[ phase B-C in diagram]
[B] Period of ejection: When the
ventricular pressure exceeds the
pressure in aortic and pulmonary
arteries, it forces the aortic and
pulmonary valves (semilunar valves)
to open and ventricular ejection
begins.
Right ventricular ejection occurs
before left ventricular ejection,
because the pressure in the pulmonary artery is low compared with that in the aorta.
When the left ventricular pressure rises slightly above 80 mm Hg and the right
ventricular pressure slightly above 8 mm Hg, the ventricular pressures now push the
semilunar valves open. Immediately, blood begins to pour out of the ventricles, with
about 70% of the emptying occurring during the first third of the period of ejection
(period of rapid ejection) and the remaining 30% during the next two thirds (period of
slow ejection).
As the ventricles empty during systole, the ventricular volume decreases about 70 ml,
which is called the stroke volume output. The work of the heart performed on each
beat is called stroke work .
The fraction of the end-diastolic volume that is ejected is called ejection fraction, it
equals to the percentage of the stroke volume divided by the end-diastolic volume
[Ejection fraction = Stroke volume / End-diastolic volume X 100% ] and it is usually
about [ 55- 75%].
The remaining volume in each ventricle at the end of ejection is about 50 to 60 ml and
is called the end-systolic volume. When the heart contracts strongly, the end-systolic
volume can fall to as little as 10 to 30 ml. Therefore, by both increasing the end-
diastolic volume and decreasing the end systolic volume, the stroke volume output can
be increased to more than double normal.
End-diastolic volume (120 mL) = Stroke volume output (70 mL) + End-systolic volume
(50 mL) [ phase C-E in diagram].
: Pressure-volume changes during ventricular systole.
1 Dr. Ismail Ibrahim / Almustansirya college of /physiology department / C.V.S.
13
[C] Period of isovolumetric relaxation: At the end of systole, ventricular relaxation
begins suddenly, allowing the intraventricular pressures to fall rapidly back to the
diastolic pressure level of about 0 mm Hg.. The elevated pressure in the distended large
arteries immediately push blood back toward the ventricles, which snaps the aortic and
pulmonary valves closed. For another 0.03 to 0.06 sec, the ventricular muscle continues
to relax, even though the ventricular volume does not change, giving rise to period of
isovolumetric relaxation. During this period the intraventricular pressures fall rapidly
back to their very low diastolic levels. Then the AV valves open to begin a new cycle of
ventricular pumping.[ phase E-A in diagram].
Cardiac output (CO) = heart rate x stroke volume CO = 70 beats/min x 70 ml/beat = 4900 ml/min i.e. about 5 liters/min
Therefore, each minute the right ventricle normally pumps 5 liters of blood through the lungs, and the left ventricle pumps 5 liters through the systemic circulation. During exercise, cardiac output can increase to 20 to 25 liters per minute, and outputs as high as 40 liters per minute have been recorded in trained athletes during heavy endurance-type exercise. The difference between the cardiac output at rest and the maximum volume of blood the heart can pump per minute is called the cardiac reserve.
Cardiac output varies widely with the level of activity of the body. Therefore the level of body metabolism, exercise, age and size of the body influence the cardiac output. Therefore cardiac output is a variable parameter usually it is not less than 5 liter/min; at rest to supply the body with oxygen and to maintain normal BMR (basal metabolic rate). Cardiac index: It is the cardiac output (CO) per square meter (m2) of body surface area, as the CO increases in proportion to the surface area of the body for e.g.; human being of 70 kg body weight has a body surface area 1.7 m2, which means that the normal average cardiac index for adults is about 3 liters/min/m2 of body surface area.

1 Dr. Ismail Ibrahim / Almustansirya college of /physiology department / C.V.S.
14
Regulation of the cardiac output. The regulation of cardiac output depends on the control of both heart rate and stroke volume (figure 7.23). [A] Regulation of Stroke Volume: Mathematically, stroke volume (SV) represents the difference between end diastolic volume (EDV), the amount of blood that collects in a ventricle at the end of diastole, and end systolic volume (ESV), the volume of blood remaining in a ventricle after it has contracted.
Therefore, SV = EDV – ESV. Although many factors affect SV by altering EDV or ESV, the three most
important are preload, contractility, and afterload. [1] Preload: Degree of stretch of heart muscle (EDV) (intrinsic control): The degree to which cardiac muscle cells are stretched just before they contract, which is called the preload, controls stroke volume. In a normal heart, the higher the preload, the higher the stroke volume will be. This relationship between preload and stroke volume is called the Frank-Starling law of the heart (figure 7.24). This is because cardiac cells (unlike skeletal muscles fibers) are normally shorter than optimal length. As a result, stretching cardiac cells can produce dramatic increases in contractile force. The Frank-Starling principle describes the relationship between SV and EDV. Increased diastolic filling produces greater stretch of heart muscle, resulting in a larger SV. The mechanism involves more optimal overlap between the thin and thick muscle filaments as preload increases and increased sensitivity of troponin C to Ca2+ as cardiac muscle is stretched. End-diastolic volume is the most important determinant of SV. Outputs from the left and right sides of the
Figure 7.23: Factors affect cardiac output.
Figure 7.24: The Frank-Starling principle of the relationship between SV and EDV.

1 Dr. Ismail Ibrahim / Almustansirya college of /physiology department / C.V.S.
heart are also equalized as a result of the Frank-Starling principle because the output of one side becomes the venous return of the other side.
The most important two factors that determine the degree of stretching of cardiac muscle are the venous return and ventricular filling time.
Venous return is the amount of blood returning to the heart and distending its ventricles. It is an intrinsic control of stroke volume. Anything that increases the volume or speed of venous return, increases EDV and consequently SV. An example of that is exercise. Exercise speeds venous return because both increased sympathetic nervous system activity (causes venoconstriction and shifting more blood to the right atrium) and the squeezing action of the skeletal muscles compress the veins (decreasing the volume of blood they contain) and returning more blood to the heart (figure 7.25). During vigorous exercise, SV may double as a result of increased venous return. Conversely, low venous return, such as might result from severe blood loss or an extremely rapid heart rate, decreases EDV, causing the heart to beat less forcefully (because of less stretching of cardiac muscle fibers) and lowering SV. Preload can be quickly increased at the bedside by placing the patient in the Trendelenburg position (supine with the head lower than the feet), as well as by using drugs and intravenous fluids. Interventions that increase preload are often used to improve cardiac output, but this is not always beneficial. A change in posture from a supine to a standing position causes an initial decrease in central venous pressure because gravity causes an accumulation of blood in the veins of the lower limbs. As we inhale, abdominal pressure increases, squeezing local veins and forcing blood toward the heart. At the same time, the pressure in the chest decreases, allowing thoracic veins to expand and speeding blood entry into the right atrium. Reduced thoracic venous blood volume results in a decrease in venous return and, therefore, in a decrease in the cardiac output and systemic arterial pressure.
Increased ventricular filling time such as a slow heart rate (allows more time for ventricular filling) increases EDV and, consequently, SV and contraction force.
Figure 7.25: Effect of exercise on venous return.

1 Dr. Ismail Ibrahim / Almustansirya college of /physiology department / C.V.S.
16 [2] Contractility: It is an extrinsic control of stroke volume. Contractility is defined as the contractile strength (tension) achieved at a given muscle length. It is independent of muscle stretch and EDV. Contractility rises when more Ca2+ enters the cytoplasm from the extracellular fluid and the SR. Enhanced contractility means more blood is ejected from the heart (greater SV), hence a lower ESV. The factors that affect contractility are:
Autonomic nervous system: Increased sympathetic stimulation increases contractility as well as the venous return (due to vasoconstriction of the arteries and veins) (figure 7.26). As mentioned before, sympathetic fibers serve not only the conduction system but the entire heart. One effect of norepinephrine or epinephrine binding is to initiate a cyclic AMP second messenger system that increases Ca2+ entry, which in turn promotes more cross bridge binding and enhances ventricular contractility.
Parasympathetic stimulation from the vagus nerves has little or no effect on cardiac contractility. This is because vagal innervation of the ventricles is very little. However, under strong parasympathetic stimulation or after the administration of drugs that mimic the actions of ACh, the ventricles contract less forcefully (negative inotropic effect), the ejection fraction decreases, and the ESV becomes larger. The primary effect of acetylcholine (ACh) is at the membrane surface, where it produces hyperpolarization and inhibition. As a result, the force of cardiac contractions is reduced. The atria show the greatest changes in contractile force.
Chemical substances also influence contractility. Substances that increase contractility are called positive inotropic agents (epinephrine, thyroxine, and glucagon; the drug digitalis; and high levels of extracellular Ca2+). Substances that deccrease contractility are called negative inotropic agents (hyp oxia,
Figure 7.27: Ventricular pressure-volume relationship at normal and high afterload.
Figure 7.26: Sympathetic stimulation effect on the SV.

1 Dr. Ismail Ibrahim / Almustansirya college of /physiology department / C.V.S.
17 excess H+, rising extracellular K+ levels, and drugs called calcium channel blockers, quinidine, procainamide, and barbiturates).
[3] After load: The afterload is the amount of tension that the contracting ventricle must produce to force open the semilunar valve and eject blood. Afterload increases with increased resistance to blood flow out of the ventricle. The greater the afterload, the longer the period of isovolumetric contraction, the shorter the duration of ventricular ejection, the larger the ESV, and the smaller SV (figure 7.27). In other words, as the afterload increases, the stroke volume decreases. It is essentially the back pressure that arterial blood exerts on the aortic and pulmonary valves (about 80 mm Hg in the aorta and 10 mm Hg in the pulmonary trunk). In healthy individuals, afterload is not a major determinant of stroke volume because it is relatively constant. However , in people with hypertension (high blood pressure), afterload is important indeed because it reduces the ability of the ventricles to eject blood. Consequently, more blood remains in the heart after systole, increasing ESV and reducing stroke volume (figure 7.28). [B] Regulation of heart rate: Factors that increase heart rate are called positive chronotropic factors, and those that decrease HR are negative chronotropic factors. These are: [A] Autonomic nervous system regulation of heart rate: This is achieved by cardiacceleratory center which exerts the most important extrinsic controls affecting heart rate. When the sympathetic nervous system is activated, sympathetic nerve fibers release norepinephrine at their cardiac synapses. As a result (see figure 7.11 the SA node fires more rapidly and the heart responds by beating faster. The higher heart rate is supposed to reduce the SV by reducing ventricular filling time, when the heart beats faster, there is less time for ventricular filling and so a lower EDV. This is not
Figure 7.28: Summary of the factors that affect SV.

1 Dr. Ismail Ibrahim / Almustansirya college of /physiology department / C.V.S.
18 happening because sympathetic stimulation also enhances contractility. The enhanced contractility lowers ESV, so SV does not decline as it would if only heart rate increased. The main factors that affect the heart rate through autonomic nervous system are:
Higher brain centers: When emotional or physical stressors (such as fright, anxiety, or exercise) activate the sympathetic nervous system.
Low-pressure baroreceptors (atrial “Bainbridge” reflex) is an autonomic reflex initiated by atrial stretch receptors (low-pressure baroreceptors). As the venous return increases, atrial filling is increased and stretching the atrial walls. Stretch receptor in turn signal the medullary control centers to increase the heart rate (tachycardia). Unusually, this tachycardia is mediated by increased sympathetic activity to the sinoatrial node with no fall in parasympathetic activity and consequently increases heart rate. However, the reflex circulatory adjustments initiated by increased discharge from these receptors include vasodilation and a fall in blood pressure in association with an increase in heart rate. This is because the increase in the heart rate (as a result of the atrial Bainbridge reflex) is associated with an increase in blood pressure which is detected by the high-pressure baroreceptors causing reflex inhibition of VMC and consequently vasodilatation and reduction in blood pressure. Bainbridge Reflex is involved in respiratory sinus arrhythmia. During inhalation intrathoracic pressure decreases. It triggers increased venous return which is registered by the atrial stretch receptors, which via Bainbridge reflex increases the heart rate momentarily during inspiration.
The high-pressure baroreceptors which respond to changes in systemic blood pressure. When blood pressure is decreased, the baroreceptor reflex stimulates sympathetic nervous system to increase heart rate.
When sensory input from various parts of the cardiovascular system activates either division of the autonomic nervous system more strongly, the other division is temporarily inhibited. The Bainbridge reflex and the baroreceptor reflex act differently to control heart rate. When blood volume is increased, the Bainbridge reflex (through low-pressure baroreceptors) is dominant (increase heart rate); when blood volume is decreased, the high-pressure baroreceptor reflex is dominant (increase heart rate).
Peripheral chemoreceptors: A decline in oxygen concentrations or an increase in carbon dioxide levels and [H+] generally stimulates cardioacceleratory center through peripheral chemoreceptors to increase heart rate and the ventricular muscle contraction (contractility) and at the same time, the cardioinhibitory center is inhibited.
[B] Chemical regulation of heart rate: Chemicals normally present in the blood and other body fluids may influence heart rate, particularly if they become excessive or deficient.

1 Dr. Ismail Ibrahim / Almustansirya college of /physiology department / C.V.S.
19
Hormones: Epinephrine, liberated by the adrenal medulla during sympathetic nervous system activation, produces the same cardiac effects as norepinephrine released by the sympathetic nerves. It both enhances heart rate and contractility. Thyroxine is a thyroid gland hormone that increases metabolic rate and production of body heat. When released in large quantities, it causes a sustained increase in heart rate. Thyroxine acts directly on the heart but also enhances the effects of epinephrine and norepinephrine.
Ions: Normal heart function depends on having normal levels of intracellular and extracellular ions. Plasma electrolyte imbalances pose real dangers to the heart.
[A] An elevated ECF Ca2+ concentration augments the strength of cardiac contraction by prolonging the plateau phase of the action potential and by increasing the cytosolic concentration of Ca2+ (increases contractility). Contractions tend to be of longer duration, with little time to rest between contractions (increases heart rate due to increase in the steepness of pacemaker potential, see figure 7.9). Some drugs alter cardiac function by influencing Ca2+ movement across the myocardial cell membranes. For example, Ca2+-channel blocking agents, such as verapamil, block Ca2+ influx through the Ca2+ channels during an action potential, reducing the force of cardiac contraction. Other drugs, such as digitalis, increase cardiac contractility by inducing an accumulation of cytosolic Ca2+. In contrast, reduced blood Ca2+ levels (hypocalcemia) decreases contractility and heart rate. Very high Ca2+ levels stops the heart in systole. [B] High or low ECF K+ levels, both conditions result in decreased cardiac muscle excitability and they are particularly dangerous and arise in a number of clinical conditions. Excessive K+ (hyperkalemia) alters electrical activity in the heart by depolarizing the resting potential: about 98% of the body's potassium is found inside cells, with the remainder in the extracellular fluid including the blood. Hyperkalemia causes the heart to become extremely dilated and flaccid and slows the heart rate . it also block conduction of the cardiac impulse from atria to the ventricles through A-V bundle . these effects are caused partially by the fact that a high K concentration in the ECF[ extracellular fluid] decrease the resting membrane potential , i.e become more positive resting membrane potential of the cardiac muscle fibers so , the threshold will be easier to reach, and the heart will reach action potentials spontaneously, they get out of control, fire without a rhythm and lead finally to a cardiac arrest. Hypokalemia does the opposite, makes it more difficult to reach the threshold an the heart pumps slower.
Other factors that regulate heart rate: Age, gender, exercise, and body
temperature also influence HR, although they are less important than neural factors. Exercise raises HR by acting through the sympathetic nervous system. Exercise also
1 Dr. Ismail Ibrahim / Almustansirya college of /physiology department / C.V.S.
20 increases systemic blood pressure and routes more blood to the working
muscles. However, resting HR in the physically fit tends to be substantially lower than in those who are out of condition, and in trained athletes it may be as slow as 40 beats/min. Heat increases HR by enhancing the metabolic rate of cardiac cells. This explains the rapid, pounding heartbeat you feel when you have a high fever and also accounts, in part, for the effect of exercise on HR (remember, working muscles generate heat). Cold directly decreases heart rate.
Methods for measuring cardiac output In animal experiments, cardiac output can be measured using any type of flow meter
( electromagnetic, or ultrasonic flow meter ) which can be placed on the aorta or
pulmonary arteries i.e., blood flow in the root of aorta can be recorded by an
electromagnetic flow meter. In the human, CO is measured by indirect methods that do not require surgery.
Two methods commonly used are:
. The oxygen Fick method.
. The indicator dilution method.
Another method is by Echocardiography; it consists of Ultrasonic waves to the heart.
Such echoes record the ventricular movements, from which both the EDV and ESV and
so the SV can be calculated. The CO then can be measured be multiplying the SV X
HR . its either two or three dimensional echocardiogram.
Myocardial energy metabolism:
. Although the weight of the heart mass represents merely 1 % of the body weight (in
adults), the myocardium consumes app, 10 % of the total body oxygen consumption.
Cardiac muscle is adapted to be highly resistant to fatigue: it has a large number of
mitochondria, enabling continuous aerobic respiration via oxidative phosphorylation,
numerous myoglobins (oxygen-storing pigment) and a good blood supply, which
provides nutrients and oxygen. The heart is so tuned to aerobic metabolism that it is
unable to pump sufficiently in ischaemic conditions. At basal metabolic rates, about 1%
of energy is derived from anaerobic metabolism. This can increase to 10% under
moderately hypoxic conditions, but, under more severe hypoxic conditions, not enough
energy can be liberated by lactate production to sustain ventricular contractions.[3]
Under basal aerobic conditions, 60% of energy comes from fat (free fatty acids and
triglycerides), 35% from carbohydrates (primarily as glucose), and 5% from amino
acids and ketone bodies.
ATP is the immediate source of energy for all energy-requiring processes in the heart.
Compared with other tissues, the myocardium contains a low concentration of ATP.
The low cardiac muscle ATP concentration is buffered by the much larger concentration
of phosphocreatine which regenerates ATP continuously from ADP under the effect of
creatine kinase enzyme (Phosphocreatine + ADP ATP + creatine). Therefore,

1 Dr. Ismail Ibrahim / Almustansirya college of /physiology department / C.V.S.
21
cardiac muscle does not undergo fatigue. When a region of heart muscle is oxygen-
starved (as during a heart attack), the ischemic cells (ischemic = blood deprived) begin
to metabolize anaerobically, producing lactic acid. The rising H+ level that results raises
intracellular Ca2+, damaging mitochondria and hindering cardiac cells’ ability to
produce ATP. High levels of intracellular H+ and Ca2+ also cause the gap junctions
(which are usually open) to close, isolating the damaged cells and forcing action
potentials to find alternate routes to the cardiac cells beyond them. This may lead to
fatal arrhythmias.
Regeneration of heart muscle cells
Until recently, it was commonly believed that cardiac muscle cells could not be
regenerated. However, a study reported in the April 3, 2009 issue of Science contradicts
that belief. Olaf Bergmann and his colleagues at the Karolinska Institute in Stockholm
tested samples of heart muscle from people born before 1955 when nuclear bomb
testing caused elevated levels of radioactive carbon 14 in the Earth's atmosphere. They
found that samples from people born before 1955 did have elevated carbon 14 in their
heart muscle cell DNA, indicating that the cells had divided after the person's birth. By
using DNA samples from many hearts, the researchers estimated that a 20-year-old
renews about 1% of heart muscle cells per year and about 45 percent of the heart muscle
cells of a 50-year-old were generated after he or she was born.
Heart sounds: Closure of the heart valves is associated with audible sounds (no sounds occur when
the valves open). The cause of the heart sounds is the vibration of blood, adjacent blood
vessels, and heart chambers associated with closure of the heart valves or movement of
the blood through heart valves. The loudness of the heart sounds is almost directly
proportional to the rate of change of the pressure differences across the valves.
Normally, there are four heart sounds. Two of them are normally heard by
diaphragm of stethoscope or recorded by phonocardiogram (consists of microphone
and electrical amplification circuit) during each cardiac cycle, and these are the first
and second heart sound.
[1] The first is slightly prolonged (0.15 sec), low-pitched “lub” (first sound, or S1),
caused by vibrations set up by the sudden closure of the mitral and tricuspid valves at
the start of ventricular systole (at isovolumertic ventricular contraction).
[2] The second is a shorter (0.12 sec), high-pitched “dup” (second sound, or S2),
caused by vibrations associated with closure of aortic and pulmonary valves just after
the end of ventricular systole (at isovolumertic ventricular relaxation). The interval
between aortic and pulmonary valve closure during inspiration is frequently long
enough for the S2 to be heard as if it is two sounds very close to each other. This is
called physiological splitting of S2,because during inspiration the filling of the left
ventricl is reduce due to the blood will tend to pool in the pulmonary vein as a result the
aortic valve closes earlier than pulmonary valve leading to splitting of the sound, during
expiration ventricular filling equalizes so the aortic and pulmonary valves close
simultaneously leading to a single sound.

1 Dr. Ismail Ibrahim / Almustansirya college of /physiology department / C.V.S.
22
[3] third sound (S3) .
it occurs at the beginning of diastole after S2 and is lower in pitch than S1 or S2 as it is
not of valvular origin. The third heart sound is benign in youth, some trained athletes,
and sometimes in pregnancy but if it re-emerges later in life it may signal cardiac
problems like a failing left ventricle as in dilated congestive heart failure (CHF). S3 is
thought to be caused by the oscillation of blood back and forth between the walls of the
ventricles initiated by blood rushing in from the atria.
[4] fourth sound (atrial heart sound, or S4)
S4 when audible in an adult is called a presystolic gallop or atrial gallop. This gallop
is produced by the sound of blood being forced into a stiff/hypertrophic ventricle. "ta-lub-dub" or "a-stiff-wall sometimes heard immediately before the first sound when atrial pressure is high or the
ventricle is stiff in conditions such as ventricular hypertrophy. It is due to ventricular
filling by the atrial contraction and is rarely heard in normal adults.heard by bell of
stethoscope. [ S4--- S1--- S2--- S3],
An abnormal sounds can be heard in various parts of vascular system and these
sounds are called murmurs [heard in the heart because valvular problem [ stenosis or
incomptence] and bruits [heard over the stenosed blood vessels] .Turbulent blood flow
is the cause for the production of such sounds (laminar blood flow is silent). Murmurs
can be heard when there is a valvular narrowing (stenosis) or incompetent valve
(regurgitation or insufficient). Bruits can be heard over a large, highly vascular goitre.

1 Dr. Ismail Ibrahim / Almustansirya college of /physiology department / C.V.S.
23
Auscultators areas of the heart valves.[ surface anatomy]
1- Mitral valve--- best heard at the cardiac apex.
2- Pulmonary valve --- best heard over the medial end of the second left intercostal
space.
3- Tricuspid valve --- over the left half of the lower end of sternum.
4- Aortic valve--- medial end of 2nd
right inte costal space.
Cardiac investigations.
A- Electrocardiogram (ECG) Electrical activity in the heart recorded with ECG. An ECG can show abnormalities of heart rhythm and can tell if the patient had a heart attack or if his heart has become enlarged or is working under strain. The ECG machine records signals from the patient's body: it does not give electric shocks and does not affect the heart in any way B - Exercise ECG [treadmill]. Is useful in identifying patients with coronary artery disease and exercise induced arrhythmias. C- 24-hour ECG recordings [ Holter ]. 24-hour ECG is commonly used to identify arrhythmias usually in patients presenting with palpitations or syncopal episodes called holter D-Echocardiogram. 1. Echocardiography [Trans- thoracic]. Ultrasound wave is emitted by a probe and reflected by the heart. These echoes are displayed as a picture on a screen, its either B- mode or M- mode. 2.Transoesophageal echocardiography The patient swallows a small probe (mounted at the end of a flexible tube ), so the pictures of the heart are taken from the esophagus .Stress echocardiography The heart is put under stress ( either by exercise or by drugs ), then the echocardiography is performed. This sometimes is useful, when the results of other tests are unclear.

1 Dr. Ismail Ibrahim / Almustansirya college of /physiology department / C.V.S.
24 E-Radionuclide tests . A small, quantity of radioactive substance is injected into the blood, and then a camera that picks up gamma rays is used to make pictures of the heart. Pictures can show, depending on the substance used, size and pumping activities of the heart chambers or the blood flow to the heart muscle. This can be helpful to diagnose coronary heart disease. F-Magnetic Resonance Imaging (MRI). The MRI technique produces detailed pictures using a strong magnetic field. These can be very useful in identifying structural abnormalities in heart. Patients with a pacemaker should therefore not undergo MRI. MRI scans can detect cardiomyopathy or coronary heart disease. G-Cardiac enzyme tests. When the heart muscle is damaged after a heart attack, enzymes are released into the blood (e.g. CPK, CKMB[ creatin kinase). The CPK- and CKMB- levels rise six hours after a heart attack and reach their peaks between 12 and 18 hours later. Troponin 1 or Troponin T Troponin is cardiac proteins which are a specific marker of myocardial damage. Apart from confirming myocardial damage they are useful in identifying individuals with acute coronary syndromes who are at high risk of future adverse cardiac events and need revascularization prior to hospital discharge H-Coronary angiography. Demonstration of the coronary arteries with contrast medium Measuring pressure in the left ventricle with contrast medium Demonstration of the left ventricle with contrast medium
Normal electrocardiogram (ECG):
Electrocardiography (ECG or EKG from the German Elektrokardiogramm) is a transthoracic
(across the thorax or chest) interpretation of the electrical activity of the heart over a period of time, as
detected by electrodes attached to the outer surface of the skin and recorded by a device external to the
body. The recording produced by this noninvasive procedure is termed as electrocardiogram (also
ECG or EKG). An electrocardiogram (ECG) is a test that records the electrical activity of the heart..
You can record the waves of depolarization and repolarization that are generated by the
cardiac muscle. Standard ECG uses 9 electrodes which are used to form 12 leads or
recording axis, the apparatus used is called the electrocardiograph, it is formed basically
of a sensitive galvanometer and an amplifier.

1 Dr. Ismail Ibrahim / Almustansirya college of /physiology department / C.V.S.
25
A standard ECG consists of 12 leads:
3 Bipolar standard limb leads ( I, II, III ).
3 unipolar limb leads (a VR, a VL, a VF ).
The six standard leads look the heart in vertical plane i.e from the sides or the feet
6 unipolar chest leads.--- look the heart from horizontal plane.
Bipolar standard limb leads ( I, II, III ):
These leads record the difference between the potentials in tow limbs, by applying
electrodes usually at the wrist and ankle. The 3 standard bipolar limb leads include ;
Lead I: This records the difference between the potential in the left arm(LA) and that in
the right arm ( RA ). +ve electrode of lead1 located in the left shoulder.
-Lead II: This records the difference the potential in the right arm ( RA ) and that in the
left leg (LL ).+ve electrode of lead II in the left leg.
-Lead III : This records the difference between the potential in the left Leg ( LL ) and
that in the left arm ( LA ).+ve electrode of lead III in the left leg
Lead I is the voltage between the (positive) left arm (LA) electrode and right arm (RA)
electrode:
Lead II is the voltage between the (positive) left leg (LL) electrode and the right arm (RA)
electrode:
Lead III is the voltage between the (positive) left leg (LL) electrode and the left arm (LA)
electrode:
Unipolar Limb Leads [ aVR.aVL,aVF ]
Lead augmented vector right (aVR) has the positive
electrode (white) on the right arm. The negative
electrode is a combination of the left arm (black)
electrode and the left leg (red) electrode, which
"augments" the signal strength of the positive
electrode on the right arm:
1 Dr. Ismail Ibrahim / Almustansirya college of /physiology department / C.V.S.
25
Lead augmented vector left (aVL) has the positive (black) electrode on the
left arm. The negative electrode is a combination of the right arm (white)
electrode and the left leg (red) electrode, which "augments" the signal
strength of the positive electrode on the left arm:
Lead augmented vector foot (aVF) has the positive (red) electrode on the left
leg. The negative electrode is a combination of the right arm (white)
electrode and the left arm (black) electrode, which "augments" the signal of
the positive electrode on the left leg:
The augmented limb leads aVR, aVL, and aVF are amplified in this way because
the signal is too small to be useful when the negative electrode is Wilson's central
terminal. Together with leads I, II, and III, augmented limb leads aVR, aVL, and
aVF form the basis of the hexaxial reference system, which is used to calculate the
heart's electrical axis in the frontal plane. The aVR, aVL, and aVF leads can also
be represented using the I and II limb leads:

1 Dr. Ismail Ibrahim / Almustansirya college of /physiology department / C.V.S.
26
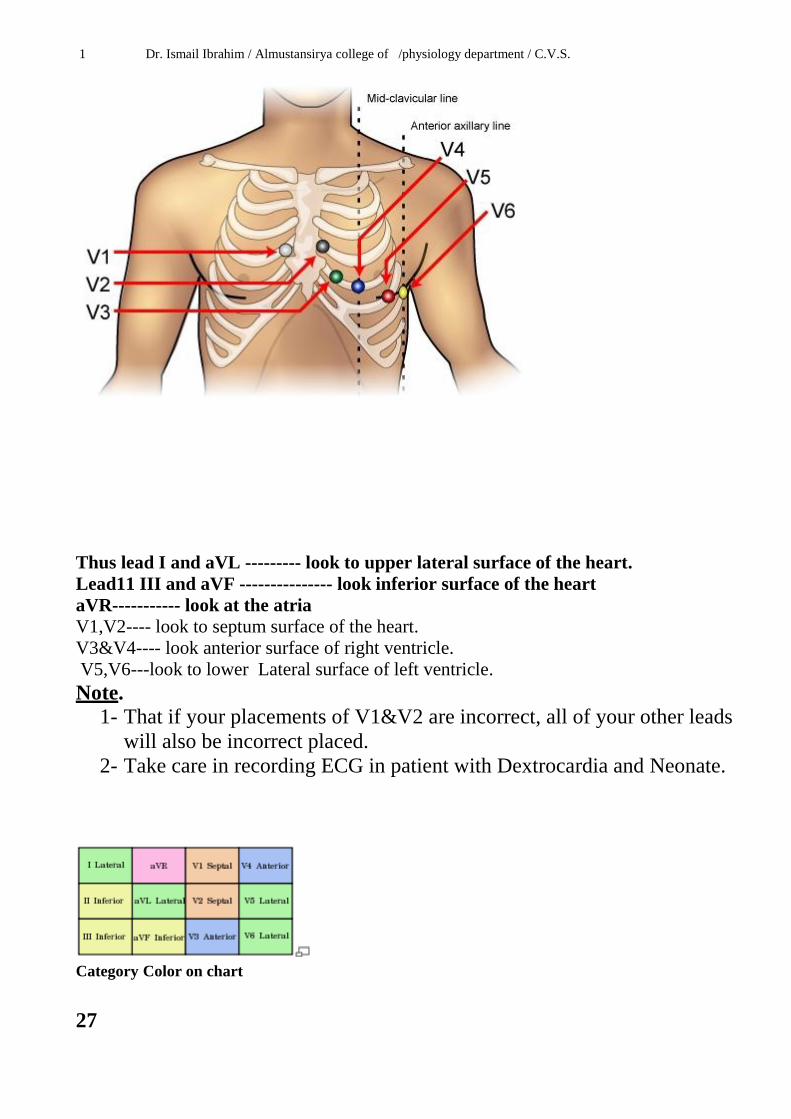
Unipolar chest leads [horizontal plane axes].
Unipolar leads [precordial or chest leads] record the absolute potential at 6 standard
points on the anterior chest wall designated as V1 to V6, the locations of which are as
follows;
V1; at the right margin of the sternum in the 4th
right intercostal space.
V2; at the left margin of the sternum in the 4th
left intercostal space.
V3; midway between V2 and V4,
V4; at the left mid clavicular line in the 5th
intercostal space
V5; at the left anterior axillary line in the 5th
intercostal space .
V6; at the left mid axillary line in the 5th
intercostal space.
The precordial leads look at the heart in a horizontal plane from the front and left sides.
Leads V3,V4 look at the right ventricle and reflect its activity, V1,V2 look at the
interventricular septum and reflect its activity , while leads V5,V6 look at the left
ventricle and reflect its activity .
1 Dr. Ismail Ibrahim / Almustansirya college of /physiology department / C.V.S.
Thus lead I and aVL --------- look to upper lateral surface of the heart.
Lead11 III and aVF --------------- look inferior surface of the heart
aVR----------- look at the atria
V1,V2---- look to septum surface of the heart.
V3&V4---- look anterior surface of right ventricle.
V5,V6---look to lower Lateral surface of left ventricle.
Note.
1- That if your placements of V1&V2 are incorrect, all of your other leads
will also be incorrect placed.
2- Take care in recording ECG in patient with Dextrocardia and Neonate.
Category Color on chart
27

1 Dr. Ismail Ibrahim / Almustansirya college of /physiology department / C.V.S.
28
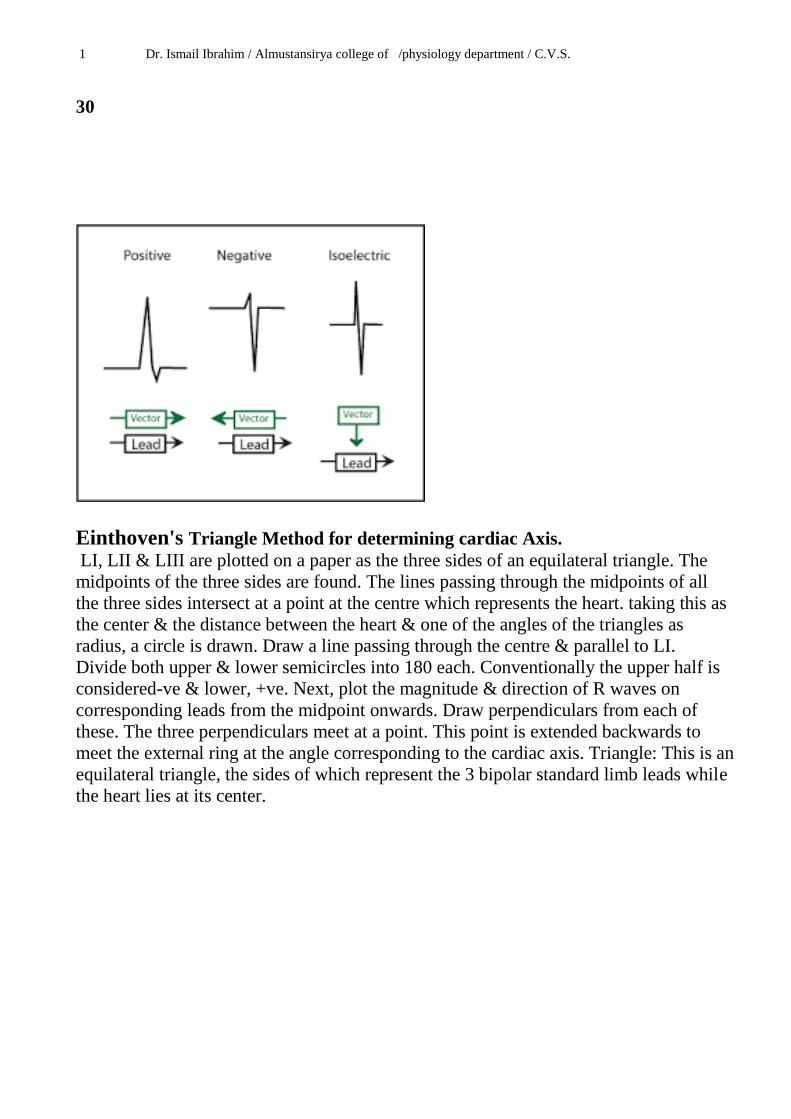
Vectors and Mean Electrical Axis. When the SA node fires, many separate depolarization waves emerge from the SA node
and travel throughout the atria. These separate waves can be depicted as arrows
representing individual electrical vectors. Each one represents action potential
conduction in a different direction.
A mean electrical vector can be derived at that instant by summing the individual
vectors. The direction of the mean electrical vector relative to the axis between the
recording electrodes determines the polarity and magnitude of the recorded voltage.
If the mean electrical vector is pointing toward the positive electrode. The ECG displays
a positive deflection ( positive voltage ). If at some other instant the mean electrical
vector is pointing away from the positive electrode, there is a negative deflection
(negative voltage) If the mean electrical vector is oriented perpendicular to the axis
between the positive and negative electrodes there is no changes in voltage[isoelectric]
The sequence of depolarization within the ventricles showing four different mean
vectors represented different times during depolarization. This model shows the septum
and free walls of the left and right ventricles. Each of the four vectors originated from
the AV node. The size of the vector arrow is related to the mass of tissue undergoing
depolarization. The larger the arrow ( and tissue mass ), the greater the measured
voltage. The electrode placement represents lead II in ECG . Early during ventricular 28

1 Dr. Ismail Ibrahim / Almustansirya college of /physiology department / C.V.S.
29
activation, the interventricular septum depolarizes from left to right as depicted by
mean electrical vector 1. This small vector is heading away from the positive electrode
(to the right of a line perpendicular to the lead axis ) and therefore records a small
negative deflection ( the Q wave of the QRS ). About 20 milliseconds later, the mean
electrical vector points downward toward the apex ( vector 2 ), and heads toward the
positive electrode. This direction gives a very tall, positive deflection ( the R wave of
the QRS ). After another 20 milliseconds, the mean vector is directed toward the left
arm and anterior chest as the free wall of the ventricle depolarizes from the endocardial
( inside ) to epicdial ( outside ) surface ( vector 3). This vector still records a small
positive voltage in lead II and corresponds to a voltage point between the R and S
waves. Finally, the last regions to depolarize result in vector 4, which causes a slight
negative deflection (the S wave) of the QRS because it is pointed away from the
positive electrode [the base of the heart].
T wave represent ventricular repolarization , usually points in the same direction as the
R wave [ positive in most leads ] . this means that depolarization & repolarization don’t
travel in the same direction , in which the wave of repolarization passes from the
outside to the inside of the ventricles . because the cells on the outer surface of the
ventricles have shorter action potentials than those on the inside and begin to repolarize
first .

1 Dr. Ismail Ibrahim / Almustansirya college of /physiology department / C.V.S.
1 Dr. Ismail Ibrahim / Almustansirya college of /physiology department / C.V.S.
30
Einthoven's Triangle Method for determining cardiac Axis.
LI, LII & LIII are plotted on a paper as the three sides of an equilateral triangle. The
midpoints of the three sides are found. The lines passing through the midpoints of all
the three sides intersect at a point at the centre which represents the heart. taking this as
the center & the distance between the heart & one of the angles of the triangles as
radius, a circle is drawn. Draw a line passing through the centre & parallel to LI.
Divide both upper & lower semicircles into 180 each. Conventionally the upper half is
considered-ve & lower, +ve. Next, plot the magnitude & direction of R waves on
corresponding leads from the midpoint onwards. Draw perpendiculars from each of
these. The three perpendiculars meet at a point. This point is extended backwards to
meet the external ring at the angle corresponding to the cardiac axis. Triangle: This is an
equilateral triangle, the sides of which represent the 3 bipolar standard limb leads while
the heart lies at its center.

1 Dr. Ismail Ibrahim / Almustansirya college of /physiology department / C.V.S.
31
Determining the electrical axis from standard lead electrocardiograms.
Clinically, the electrical axis of the heart usually is estimated from the standard bipolar
limb lead electrocardiogram.
After recording the standard leads, one determines the net potential and polarity of the
recordings in leads I and III.
In lead I , the recording is positive, and in lead III, the recording is mainly positive but
negative during part of the cycle.
If any part of a recording is negative, this negative potential is subtracted from the
positive part of the potential to determine the net potential for that lead, as shown by the
arrow to the right of the QRS complex for lead III.
Then each net potential for leads I and III is plotted on the axes of the respective leads,
with the base of the potential at the point of intersection of the axes.
If the net potential of lead I is positive, it is plotted in a positive direction along the
line depicting lead I .
Conversely, if this potential is negative, it is plotted in a negative direction.
Also, for lead III, the net potential is placed with its base at the point of intersection,
and, if positive, it is plotted in the positive direction along the line depicting lead III.
If it is negative, it is plotted in the negative direction.
To determine the vector of the total QRS ventricular mean electrical potential, one
draws perpendicular lines (the dashed lines in the figure) from the apices of leads I and
III, respectively.
The point of intersection of these two perpendicular lines represents, by vectorial
analysis, the apex of the mean QRS vector in the ventricles, and the point of intersection
of the lead I and lead III axes represents the mean vector.

1 Dr. Ismail Ibrahim / Almustansirya college of /physiology department / C.V.S.
32
Therefore, the mean QRS vector is drawn between these two points.
The approximate average potential generated by the ventricles during depolarization is
represented by the length of this mean QRS vector, and the mean electrical axis is
represented by the direction of the mean vector.
Thus, the orientation of the mean electrical axis of the normal ventricles, as determined
is 59 degrees positive ( + 59 degrees ).
Axis deviation The direction of the axis can derived from QRS complex in leads 1, 11, 111 or from
leads 1,11, AVF.
The cardiac vector affects the configuration of the
ECG complexes in the various leads.
The normal direction of the mean ORS vector is
downwards and to the left and is generally between
[-30 to + 90 or + 110degrees.]
Axis deviation occurs if the electric axis of the heart
is beyond the normal range and it may be to the right
or to the left QRS axis further right that of + 110
constitutes Right axis deviation ( RAD), QRS axis
left of – 30 constitutes Left axis deviation (LAD).
i.e the normal 11 o clock – 5 o clock axis means that
the depolarization wave is spreading towards leads 1.
11. &111and is therefore associated with predominantly upward deflection in all.
The deflection will be greater in 11than 1or lead 111

1 Dr. Ismail Ibrahim / Almustansirya college of /physiology department / C.V.S.
33
Right axis deviation :
This normally occurs in vertical hearts ( e.g. in tall slender subjects ), but
pathologically, it is common in right ventricular hypertrophy and right bundle branch
block , chronic lung disease , cor pulmonale . In this case, the projection of the mean
QRS axis is toward the – ve pole in lead I and toward the + ve pole in lead III, so in
ECG, there are deep – ve waves ( S waves ) in lead I and high + ve waves ( R waves )
in lead III.
Lead 1 negative = RAD.
Left axis deviation :
This normally occurs in horizontal hearts ( e.g. in short obese subjects and pregnant
women because mechanical pressure of the fat , causes a rotation of the heart to the left
) but pathologically, it is common in left ventricular hypertrophy e.g in systemic
hypertension and aortic stenosis . In this case, the projection of the mean QRS axis is
toward the +ve pole in lead I and toward the –ve pole in lead III, so in ECG there are
high + ve waves (R waves) in lead III . LEFT AXIS DEVIATION IS NOT
SIGNIFICANT UNTILE THE QRS DEFLECTION IS ALSO PREDOMINANTLY [–
VE] IN LEAD 11
LEAD 111&11 are negative = LAD.
1 Dr. Ismail Ibrahim / Almustansirya college of /physiology department / C.V.S.
34
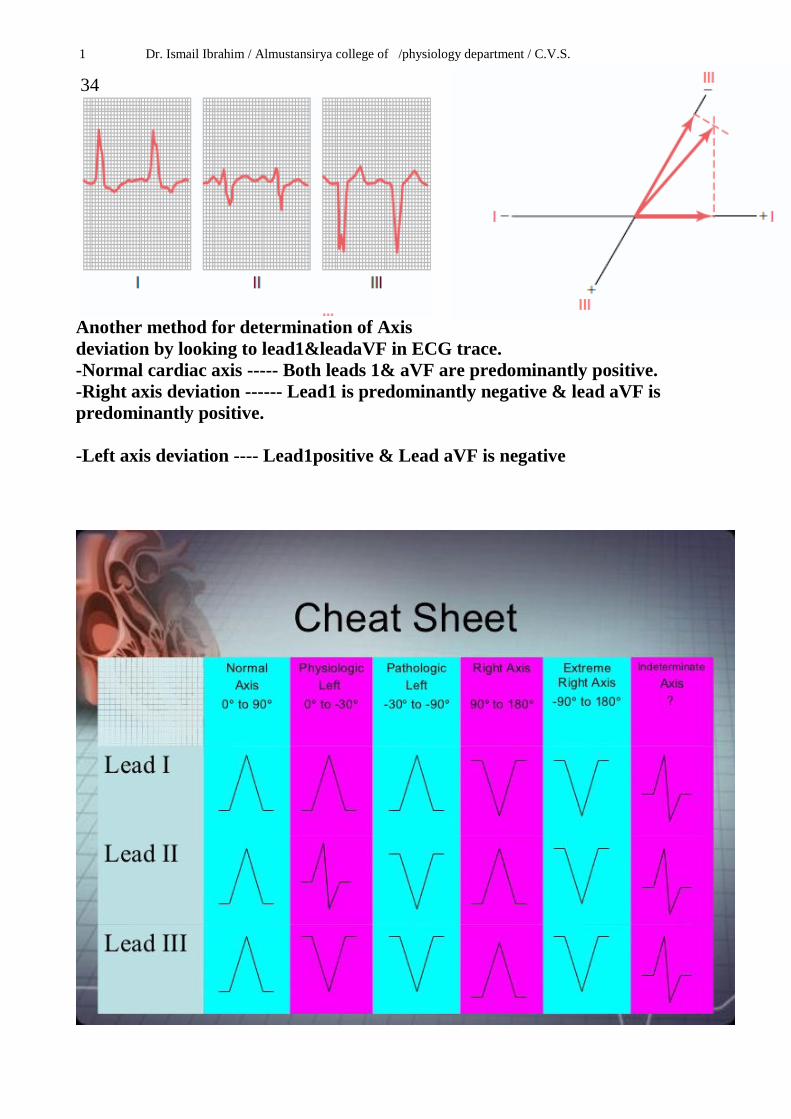
Another method for determination of Axis
deviation by looking to lead1&leadaVF in ECG trace.
-Normal cardiac axis ----- Both leads 1& aVF are predominantly positive.
-Right axis deviation ------ Lead1 is predominantly negative & lead aVF is
predominantly positive.
-Left axis deviation ---- Lead1positive & Lead aVF is negative

1 Dr. Ismail Ibrahim / Almustansirya college of /physiology department / C.V.S.
35
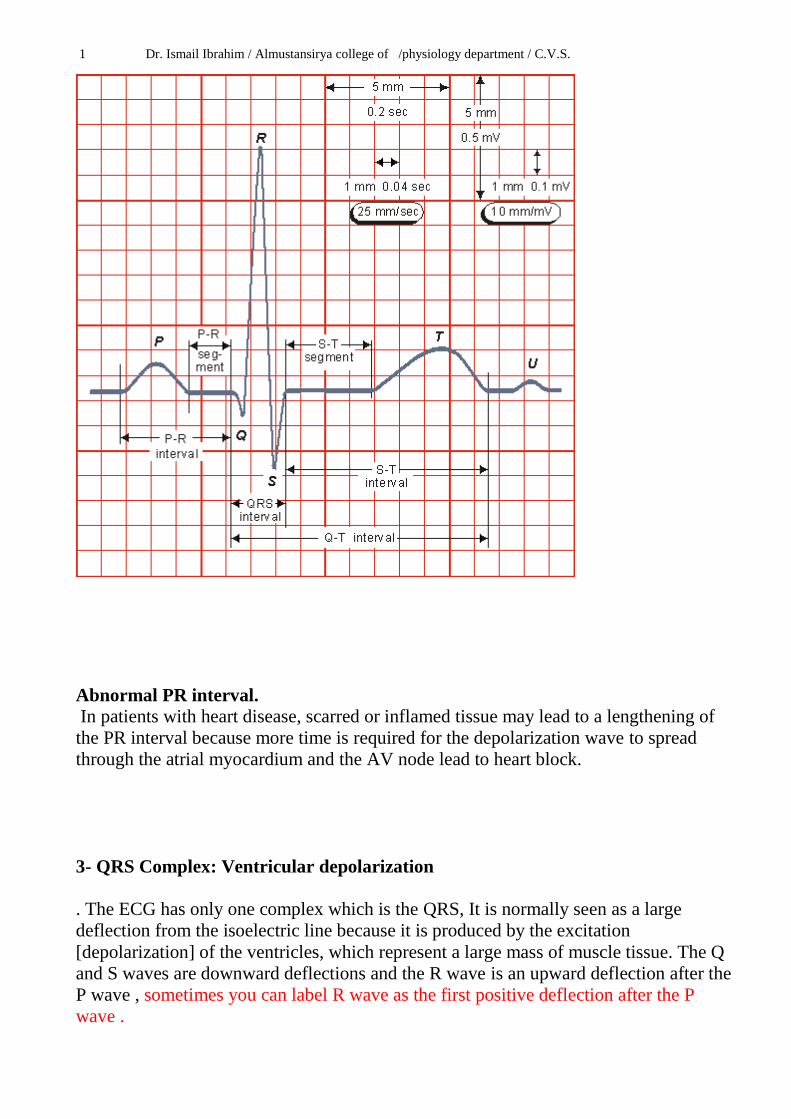
Calibration of the electrocardiograph:
A standard signal of 1mV should move the stylus vertically 1cm [2 large square] so that
a change of 1 mV upward or downward produces a deflection of 10 mm amplitude ( 10
small squares; 2 large squares ), thus each mm between the horizontal lines ( voltage
calibration lines ) equals 0.1 mV. In other words, the thin horizontal lines calibrated at 1
mm interval and the thick horizontal lines at 5 mm intervals. The vertical lines are time
calibration lines in which duration of each mm ( small square ) equals 0.04 second, each
inch ( 2.5 cm ) is 1 second divided into 5 large squares, each large square ( 5 small
squares) represents 0.20 second as each small square = 0.04 second.
i.e each large square is equivalent to 0.2 second.
Each small square is equivalent to0.04 second.

1 Dr. Ismail Ibrahim / Almustansirya college of /physiology department / C.V.S.
36
Calculation of heart rate from ECG paper :
- If the heart rhythm is regular, the heart rate (HR) ran be counted by dividing the
number of large squares between two consecutive R waves into 300 or small squares
into 1500.
Note ; why 300 because = 0.2 second x 300 = 60 second = one minute
Or the heart rate determined by 60 divided by the R-R interval.
1 Dr. Ismail Ibrahim / Almustansirya college of /physiology department / C.V.S.
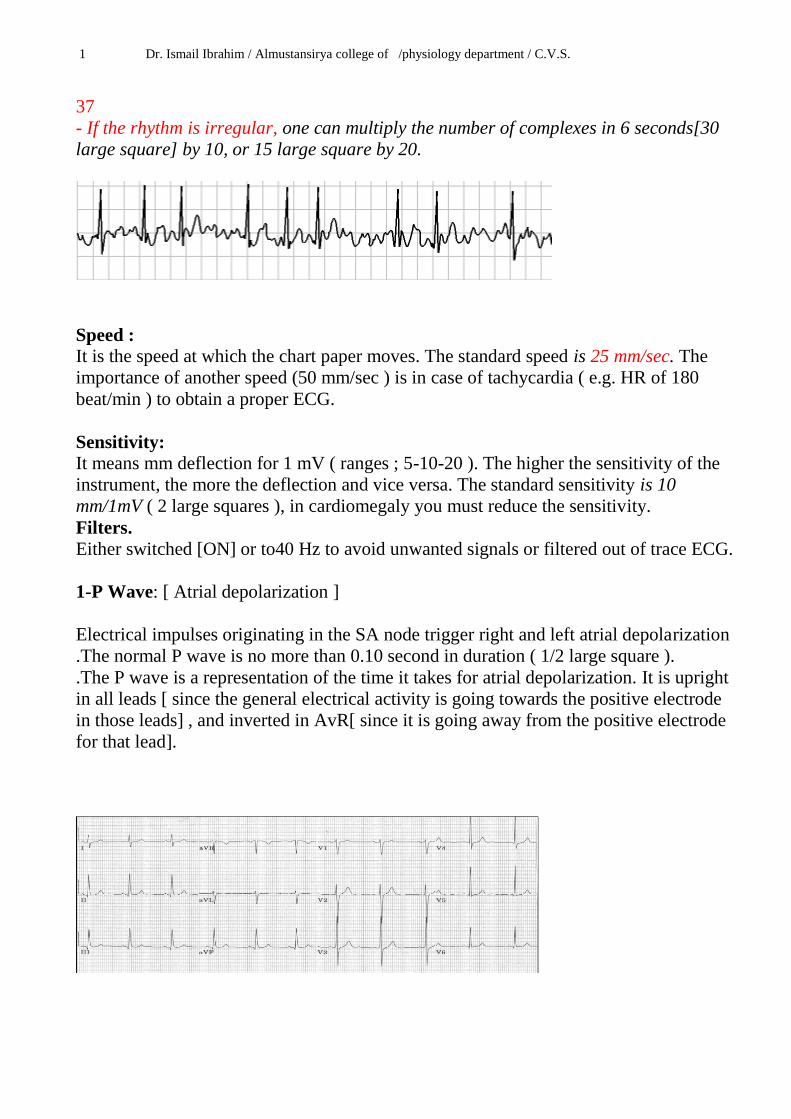
37
- If the rhythm is irregular, one can multiply the number of complexes in 6 seconds[30
large square] by 10, or 15 large square by 20.
Speed :
It is the speed at which the chart paper moves. The standard speed is 25 mm/sec. The
importance of another speed (50 mm/sec ) is in case of tachycardia ( e.g. HR of 180
beat/min ) to obtain a proper ECG.
Sensitivity:
It means mm deflection for 1 mV ( ranges ; 5-10-20 ). The higher the sensitivity of the
instrument, the more the deflection and vice versa. The standard sensitivity is 10
mm/1mV ( 2 large squares ), in cardiomegaly you must reduce the sensitivity.
Filters.
Either switched [ON] or to40 Hz to avoid unwanted signals or filtered out of trace ECG.
1-P Wave: [ Atrial depolarization ]
Electrical impulses originating in the SA node trigger right and left atrial depolarization
.The normal P wave is no more than 0.10 second in duration ( 1/2 large square ).
.The P wave is a representation of the time it takes for atrial depolarization. It is upright
in all leads [ since the general electrical activity is going towards the positive electrode
in those leads] , and inverted in AvR[ since it is going away from the positive electrode
for that lead].

1 Dr. Ismail Ibrahim / Almustansirya college of /physiology department / C.V.S.
38
Note.
Atrial repolarization is not seen on the surface ECG trace because it coincides with the
onset of ventricular depolarization and is therefore hidden within the QRScomplex.
2- PR Interval: means the conduction velocity from ( SA node --to-- AV node
[Normally 3- 5 small squares 0.12- 20ms].
. Since the Q wave is often absent in ECG trace , it is termed the PR interval.
.PR Interval represents the length along the baseline from the beginning of the P wave
to the beginning of the QRS complex [the beginning of ventricular depolarization]
.PR Segment is electrically neutral and it is normally 0.12 to 0.2 seconds in duration.
The isoelectric line [ i.e the part of the record in which there are no measurable
deflection ] between the P wave and the start of the QRS complex [ P-R interval ]
coincidence with depolarization of the AV node , bundle branches, and the purkinje
system.
Atrial contraction occurs during the P-R interval.
1 Dr. Ismail Ibrahim / Almustansirya college of /physiology department / C.V.S.
Abnormal PR interval.
In patients with heart disease, scarred or inflamed tissue may lead to a lengthening of
the PR interval because more time is required for the depolarization wave to spread
through the atrial myocardium and the AV node lead to heart block.
3- QRS Complex: Ventricular depolarization
. The ECG has only one complex which is the QRS, It is normally seen as a large
deflection from the isoelectric line because it is produced by the excitation
[depolarization] of the ventricles, which represent a large mass of muscle tissue. The Q
and S waves are downward deflections and the R wave is an upward deflection after the
P wave , sometimes you can label R wave as the first positive deflection after the P
wave .
1 Dr. Ismail Ibrahim / Almustansirya college of /physiology department / C.V.S.
39
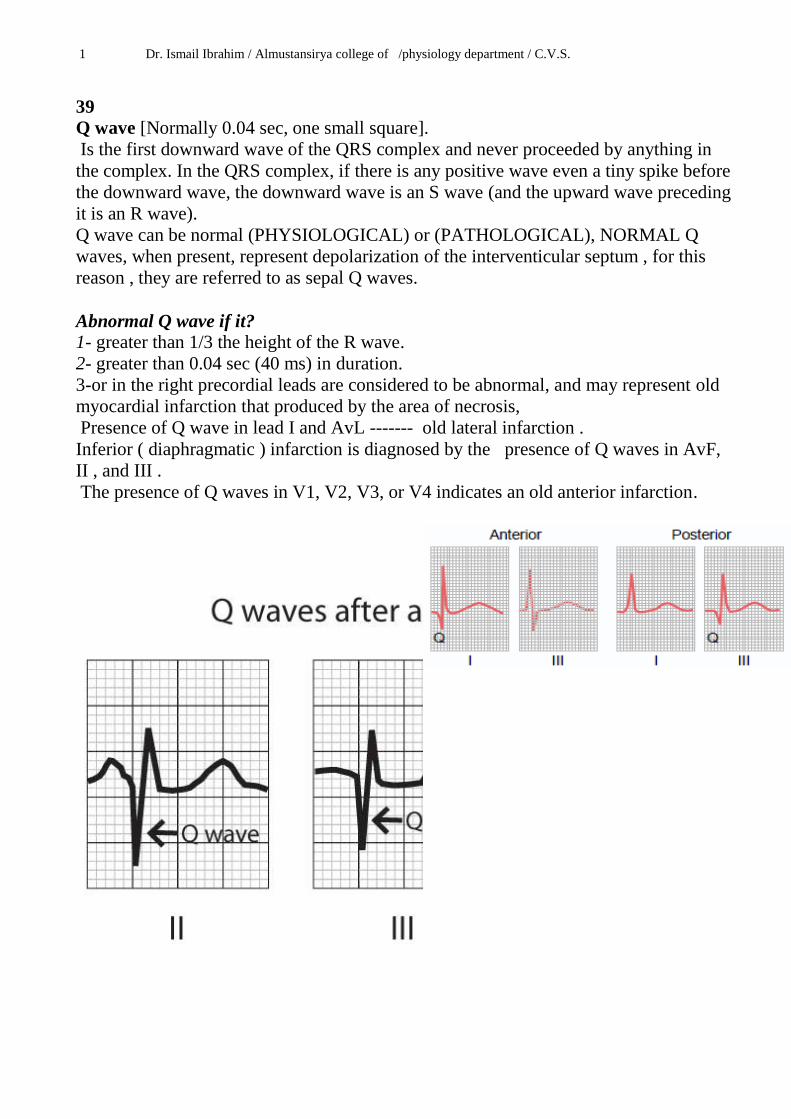
Q wave [Normally 0.04 sec, one small square].
Is the first downward wave of the QRS complex and never proceeded by anything in
the complex. In the QRS complex, if there is any positive wave even a tiny spike before
the downward wave, the downward wave is an S wave (and the upward wave preceding
it is an R wave).
Q wave can be normal (PHYSIOLOGICAL) or (PATHOLOGICAL), NORMAL Q
waves, when present, represent depolarization of the interventicular septum , for this
reason , they are referred to as sepal Q waves.
Abnormal Q wave if it?
1- greater than 1/3 the height of the R wave.
2- greater than 0.04 sec (40 ms) in duration.
3-or in the right precordial leads are considered to be abnormal, and may represent old
myocardial infarction that produced by the area of necrosis,
Presence of Q wave in lead I and AvL ------- old lateral infarction .
Inferior ( diaphragmatic ) infarction is diagnosed by the presence of Q waves in AvF,
II , and III .
The presence of Q waves in V1, V2, V3, or V4 indicates an old anterior infarction.

1 Dr. Ismail Ibrahim / Almustansirya college of /physiology department / C.V.S.
40
R wave.
The first deflection of the QRS is called the R wave (regardless the leads).
Most of the left ventricles activated during the R wave in leadsV5 and V6.
Normally it is considered normal if it is not higher than 25 mm ( 5 large squares).
The normal duration QRS is 0.04 to 0.10 seconds wide ( up to 2.5 small squares).
The R wave in the precordial leads must grow from V1 to at least V4 (See Below)
The S wave in the precordial leads must grow from V1 to at least V3 and disappear in V6. (See Below)
Top blue line indicates the R wave
Bottom blue line indicates the S wave
1 Dr. Ismail Ibrahim / Almustansirya college of /physiology department / C.V.S.
41
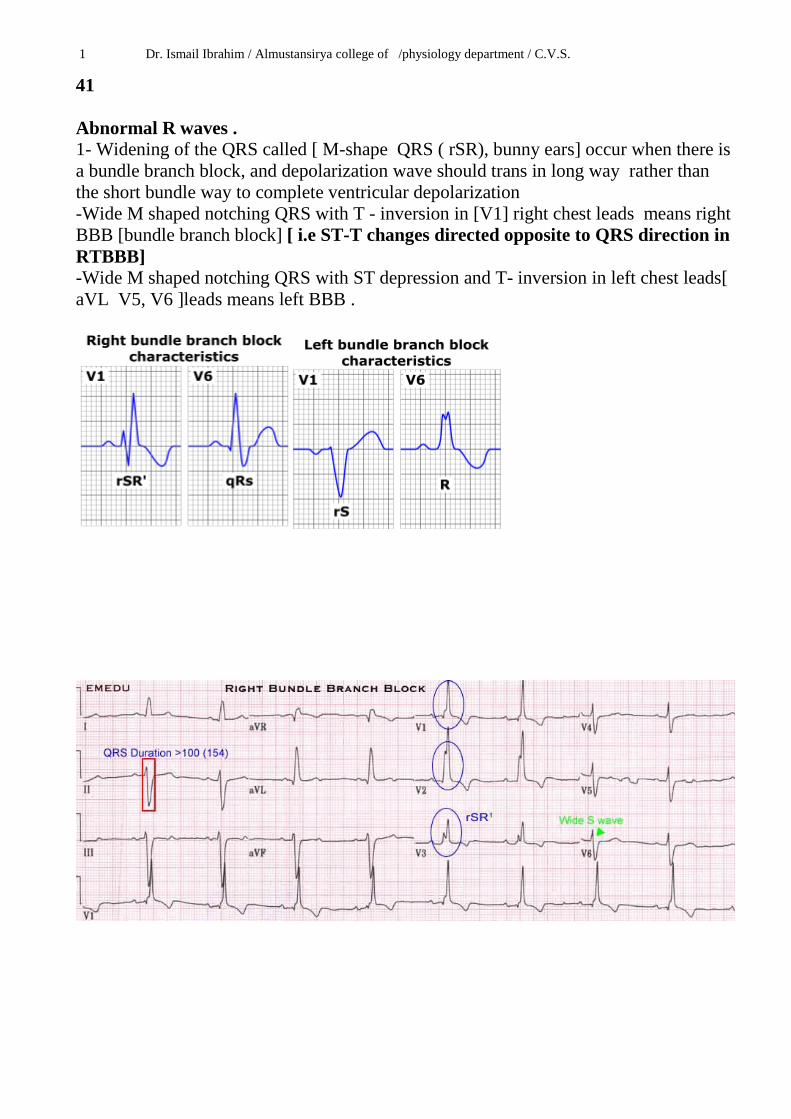
Abnormal R waves .
1- Widening of the QRS called [ M-shape QRS ( rSR), bunny ears] occur when there is
a bundle branch block, and depolarization wave should trans in long way rather than
the short bundle way to complete ventricular depolarization
-Wide M shaped notching QRS with T - inversion in [V1] right chest leads means right
BBB [bundle branch block] [ i.e ST-T changes directed opposite to QRS direction in
RTBBB]
-Wide M shaped notching QRS with ST depression and T- inversion in left chest leads[
aVL V5, V6 ]leads means left BBB .

1 Dr. Ismail Ibrahim / Almustansirya college of /physiology department / C.V.S.
Tall R wave[ more than 25 mm high]with ST depression in V5 &V6 mean left
ventricular hypertrophy (LVH).
Dominant R waves with ST depression and T- inversion in right chest leads [V1 V2
V3], with deep S waves in left chest leads suggest right ventricular hypertrophy [ RVH]
42

1 Dr. Ismail Ibrahim / Almustansirya college of /physiology department / C.V.S.
S wave.
The S wave is any downward deflection following the R wave.
The S wave in leads V5 &V6 will represent the right ventricular depolarization .
An abnormal large downward S wave in leads V5 & V6 may indicate hypertrophy of
the right ventricle.
The high R wave in V6 ( as in LVH) will be shown mostly by a downwardly deflected
S wave in lead V1.
ST Segment
. Is the length between the end of the S wave of the QRS complex and the beginning of
the T wave.
. It is electrically neutral i.e. lies on the isoelectric line.
. Usually compared with the level of PR segment in order to identify any ST segment
deviation from the isoelectric line [more than1mm up or down from isoelectric line
consider abnormal ].
Upward ( ST segment elevation )----------- mean myocardial infarctions [ occurs when
a coronary artery supplying the ventricle become occluded]
Downward ( ST segment depression )------- mean Angina Pectoris [ occurs when the
heart muscle does not get as much blood and oxygen as it needs causes chest pain that
last for less than 30 min, usually radiated to the left shoulder or to the neck ] drug
treatment may include the use of nitroglycerine ( vasodilator drug ) and anticoagulants
43

1 Dr. Ismail Ibrahim / Almustansirya college of /physiology department / C.V.S.
T wave [ventricular repolarization].
. Ventricular repolarization which follows ventricular depolarization is represented by
the T wave.
. Its shape is rounded and taller and wider than the P wave.
Presents as a positive deflection 5-10mm in height usually points in the same direction
as the R wave (+ve in most leads). This means that depolarization & repolarization
don’t travel in the same direction , however the T wave is normally inverted in AVR
&in V1 [ and in V2 in young people, and in V3 in some Negroes ].
The contraction of the ventricles last from the beginning of the Q wave and continues
to the end of the T wave. This intervals called the Q-T interval and last about 0.35 sec 44
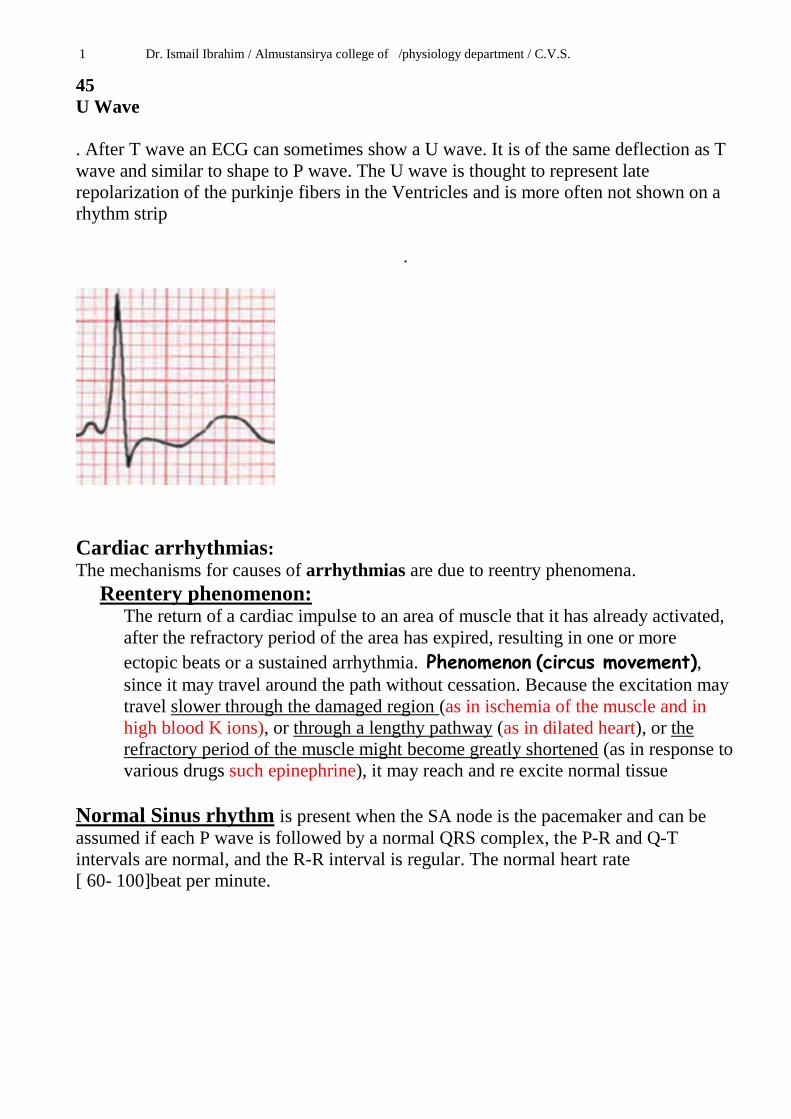
1 Dr. Ismail Ibrahim / Almustansirya college of /physiology department / C.V.S.
45
U Wave
. After T wave an ECG can sometimes show a U wave. It is of the same deflection as T
wave and similar to shape to P wave. The U wave is thought to represent late
repolarization of the purkinje fibers in the Ventricles and is more often not shown on a
rhythm strip
.
Cardiac arrhythmias:
The mechanisms for causes of arrhythmias are due to reentry phenomena.
Reentery phenomenon: The return of a cardiac impulse to an area of muscle that it has already activated,
after the refractory period of the area has expired, resulting in one or more
ectopic beats or a sustained arrhythmia. Phenomenon (circus movement), since it may travel around the path without cessation. Because the excitation may
travel slower through the damaged region (as in ischemia of the muscle and in
high blood K ions), or through a lengthy pathway (as in dilated heart), or the
refractory period of the muscle might become greatly shortened (as in response to
various drugs such epinephrine), it may reach and re excite normal tissue
Normal Sinus rhythm is present when the SA node is the pacemaker and can be
assumed if each P wave is followed by a normal QRS complex, the P-R and Q-T
intervals are normal, and the R-R interval is regular. The normal heart rate
[ 60- 100]beat per minute.
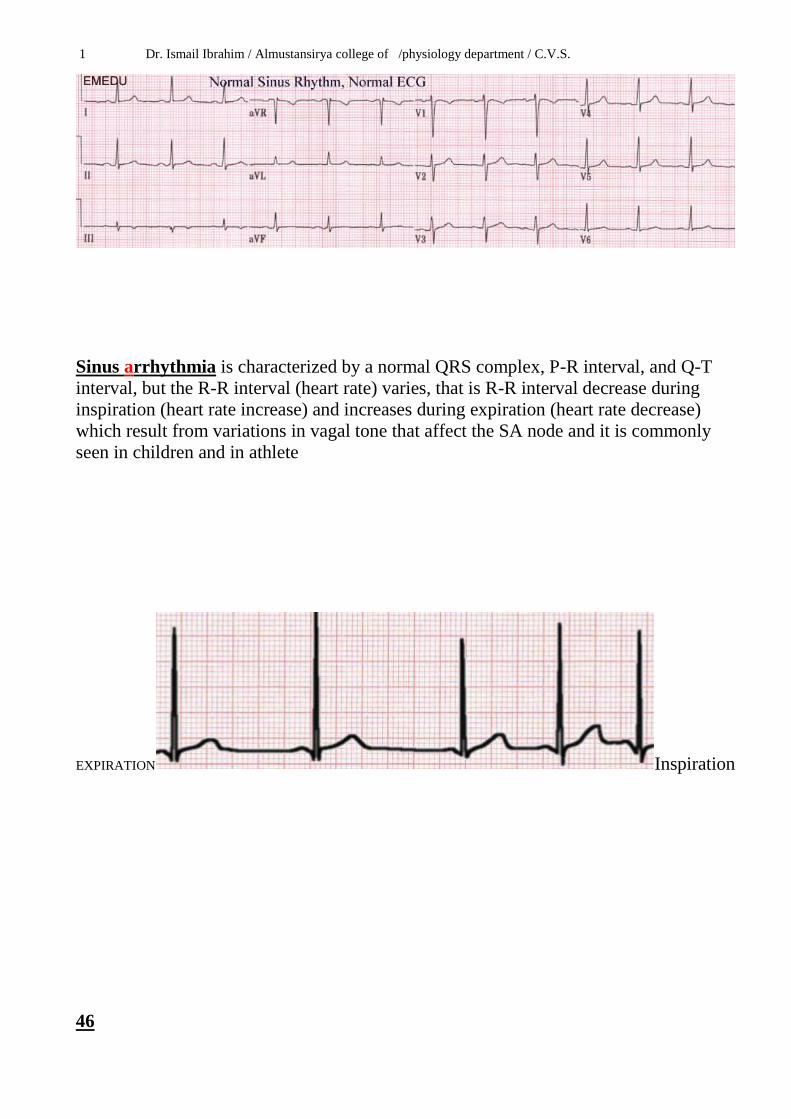
1 Dr. Ismail Ibrahim / Almustansirya college of /physiology department / C.V.S.
Sinus arrhythmia is characterized by a normal QRS complex, P-R interval, and Q-T
interval, but the R-R interval (heart rate) varies, that is R-R interval decrease during
inspiration (heart rate increase) and increases during expiration (heart rate decrease)
which result from variations in vagal tone that affect the SA node and it is commonly
seen in children and in athlete
EXPIRATION Inspiration
46
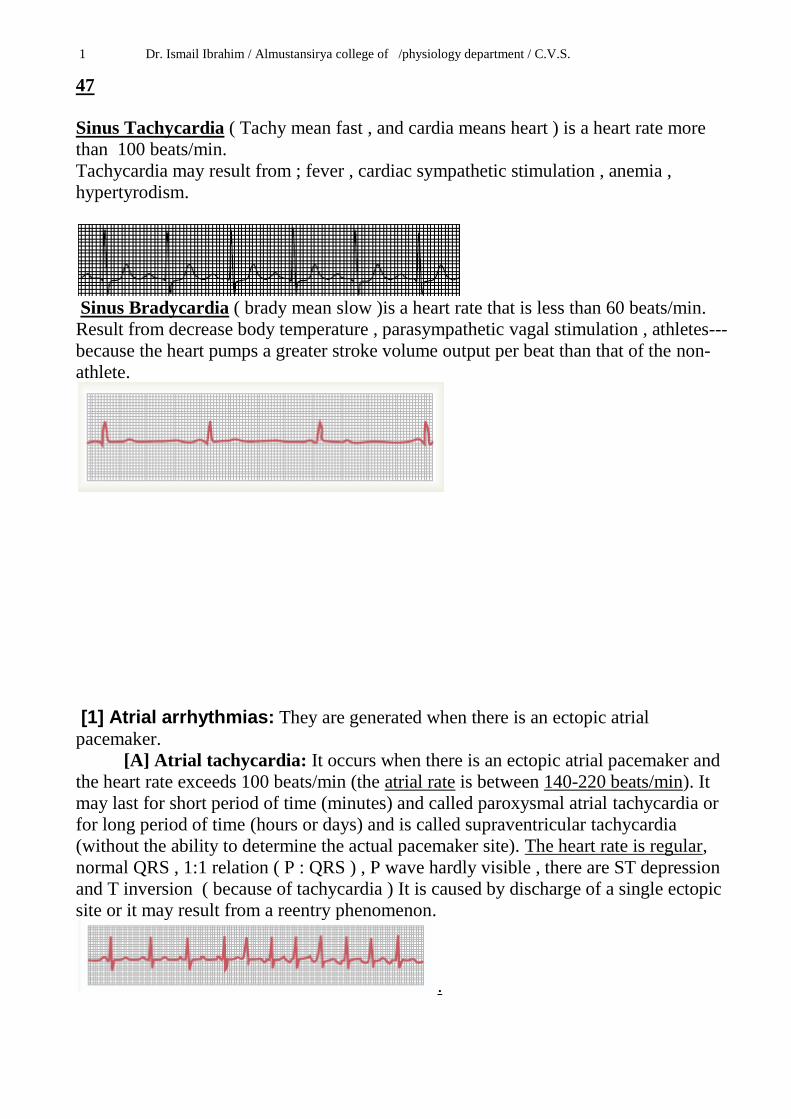
1 Dr. Ismail Ibrahim / Almustansirya college of /physiology department / C.V.S.
47
Sinus Tachycardia ( Tachy mean fast , and cardia means heart ) is a heart rate more
than 100 beats/min.
Tachycardia may result from ; fever , cardiac sympathetic stimulation , anemia ,
hypertyrodism.
Sinus Bradycardia ( brady mean slow )is a heart rate that is less than 60 beats/min.
Result from decrease body temperature , parasympathetic vagal stimulation , athletes---
because the heart pumps a greater stroke volume output per beat than that of the non-
athlete.
[1] Atrial arrhythmias: They are generated when there is an ectopic atrial
pacemaker.
[A] Atrial tachycardia: It occurs when there is an ectopic atrial pacemaker and
the heart rate exceeds 100 beats/min (the atrial rate is between 140-220 beats/min). It
may last for short period of time (minutes) and called paroxysmal atrial tachycardia or
for long period of time (hours or days) and is called supraventricular tachycardia
(without the ability to determine the actual pacemaker site). The heart rate is regular,
normal QRS , 1:1 relation ( P : QRS ) , P wave hardly visible , there are ST depression
and T inversion ( because of tachycardia ) It is caused by discharge of a single ectopic
site or it may result from a reentry phenomenon.
.
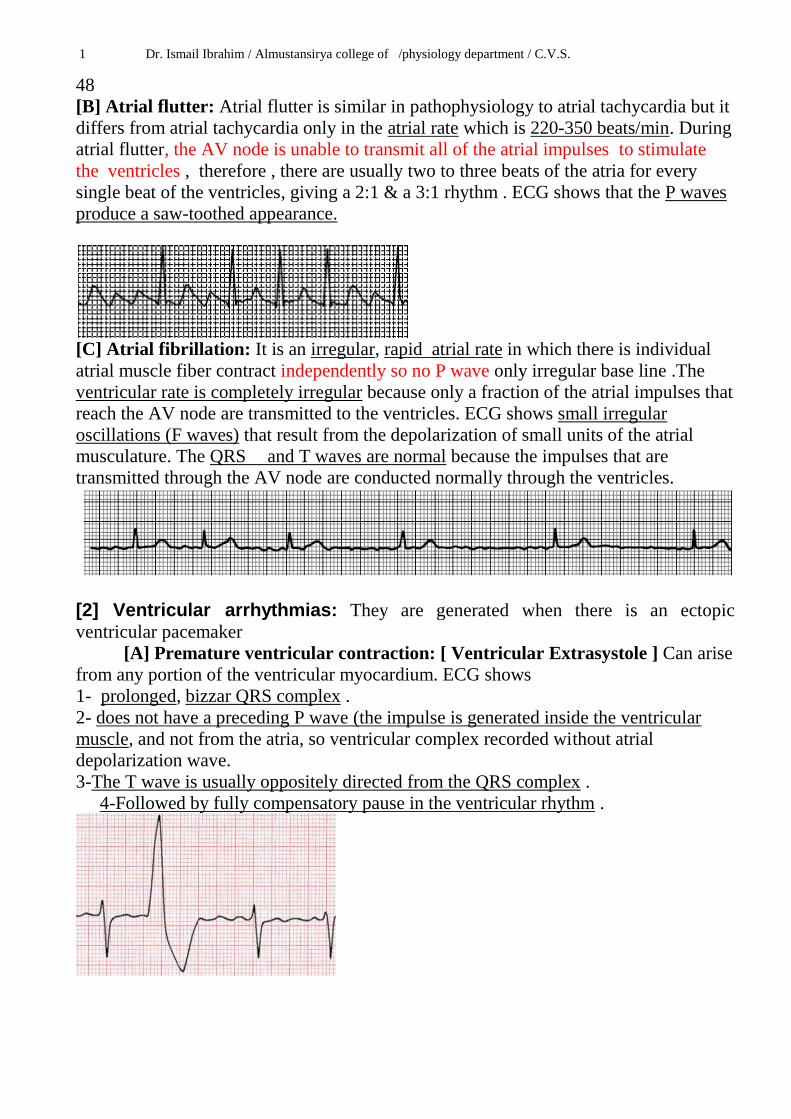
1 Dr. Ismail Ibrahim / Almustansirya college of /physiology department / C.V.S.
48
[B] Atrial flutter: Atrial flutter is similar in pathophysiology to atrial tachycardia but it
differs from atrial tachycardia only in the atrial rate which is 220-350 beats/min. During
atrial flutter, the AV node is unable to transmit all of the atrial impulses to stimulate
the ventricles , therefore , there are usually two to three beats of the atria for every
single beat of the ventricles, giving a 2:1 & a 3:1 rhythm . ECG shows that the P waves
produce a saw-toothed appearance.
[C] Atrial fibrillation: It is an irregular, rapid atrial rate in which there is individual
atrial muscle fiber contract independently so no P wave only irregular base line .The
ventricular rate is completely irregular because only a fraction of the atrial impulses that
reach the AV node are transmitted to the ventricles. ECG shows small irregular
oscillations (F waves) that result from the depolarization of small units of the atrial
musculature. The QRS and T waves are normal because the impulses that are
transmitted through the AV node are conducted normally through the ventricles.
[2] Ventricular arrhythmias: They are generated when there is an ectopic
ventricular pacemaker
[A] Premature ventricular contraction: [ Ventricular Extrasystole ] Can arise
from any portion of the ventricular myocardium. ECG shows
1- prolonged, bizzar QRS complex .
2- does not have a preceding P wave (the impulse is generated inside the ventricular
muscle, and not from the atria, so ventricular complex recorded without atrial
depolarization wave.
3-The T wave is usually oppositely directed from the QRS complex .
4-Followed by fully compensatory pause in the ventricular rhythm .

1 Dr. Ismail Ibrahim / Almustansirya college of /physiology department / C.V.S.
49
[B] Ventricular Tachycardia.
From ventricular site, usually as a result of a reentry phenomenon.
Alterations in vagal tone (by carotid sinus massage or Valsalva maneuver) do not affect
ventricular tachycardias because the ventricles do not receive any efferent vagal
innervation. ECG shows wide, bizzar QRS complexes occurring at a rapid rate. The P
waves are usually indistinguishable, although the SA node activity continues
independently of the ventricles.
[C] Ventricular fibrillation: Ventricular muscle fibers contract independently so no
QRS .It results from rapid, irregular, ineffective contractions of small segments of the
ventricular myocardium. The peripheral pulse is absent and cardiac output is
zero,because fibrillating ventricles are not able to pump or to fill blood and rapid fall of
blood pressure is occure. ECG shows undulating waves of varying frequency and
amplitude. It is a fatal condition unless the patient is treated by direct current (DC)
shock (i.e defibrillation or cardioversion).

1 Dr. Ismail Ibrahim / Almustansirya college of /physiology department / C.V.S.
50
[3] Conduction arrhythmias:
AV nodal block:
Two forms of heart block.
1-The incomplete type (first – degree &second degree).
2-Complete type ( third –degree heart block )
First-degree AV nodal block: It is a prolongation of the P-R interval beyond 0.21 sec .
It may be caused by increased vagal tone and in other diseases.
Third-degree (complete) AV nodal block: It occurs when the AV node fails to transmit
all of the atrial impulses causing the atria and ventricles to beat at independent rates , i.e
complete dissociation between P &QRS.

1 Dr. Ismail Ibrahim / Almustansirya college of /physiology department / C.V.S.

1 Dr. Ismail Ibrahim / Almustansirya college of /physiology department / C.V.S.