Embed Size (px)
Citation preview
Working Paper 358March 2014
The Health Financing Transition: A Conceptual Framework and Empirical Evidence
Abstract
Almost every country exhibits two important health financing trends: health spending per person rises and the share of out-of-pocket spending on health services declines. We describe these trends as a “health financing transition” to provide a conceptual framework for understanding health markets and public policy. Using data over 1995-2009 from 126 countries, we examine the various explanations for changes in health spending and its composition with regressions in levels and first differences. We estimate that the income elasticity of health spending is about 0.7, consistent with recent comparable studies. Our analysis also shows a significant trend in health spending - rising about 1 percent annually - which is associated with a combination of changing technology and medical practices, cost pressures and institutions that finance and manage healthcare. The out-of-pocket share of total health spending is not related to income, but is influenced by a country’s capacity to raise general revenues. These results support the existence of a health financing transition and characterize how public policy influences these trends.
JEL Codes: I14, I15
Keywords: public health, health finance.
www.cgdev.org
Victoria Fan and William Savedoff
The Health Financing Transition: A Conceptual Framework and Empirical Evidence
Victoria FanCenter for Global Development
William SavedoffCenter for Global Development
CGD is grateful for contributions from the UK Department for International Development and the William and Flora Hewlett Foundation in support of this work.
Victoria Fan and William Savedoff. 2014. "The Health Financing Transition: A Conceptual Framework and Empirical Evidence." CGD Working Paper 358. Washington, DC: Center for Global Development.
http://www.cgdev.org/publication/publication/health-financing-transition-conceptual-framework-and-empirical-evidence-working-paper
Center for Global Development2055 L Street., NW
Fifth FloorWashington, DC 20036
202.416.4000(f ) 202.416.4050
www.cgdev.org
The Center for Global Development is an independent, nonprofit policy research organization dedicated to reducing global poverty and inequality and to making globalization work for the poor. Use and dissemination of this Working Paper is encouraged; however, reproduced copies may not be used for commercial purposes. Further usage is permitted under the terms of the Creative Commons License.
The views expressed in CGD Working Papers are those of the authors and should not be attributed to the board of directors or funders of the Center for Global Development.
Contents 1. Introduction .................................................................................................................................. 1
2. The Health Financing Transition: A Conceptual Framework .............................................. 2
2.1. What is the health financing transition? ........................................................................... 2
2.2. Determinants of total health expenditures ...................................................................... 5
2.3. Determinants of out-of-pocket spending ........................................................................ 8
3. Methods......................................................................................................................................... 8
3.1. Data ....................................................................................................................................... 8
3.2. Estimation strategy ............................................................................................................ 10
4. Results ......................................................................................................................................... 13
4.1. Total health spending and its components.................................................................... 13
4.2. The out-of-pocket share of total health spending ........................................................ 18
5. Conclusions ................................................................................................................................ 21
References ....................................................................................................................................... 23

1
1. Introduction Most countries seem to manifest two basic health spending trends over time: health spending per person increases and the share of health spending that is paid out-of-pocket declines. An extensive literature examines the determinants of the first trend – growing health expenditures – and finds that the major factors are rising income; changes in medical technology and practices; population aging; higher prices; and changes in the financing and management of healthcare. In contrast, very little attention has been paid to macro-level explanations for the second trend – the declining share of out-of-pocket health expenditures – though political scientists and historians have written extensively on the factors behind public policies that contribute to this pattern.
This paper proposes that these trends should be considered together as a “health financing transition” (de Ferranti, 2007; Savedoff et al., 2012), analogous to the demographic and epidemiologic transitions (see Chesnais (1993), Omran (1971), and Savedoff et al. (2012)). As with the demographic and epidemiologic transitions, the health financing transition is neither inevitable nor universal but it is widespread. Like the other two transitions, countries begin the health financing transition at different times, move through it at different paces, and sometimes may even undergo reversals. Economic, political and technological factors move countries through this transition, with public policies that expand pooled funding (through subsidised provision or mandatory insurance) playing a particularly important role.
The health financing transition has significant implications for public health, equity, and growth. Increasing real resources and buying more health care for more people have contributed to better population health including in developing countries (Bokhari, Gai, & Gottret, 2007; Moreno-Serra & Smith, 2012). But it is the composition of spending and how it is spent that affects its efficiency and equity. Institutions which pool funding from large groups of people and manage health care spending on their behalf are not necessarily efficient, but they do appear to be a necessary condition for both improving the efficiency and equity of health care coverage. At a minimum, people living in countries with institutions for pooling health spending and limiting out-of-pocket health expenditures are less likely to be impoverished by health care costs particularly in certain Latin American countries and countries in transition (Xu et al., 2007).
This paper begins by describing the health financing transition and identifying some common patterns. Second, it reviews the literature on the determinants of total health spending and out-of-pocket health spending. Third, using data for 126 countries from 1995 to 2009, the paper analyses the determinants of health spending and its composition, testing whether the health financing transition is observed on average in this relatively short time period.
2
2. The Health Financing Transition: A Conceptual Framework
2.1. What is the health financing transition?
The health financing transition describes the major shift that most countries experience from an early period in which health spending is low and primarily out-of-pocket to a later period in which health spending is high and primarily pooled. Before the 19th century, health financing mostly involved individuals compensating healers, midwives and doctors out-of-pocket. Financial innovations emerged later, such as communities experimenting with paying caregivers on retainer and guilds pooling members’ contributions to create insurance funds (Savedoff & Smith, 2011). Broader social and political change has led most countries to adopt prominent roles for government in promoting the expansion of non-governmental insurance institutions, establishing government-run insurance funds, or creating publicly-financed healthcare services.
These institutional changes in health financing are also related to economic and technological changes. Rising productivity has increased incomes, allowing households to spend more on healthcare services and providing a larger tax base for government programs. Technological change also drives increased health spending, creating new services that help maintain or improve health. The decline in the out-of-pocket share, however, is driven primarily by the process of incorporating more people into pooled health financing arrangements, whether as insurance enrolees or as citizens eligible for publicly-provided care.
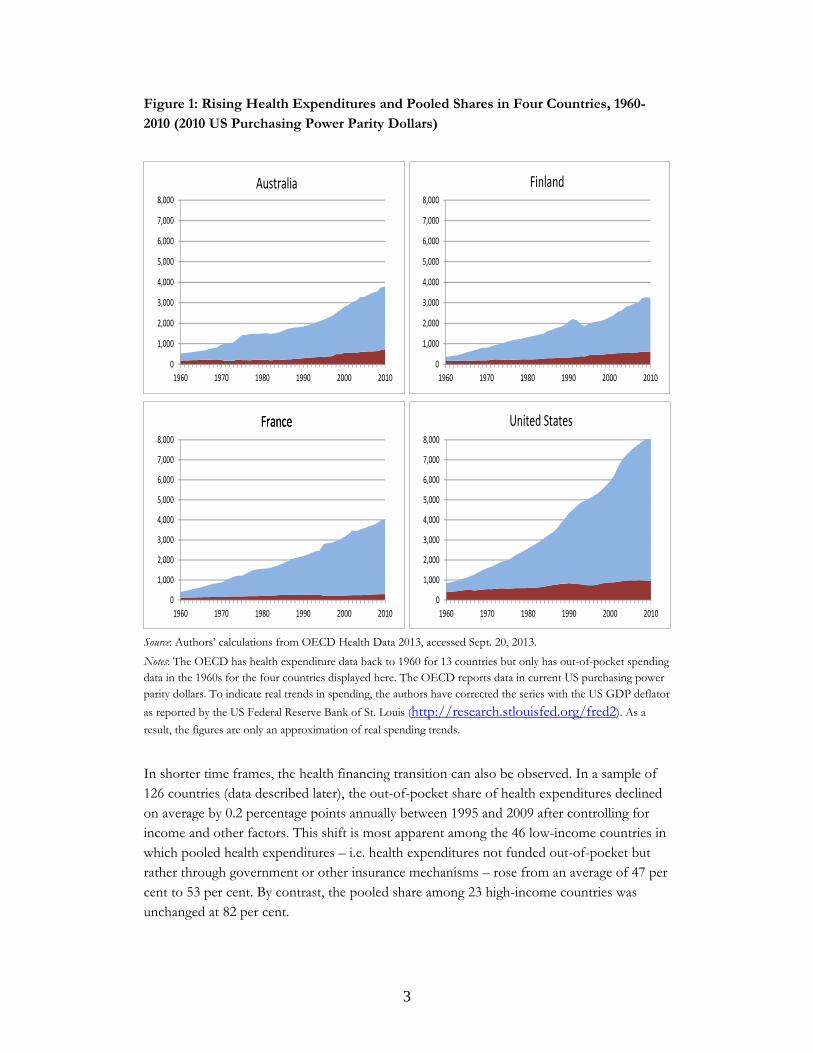
The health financing transition can be illustrated as a rise in total health spending per person, accompanied by a less than proportional increase in out-of-pocket health spending. As an example of this transition, we use data for four countries (Australia, Finland, France, and the United States) with readily available historical data. In these countries, nominal per capita health spending rose by more than 8 per cent per year between 1960 and 2010 (approximately 4.5 per cent after adjusting for inflation) (see Figure 1) which is comparable to the average increase in nominal and real health spending per capita for the 13 OECD countries which report historical data on health spending back to 1960 (see Appendix Table 1). Over the same time period, out-of-pocket spending also rose but at a slower rate such that the out-of-pocket share of total health spending fell from 35.8 to 19.3 per cent in Australia; 43.6 to 19.2 per cent in Finland; 30.3 to 7.4 per cent in France; and 48.9 to 11.7 per cent in the United States. These are the only four countries for which we found OECD data on out-of-pocket health spending in the 1960s so we cannot assess how generalizable this pattern may be without additional information.
3
Figure 1: Rising Health Expenditures and Pooled Shares in Four Countries, 1960-2010 (2010 US Purchasing Power Parity Dollars)
Source: Authors’ calculations from OECD Health Data 2013, accessed Sept. 20, 2013.
Notes: The OECD has health expenditure data back to 1960 for 13 countries but only has out-of-pocket spending data in the 1960s for the four countries displayed here. The OECD reports data in current US purchasing power parity dollars. To indicate real trends in spending, the authors have corrected the series with the US GDP deflator
as reported by the US Federal Reserve Bank of St. Louis (http://research.stlouisfed.org/fred2). As a
result, the figures are only an approximation of real spending trends.
In shorter time frames, the health financing transition can also be observed. In a sample of 126 countries (data described later), the out-of-pocket share of health expenditures declined on average by 0.2 percentage points annually between 1995 and 2009 after controlling for income and other factors. This shift is most apparent among the 46 low-income countries in which pooled health expenditures – i.e. health expenditures not funded out-of-pocket but rather through government or other insurance mechanisms – rose from an average of 47 per cent to 53 per cent. By contrast, the pooled share among 23 high-income countries was unchanged at 82 per cent.
0
1,000
2,000
3,000
4,000
5,000
6,000
7,000
8,000
1960 1970 1980 1990 2000 2010
United States
0
1,000
2,000
3,000
4,000
5,000
6,000
7,000
8,000
1960 1970 1980 1990 2000 2010
Australia
0
1,000
2,000
3,000
4,000
5,000
6,000
7,000
8,000
1960 1970 1980 1990 2000 2010
Finland
0
1,000
2,000
3,000
4,000
5,000
6,000
7,000
8,000
1960 1970 1980 1990 2000 2010
FranceFrance
4
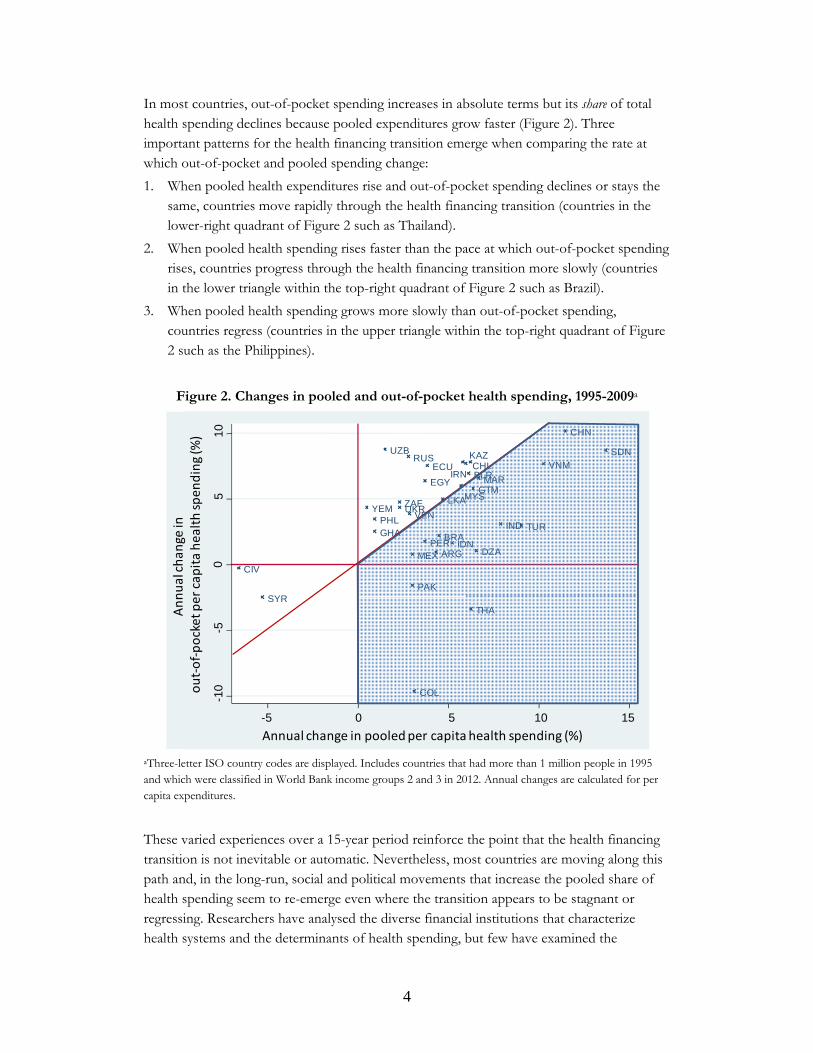
In most countries, out-of-pocket spending increases in absolute terms but its share of total health spending declines because pooled expenditures grow faster (Figure 2). Three important patterns for the health financing transition emerge when comparing the rate at which out-of-pocket and pooled spending change:
1. When pooled health expenditures rise and out-of-pocket spending declines or stays the same, countries move rapidly through the health financing transition (countries in the lower-right quadrant of Figure 2 such as Thailand).
2. When pooled health spending rises faster than the pace at which out-of-pocket spending rises, countries progress through the health financing transition more slowly (countries in the lower triangle within the top-right quadrant of Figure 2 such as Brazil).
3. When pooled health spending grows more slowly than out-of-pocket spending, countries regress (countries in the upper triangle within the top-right quadrant of Figure 2 such as the Philippines).
Figure 2. Changes in pooled and out-of-pocket health spending, 1995-2009a
aThree-letter ISO country codes are displayed. Includes countries that had more than 1 million people in 1995 and which were classified in World Bank income groups 2 and 3 in 2012. Annual changes are calculated for per capita expenditures.
These varied experiences over a 15-year period reinforce the point that the health financing transition is not inevitable or automatic. Nevertheless, most countries are moving along this path and, in the long-run, social and political movements that increase the pooled share of health spending seem to re-emerge even where the transition appears to be stagnant or regressing. Researchers have analysed the diverse financial institutions that characterize health systems and the determinants of health spending, but few have examined the
ARG
BLR
BRA
CHL
CHN
CIV
COL
DZA
ECU
EGY
GHA
GTM
IDN
IND
IRN
KAZ
LKA
MAR
MEX
MYS
PAK
PER
PHL
RUSSDN
SYRTHA
TUR
UKR
UZB
VEN
VNM
YEM ZAF
-10
-50
510
-5 0 5 10 15
Annual change in
out‐of‐pocket per capita health spending (%)
Annual change in pooled per capita health spending (%)
5
determinants of the composition of health spending and even fewer have analysed these trends within an encompassing framework. The health financing transition provides such a framework.
2.2. Determinants of total health expenditures
Why does total health spending rise? Researchers have identified five major sources of expenditure growth: rising income; changes in medical technology and practices; population aging; higher prices; and changes in the financing and management of healthcare (Chernew & Newhouse 2012; Garibaldi et al. 2010; Hall and Jones 2007; OECD 2006). A consensus has emerged that income is highly significant and that population aging has a more modest impact. Changes in technology and medical practices, prices, and institutions for financing and managing health care also contribute to higher spending but in complex ways and with less certainty about their relative contributions.
National income growth explains much of the growth in total health spending. Researchers agree that people and countries respond to rising income by demanding more health care services and that this explains a large part of the growth in health spending. Demand for health services is derived from the demand for health itself (Grossman 1972) and the way people value health is unique. In particular, the utility of health is probably not subject to declining marginal returns like other forms of consumption which can explain why expenditures on health care services increase as a share of national income (Hall and Jones 2007).
Though researchers agree that growing incomes increase the demand for health care services and raise health spending, they differ over how much. Initially, studies using cross-country analyses estimated that a 1 per cent increase in national income was associated with anywhere from 1.1 to 1.5 per cent more health spending (see Gerdtham and Jönsson (2000), Musgrove et al. (2002) and van der Gaag and Štimac (2008)). These estimates are consistent with arguments that health services are a “superior” good – one which accounts for a rising aggregate budget share as incomes rise (Getzen 2000; Hall and Jones 2007).
More recent studies using panel data for high-income countries are finding that the income elasticity of total health spending is likely to be between 0.6 and 0.9 (Gerdtham & Jönsson, 2000; Baltagi & Moscone, 2010). This has been confirmed for low- and middle-income countries, though the literature is far less developed (e.g., Gbesemete & Gerdtham 1992, Okunade 2005, Xu, Saksena, & Holly, 2011, Farag et al 2012). Indeed, Costa-Font et al. (2011) use meta-regression analysis of 48 published studies to produce bias-corrected estimates of the relationship between income and health expenditures and find that this income elasticity ranges from 0.4 to 0.8. The remaining differences between these estimates probably reflect differences in the share of health spending growth that is implicitly or explicitly attributed to other factors such as technological change or unbalanced growth.
Advances in medical technology contribute to rising health spending. Researchers generally agree that the invention of new medical technologies and changing medical practices have contributed

6
to the rise in health spending, though primarily on the basis of evidence from high-income countries, with different views regarding the relative magnitude of these effects, and attentive to the influence of insurance and demand factors which can induce technological change. Sorenson, Drummond, and Khan (2013) provide a review of these studies, some of which use growth accounting frameworks and estimate the impact of technology from unexplained residuals (Newhouse 1992), while others analyse the utilization and costs of specific medical innovations – such as angioplasty, cataract surgery, and antidepressants – to directly measure changes in productivity (Cutler & McClellan, 2001). For example, using data from 23 OECD countries between 1960 and 2006, Smith et al. (2009) attributed as much as 26 percent of health spending growth to technical change on its own and another 27 percent to the interaction between technical change and income. However, under certain assumptions, they show that the contribution of technology on its own could be nil. Thus, both the estimates and the interpretation of these results depend critically on whether technical change is considered to be an exogenous source of spending growth or if it is driven primarily by other factors like demand and insurance.
Populating aging contributes modestly to health spending. Older people generally consume more healthcare services, so population aging is often blamed for rising health costs. Yet the same demographic and epidemiologic transitions that contribute to population aging also mean that people tend to experience fewer health problems than people at similar ages in earlier generations (Fogel, 2004; Freedman, Martin, & Schoeni, 2002; Dormont et al., 2006). In addition, healthcare spending is more closely associated with an individual’s proximity to death than it is to their age (Lubitz & Reilly, 1993; Zweifel, Felder, & Meiers, 1999). As people live longer, these end-of-life expenditures are delayed, reducing the current aggregate financial burden.
Studies of OECD countries have generally confirmed that population aging has a limited impact on health spending (Getzen, 1992; Newhouse 1992; Dormont et al., 2006). Dormont, Martins, Pelgrin, & Suhrcke (2010) describe this as a common pattern of “healthy aging” and project that demographic changes will contribute modestly to increased health spending in OECD countries over the next fifty years. Fewer studies address the impact of population aging in low- and middle-income countries but when they do, the impact is generally small or insignificant (Xu et al 2011).
Price increases contribute to rising health spending. Rising prices may increase health spending as a result of lagging productivity growth. Baumol described this as a “cost disease” that afflicts relatively labour-intensive sectors, in which productivity grows slowly relative to other sectors (Baumol 1967). A growing number of empirical studies assert a significant role for Baumol’s “cost disease” in the health sector. Most notably, Hartwig (2008) confirms key predictions of Baumol’s model by demonstrating that the health sector has nominal wage growth in excess of productivity and employs a growing share of the labour force in high-income countries. Other studies argue that the contribution of price inflation to overall

7
spending growth is relatively small, either by extrapolating from detailed studies of treatments for specific conditions (Cutler & McClellan, 2001) or by seeking more accurate measures of productivity (Triplett and Bosworth 2004). The true contribution of this effect is closely tied to the role of technology and to the interactions between technology and prices on the one hand and demand and insurance on the other. For example, Smith et al. (2009) estimate that rising prices account for 5 per cent of spending growth in 23 countries (1960-2006) under the assumption that health care productivity rose at the same rate as economy-wide averages but 18.8 per cent if health care productivity did not rise at all. Similar processes could be operating in low- and middle-income countries as well but no studies are yet available to establish this.
Health spending is influenced by healthcare financing, payment, and organization. Rising health expenditures can be explained in part by the expansion of insurance coverage. As health spending shifts from out-of-pocket expenditures toward pooled financing, moral hazard occurs (i.e. people tend to use more services when someone else pays part of the marginal cost). This is an explicit goal of many public health programs and social insurance policies which seek to encourage people to use necessary health care services. Questions arise whether such health policies can simultaneously limit unnecessary care, reducing waste and inefficiencies.
Studies of households in high-income countries confirm that being insured increases utilization of care, but that being insured does not in itself account for the observed increases in health spending (Manning et al., 1987; Newhouse, 1992; Docteur & Oxley, 2003). In low- and middle-income countries, households with insurance also utilize more care (Escobar, Griffin, & Shaw, 2010) but the impact on aggregate health spending has not been studied conclusively.
Different health financing institutions – such as social insurance, integrated public provision, or separation of financing and provision – explain some of the spending differences across countries, and may explain part of health spending growth. Studies of OECD countries find that social insurance financing is associated with higher spending than integrated public provision (Mosca 2007; Wagstaff 2009). Reforms that rely on market mechanisms, public management, budget caps, demand side controls and supply constraints appear to explain differences in health spending (Tyson et al. 2012), though private insurance spending seems to have outpaced public health spending in the United States (Boccuti & Moon, 2003). Xu et al. (2011) investigated whether ‘mixed systems’ – those in which financing arrangements are not dominated by either social insurance or government-financed care – may be less effective at controlling costs, but their analysis ultimately rejects this hypothesis. Recent studies have argued that as much as half the spending growth commonly attributed to technological change could be due instead to changes in public financing arrangements (de la Maisonneuve and Oliveira Martins, 2013). Such studies confirm the difficulty of separating the effects of technology, prices, and financial mechanisms which are interrelated.

8
In sum, research shows that health expenditures are driven by rising incomes with a more modest impact from population aging. The relative importance of other contributing factors – technological change, prices, and institutions that finance and manage healthcare – are more uncertain.
2.3. Determinants of out-of-pocket spending
The declining out-of-pocket share of health spending and its complement, the rising pooled share of health spending, are widespread phenomena which lack comprehensive treatment. Only a few studies try to explain the composition of total health spending and the determinants of public and out-of-pocket shares (Xu et al., 2011; Clemente, Marcuello, Montañés, & Pueyo, 2004; Hughes Tuohy, Flood, & Stabile, 2004; Musgrove, Zeramdini, & Carrin, 2002; Götze & Schmid, 2012). Some of these studies – in both developed and developing countries – assume that the out-of-pocket share is driven by individual and household behaviour since microeconomic studies have established that out-of-pocket health spending is affected by health insurance, illness, age and sex, among other factors (Galbraith et al 2005, Wagner et al 2011, Spaan et al et al 2012; Li et al 2012). The share of income spent on health also tends to be smaller for households with higher incomes (see Leive & Xu 2008, Valtorta & Hanratty 2013). Thus rising household income and demand for health insurance may underlie the long-term growth of pooled health spending.
Other studies explain the growth of pooled health spending in terms of political and institutional change. Health insurance did not initially emerge in response to market opportunities; rather, it emerged primarily through such non-profit initiatives as cooperatives, community associations, guilds, and unions (Immergut, 1992; Bump, 2010; Savedoff & Smith, 2011). Furthermore, for-profit health insurance has become significant only in countries with substantial public intervention to regulate or subsidise health insurance markets and accounts for a small share of health spending around the world (Sekhri & Savedoff, 2005). Thus, economic and political factors both appear to play a role in the declining share of out-of-pocket health spending and the rise in pooled health financing mechanisms.
3. Methods To analyse the determinants of total health spending and its major components, we analyse a dataset of 126 countries from 1995 to 2009. We present regressions on the outcomes of interest in levels and in first-differences. We also test for and address cross-sectional dependence, serial correlation, and unit roots (see Appendix Box)
3.1. Data
Our analysis uses a WHO database with variables on health expenditure for 126 countries from 1995 to 2009 (WHO, 2012). Using national health account methods, the WHO tracks total spending in the health sector from all sources with information that is internationally comparable. The WHO updates the data annually by collecting, adjusting, and estimating
9
the data using reports from each country’s government as well as international organizations. The estimates are then sent to each country’s Ministry of Health for validation. As the data do not involve human subjects, ethical approval was not necessary for this study.
The variable “total health spending” includes all expenditures for healthcare services: consumption of healthcare goods and services (by households, government, and non-profit institutions) and gross capital formation (i.e. demand for capital goods by health providers) (OECD, Eurostat, and WHO, 2011). The variable “government health spending” is defined as all expenditures for healthcare that are financed through taxes or publicly mandated insurance contributions. The variable “out-of-pocket health spending” measures private expenditures that households pay for healthcare services directly to providers when they utilise such services. However, the sum of government health spending and out-of-pocket health spending does not equal total health expenditure. The residual contains non-government prepaid spending (e.g. through voluntary private insurance, non-profit institutions, or medical savings accounts) and some external resources like foreign aid. Some foreign aid, however, is spent through public or private channels and therefore is not necessarily in the residual.
In addition to total health spending and its components, we are interested in analysing out-of-pocket spending as a share of total health spending (OOP/THE). Two other variables are included because of their likely impact on health spending and its components. The first of these is government expenditure as a proportion of gross domestic product (GE/GDP) which measures the capacity of governments to mobilise revenues. Countries with higher GE/GDP have the resources to implement public health policies at the same time that they have the discretion to allocate those resources to other priorities. The second variable is the proportion of the population aged 60 and older which is an indication of population aging.
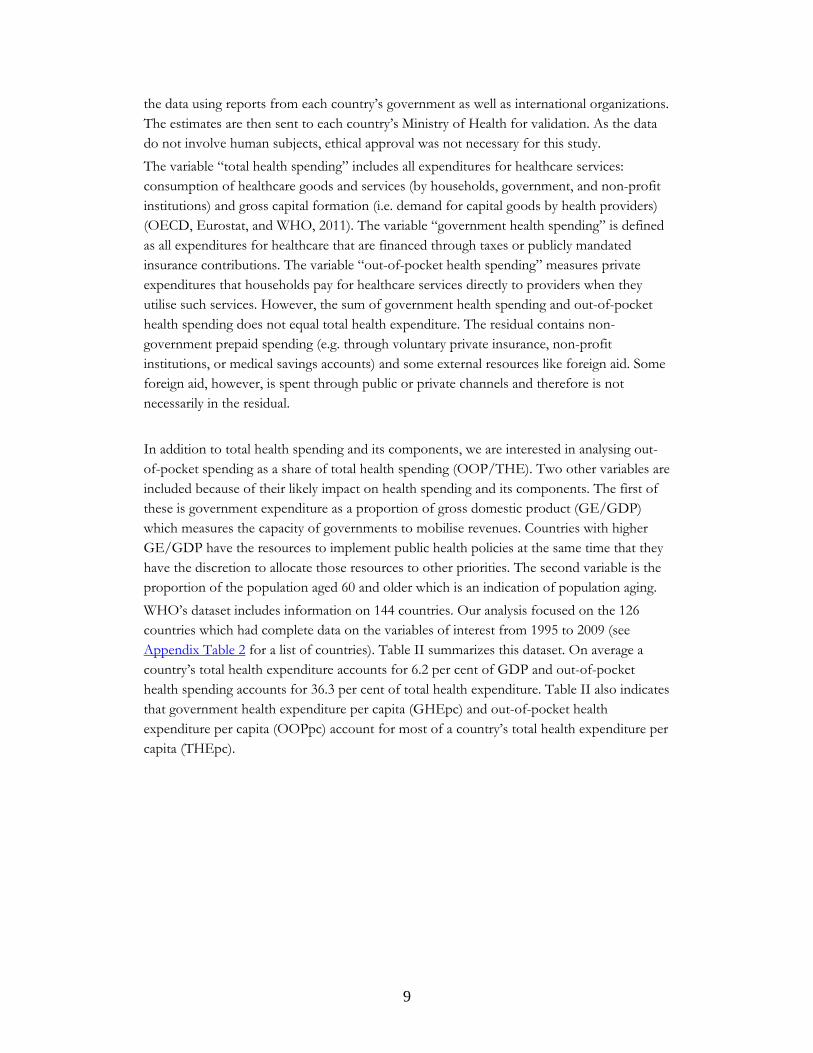
WHO’s dataset includes information on 144 countries. Our analysis focused on the 126 countries which had complete data on the variables of interest from 1995 to 2009 (see Appendix Table 2 for a list of countries). Table II summarizes this dataset. On average a country’s total health expenditure accounts for 6.2 per cent of GDP and out-of-pocket health spending accounts for 36.3 per cent of total health expenditure. Table II also indicates that government health expenditure per capita (GHEpc) and out-of-pocket health expenditure per capita (OOPpc) account for most of a country’s total health expenditure per capita (THEpc).
10
Table II. Means of variables in panel dataset
Variable Mean SD
Gross domestic product per capita (GDPpc) 10,233 12,008
Total health expenditure per capita (THEpc) 756 1,069
Government health expenditure per capita (GHEpc) 524 802
Out-of-pocket health expenditure per capita (OOPpc) 173 200
THE as proportion of GDP 0.062 0.221
OOP as proportion of THE 0.363 0.195
Proportion population over age 60 0.117 0.750
Proportion government expenditure of GDP 0.314 0.116
Notes: Balanced panel over 1995-2009 for 126 countries and 1,860 observations. GDP per capita and health expenditure variables are all in 2005 purchasing power parity dollars.
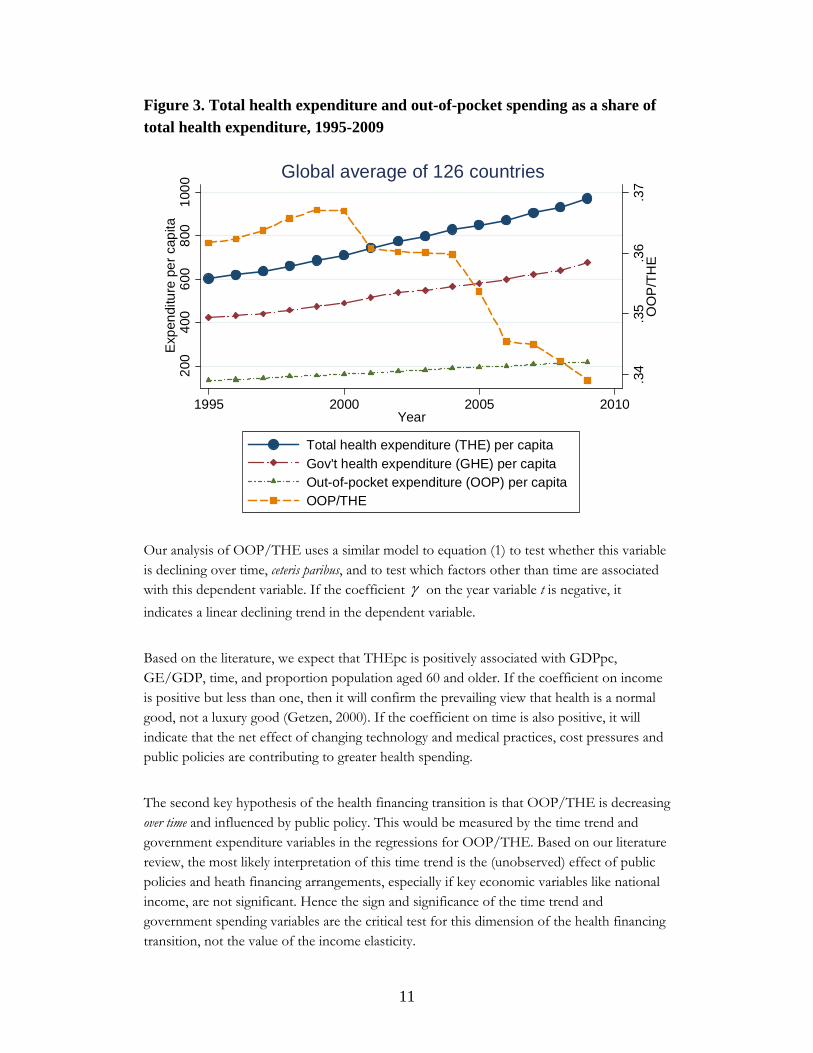
Figure 3 presents trends in the health financing transition – the increase in total health spending on the left y-axis and the decline of out-of-pocket spending as a fraction of total health spending (OOP/THE) on the right y-axis – and suggests that between 1995 and 2009 total health spending increased and the out-of-pocket share declined modestly. Between 1995 and 2009, 119 out of 126 countries experienced an increase in THEpc. Over the same period, GHEpc rose in 112 countries and OOPpc rose in 104 countries. In 67 of the countries, OOP/THE declined or stayed constant.
3.2. Estimation strategy
Our main regression is a fixed-effects model:
itiit txxxy 332211 (1)
for country i in year t. The dependent variable, yit, refers to the two main outcomes estimated in separate regressions – THEpc in natural logs and OOP/THE. A key independent variable
of interest, 1x , is per capita gross domestic product (GDPpc) in natural logs. In successive
regressions, we included three other variables of interest, t, 2x and 3x , which refer
respectively to a year trend, government expenditure as a proportion of gross domestic product (GE/GDP), and the proportion of the population aged 60 and older. The coefficient will measure an annual rate of change over time in the dependent variable
when the model is log-linear. This time trend measures any consistent annual changes that are not explained by other included variables (such as income and population aging), and
must be modelled for a weakly dependent trending series. In addition, i is a vector of
country fixed effects that capture time-invariant unobserved characteristics and it is an
error term. Robust standard errors clustered at country level were applied.
11
Figure 3. Total health expenditure and out-of-pocket spending as a share of total health expenditure, 1995-2009
Our analysis of OOP/THE uses a similar model to equation (1) to test whether this variable is declining over time, ceteris paribus, and to test which factors other than time are associated with this dependent variable. If the coefficient on the year variable t is negative, it
indicates a linear declining trend in the dependent variable.
Based on the literature, we expect that THEpc is positively associated with GDPpc, GE/GDP, time, and proportion population aged 60 and older. If the coefficient on income is positive but less than one, then it will confirm the prevailing view that health is a normal good, not a luxury good (Getzen, 2000). If the coefficient on time is also positive, it will indicate that the net effect of changing technology and medical practices, cost pressures and public policies are contributing to greater health spending.
The second key hypothesis of the health financing transition is that OOP/THE is decreasing over time and influenced by public policy. This would be measured by the time trend and government expenditure variables in the regressions for OOP/THE. Based on our literature review, the most likely interpretation of this time trend is the (unobserved) effect of public policies and heath financing arrangements, especially if key economic variables like national income, are not significant. Hence the sign and significance of the time trend and government spending variables are the critical test for this dimension of the health financing transition, not the value of the income elasticity.
.34
.35
.36
.37
OO
P/T
HE
200
400
600
800
100
0E
xpen
ditu
re p
er
cap
ita
1995 2000 2005 2010Year
Total health expenditure (THE) per capita
Gov't health expenditure (GHE) per capitaOut-of-pocket expenditure (OOP) per capitaOOP/THE
Global average of 126 countries
12
With regard to the components of total health expenditure – GHEpc and OOPpc – the literature provides less guidance; however, we expect each of these variables to be positively associated with income and with older populations. A priori, a secular time trend in these components could be positive or negative – positive if changing medical practices and moral hazard drive up government and out-of-pocket spending or negative if productivity gains in medicine and institutional changes mitigate and offset the pressures that otherwise increase spending.
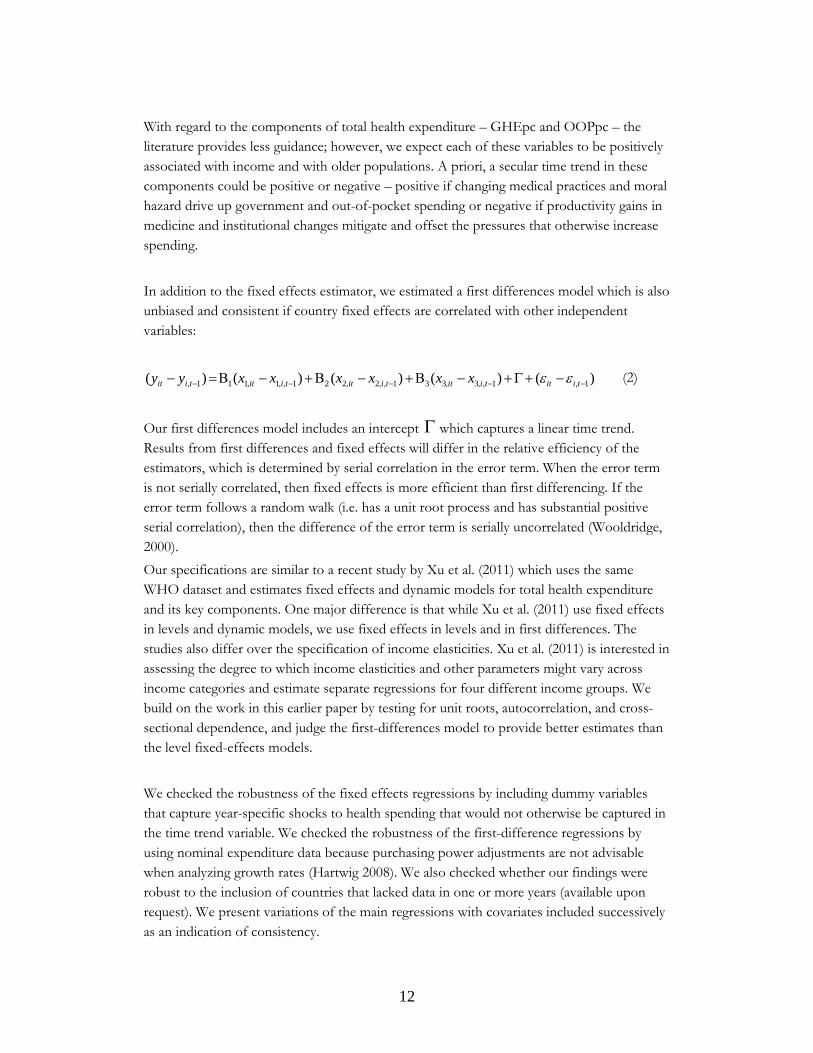
In addition to the fixed effects estimator, we estimated a first differences model which is also unbiased and consistent if country fixed effects are correlated with other independent variables:
)()()()()( 1,1,,3,331,,2,221,,1,111, tiittiittiittiittiit xxxxxxyy (2)
Our first differences model includes an intercept which captures a linear time trend. Results from first differences and fixed effects will differ in the relative efficiency of the estimators, which is determined by serial correlation in the error term. When the error term is not serially correlated, then fixed effects is more efficient than first differencing. If the error term follows a random walk (i.e. has a unit root process and has substantial positive serial correlation), then the difference of the error term is serially uncorrelated (Wooldridge, 2000).
Our specifications are similar to a recent study by Xu et al. (2011) which uses the same WHO dataset and estimates fixed effects and dynamic models for total health expenditure and its key components. One major difference is that while Xu et al. (2011) use fixed effects in levels and dynamic models, we use fixed effects in levels and in first differences. The studies also differ over the specification of income elasticities. Xu et al. (2011) is interested in assessing the degree to which income elasticities and other parameters might vary across income categories and estimate separate regressions for four different income groups. We build on the work in this earlier paper by testing for unit roots, autocorrelation, and cross-sectional dependence, and judge the first-differences model to provide better estimates than the level fixed-effects models.
We checked the robustness of the fixed effects regressions by including dummy variables that capture year-specific shocks to health spending that would not otherwise be captured in the time trend variable. We checked the robustness of the first-difference regressions by using nominal expenditure data because purchasing power adjustments are not advisable when analyzing growth rates (Hartwig 2008). We also checked whether our findings were robust to the inclusion of countries that lacked data in one or more years (available upon request). We present variations of the main regressions with covariates included successively as an indication of consistency.
13
4. Results Overall, our findings are consistent with the idea of a health financing transition. We found statistically significant increases in total health spending between 1995 and 2009, and declines in the out-of-pocket share of health spending over the same period. The rise in health spending is due in part to rising incomes, with an income elasticity that is positive but less than one. However, total health spending also exhibits an upward time trend, independent of income, which is caused by some combination of changing medical practices and technology, cost pressures and changes in management and financing of healthcare. Government capacity to raise revenues is a significant factor for changes in total health spending and government health spending, and is associated with a declining out-of-pocket share of health spending. Population aging appears to increase total health spending and out-of-pocket health spending, but does not significantly influence government health spending.
4.1. Total health spending and its components
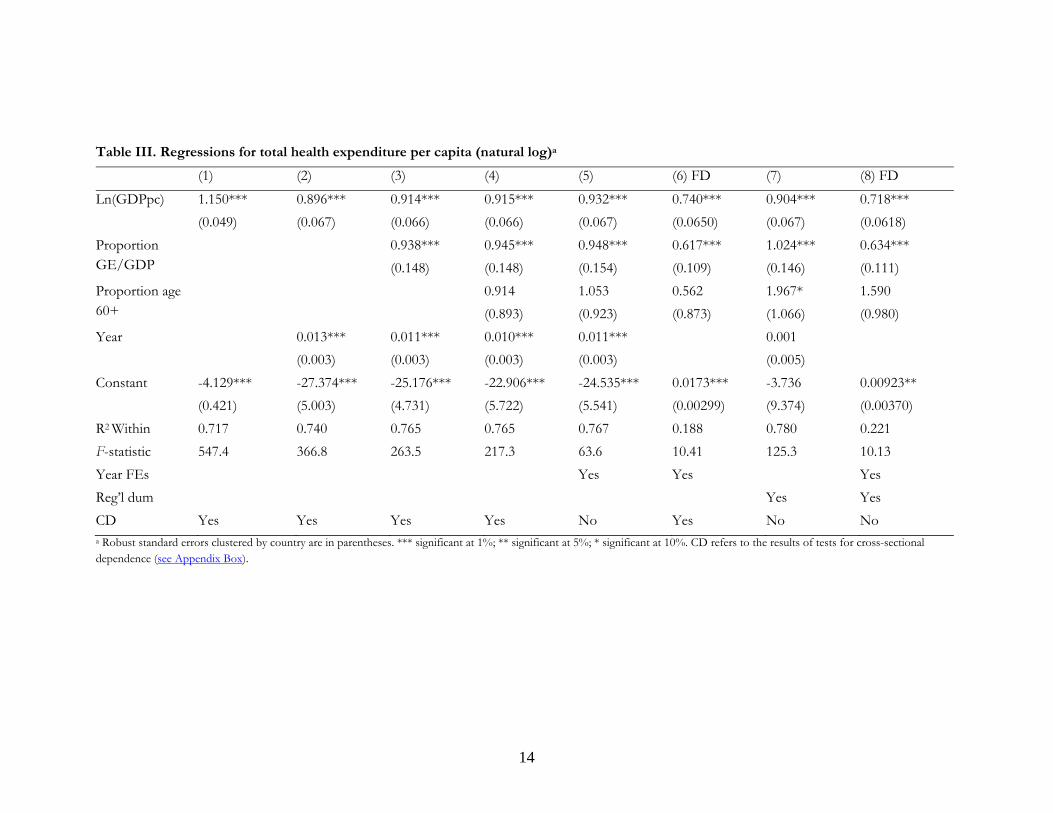
Table III presents regressions in which the dependent variable is total health expenditure per capita. The first column presents a naïve regression in which, other than country fixed effects and a constant, the only dependent variable is national income. The income elasticity is estimated to be 1.15, comparable to estimates in studies which use cross-section data (Kleiman, 1974; Newhouse, 1977; Leu, 1986; Schieber & Maeda, 1999; Musgrove et al., 2002; van der Gaag & Štimac, 2008). Including a time trend in the regression (column 2), generates an estimated income elasticity of 0.9, comparable to more recent studies which rely on panel data and control for a range of problems that introduce bias in cross-section analysis (Gerdtham & Jönsson, 2000; Baltagi & Moscone, 2010; Xu et al., 2011). These estimates are robust to the use of year fixed effects (column 5). While additional explanatory variables are sometimes statistically significant, they do not substantially alter the coefficient for national income in the level fixed effects models.
Unlike the fixed effects model, the first-differences model (column 8) has neither cross-sectional dependence nor autocorrelation in the error term and hence is our preferred model. We checked the robustness of these results by reestimating the first-differenced results without year dummies (presented in Appendix Table 3). When we reestimated the regressions with nominal values, the significance of different variables also was unchanged; however, the resulting coefficients are somewhat smaller for income and government revenue mobilization and larger for the time trend (results available on request).
14
Table III. Regressions for total health expenditure per capita (natural log)a
(1) (2) (3) (4) (5) (6) FD (7) (8) FD
Ln(GDPpc) 1.150*** 0.896*** 0.914*** 0.915*** 0.932*** 0.740*** 0.904*** 0.718***
(0.049) (0.067) (0.066) (0.066) (0.067) (0.0650) (0.067) (0.0618)
Proportion GE/GDP
0.938*** 0.945*** 0.948*** 0.617*** 1.024*** 0.634***
(0.148) (0.148) (0.154) (0.109) (0.146) (0.111)
Proportion age 60+
0.914 1.053 0.562 1.967* 1.590
(0.893) (0.923) (0.873) (1.066) (0.980)
Year 0.013*** 0.011*** 0.010*** 0.011*** 0.001
(0.003) (0.003) (0.003) (0.003) (0.005)
Constant -4.129*** -27.374*** -25.176*** -22.906*** -24.535*** 0.0173*** -3.736 0.00923**
(0.421) (5.003) (4.731) (5.722) (5.541) (0.00299) (9.374) (0.00370)
R2 Within 0.717 0.740 0.765 0.765 0.767 0.188 0.780 0.221
F-statistic 547.4 366.8 263.5 217.3 63.6 10.41 125.3 10.13
Year FEs Yes Yes Yes
Reg’l dum Yes Yes
CD Yes Yes Yes Yes No Yes No No a Robust standard errors clustered by country are in parentheses. *** significant at 1%; ** significant at 5%; * significant at 10%. CD refers to the results of tests for cross-sectional dependence (see Appendix Box).
15
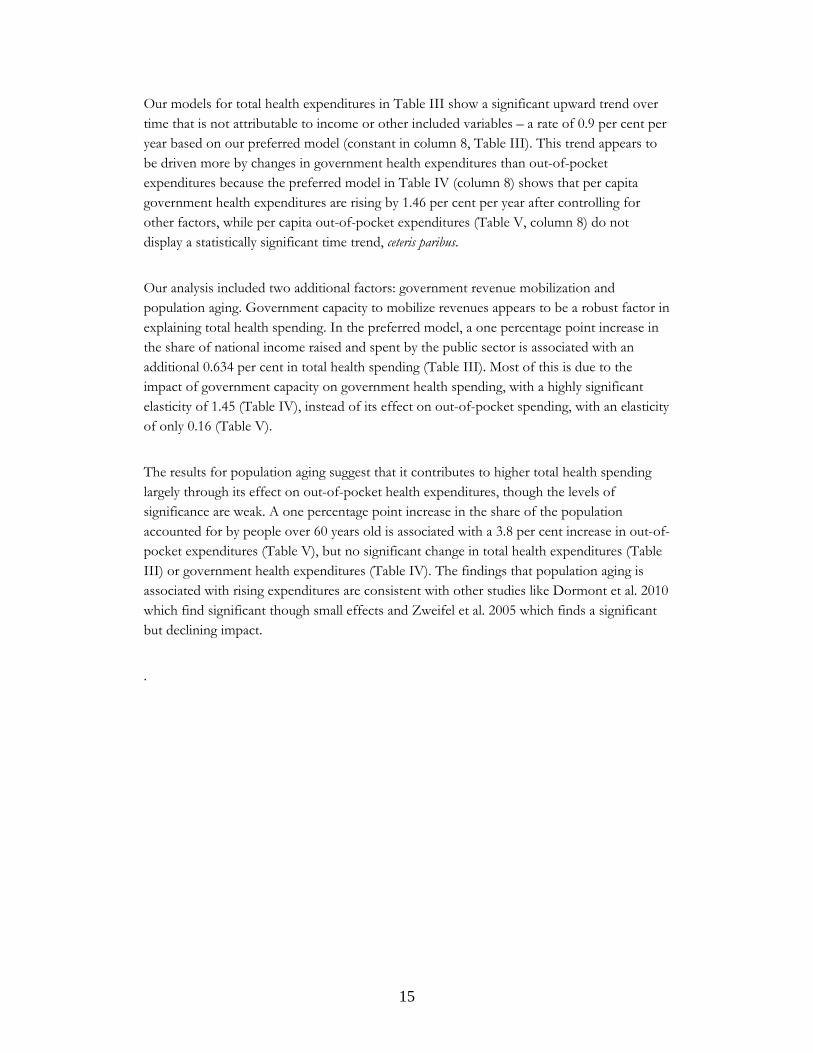
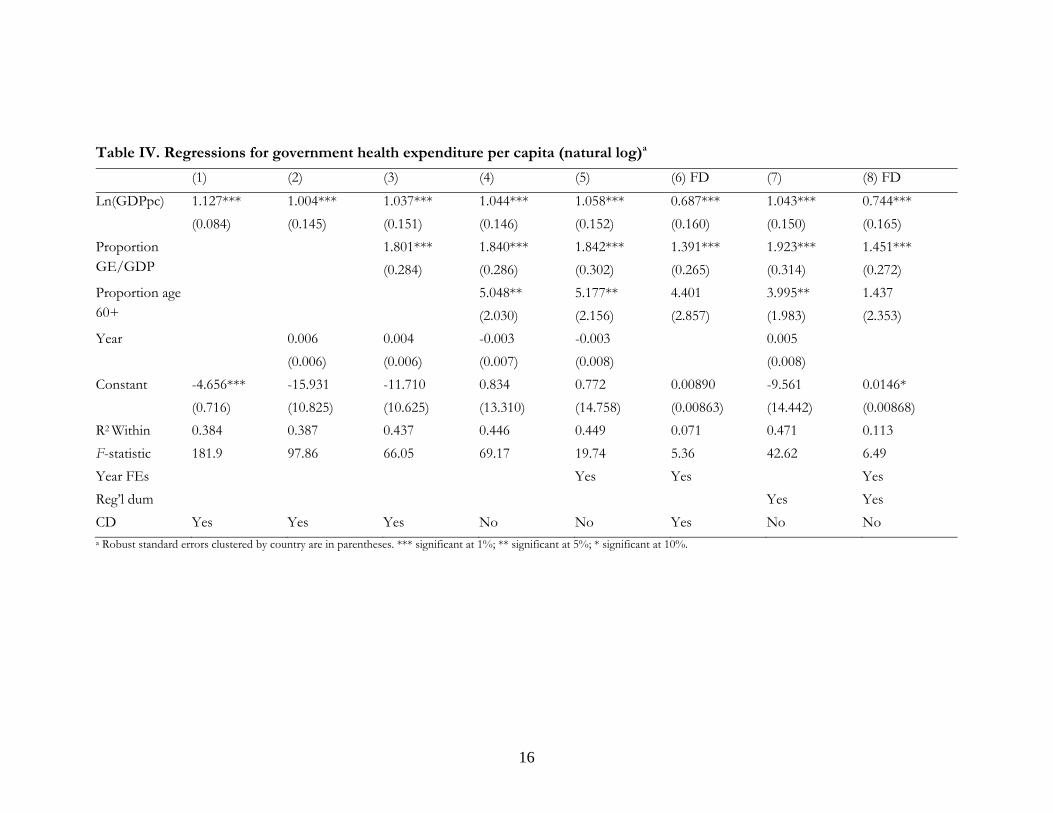
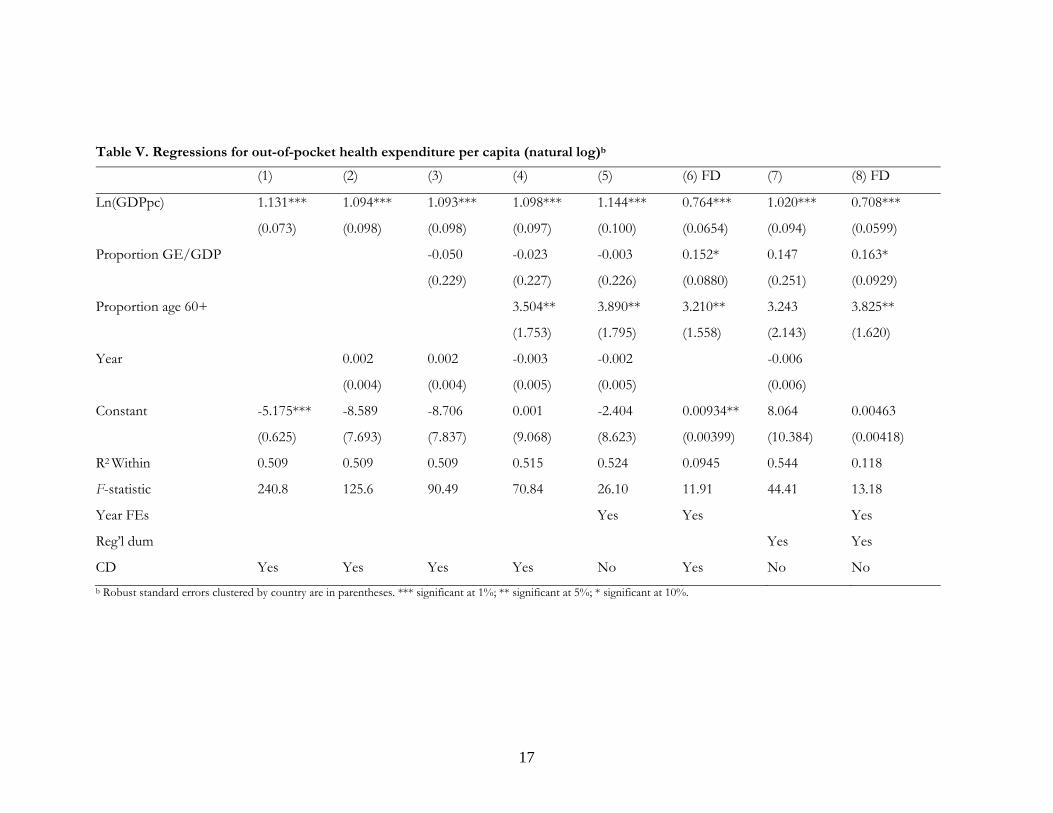
Our models for total health expenditures in Table III show a significant upward trend over time that is not attributable to income or other included variables – a rate of 0.9 per cent per year based on our preferred model (constant in column 8, Table III). This trend appears to be driven more by changes in government health expenditures than out-of-pocket expenditures because the preferred model in Table IV (column 8) shows that per capita government health expenditures are rising by 1.46 per cent per year after controlling for other factors, while per capita out-of-pocket expenditures (Table V, column 8) do not display a statistically significant time trend, ceteris paribus.
Our analysis included two additional factors: government revenue mobilization and population aging. Government capacity to mobilize revenues appears to be a robust factor in explaining total health spending. In the preferred model, a one percentage point increase in the share of national income raised and spent by the public sector is associated with an additional 0.634 per cent in total health spending (Table III). Most of this is due to the impact of government capacity on government health spending, with a highly significant elasticity of 1.45 (Table IV), instead of its effect on out-of-pocket spending, with an elasticity of only 0.16 (Table V).
The results for population aging suggest that it contributes to higher total health spending largely through its effect on out-of-pocket health expenditures, though the levels of significance are weak. A one percentage point increase in the share of the population accounted for by people over 60 years old is associated with a 3.8 per cent increase in out-of-pocket expenditures (Table V), but no significant change in total health expenditures (Table III) or government health expenditures (Table IV). The findings that population aging is associated with rising expenditures are consistent with other studies like Dormont et al. 2010 which find significant though small effects and Zweifel et al. 2005 which finds a significant but declining impact.
.
16
Table IV. Regressions for government health expenditure per capita (natural log)a
(1) (2) (3) (4) (5) (6) FD (7) (8) FD
Ln(GDPpc) 1.127*** 1.004*** 1.037*** 1.044*** 1.058*** 0.687*** 1.043*** 0.744***
(0.084) (0.145) (0.151) (0.146) (0.152) (0.160) (0.150) (0.165)
Proportion GE/GDP
1.801*** 1.840*** 1.842*** 1.391*** 1.923*** 1.451***
(0.284) (0.286) (0.302) (0.265) (0.314) (0.272)
Proportion age 60+
5.048** 5.177** 4.401 3.995** 1.437
(2.030) (2.156) (2.857) (1.983) (2.353)
Year 0.006 0.004 -0.003 -0.003 0.005
(0.006) (0.006) (0.007) (0.008) (0.008)
Constant -4.656*** -15.931 -11.710 0.834 0.772 0.00890 -9.561 0.0146*
(0.716) (10.825) (10.625) (13.310) (14.758) (0.00863) (14.442) (0.00868)
R2 Within 0.384 0.387 0.437 0.446 0.449 0.071 0.471 0.113
F-statistic 181.9 97.86 66.05 69.17 19.74 5.36 42.62 6.49
Year FEs Yes Yes Yes
Reg’l dum Yes Yes
CD Yes Yes Yes No No Yes No No a Robust standard errors clustered by country are in parentheses. *** significant at 1%; ** significant at 5%; * significant at 10%.
17
Table V. Regressions for out-of-pocket health expenditure per capita (natural log)b
(1) (2) (3) (4) (5) (6) FD (7) (8) FD
Ln(GDPpc) 1.131*** 1.094*** 1.093*** 1.098*** 1.144*** 0.764*** 1.020*** 0.708***
(0.073) (0.098) (0.098) (0.097) (0.100) (0.0654) (0.094) (0.0599)
Proportion GE/GDP -0.050 -0.023 -0.003 0.152* 0.147 0.163*
(0.229) (0.227) (0.226) (0.0880) (0.251) (0.0929)
Proportion age 60+ 3.504** 3.890** 3.210** 3.243 3.825**
(1.753) (1.795) (1.558) (2.143) (1.620)
Year 0.002 0.002 -0.003 -0.002 -0.006
(0.004) (0.004) (0.005) (0.005) (0.006)
Constant -5.175*** -8.589 -8.706 0.001 -2.404 0.00934** 8.064 0.00463
(0.625) (7.693) (7.837) (9.068) (8.623) (0.00399) (10.384) (0.00418)
R2 Within 0.509 0.509 0.509 0.515 0.524 0.0945 0.544 0.118
F-statistic 240.8 125.6 90.49 70.84 26.10 11.91 44.41 13.18
Year FEs Yes Yes Yes
Reg’l dum Yes Yes
CD Yes Yes Yes Yes No Yes No No
b Robust standard errors clustered by country are in parentheses. *** significant at 1%; ** significant at 5%; * significant at 10%.
18
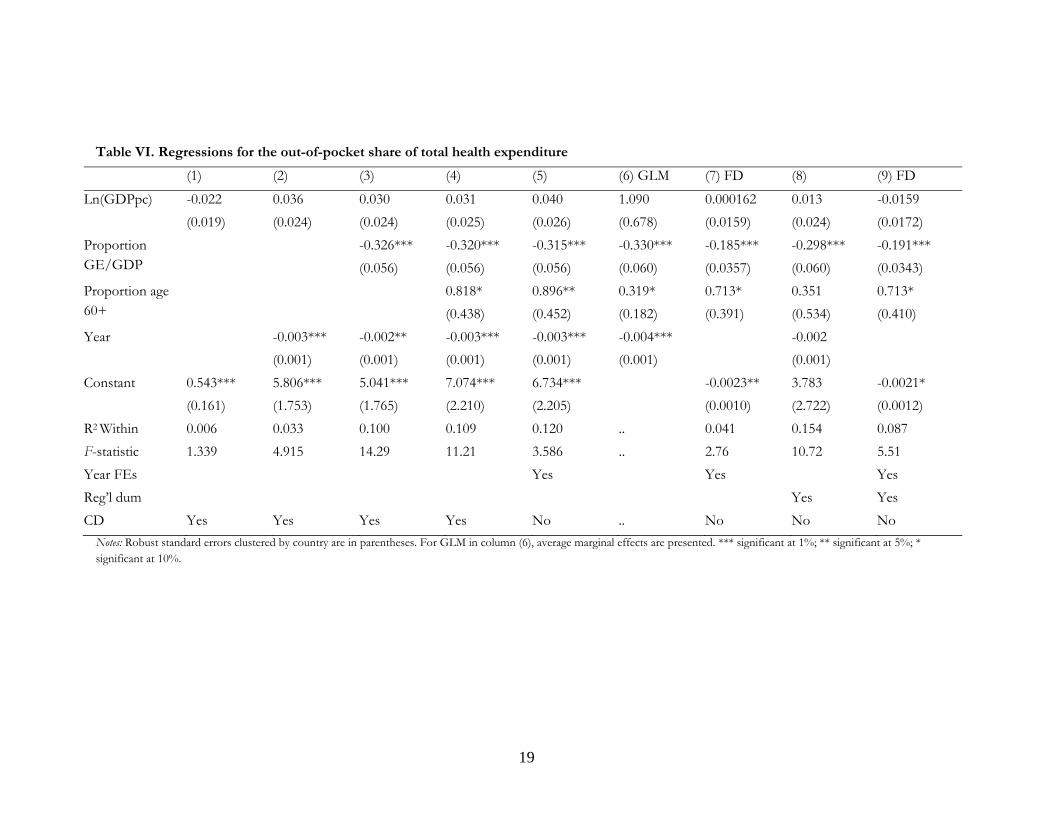
4.2. The out-of-pocket share of total health spending
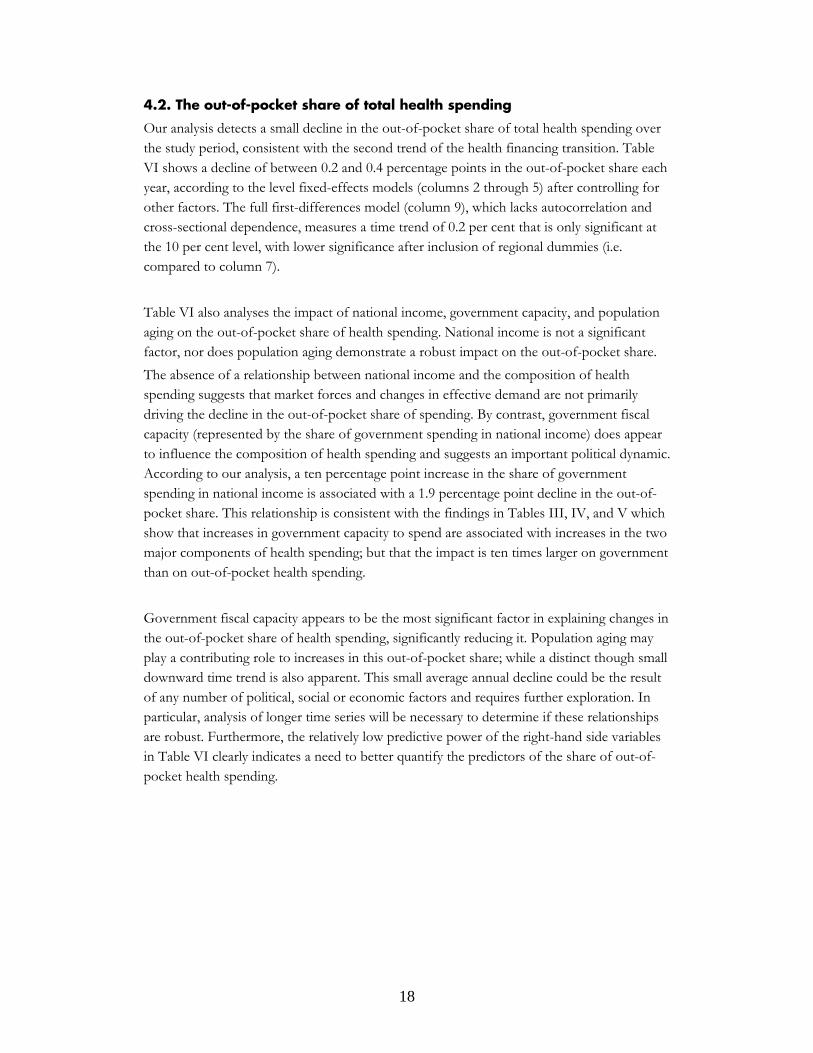
Our analysis detects a small decline in the out-of-pocket share of total health spending over the study period, consistent with the second trend of the health financing transition. Table VI shows a decline of between 0.2 and 0.4 percentage points in the out-of-pocket share each year, according to the level fixed-effects models (columns 2 through 5) after controlling for other factors. The full first-differences model (column 9), which lacks autocorrelation and cross-sectional dependence, measures a time trend of 0.2 per cent that is only significant at the 10 per cent level, with lower significance after inclusion of regional dummies (i.e. compared to column 7).
Table VI also analyses the impact of national income, government capacity, and population aging on the out-of-pocket share of health spending. National income is not a significant factor, nor does population aging demonstrate a robust impact on the out-of-pocket share.
The absence of a relationship between national income and the composition of health spending suggests that market forces and changes in effective demand are not primarily driving the decline in the out-of-pocket share of spending. By contrast, government fiscal capacity (represented by the share of government spending in national income) does appear to influence the composition of health spending and suggests an important political dynamic. According to our analysis, a ten percentage point increase in the share of government spending in national income is associated with a 1.9 percentage point decline in the out-of-pocket share. This relationship is consistent with the findings in Tables III, IV, and V which show that increases in government capacity to spend are associated with increases in the two major components of health spending; but that the impact is ten times larger on government than on out-of-pocket health spending.
Government fiscal capacity appears to be the most significant factor in explaining changes in the out-of-pocket share of health spending, significantly reducing it. Population aging may play a contributing role to increases in this out-of-pocket share; while a distinct though small downward time trend is also apparent. This small average annual decline could be the result of any number of political, social or economic factors and requires further exploration. In particular, analysis of longer time series will be necessary to determine if these relationships are robust. Furthermore, the relatively low predictive power of the right-hand side variables in Table VI clearly indicates a need to better quantify the predictors of the share of out-of-pocket health spending.
19
Table VI. Regressions for the out-of-pocket share of total health expenditure
(1) (2) (3) (4) (5) (6) GLM (7) FD (8) (9) FD
Ln(GDPpc) -0.022 0.036 0.030 0.031 0.040 1.090 0.000162 0.013 -0.0159
(0.019) (0.024) (0.024) (0.025) (0.026) (0.678) (0.0159) (0.024) (0.0172)
Proportion GE/GDP
-0.326*** -0.320*** -0.315*** -0.330*** -0.185*** -0.298*** -0.191***
(0.056) (0.056) (0.056) (0.060) (0.0357) (0.060) (0.0343)
Proportion age 60+
0.818* 0.896** 0.319* 0.713* 0.351 0.713*
(0.438) (0.452) (0.182) (0.391) (0.534) (0.410)
Year -0.003*** -0.002** -0.003*** -0.003*** -0.004*** -0.002
(0.001) (0.001) (0.001) (0.001) (0.001) (0.001)
Constant 0.543*** 5.806*** 5.041*** 7.074*** 6.734*** -0.0023** 3.783 -0.0021*
(0.161) (1.753) (1.765) (2.210) (2.205) (0.0010) (2.722) (0.0012)
R2 Within 0.006 0.033 0.100 0.109 0.120 .. 0.041 0.154 0.087
F-statistic 1.339 4.915 14.29 11.21 3.586 .. 2.76 10.72 5.51
Year FEs Yes Yes Yes
Reg’l dum Yes Yes
CD Yes Yes Yes Yes No .. No No No
Notes: Robust standard errors clustered by country are in parentheses. For GLM in column (6), average marginal effects are presented. *** significant at 1%; ** significant at 5%; * significant at 10%.
21
5. Conclusions This study began by proposing the health financing transition as a way to describe two major trends that characterize most countries: a long-term increase in health spending and a decline in the share of that spending that is paid out-of-pocket. We illustrated this transition with historical data and reviewed the literature to describe the range of factors that may drive it. While the health financing transition is meant to characterize long-term trends, we investigated whether we could detect such a pattern in recent cross-country data for a 15-year period. We also explored whether this data confirmed and extended findings in the literature regarding the determinants of health spending and its components.
Overall, our estimates are consistent with the idea of a health financing transition. Total health expenditure per capita is rising in most countries over time as a result of rising incomes (with an income elasticity close to 0.7) and a secular trend that is due to a combination of changing medical technologies and practices, cost pressures and changes in the management and financing of healthcare (approximately 1 per cent per year). Total health expenditure is also significantly influenced by political and demographic factors as indicated by government expenditure as a share of GDP and population aging. The two major components of health spending – government health expenditure and out-of-pocket expenditure – exhibit similar income elasticities, close to 0.7. Government health expenditure also exhibits a rising secular trend of about 1.4 to 1.5 per cent per year unlike out-of-pocket expenditure which does not exhibit a clear time trend. Government capacity is positively related to government and out-of-pocket health spending but the effect on government health spending is 10 times larger. By contrast, demographic factors seem to influence out-of-pocket health expenditure but not government health expenditures.
The second trend in the health financing transition – the declining share of out-of-pocket expenditures – is also somewhat confirmed by our data in this 15-year period. Our analysis indicates that government fiscal capacity and a time trend are statistically significant explanatory variables which we interpret as evidence that public policy plays a prominent role in promoting pooled health spending. By contrast, income and demographic variables are statistically insignificant which give greater confidence that political factors are more important in driving this particular dimension health financing transition. Nevertheless, the low explanatory power of the regressions suggests that there are many unobserved factors that drive this variable and the weak statistical significance on the time trend (10%) advises caution in treating these declines in out-of-pocket share as inevitable, particularly over short time periods.
The finding that greater governmental fiscal capacity is associated with higher overall spending and lower out-of-pocket shares of health spending means that, on average, governments are allocating a part of their growing revenues to health. The policy implications for this are not obvious since it is hard to judge whether these allocations are too high or too low without evidence to compare the relative value of spending across

22
sectors. However, measures that increase health sector productivity, reduce cost pressures, and limit unnecessary care will soften the trade-offs faced by governments when allocating funds.
The policy implications of showing that the average trend across countries is toward higher health spending and a smaller share of out-of-pocket spending also depend critically on whether these trends are viewed favourably or not. While many people are concerned with rising health spending, it is good to the extent that these funds are purchasing real health benefits and are valued by society at the margin more than alternative uses of those same resources. Countries that are concerned about rising health spending cannot do much about the impact of rising income and population aging, nor would they necessarily want to because these are also positive trends. But there is still room for improvement if countries constrain health spending growth by focusing on the factors behind the secular time trend: changing technology, cost pressures, and management and financing mechanisms. In particular, measures which raise health care productivity will translate into slower health spending growth and/or increasing health benefits. Such measures include the incorporation of cost-effectiveness criteria into decisions regarding the adoption (or reimbursal) of new technologies; more efficient ways to train, manage and organize health care providers; and improving health financing mechanisms so that they simultaneously discourage unnecessary care and promote the utilization of cost-effective care.
The upward trend in the pooled share of health spending also likely has the benefit of lowering the risk of impoverishment among the population from medical costs. Countries can encourage this trend through policies that promote universal health coverage by establishing mandatory insurance coverage and/or building effective publicly provided health care systems. While these policies may increase spending, cross-country comparisons suggest they are also frequently more effective at containing aggregate spending than alternatives with less active public engagement.
23
References Baltagi, B. H., & Moscone F. (2010). Health care expenditure and income in the OECD
reconsidered: Evidence from panel data. Economic Modelling, 27, 804-11.
Baumol, W. J. (1967). Macroeconomics of unbalanced growth: The anatomy of urban crisis. American Economic Review, 57(3):415-426.
Boccuti, C., & Moon, M. (2003). Comparing Medicare and private insurers: Growth rates in spending over three decades. Health Affairs, 22, 230-237.
Bokhari, F. A. S., Gai, Y., & Gottret, P. (2007). Government health expenditures and health outcomes. Health Economics, 16, 257-73.
Bump, J. (2010). The long road to universal health coverage: A century of lessons for development strategy. Seattle: PATH.
Chernew, M. E., & Newhouse J. P., eds. (2012). Health care spending and growth. Oxford: Elsevier B.V.
Chesnais, J-C. (1993). The demographic transition: Stages, patterns, and economic implications: A longitudinal study of sixty-seven countries covering the period 1720–1984. Oxford: Oxford University Press.
Clemente, J., Marcuello, C., Montañés, A., & Pueyo, F. (2004). On the international stability of health care expenditure functions: are government and private functions similar? Journal of Health Economics, 23, 589-613.
Costa-Font, J., Gemmill, M. & Rubert, G. (2011). Biases in the healthcare luxury good hypothesis?: a meta-regression analysis. Journal of the Royal Statistiscal Society, 174( Part 1): 95–107
Cutler, D., & McClellan, M. (2001). Is technological change in medicine worth it? Health Affairs, 20, 11-29.
Docteur, E., & Oxley, H. (2003). Health-care systems: lessons from the reform experience. Paris: OECD.
Dormont, B., Grignon, M., & Huber, H. (2006). Health expenditure growth: reassessing the threat of ageing. Health Economics, 15, 947-63.
Dormont, B., Oliveira Martins, J., Pelgrin, F., & Suhrcke M. (2010). Health expenditures, longevity and growth. In P. Garibaldi, J. Oliveria Martins, & J. van Ours, (Eds), Ageing, health, and productivity: The economics of increased life expectancy. Oxford: Oxford University Press.
Escobar, M., Griffin, C. C., & Shaw, R. P., (Eds.). (2010). The impact of health insurance in low- and middle-income countries. Washington, DC: Brookings Institution.
Farag, M., NandaKumar, A. K., Wallack, S., Hodgkin, D., Gaumer, G., & Erbil, C., (2012). The income elasticity of health care spending in developing and developed countries. International Journal of Health Care Finance and Economics. 12, 2: 145-162.
de Ferranti, D. (2007). Improving equity in health financing. Presentation at The Health Leadership Conference, Madrid. April 14.
24
Fogel, R. W. (2004). Changes in the process of aging during the twentieth century: findings and procedures of the early indicators project. Population and Development Review, Supplement: Aging, Health, and Public Policy, 30,19-47.
Freedman, V. A., Martin, L. G., & Schoeni, R. F. (2002). Recent trends in disability and functioning among older Americans: a systematic review. Journal of the American Medical Association, 288, 3137-46.
Galbraith, A.A., Wong, S.T., Kim, S.E., & Newacheck, P.W., (2005). Out-of-Pocket Financial Burden for Low-Income Families with Children: Socioeconomic Disparities and Effects of Insurance. Health Services Research. 40(6p1): 1722-1736.
Garibaldi, P., Martins, J. O., & van Ours, J. (2010). Ageing, health, and productivity: The economics of increased life expectancy. Oxford: Oxford University Press.
Gbesemete, K.P., & Gerdtham, U.G., (1992). Determinants of health care expenditure in Africa: A cross-sectional study. World Development. 20 (2): 303-308.
Gerdtham, U., & Jönsson, B. (2000). International comparisons of health expenditure: theory, data and econometric analysis. In A. J. Culyer & Joseph P. Newhouse (Eds.), Handbook of Health Economics. Amsterdam: Elsevier, pp. 11-53.
Getzen, T. E. (1992). Population ageing and the growth of health care expenditures. Journal of Gerontology, 47, S98-104.
Getzen, T. E. (2000). Health care is an individual necessity and a national luxury: applying multilevel decision models to the analysis of health care expenditures. Journal of Health Economics, 19, 259-270.
Götze, R., & Schmid, A. (2012). Healthcare financing in OECD countries: Beyond the public-private split. TranState Working Papers No. 160. Retrieved from http://ssrn.com/abstract=1998037
Grossman, M. (1972). On the Concept of Health Capital and the Demand for Health. The Journal of Political Economy. 80(2): 223-255.
Hall, R.E. & Jones, C.I. (2007). The Value of Life and the Rise in Health Spending. Quarterly Journal of Economics, 122(1): 39-72.
Hartwig, J. (2008). What drives health care expenditure?—Baumol's model of ‘unbalanced growth’revisited. Journal of Health Economics, 27(3), 603-623.
Hughes Tuohy, C., Flood, C. M., & Stabile, M. (2004). How does private finance affect public health care systems? Marshalling the evidence from OECD nations. Journal of Health Politics, Policy and Law, 29, 359-396.
Immergut, E. (1992). Health politics: Interests and institutions in Western Europe. Cambridge: Cambridge University Press.
Kleiman, E. (1974). The determinants of national outlay on health. In M. Perlman (Ed), The economics of health and medical care. London: Macmillan London.
Leive, A., & Xu, K., (2008). Coping with out-of-pocket health payments: empirical evidence from 15 African countries. Bull World Health Organ. 86(11):849-856.
25
Leu, R. E. (1986). The public-private mix and international health-care costs. In A. J. Culyer & B. Jönsson (Eds), Public and private health services: complementarities and conflicts. Oxford: Blackwell.
Li, Y., Wu, Q., Xu, L., Legge, D., Hao, Y., Gao, L., Ning, N., & Wan, G. (2012). Factors affecting catastrophic health expenditure and impoverishment from medical expenses in China: policy implications of universal health insurance. Bulletin of the World Health Organization, 90(9):664-71.
Lubitz, J. B., & Reilly, G.F. (1993). Trends in medicare payments in the last year of life. New England Journal of Medicine, 328, 1092-96.
de la Maisonneuve, C. & Oliveira Martins, J. (2013). A Projection Method for Public Health and Long-Term Care Expenditures. OECD Economics Department Working Papers, No. 1048. Paris: OECD Publishing.
Manning, W. G., Newhouse, J. P., Duan, N., Keeler, K. B., Leibowitz, A., & Marquis, M.S. (1987). Health insurance and the demand for medical care: evidence from a randomized experiment’, American Economic Review, 77(3): 251–277.
Moreno-Serra, R., & Smith, P. C. (2012). Does progress towards universal health coverage improve population health? A review of the literature. The Lancet, 380, 917-23.
Mosca, I. (2007). Decentralization as a determinant of health care expenditure: empirical analysis for OECD countries. Applied Economics Letters, 14(7): 511-515.
Musgrove, P., Zeramdini, R., & Carrin, G. (2002). Basic patterns in national health expenditure. Bulletin of the World Health Organization, 80, 134-146.
Newhouse, J. P. (1992). Medical care costs: How much welfare loss? Journal of Economic Perspectives, (Summer), 3–21.
Newhouse, J. P. (1977). Medical care expenditure: A cross-national survey. Journal of Human Resources, 12, 115-125.
OECD, Eurostat, & WHO (2011). A system of health accounts. Paris: OECD Publishing. doi: 10.1787/9789264116016-en
OECD (2006). Projecting OECD health and long-term care expenditures: What are the main drivers? OECD Economics Department Working Paper, No. 477. Paris: OECD Publishing.
Okunade, A.A., (2005). Analysis and Implications of the Determinants of Healthcare Expenditure in African Countries. Health Care Management Science. 8 (4): 267-276.
Omran, A. R. (1971). The epidemiologic transition: A theory of the epidemiology of population change. The Milbank Memorial Fund Quarterly, 49, 509-538.
Savedoff, W. D., Bitrán, R., de Ferranti, D., Fan, V. Y., Holly, A., Moreno-Serra, R., Saksena, P., Smith, A. L., et al. (2012). Final report of the transitions in health financing project: Transitions in health financing and policies for universal health coverage. Washington: Results for Development Institute.
Savedoff, W. D., & Smith, A. L. (2011). Achieving universal health coverage: Learning from Chile, Japan, Malaysia and Sweden’, Working Paper. Washington, DC: Results for Development Institute.
26
Schieber, G., & Maeda, A. (1999). Health care financing and delivery in developing countries. Health Affairs,18, 193-205.
Sekhri, N., & Savedoff, W. D. (2005). Private health insurance: Implications for developing countries. Bulletin of the World Health Organization, 83, 127-134. Retrieved from http://www.who.int/bulletin/volumes/83/2/en/127.pdf
Smith, S., Newhouse, J. P., & Freeland, M. S. (2009). Income, insurance, and technology: Why does health spending outpace economic growth?. Health Affairs, 28(5), 1276-1284.
Sorenson, C., M. Drummond, & B.B. Khan. (2013) Medical technology as a key driver of rising health expenditure: disentangling the relationship. ClinicoEconomics and Outcomes Research. 2013(5):223–234. May 29.
Spaan, E., Mathijssen, J., Tromp, N., McBain, F., Have, A. T., & Baltussen, R. (2012). The impact of health insurance in Africa and Asia: a systematic review. Bulletin of the World Health Organization,90(9):685-92.
Triplett, J.E., & Bosworth, B.P. (2004). Productivity in the U.S. Services Sector—New Sources of Economic Growth. Washington, DC: Brookings Institution Press.
Tyson, J., Kashiwase, K., Soto, M., & Clements, B. (2012). Containing Public Health Spending: Lessons from Experiences of Advanced Economies, Ch. 6 in Clements, B., Coady, D. & Gupta, S. The Economics of Public Health Care Reform in Advanced and Emerging Economies. Washington: International Monetary Fund.
Valtorta, N. K, & Hanratty, B. (2013). Socioeconomic variation in the financial consequences of ill health for older people with chronic diseases: a systematic review. Maturitas. Apr;74(4):313-33.
van der Gaag, & Štimac, J. V. (2008). Towards a new paradigm for health sector development. The Rockefeller Foundation–Sponsored Initiative on the Role of the Private Sector in Health Systems in Developing Countries, Technical Partner Paper 3. New York: The Rockefeller Foundation.
Wagner, A.K., Graves, A.J., Reiss, S.K., Lecates, R., Zhang, F., & Ross-Degnan, D., (2011). Access to care and medicines, burden of health care expenditures, and risk protection: results from the World Health Survey. Health Policy.100(2-3):151-8.
Wagstaff, A. (2009). Social Health Insurance vs. Tax-Financed Health Systems—Evidence from the OECD. Policy Research Working Paper 4821. Washington: World Bank.
WHO (2012). National health accounts. Retrieved from http://www.who.int/nha/en/. Accessed 3 July 2012.
Wooldridge, J. M. (2000). Introductory econometrics: a modern approach. Cincinnati: South-Western College.
Xu, K., Evans, D. B., Carrin, G., Aguilar-Rivera, A. M., Musgrove, P., & Evans, T. (2007). Out-of-pocket spending: Protecting households from catastrophic health spending. Health Affairs, 26, 4972-983.
Xu, K., Saksena, P., & Holly, A. (2011). The determinants of health expenditure: A country-level panel data analysis. Working Paper. Washington: Results for Development Institute.

27
Zweifel, P., Felder, S., & Meiers, M. (1999). Aging of the population and health care expenditure: a red herring? Health Economics, 8, 485-96.
Zweifel, P., Steinmann, L., & Eugster, P. (2005). The Sisyphus Syndrome in Health Revisited. International Journal of Health Care Finance and Economics, 5(2): 127-145.