Embed Size (px)
Citation preview
Article
The Gut Microbiota Mediates the Anti-Seizure
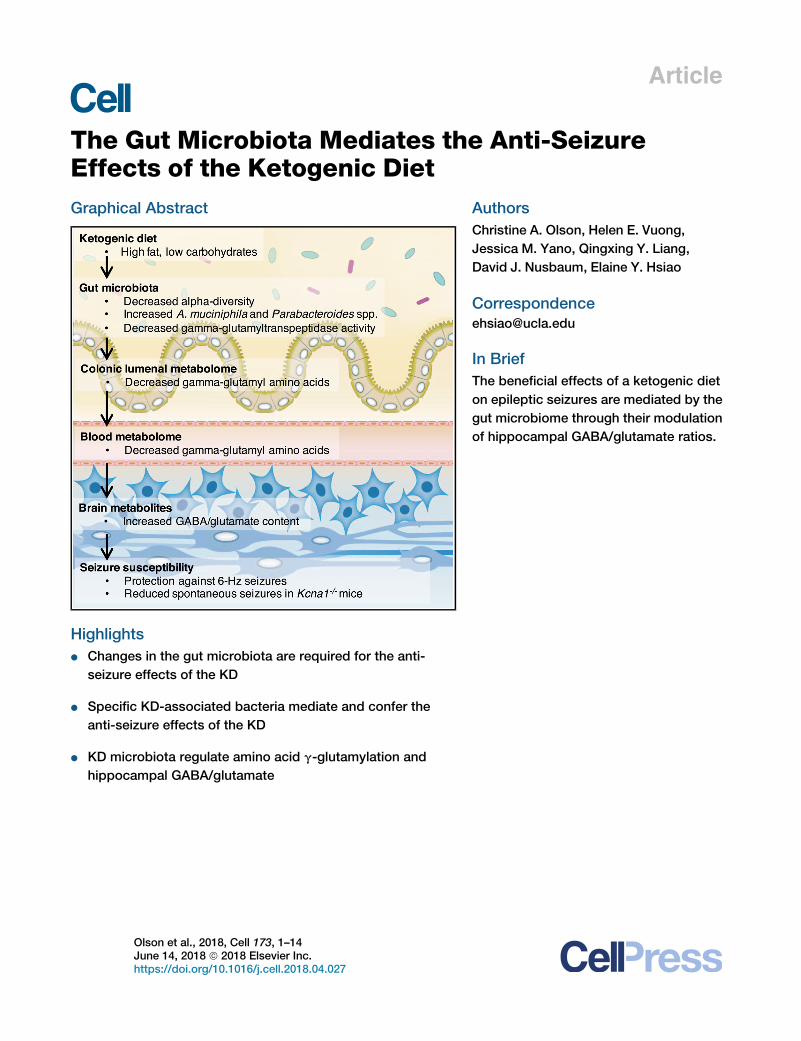
Effects of the Ketogenic DietGraphical Abstract
Highlights
d Changes in the gut microbiota are required for the anti-
seizure effects of the KD
d Specific KD-associated bacteria mediate and confer the
anti-seizure effects of the KD
d KD microbiota regulate amino acid g-glutamylation and
hippocampal GABA/glutamate
Olson et al., 2018, Cell 173, 1–14June 14, 2018 ª 2018 Elsevier Inc.https://doi.org/10.1016/j.cell.2018.04.027
Authors
Christine A. Olson, Helen E. Vuong,
Jessica M. Yano, Qingxing Y. Liang,
David J. Nusbaum, Elaine Y. Hsiao
In Brief
The beneficial effects of a ketogenic diet
on epileptic seizures are mediated by the
gut microbiome through their modulation
of hippocampal GABA/glutamate ratios.

Please cite this article in press as: Olson et al., The Gut Microbiota Mediates the Anti-Seizure Effects of the Ketogenic Diet, Cell (2018), https://doi.org/10.1016/j.cell.2018.04.027
Article
The Gut Microbiota Mediates the Anti-SeizureEffects of the Ketogenic DietChristine A. Olson,1 Helen E. Vuong,1 Jessica M. Yano,1 Qingxing Y. Liang,1 David J. Nusbaum,1 and Elaine Y. Hsiao1,2,*1Department of Integrative Biology and Physiology, University of California, Los Angeles, Los Angeles, CA 90095, USA2Lead Contact
*Correspondence: [email protected]://doi.org/10.1016/j.cell.2018.04.027
SUMMARY
The ketogenic diet (KD) is used to treat refractory ep-ilepsy, but the mechanisms underlying its neuropro-tective effects remain unclear. Here, we show thatthe gut microbiota is altered by the KD and requiredfor protection against acute electrically induced sei-zures and spontaneous tonic-clonic seizures in twomousemodels.Mice treatedwith antibiotics or rearedgerm free are resistant to KD-mediated seizure pro-tection. Enrichment of, and gnotobiotic co-coloniza-tion with, KD-associated Akkermansia and Parabac-teroides restores seizure protection. Moreover,transplantation of the KD gut microbiota and treat-ment with Akkermansia and Parabacteroides eachconfer seizure protection to mice fed a controldiet. Alterations in colonic lumenal, serum, and hippo-campal metabolomic profiles correlate with seizureprotection, including reductions in systemic gamma-glutamylated amino acids and elevated hippo-campal GABA/glutamate levels. Bacterial cross-feeding decreases gamma-glutamyltranspeptidaseactivity, and inhibiting gamma-glutamylation pro-motes seizure protection in vivo. Overall, this study re-veals that the gut microbiota modulates host meta-bolism and seizure susceptibility in mice.
INTRODUCTION
The low-carbohydrate, high-fat ketogenic diet (KD) is an effec-
tive treatment for refractory epilepsy, a condition affecting more
than one-third of epileptic individuals and defined by a failure to
respond to existing anticonvulsant medications (Kwan and Bro-
die, 2000). However, despite its value for treating epilepsy and
its increasing application to other disorders, including autism
spectrum disorder, Alzheimer’s disease, metabolic syndrome,
and cancer (Stafstrom and Rho, 2012), use of the KD remains
low due to difficulties with implementation, dietary compliance,
and adverse side effects (Freeman and Kossoff, 2010). Molec-
ular targets are needed to develop viable clinical interventions
for intractable epilepsy and other disorders for which the KD
is beneficial. Many studies have proposed roles for ketone
bodies, gamma-aminobutyric acid (GABA) modulation, and
mitochondrial anaplerosis in mediating the neurological effects
of the KD (Rogawski et al., 2016), but exactly how the KD con-
fers beneficial effects on brain activity and behavior remains
unclear.
The gutmicrobiota is a key intermediary between diet and host
physiology; the species composition and function of the gut mi-
crobiota is critically shaped by diet, and nutrients made available
to the host depend on microbial metabolism (Sonnenburg and
Backhed, 2016). Diet-induced changes in the gut microbiota
are reproducible and persistent (David et al., 2014), and as
such, have lasting impacts on the host. Several diet-induced
host pathologies are mediated by changes in the gut microbiota
in mouse models, including symptoms of atherosclerosis in
response to the carnitine-rich diet, undernutrition in response
to the Malawian diet, and abnormal social behavior in response
to maternal high-fat diet (Buffington et al., 2016; Koeth et al.,
2013; Smith et al., 2013).
The gut microbiota modulates several metabolic and neuro-
logical pathways in the host that could be relevant to KD-
mediated seizure protection. The KD alters the composition
of the gut microbiota in mice (Klein et al., 2016; Newell
et al., 2016), and ketosis is associated with altered gut micro-
biota in humans (David et al., 2014; Duncan et al., 2008). Inter-
estingly, fasted mice that lack microbiota exhibit impaired he-
patic ketogenesis and altered myocardial ketone metabolism
compared to fasted mice that are conventionally colonized
(Crawford et al., 2009). The microbiota is also increasingly
associated with changes in factors relevant to neurotransmis-
sion, including neurotransmitter signaling, synaptic protein
expression, long-term potentiation, and myelination, as well
as a variety of complex host behaviors, including stress-
induced, social, and cognitive behaviors (Vuong et al.,
2017). Notably, several clinical studies report that antibiotic
treatment increases risk of status epilepticus or symptomatic
seizures in epileptic individuals (Sutter et al., 2015), suggest-
ing a possible role for the microbiota in mitigating seizure
likelihood.
Based on emerging studies linking the gut microbiota to host
responses to diet, metabolism, neural activity, and behavior,
we hypothesized that the gutmicrobiota impacts the anti-seizure
effects of the KD. We show herein that the gut microbiota is
necessary and sufficient for seizure protection in two mouse
models of intractable epilepsy and further identify cooperative
interactions between two diet-associated bacteria that regulate
levels of circulating dietary metabolites, brain neurotransmitters,
and seizure incidence in mice.
Cell 173, 1–14, June 14, 2018 ª 2018 Elsevier Inc. 1

Please cite this article in press as: Olson et al., The Gut Microbiota Mediates the Anti-Seizure Effects of the Ketogenic Diet, Cell (2018), https://doi.org/10.1016/j.cell.2018.04.027
RESULTS
The Ketogenic Diet Alters the Gut MicrobiotaTo test whether the microbiota plays a role in KD-mediated
seizure protection, we first utilize the 6-Hz-induced seizure
model of refractory epilepsy, which involves low-frequency
corneal stimulation to induce complex partial seizures reminis-
cent of human temporal lobe epilepsy. The 6-Hz model is resis-
tant to several anti-epileptic drugs and used as amodel of refrac-
tory epilepsy for investigational drug screening (Barton et al.,
2001). The KD protects against 6-Hz seizures (Hartman et al.,
2010; Samala et al., 2008), as indicated by the increased current
intensity required to elicit a seizure in 50% of the subjects tested
(CC50, seizure threshold).
We fed conventionally colonized (specific pathogen-free
[SPF]) Swiss Webster mice a 6:1 fat:protein KD or a vitamin-
and mineral-matched control diet (CD) (Table S1). Compared
to CD controls, mice fed the KD exhibit elevated seizure thresh-
olds in response to 6-Hz stimulation (Figure 1A), decreased
serum glucose (Figure 1B), and increased serum b-hydroxybuty-
rate (BHB) (Figure 1C). There were no significant differences in
food consumption or weight gain across CD versus KD groups
(Figure S1A).
In addition to raising seizure thresholds, the KD alters the
composition of the gut microbiota by 4 days post-dietary
treatment (Figure 1D; Table S2). Decreased alpha diversity is
observed at each time point (Figures 1E and S1B) suggesting
KD-induced losses of particular bacterial taxa. Notably, the
KD increases the relative abundance of Akkermansia
muciniphila, from 2.8% ± 0.4% to 36.3% ± 2.8% (mean ±
SEM), by 4 days and through 14 days of dietary treatment
(Figures 1F, S1C, and S1D). Parabacteroides, Sutterella,
and Erysipelotrichaceae are also significantly increased in
KD-fed mice, whereas Allobaculum, Bifidobacterium, and
Desulfovibrio are increased in CD-fed mice (Figures 1F and
S1D). These results reveal that the composition of the gut
microbiota is rapidly and substantially altered in response to
the KD.
The Gut Microbiota Is Necessary and Sufficient for theAnti-seizure Effects of the KDTo determine whether the gut microbiota is necessary for the
anti-seizure effects of the KD, we measured 6-Hz seizure
thresholds in mice reared germ-free (GF) or treated with anti-
biotics (Abx). Compared to CD controls, SPF mice fed the KD
for 14 days exhibit increased seizure thresholds and altered
microbiota (Figure 1). These protective effects of the KD are
abrogated in GF mice (Figure 2A) and Abx-treated SPF mice
(Figure 2C), indicating that the gut microbiota is required
for KD-mediated increases in seizure protection. Postnatal
conventionalization of GF mice with the SPF gut microbiota re-
stores seizure protection to levels seen in native SPF KD mice
(Figure 2A), suggesting that the microbiota actively mediates
seizure protection through pathways that are independent of
pre-weaning developmental processes. Notably, microbial ef-
fects on seizure resistance do not correlate with changes in
serum BHB or glucose levels (Figures 2B and 2D), and there
are no significant differences between groups in levels of
2 Cell 173, 1–14, June 14, 2018
intestinal, liver, or brain BHB (Figures S2A–S2C). Consistent
with this, previous studies report that BHB concentrations
do not necessarily correlate with seizure protection, and
ketosis may be necessary but not sufficient for KD-mediated
seizure control (Bough and Rho, 2007). Overall, these data
demonstrate that the gut microbiota is required for the anti-
seizure effects of the KD in the 6-Hz seizure model and further
suggest that gut microbes modulate seizure susceptibility
through mechanisms that do not involve alterations in BHB
levels.
To determine whether specific bacterial taxa mediate seizure
protection in response to the KD, Abx-treated SPF mice were
colonized with select KD-associated bacteria, fed the KD,
and then tested for 6-Hz seizures. A. muciniphila and Parabac-
teroides were selected as the taxa most highly enriched by the
KD. Mice were gavaged with 109 colony-forming units (CFU)
bacteria: (1) A. muciniphila; (2) 1:1 ratio of Parabacteroides
merdae and P. distasonis, as species with highest homology
to the Parabacteroides operational taxonomic unit sequences
that were enriched by the KD (Figure 1D; Table S2); or (3)
2:1:1 ratio of A. muciniphila, P. merdae, and P. distasonis. At
14 days after oral gavage, mice treated with A. muciniphila
harbored 43.7% ± 0.4% relative abundance of A. muciniphila
(Figure S3A). Mice gavaged with Parabacteroides harbored
70.9% ± 4.0% relative abundance, and mice gavaged
with both taxa harbored 49.0% ± 4.1% A. muciniphila and
22.5% ± 5.4% Parabacteroides. Consistent with this, colonic
sections from mice treated with A. muciniphila and Parabacter-
oides exhibit increased hybridization of the A. muciniphila
probe MUC1437 (Derrien et al., 2008) and the Bacteroides
and Parabacteroides probe BAC303 (Manz et al., 1996) (Fig-
ure 3A). There were no significant differences in weight, serum
glucose levels, or bacterial enrichment across mice fed CD
versus KD (Figures S3A–S3C). Consistent with our previous
observation (Figures 2B and 2D), serum BHB was similarly
elevated in KD-fed groups, independent of colonization status
(Figure S3C). These data reveal that microbiota depletion by
Abx treatment followed by oral gavage of exogenous
bacteria results in their persistent intestinal enrichment by
14 days post-inoculation.
We next examined seizure susceptibility in mice with selective
enrichment of KD-associated gut bacteria. Treatment with the
KD alone elevated seizure thresholds by 24.5% from 19.4 ±
0.8 mA, in SPF CD mice, to 24.2 ± 0.3 mA, in SPF KD mice,
whereasAbx treatment of KD-fedmiceprevented this anti-seizure
effect (Figure 3B). Co-administration of A. muciniphila and Para-
bacteroides restores seizure protection in Abx-treated mice fed
the KD, raising thresholds by 36.0%, from 19.9 ± 0.3 mA, in Abx
KD mice, to 27.0 ± 0.5 mA, in AkkPb KD mice (Figure 3B). This
protective effect is specific to A. muciniphila with P. merdae, as
mice gavaged with A. muciniphila and P. distasonis exhibit no
restoration of seizure protection (Figure S3D). There is no signifi-
cant increase in seizure threshold after enrichment of either
A. muciniphila or Parabacteroides alone (Figure 3B), indicating
that both taxa are required for mediating the anti-seizure effects
of thediet. There isalsonoeffectof treatmentwithBifidobacterium
longum (Figure 3B), as a negative control taxon that was enriched
in CD-fed mice (Figure S1D). Moreover, co-colonization of

A
C D
B
E F
Figure 1. The Ketogenic Diet Alters the Gut Microbiota and Protects against 6-Hz Psychomotor Seizures
(A) Seizure thresholds in response to 6-Hz stimulation in independent cohorts ofmice fed theCDor KD for 2, 4, 8, 10, or 14 days (left). n = 8, 6, 9, 20, 6 (CD); 8, 7, 12,
21, 5 (KD). Behavior in representative cohort of seizure-testedmice at 14 days post dietary treatment (right). Yellow line at y = 10 s represents threshold for scoring
seizures, and yellow triangle at 24 mA denotes starting current per experimental cohort. n = 16.
(B) Levels of serum glucose in mice fed CD or KD for 2, 4, 8, 10, or 14 days. Data are normalized to serum glucose levels seen in SPF CDmice for each time point.
n = 8, 5, 8, 8, 19 (CD); 8, 8, 8, 7, 19 (KD).
(C) Levels of serum BHB mice fed CD or KD for 2, 4, 8, 10, or 14 days. n = 8, 13, 8, 8, 37 (CD); 8, 16, 8, 7, 38 (KD).
(D) Principal coordinates analysis of weighted (left) and unweighted (right) UniFrac distance based on 16S rDNA profiling of feces frommice fed CD or KD for 0, 4,
8, or 14 days. n = 3 cages/group.
(E) Alpha diversity of fecal 16S rDNA sequencing data from mice fed CD or KD for 14 days. n = 3 cages/group.
(F) Taxonomic distributions of bacteria from fecal 16S rDNA sequencing data (left). n = 3 cages/group. Relative abundances of Akkermansia muciniphila and
Parabacteroides (right). n = 3 cages/group.
Data are presented as mean ± SEM. Two-way ANOVA with Bonferroni (A–C and E), Kruskal-Wallis with Bonferroni (F): *p < 0.05, **p < 0.01, ***p < 0.001, ****p <
0.0001. n.s., not statistically significant; SPF, specific pathogen-free; CD, control diet; KD, ketogenic diet; CC50, current intensity producing seizures in 50% of
mice tested; BHB, beta-hydroxybutyrate; OTUs, operational taxonomic units.
See also Figure S1 and Tables S1 and S2.
Please cite this article in press as: Olson et al., The Gut Microbiota Mediates the Anti-Seizure Effects of the Ketogenic Diet, Cell (2018), https://doi.org/10.1016/j.cell.2018.04.027
A. muciniphila and Parabacteroides in GF mice promotes seizure
protection in response to theKD,whencompared toGF,Parabac-
teroides-monocolonized, or A. muciniphila-monocolonized mice
(Figure 3C), suggesting that A. muciniphila and Parabacteroides
together raise seizure thresholds in the absence of other
indigenous gut microbes. Overall, these findings reveal that
A. muciniphila and Parabacteroides increase in response to the
KD and mediate its protective effect in the 6-Hz seizure model.
The Gut Microbiota Confers Seizure Protection to MiceFed the CDThe previous experiments examine seizure protection in mice
fed the KD. To determine whether KD-associated gut microbes
also confer anti-seizure effects to mice fed the CD, Abx-treated
mice were transplanted with CD versus KD microbiota from SPF
mice, fed the CD, and tested for their susceptibility to 6-Hz sei-
zures after 4 days of dietary treatment. Abx-treated mice were
Cell 173, 1–14, June 14, 2018 3
A B
C D
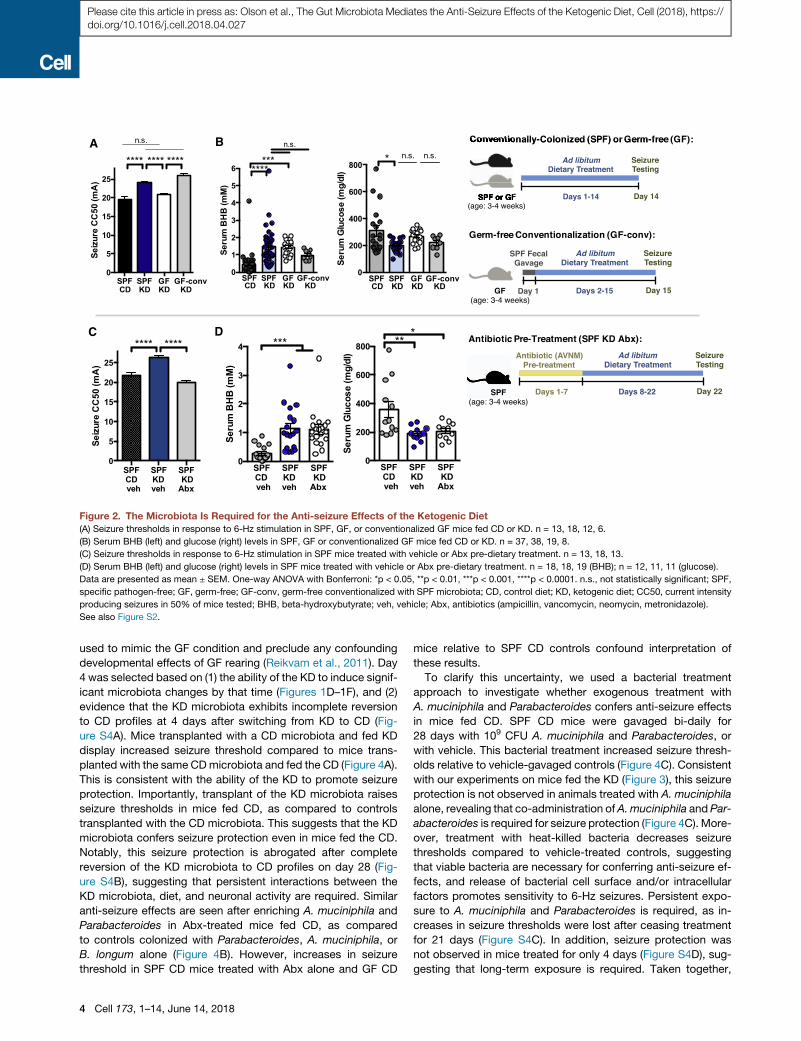
Figure 2. The Microbiota Is Required for the Anti-seizure Effects of the Ketogenic Diet
(A) Seizure thresholds in response to 6-Hz stimulation in SPF, GF, or conventionalized GF mice fed CD or KD. n = 13, 18, 12, 6.
(B) Serum BHB (left) and glucose (right) levels in SPF, GF or conventionalized GF mice fed CD or KD. n = 37, 38, 19, 8.
(C) Seizure thresholds in response to 6-Hz stimulation in SPF mice treated with vehicle or Abx pre-dietary treatment. n = 13, 18, 13.
(D) Serum BHB (left) and glucose (right) levels in SPF mice treated with vehicle or Abx pre-dietary treatment. n = 18, 18, 19 (BHB); n = 12, 11, 11 (glucose).
Data are presented as mean ± SEM. One-way ANOVA with Bonferroni: *p < 0.05, **p < 0.01, ***p < 0.001, ****p < 0.0001. n.s., not statistically significant; SPF,
specific pathogen-free; GF, germ-free; GF-conv, germ-free conventionalized with SPF microbiota; CD, control diet; KD, ketogenic diet; CC50, current intensity
producing seizures in 50% of mice tested; BHB, beta-hydroxybutyrate; veh, vehicle; Abx, antibiotics (ampicillin, vancomycin, neomycin, metronidazole).
See also Figure S2.
Please cite this article in press as: Olson et al., The Gut Microbiota Mediates the Anti-Seizure Effects of the Ketogenic Diet, Cell (2018), https://doi.org/10.1016/j.cell.2018.04.027
used to mimic the GF condition and preclude any confounding
developmental effects of GF rearing (Reikvam et al., 2011). Day
4 was selected based on (1) the ability of the KD to induce signif-
icant microbiota changes by that time (Figures 1D–1F), and (2)
evidence that the KD microbiota exhibits incomplete reversion
to CD profiles at 4 days after switching from KD to CD (Fig-
ure S4A). Mice transplanted with a CD microbiota and fed KD
display increased seizure threshold compared to mice trans-
planted with the same CDmicrobiota and fed the CD (Figure 4A).
This is consistent with the ability of the KD to promote seizure
protection. Importantly, transplant of the KD microbiota raises
seizure thresholds in mice fed CD, as compared to controls
transplanted with the CD microbiota. This suggests that the KD
microbiota confers seizure protection even in mice fed the CD.
Notably, this seizure protection is abrogated after complete
reversion of the KD microbiota to CD profiles on day 28 (Fig-
ure S4B), suggesting that persistent interactions between the
KD microbiota, diet, and neuronal activity are required. Similar
anti-seizure effects are seen after enriching A. muciniphila and
Parabacteroides in Abx-treated mice fed CD, as compared
to controls colonized with Parabacteroides, A. muciniphila, or
B. longum alone (Figure 4B). However, increases in seizure
threshold in SPF CD mice treated with Abx alone and GF CD
4 Cell 173, 1–14, June 14, 2018
mice relative to SPF CD controls confound interpretation of
these results.
To clarify this uncertainty, we used a bacterial treatment
approach to investigate whether exogenous treatment with
A. muciniphila and Parabacteroides confers anti-seizure effects
in mice fed CD. SPF CD mice were gavaged bi-daily for
28 days with 109 CFU A. muciniphila and Parabacteroides, or
with vehicle. This bacterial treatment increased seizure thresh-
olds relative to vehicle-gavaged controls (Figure 4C). Consistent
with our experiments on mice fed the KD (Figure 3), this seizure
protection is not observed in animals treated with A. muciniphila
alone, revealing that co-administration ofA.muciniphila and Par-
abacteroides is required for seizure protection (Figure 4C). More-
over, treatment with heat-killed bacteria decreases seizure
thresholds compared to vehicle-treated controls, suggesting
that viable bacteria are necessary for conferring anti-seizure ef-
fects, and release of bacterial cell surface and/or intracellular
factors promotes sensitivity to 6-Hz seizures. Persistent expo-
sure to A. muciniphila and Parabacteroides is required, as in-
creases in seizure thresholds were lost after ceasing treatment
for 21 days (Figure S4C). In addition, seizure protection was
not observed in mice treated for only 4 days (Figure S4D), sug-
gesting that long-term exposure is required. Taken together,

A
B
C
Figure 3. KD-Associated Bacteria Sufficiently Mediate the Anti-seizure Effects of the Ketogenic Diet
(A) Fluorescence in situ hybridization for A. muciniphila (MUC1437) and select Bacteroides and Parabacteroides, including P. merdae and P. merdae (BAC303) in
colonic lumen from SPFmice fed CD, SPF mice fed KD, or A. muciniphila and Parabacteroides-enriched mice fed KD. Scale bar, 25 mm. Dotted lines indicate the
borders of the intestinal epithelium. n = 3.
(B) Seizure thresholds in response to 6-Hz stimulation in SPF mice pre-treated with vehicle or Abx, and colonized with Parabacteroides, A. muciniphila, both, or
Bifidobacterium longum (left). n = 13, 18, 15, 6, 8, 5, 5. Behavior in representative cohort of seizure-tested mice (right). Yellow line at y = 10 s represents threshold
for scoring seizures, and yellow triangle at 24 mA denotes starting current per experimental cohort. n = 12, 16, 8, 25.
(C) Seizure thresholds in response to 6-Hz stimulation in GF mice colonized with Parabacteroides and/or A. muciniphila (top). n = 15, 4, 9, 9. Behavior in seizure-
tested mice (bottom). n = 17, 19.
Data are presented as mean ± SEM. One-way ANOVA with Bonferroni: **p < 0.01, ***p < 0.001, ****p < 0.0001. SPF, specific pathogen-free; GF, germ-free; CD,
control diet; KD, ketogenic diet; CC50, current intensity producing seizures in 50% of mice tested; veh, vehicle; Abx, pre-treated with antibiotics (ampicillin,
vancomycin, neomycin, metronidazole); Pb,Parabacteroides (P.merdae andP. distasonis); Akk,Akkermansiamuciniphila; AkkPb,A.muciniphila,P.merdae, and
P. distasonis; Bf, Bifidobacterium longum.
See also Figure S3.
Please cite this article in press as: Olson et al., The Gut Microbiota Mediates the Anti-Seizure Effects of the Ketogenic Diet, Cell (2018), https://doi.org/10.1016/j.cell.2018.04.027
these findings reveal that fecal transplant of the KD microbiota
and long-term bacterial treatment with the KD-associated taxa
A. muciniphila and Parabacteroides confer protection against
6-Hz seizures in mice fed the CD.
KD-Associated Bacteria Reduce Tonic-Clonic Seizuresin Kcna1�/� MiceEpilepsy is a heterogeneous disorder with diverse clinical pre-
sentations. The 6-Hz seizure model for pharmacoresistant epi-
lepsy examines acute, electrically induced seizures and is widely
used for testing the efficacy of the KD and new anti-epileptic
drugs (Hartman et al., 2010; Samala et al., 2008). While a power-
ful tool for studying fundamental influences on seizure suscepti-
bility, the model exhibits low construct validity for human epi-
lepsy and conveys limited information on seizure severity and
form. To determine whether our findings from the 6-Hz model
also apply to different seizure types and etiologies, we further
tested roles for the microbiota in modulating generalized tonic-
clonic seizures in the Kcna1�/� mouse model for temporal lobe
epilepsy and sudden unexpected death in epilepsy (SUDEP).
Kcna1�/� mice harbor a null mutation in the voltage-gated po-
tassium channel Kv1.1 alpha subunit, mimicking associations
Cell 173, 1–14, June 14, 2018 5

A B
C
Figure 4. KD-Associated Bacteria Sufficiently Confer Seizure Protection in Mice Fed the Control Diet
(A) Seizure thresholds in response to 6-Hz stimulation in Abx-treated SPFmice transplanted with the CDmicrobiota (CD-FMT) or KDmicrobiota (KD-FMT) and fed
the CD or KD (left). n = 6, 5, 5. Behavior in representative cohort of seizure-tested mice (right). Yellow line at y = 10 s represents threshold for scoring seizures, and
yellow triangle at 24 mA denotes starting current per experimental cohort. n = 12.
(B) Seizure thresholds in response to 6-Hz stimulation in SPFmice pre-treated with vehicle or Abx and colonized with Parabacteroides, A. muciniphila, both, or B.
longum (left). n = 13, 18, 8, 9, 8, 6, 6. Behavior in representative cohort of seizure-tested mice (right). n = 16, 16, 12, 12.
(C) Seizure thresholds in response to 6-Hz stimulation in SPFmice orally gavaged with A. muciniphila, P. merdae, and P. distasonis, A. muciniphila alone, or heat-
killed A. muciniphila and Parabacteroides (left). n = 6, 6, 4, 3. Behavior in seizure-tested mice (right). n = 15, 20, 8, 8.
Data are presented as mean ± SEM. One-way ANOVA with Bonferroni: *p < 0.05, ***p < 0.001, ****p < 0.0001. SPF, specific pathogen-free; CD, control diet; KD,
ketogenic diet; CC50, current intensity producing seizures in 50% of mice tested; CD-FMT, transplanted with CD microbiota; KD-FMT, transplanted with KD
microbiota; veh, vehicle; Abx, pre-treated with antibiotics (ampicillin, vancomycin, neomycin, metronidazole); Pb, Parabacteroides (P. merdae and P. distasonis);
Akk, Akkermansia muciniphila; AkkPb, A. muciniphila, P.merdae, and P. distasonis; Bf,Bifidobacterium longum; hk-AkkPb, heat-killed A. muciniphila, P. merdae,
and P. distasonis.
See also Figure S4.
Please cite this article in press as: Olson et al., The Gut Microbiota Mediates the Anti-Seizure Effects of the Ketogenic Diet, Cell (2018), https://doi.org/10.1016/j.cell.2018.04.027
of human KCNA1 gene variants with epilepsy, episodic ataxia,
and SUDEP (Scheffer et al., 1998; Zuberi et al., 1999). Kcna1�/�
mice develop severe spontaneous recurrent seizures, which are
reduced 54% by the KD (Fenoglio-Simeone et al., 2009).
Kcna1�/� SPF C3HeB/FeJ mice were treated with Abx or
vehicle for 1 week, gavaged with vehicle or A. muciniphila and
Parabacteroides, and fed KD or CD for 3 weeks. Seizure fre-
quency and duration were recorded by EEG over 3 days, where
electrographic seizures were identified based on characteristic
epileptiform spike patterns (Figure 5C). Consistent with findings
6 Cell 173, 1–14, June 14, 2018
from the 6-Hz seizure model (Figure 1F), the KD significantly in-
creases A. muciniphila and Parabacteroides in Kcna1�/� mice
(Figures 5A and 5B). The degree of diet-induced enrichment of
these taxa is less than that seen in the 6-Hz model, which could
be due to an effect of host genotype on baseline microbiota
composition and responses to KD (Klein et al., 2016). Nonethe-
less, we observed decreases in seizure incidence and duration
in KD-fed Kcna1�/� mice compared to CD-fed Kcna1�/� con-
trols (Figure 5D). Interestingly, Kcna1�/� mice that were
pre-treated with Abx exhibit a significant increase in seizures

C
D
A B
Figure 5. KD-Associated Bacteria Mediate Protection Against Tonic-Clonic Seizures in Response to the Ketogenic Diet
(A) Principal coordinates analysis of weighted UniFrac distances based on 16S rDNA profiling of feces Kcna1�/� mice fed CD or KD for 14 days. n = 7 ca-
ges/group.
(B) Average taxonomic distributions of bacteria from fecal 16S rDNA sequencing data (left). Relative abundances ofA.muciniphila andParabacteroides (right). n =
7 cages/group.
(C) Representative EEG trace showing stages used to define seizures quantified in (D).
(D) Average number of seizures per day (left) and total duration of seizures per day (right) in SPF Kcna1�/� mice treated with vehicle or Abx, colonized with
A. muciniphila and Parabacteroides spp. or nothing, and fed CD or KD. n = 2, 8, 6, 12, 9, 3.
Data are presented as mean ± SEM. Kruskal-Wallis with Bonferroni (A and B), Mann-Whitney (D): *p < 0.05. SPF, specific pathogen-free; CD, control diet; KD,
ketogenic diet; veh, vehicle; Abx, pre-treated with antibiotics (ampicillin, vancomycin, neomycin, metronidazole); AkkPb, A. muciniphila, P. merdae, and
P. distasonis.
See also Figure S5.
Please cite this article in press as: Olson et al., The Gut Microbiota Mediates the Anti-Seizure Effects of the Ketogenic Diet, Cell (2018), https://doi.org/10.1016/j.cell.2018.04.027
per day and total seizure duration compared to vehicle-treated,
KD-fed Kcna1�/� controls. There is no significant difference in
average spike frequency or average duration per seizure (Figures
S5A–S5D) suggesting a primary effect of Abx treatment and
depletion of the gut microbiota on spontaneous seizure occur-
rence rather than seizure form (Figure S5A). Moreover, coloniza-
tion of Abx-treated Kcna1�/� mice with A. muciniphila and Para-
bacteroides reduces seizure frequency and total duration of
seizures toward levels seen in vehicle-treated controls (Fig-
ure 5D). There were no significant differences in weight gain or
food consumption between mice fed the KD versus CD (Fig-
ure S5E). In contrast to a previous report that used a different
KD formulation (Simeone et al., 2016), we observed no differ-
ences in survival across groups (Figure S5F). Taken together,
these findings support the notion that the gut microbiota medi-
ates the anti-seizure effects of the KD across varied seizure
types and mouse models.
The Microbiota Modulates Gut, Serum, and BrainMetabolomesBasedon the role of thegutmicrobiota inmodulatingeffectsof the
KDonseizureoccurrence,wehypothesized thatmicrobial dietary
Cell 173, 1–14, June 14, 2018 7

A B
C
D
FE
(legend on next page)
8 Cell 173, 1–14, June 14, 2018
Please cite this article in press as: Olson et al., The Gut Microbiota Mediates the Anti-Seizure Effects of the Ketogenic Diet, Cell (2018), https://doi.org/10.1016/j.cell.2018.04.027
Please cite this article in press as: Olson et al., The Gut Microbiota Mediates the Anti-Seizure Effects of the Ketogenic Diet, Cell (2018), https://doi.org/10.1016/j.cell.2018.04.027
metabolism regulates secondary metabolites that impact seizure
susceptibility. We utilizedmetabolomic profiling to identify candi-
date microbiota-dependent molecules in colonic lumenal con-
tents and sera of SPFmice fedCD, SPFmice fedKD, Abx-treated
SPF fed KD, and A. muciniphila- and Parabacteroides-enriched
mice fed KD (Figures 6A and S6A). 622 metabolites, spanning
amino acid, carbohydrate, lipid, nucleotide, peptide, and xenobi-
otic supergroups, were detected in mouse colonic contents, and
670metabolites were detected inmouse sera (Tables S4 andS5).
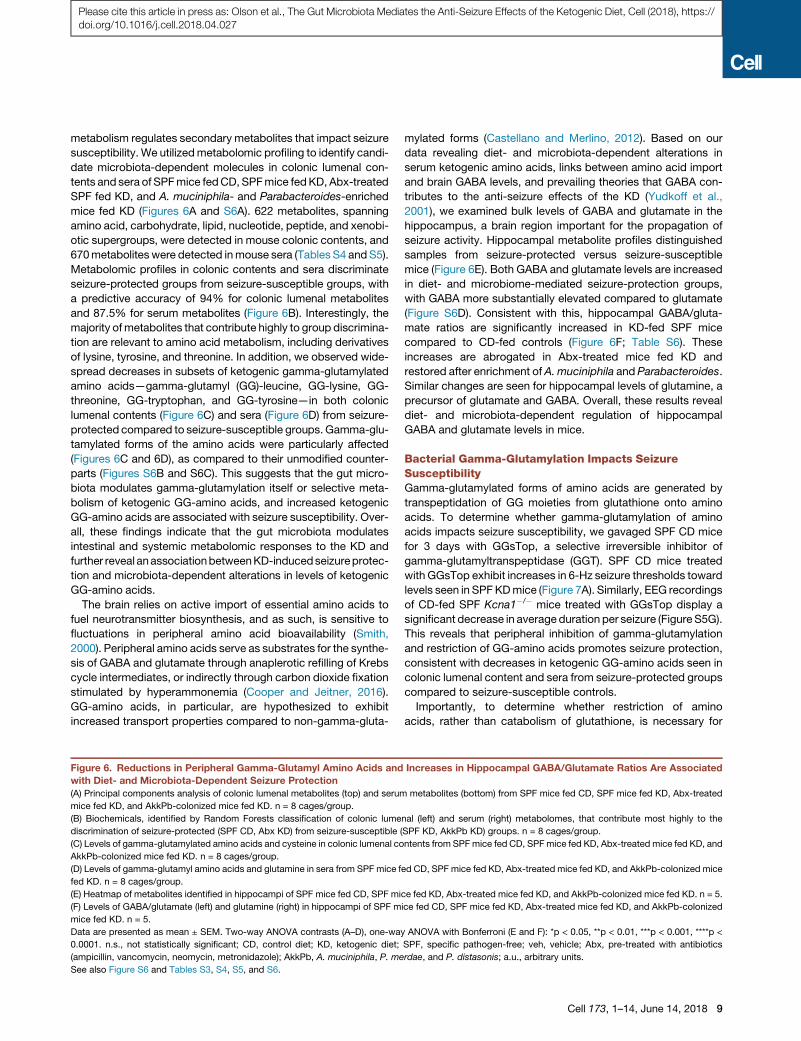
Metabolomic profiles in colonic contents and sera discriminate
seizure-protected groups from seizure-susceptible groups, with
a predictive accuracy of 94% for colonic lumenal metabolites
and 87.5% for serum metabolites (Figure 6B). Interestingly, the
majority ofmetabolites that contribute highly to group discrimina-
tion are relevant to amino acid metabolism, including derivatives
of lysine, tyrosine, and threonine. In addition, we observed wide-
spread decreases in subsets of ketogenic gamma-glutamylated
amino acids—gamma-glutamyl (GG)-leucine, GG-lysine, GG-
threonine, GG-tryptophan, and GG-tyrosine—in both colonic
lumenal contents (Figure 6C) and sera (Figure 6D) from seizure-
protected compared to seizure-susceptible groups. Gamma-glu-
tamylated forms of the amino acids were particularly affected
(Figures 6C and 6D), as compared to their unmodified counter-
parts (Figures S6B and S6C). This suggests that the gut micro-
biota modulates gamma-glutamylation itself or selective meta-
bolism of ketogenic GG-amino acids, and increased ketogenic
GG-amino acids are associated with seizure susceptibility. Over-
all, these findings indicate that the gut microbiota modulates
intestinal and systemic metabolomic responses to the KD and
further reveal anassociationbetweenKD-inducedseizureprotec-
tion and microbiota-dependent alterations in levels of ketogenic
GG-amino acids.
The brain relies on active import of essential amino acids to
fuel neurotransmitter biosynthesis, and as such, is sensitive to
fluctuations in peripheral amino acid bioavailability (Smith,
2000). Peripheral amino acids serve as substrates for the synthe-
sis of GABA and glutamate through anaplerotic refilling of Krebs
cycle intermediates, or indirectly through carbon dioxide fixation
stimulated by hyperammonemia (Cooper and Jeitner, 2016).
GG-amino acids, in particular, are hypothesized to exhibit
increased transport properties compared to non-gamma-gluta-
Figure 6. Reductions in Peripheral Gamma-Glutamyl Amino Acids and
with Diet- and Microbiota-Dependent Seizure Protection
(A) Principal components analysis of colonic lumenal metabolites (top) and serum
mice fed KD, and AkkPb-colonized mice fed KD. n = 8 cages/group.
(B) Biochemicals, identified by Random Forests classification of colonic lume
discrimination of seizure-protected (SPF CD, Abx KD) from seizure-susceptible (
(C) Levels of gamma-glutamylated amino acids and cysteine in colonic lumenal co
AkkPb-colonized mice fed KD. n = 8 cages/group.
(D) Levels of gamma-glutamyl amino acids and glutamine in sera from SPF mice f
fed KD. n = 8 cages/group.
(E) Heatmap of metabolites identified in hippocampi of SPF mice fed CD, SPF mi
(F) Levels of GABA/glutamate (left) and glutamine (right) in hippocampi of SPF m
mice fed KD. n = 5.
Data are presented as mean ± SEM. Two-way ANOVA contrasts (A–D), one-wa
0.0001. n.s., not statistically significant; CD, control diet; KD, ketogenic diet;
(ampicillin, vancomycin, neomycin, metronidazole); AkkPb, A. muciniphila, P. me
See also Figure S6 and Tables S3, S4, S5, and S6.
mylated forms (Castellano and Merlino, 2012). Based on our
data revealing diet- and microbiota-dependent alterations in
serum ketogenic amino acids, links between amino acid import
and brain GABA levels, and prevailing theories that GABA con-
tributes to the anti-seizure effects of the KD (Yudkoff et al.,
2001), we examined bulk levels of GABA and glutamate in the
hippocampus, a brain region important for the propagation of
seizure activity. Hippocampal metabolite profiles distinguished
samples from seizure-protected versus seizure-susceptible
mice (Figure 6E). Both GABA and glutamate levels are increased
in diet- and microbiome-mediated seizure-protection groups,
with GABA more substantially elevated compared to glutamate
(Figure S6D). Consistent with this, hippocampal GABA/gluta-
mate ratios are significantly increased in KD-fed SPF mice
compared to CD-fed controls (Figure 6F; Table S6). These
increases are abrogated in Abx-treated mice fed KD and
restored after enrichment of A.muciniphila and Parabacteroides.
Similar changes are seen for hippocampal levels of glutamine, a
precursor of glutamate and GABA. Overall, these results reveal
diet- and microbiota-dependent regulation of hippocampal
GABA and glutamate levels in mice.
Bacterial Gamma-Glutamylation Impacts SeizureSusceptibilityGamma-glutamylated forms of amino acids are generated by
transpeptidation of GG moieties from glutathione onto amino
acids. To determine whether gamma-glutamylation of amino
acids impacts seizure susceptibility, we gavaged SPF CD mice
for 3 days with GGsTop, a selective irreversible inhibitor of
gamma-glutamyltranspeptidase (GGT). SPF CD mice treated
with GGsTop exhibit increases in 6-Hz seizure thresholds toward
levels seen in SPFKDmice (Figure 7A). Similarly, EEG recordings
of CD-fed SPF Kcna1�/� mice treated with GGsTop display a
significant decrease in average duration per seizure (Figure S5G).
This reveals that peripheral inhibition of gamma-glutamylation
and restriction of GG-amino acids promotes seizure protection,
consistent with decreases in ketogenic GG-amino acids seen in
colonic lumenal content and sera from seizure-protected groups
compared to seizure-susceptible controls.
Importantly, to determine whether restriction of amino
acids, rather than catabolism of glutathione, is necessary for
Increases in Hippocampal GABA/Glutamate Ratios Are Associated
metabolites (bottom) from SPF mice fed CD, SPF mice fed KD, Abx-treated
nal (left) and serum (right) metabolomes, that contribute most highly to the
SPF KD, AkkPb KD) groups. n = 8 cages/group.
ntents from SPFmice fed CD, SPFmice fed KD, Abx-treated mice fed KD, and
ed CD, SPF mice fed KD, Abx-treated mice fed KD, and AkkPb-colonized mice
ce fed KD, Abx-treated mice fed KD, and AkkPb-colonized mice fed KD. n = 5.
ice fed CD, SPF mice fed KD, Abx-treated mice fed KD, and AkkPb-colonized
y ANOVA with Bonferroni (E and F): *p < 0.05, **p < 0.01, ***p < 0.001, ****p <
SPF, specific pathogen-free; veh, vehicle; Abx, pre-treated with antibiotics
rdae, and P. distasonis; a.u., arbitrary units.
Cell 173, 1–14, June 14, 2018 9

A B
C D
E F G H
Figure 7. The Ketogenic Diet and Bacterial Cross-Feeding Reduces Gamma-Glutamyltranspeptidase Activity, and GGT Inhibition Suffi-
ciently Confers Seizure Protection
(A) 6-Hz seizure thresholds in response to oral gavage with the GGT inhibitor, GGsTop, in SPF mice fed CD (left). n = 6, 9. Behavior in seizure-tested
mice (right). Yellow line at y = 10 s represents threshold for scoring seizures, and yellow triangle at 24 mA denotes starting current per experimental cohort.
n = 16.
(legend continued on next page)
10 Cell 173, 1–14, June 14, 2018
Please cite this article in press as: Olson et al., The Gut Microbiota Mediates the Anti-Seizure Effects of the Ketogenic Diet, Cell (2018), https://doi.org/10.1016/j.cell.2018.04.027

Please cite this article in press as: Olson et al., The Gut Microbiota Mediates the Anti-Seizure Effects of the Ketogenic Diet, Cell (2018), https://doi.org/10.1016/j.cell.2018.04.027
the anti-seizure effects of the KD microbiota, we supplemented
KD-fed A. muciniphila and Parabacteroides-enriched mice with
the ketogenic amino acids leucine, lysine, threonine, tryptophan,
and tyrosine, and then tested for 6-Hz seizures. Elevating sys-
temic levels of ketogenic amino acids decreases seizure thresh-
olds to levels seen in vehicle-treatedSPFCDcontrols (Figure 7B).
This suggests that restriction of peripheral ketogenic amino
acids is necessary for mediating microbiota- and KD-dependent
increases in seizure resistance.
Both host cells and particular bacterial species exhibit GGT
activity (van der Stel et al., 2015). To gain insight into whether
the KD and interactions between A. muciniphila and Parabacter-
oides suppress bacterial gamma-glutamylation in vivo, we
measured GGT activity in fecal samples collected from SPF or
A. muciniphila and Parabacteroides-enriched mice fed the CD
or KD. Feeding SPF mice with KD decreases fecal GGT activity
compared to CD controls (Figure 7C). Similar reduction in fecal
GGT activity is seen after enriching A. muciniphila and Parabac-
teroides in CD-fed mice. Moreover, enriching A. muciniphila and
Parabacteroides and feeding with KD further decreases fecal
GGT activity relative to that seen in SPF KD and SPF CD mice.
Exposing all fecal samples to the GGT inhibitor GGsTop elimi-
nates the detected signals, confirming that the measurements
reflect GGT activity. Consistent with this, treatment of CD-fed
SPF mice with A. muciniphila and Parabacteroides decreases
fecal GGT activity relative to vehicle-treated controls and mice
treated with heat-killed bacteria (Figure 7D). Overall, these data
reveal that enriching for or exogenous treatment with
A. muciniphila and Parabacteroides reduces fecal GGT activity,
which could explain the low levels of colonic and serum GG-
amino acids observed in seizure-protected mice.
To explore whether bacterial gamma-glutamylation is affected
by interactions between A. muciniphila and Parabacteroides, we
measured GGT activity in bacteria grown in an in vitro cross-
feeding system (Flynn et al., 2016). Because A. muciniphila
does not exhibit GGT activity, we focused particularly on
P. merdae, where GGT activity was ablated by GGsTop (Fig-
ure S7A). When A. muciniphila is embedded in a CD- or
KD-based agar, and P. merdae is overlaid in M9 minimal media
over the agar, both bacteria exhibit enhanced growth (Figures 7E
and 7F), suggesting that A. muciniphila liberates soluble factors
(B) 6-Hz seizure thresholds in response to supplementation with ketogenic amino
(left). n = 5, 6. Behavior in seizure-tested mice (right). n = 12.
(C) Total GGT activity per 100 mg feces from SPF CD, SPF KD, AkkPb KD, or Ak
(D) Total GGT activity per 100mg feces fromSPFCD animals treatedwith vehicle,
28 days (left), and inhibition by GGsTop (right). n = 5.
(E) Levels of live A. muciniphila (Akk) after incubation in CD versus KD culture med
(PbM) or no bacteria (0). n = 3.
(F) Levels of live PbM after incubation in M9 minimal media overlaid on CD or KD
(G) GGT activity in P. merdae grown in M9 media overlaid on CD agar containin
GGsTop. n = 5.
(H) GGT activity inP.merdae grown inM9media overlaid on KD agar containingA.
n = 5.
Data are presented asmean ±SEM. Student’s t test (A and B), Two-way ANOVAw
0.01, ***p < 0.001, ****p < 0.0001. SPF, specific pathogen-free; CD, control diet;
tested; AA, amino acids; veh, vehicle; Abx, pre-treated with antibiotics (ampicillin,
P. distasonis; GGsTop, GGT inhibitor; PbM, P. merdae; Akk, A. muciniphila; M9,
See also Figure S7.
to enable P. merdae growth, and in turn, P. merdae enhances
A. muciniphila growth. This cooperative interaction could
contribute to the endogenous enrichment of both
A. muciniphila and Parabacteroides in KD-fed mice (Figure 1F).
Pilot experiments revealed no growth of A. muciniphila in M9
media when overlaid on P. merdae embedded in KD or CD
agar, suggesting that A. muciniphila cannot rely solely on
cross-feeding from P. merdae to persist. Interestingly,
P. merdae exhibits high GGT activity that is eliminated by the
addition of A. muciniphila embedded in CD or KD agar (Figures
7G and 7H), which aligns with the decreases in fecal GGT activity
and GG amino acid levels observed after KD bacterial enrich-
ment in vivo. Findings from these experiments raise the question
of whether there is physiological function of restricting GGT
activity in abundant P. merdae as opposed to restricting overall
growth of P. merdae. To determine whether reduction of GGT
activity in P. merdae affects A. muciniphila growth, we pre-
treated P. merdae with vehicle or GGsTop to pharmacologically
inhibit GGT activity prior to testing in the cross-feeding assay.
A. muciniphila exposed to P. merdae that was pre-treated
with GGsTop exhibits increased growth at 24 hr after incubation
as compared to A. muciniphila exposed to vehicle-treated
P. merdae (Figure S7B). Taken together, these findings suggest
that A. muciniphila is capable of metabolizing components from
the KD and CD diet to support P. merdae growth, and that this
cooperative interaction reduces GGT activity. In turn, reductions
in GGT activity in P. merdae promote A. muciniphila growth. This
is consistent with our finding that the KD increases intestinal rela-
tive abundance of both A. muciniphila and Parabacteroides, and
that enrichment of A. muciniphila and Parabacteroides reduces
fecal GGT activity, colonic lumenal GG-amino acids, and serum
GG-amino acids in vivo. Overall, results from this study reveal
that the KD alters the gut microbiota, promoting select microbial
interactions that reduce bacterial gamma-glutamylation activity,
decrease peripheral GG-amino acids, elevate bulk hippocampal
GABA/glutamate ratios, and protect against seizures.
DISCUSSION
The microbiota plays a key role in host digestion, metabolism,
and behavior, but whether microbial responses to diet also
acids in Abx-treated SPFmice enriched for A. muciniphila and Parabacteroides
kPb CD mice (left), and inhibition by GGsTop (right). n = 5.
A.muciniphila andParabacteroides probiotic, or heat-killed bacteria bi-daily for
ia or in CD or KD agar overlaid with M9minimal media containing live P. merdae
agar containing Akk or no bacteria (0). n = 5.
g A. muciniphila or no bacteria at t = 24 hr, and inhibition of GGT activity by
muciniphila or no bacteria at t = 24 hr, and inhibition of GGT activity byGGsTop.
ith Bonferroni (C and D), One-way ANOVAwith Bonferroni (E–H): *p < 0.05, **p <
KD, ketogenic diet; CC50, current intensity producing seizures in 50% of mice
vancomycin, neomycin, metronidazole); AkkPb, A. muciniphila, P.merdae, and
minimal media; GGT, gamma-glutamyltranspeptidase; AU, absorbance units.
Cell 173, 1–14, June 14, 2018 11

Please cite this article in press as: Olson et al., The Gut Microbiota Mediates the Anti-Seizure Effects of the Ketogenic Diet, Cell (2018), https://doi.org/10.1016/j.cell.2018.04.027
impact neuronal activity is poorly understood. Here, we demon-
strate that the KD alters the gut microbiota across two seizure
mouse models, and changes in the microbiota are necessary
and sufficient for conferring seizure protection. Several clinical
studies link antibiotic treatment to increased risk of status epi-
lepticus or symptomatic seizures in epileptic individuals (Sutter
et al., 2015). Prolonged treatment with metronidazole can pro-
voke convulsions (Beloosesky et al., 2000), and ampicillin expo-
sure is associated with elevated seizure risk (Hornik et al., 2016).
Penicillin and other b-lactams are hypothesized to directly
reduce GABAergic inhibition, but whether microbiota depletion
contributes to increases in seizure frequency is not clear. Results
from our study reveal that microbiota depletion via high-dose
antibiotic treatment raises seizure susceptibility and incidence
in response to the KD in both wild-type and Kcna1�/� mice.
These effects of antibiotic treatment are abrogated by re-coloni-
zation with gut bacteria, suggesting that links between antibiotic
use and seizure incidence in humans could be mediated by the
microbiota. Future investigation is warranted to determine
whether human epilepsy is associated with microbial dysbiosis
and whether antibiotic exposure in epileptic individuals impacts
response to the KD.
We observe in both Taconic Swiss Webster and Jackson
C3HeB/FeJ Kcna1�/� mice that the KD reduces gut
bacterial alpha diversity, while elevating relative abundance of
A. muciniphila and Parabacteroides. Similar diet-induced in-
creases in A. muciniphila are observed during fasting in humans
(Dao et al., 2016; Remely et al., 2015). A. muciniphila and Para-
bacteroides are also associated with increased ketosis (David
et al., 2014) and metabolic improvement in humans (Everard
et al., 2013). One study reports changes in the gut microbiota
in response to the KD in BTBRT+tf/ and C57BL/6J mice, where
levels of Akkermansiawere correlated with levels of serum gluta-
mate, lactate, taurine, and sarcosine (Klein et al., 2016). How-
ever, different taxonomic shifts were observed, highlighting
that the KD-induced microbiota likely depends on host genetics
and baseline microbiota profiles. Indeed, different species,
strains, and even cohorts of animals are known to exhibit micro-
biota profiles that vary in taxonomic membership but are func-
tionally redundant, raising the question of whether there are
additional taxa that also perform similarly to A. muciniphila and
Parabacteroides in our study. Further research is needed to
determine effects of the KD onmicrobiome profiles in individuals
with refractory epilepsy and whether particular taxonomic
changes correlate with seizure severity.
Amino acids are transported across the blood-brain barrier
(BBB) and serve as nitrogen donors for glutamate and GABA
biosynthesis (Yudkoff et al., 2001). GG-amino acids, in particular,
are reported to exhibit increased transport properties, where the
gamma-glutamyl moiety promotes translocation across lipid
barriers (Castellano and Merlino, 2012). Our data suggest that
KD- and microbiota-related restrictions in GG-amino acids are
important for seizure protection, which aligns with previous
studies linking GGT activity to altered seizure severity. In a study
of 75 epileptic patients, high serumGGT activity was observed in
84.5% of the patients compared to controls (Ewen and Griffiths,
1973). In a rat seizure model, GGT activity was increased after 5
consecutive daily electroshock deliveries (Erakovi�c et al., 2001).
12 Cell 173, 1–14, June 14, 2018
Decreases in various peripheral amino acids are associated
with KD-mediated seizure suppression in animals and humans
(Sariego-Jamardo et al., 2015). Previous studies also highlight
KD-induced increases in brain GABA in animal models
(Calderon et al., 2017) and in humans (Dahlin et al., 2005;
Wang et al., 2003). Future research is needed to determine
whether peripheral amino acid restriction alters brain GABA/
glutamate metabolism.
The gut microbiota can impact levels of various neuroactive
molecules in the periphery and in the brain itself (Vuong et al.,
2017). We find that diet- and microbiota-dependent seizure pro-
tection is associated with elevations in bulk GABA relative to
glutamate content in the hippocampus (Figure 6F). Future
studies are needed to determine whether other brain regions
are similarly affected and whether GABA localized particularly
to neuronal synapses or intracellular vesicles are also modulated
by the gut microbiota. Consistent with a role for the gut micro-
biota in modulating brain GABA levels, a previous study reveals
that dietary fermentation by the gut microbiota modulates GABA
levels in hypothalamic extracts (Frost et al., 2014). In addition,
chronic Lactobacillus treatment elevates GABA levels in hippo-
campal and prefrontal cortex as detected by magnetic reso-
nance spectroscopy (Janik et al., 2016). While our study exam-
ines microbial and metabolic mechanisms underlying how the
gut microbiota influences seizure outcomes, further interroga-
tion of the precise neurological mechanisms underlying the
anti-seizure effects of the KD and KD-associated microbiota is
needed. Of particular interest is the question of whether the
gut microbiota modulates seizure susceptibility and incidence
via alterations in excitatory/inhibitory balance and neurotrans-
mission in particular neural circuits.
Overall, our study reveals a novel role for the gut microbiota in
mediating and conferring seizure protection in two mouse
models for refractory epilepsy. While the results lend credence
to future research examining the gut microbiota in human epi-
lepsy, several additional studies are needed to determine
whether microbe-based treatments can be safely and effectively
applied for clinical amelioration of seizure severity and incidence.
STAR+METHODS
Detailed methods are provided in the online version of this paper
and include the following:
d KEY RESOURCES TABLE
d CONTACT FOR REAGENT AND RESOURCE SHARING
d EXPERIMENTAL MODEL AND SUBJECT DETAILS
B Mice
B Bacteria
d METHOD DETAILS
B 6-Hz Psychomotor Seizure Assay
B Glucose Measurements
B Beta-hydroxybutyrate (BHB) Measurements
B 16S rDNA Microbiota Profiling
B Microbiota Conventionalization
B Antibiotic Treatment
B Gnotobiotic Colonization and Bacterial Enrichment
B Bacterial Fluorescence In Situ Hybridization (FISH)
Please cite this article in press as: Olson et al., The Gut Microbiota Mediates the Anti-Seizure Effects of the Ketogenic Diet, Cell (2018), https://doi.org/10.1016/j.cell.2018.04.027
B Fecal Microbiota Transplant
B Bacterial Treatment
B Kcna1 Seizure Recordings
B Colonic Lumenal and Serum Metabolomics
B Hippocampal Metabolomics
B Amino Acid Supplementation
B GGsTop Treatment
B Cross-Feeding in vitro Assay
B GGT Activity Assay
B Intestinal Permeability Assay
d QUANTIFICATION AND STATISTICAL ANALYSIS
d DATA AND SOFTWARE AVAILABILITY
SUPPLEMENTAL INFORMATION
Supplemental Information includes seven figures, six tables, and one video
and can be found with this article online at https://doi.org/10.1016/j.cell.
2018.04.027.
ACKNOWLEDGMENTS
The authors acknowledge JulianneMcGinn and Tomiko Rendon for generating
and caring for the germ-free animals; Kristie Yu, SandyWong, andGauri Shastri
forassistancewith initial experimentsanddataanalysis; ThomasFung,Geoffrey
Pronovost, Gregory Donaldson, Xia Yang, Carlos Cepeda, and Kim McDowell
for helpful advice; andBruceTempel andMarie Francoise-Chesselet for sharing
mice and reagents. This work was supported by funds from UCLA Department
of Integrative Biology & Physiology and Division of Life Sciences (to E.Y.H.),
Alfred P. Sloan Foundation Fellowship (FG-201606433 to E.Y.H.), Army
Research Office Multidisciplinary University Research Initiative (W911NF-17-
1-0402 to E.Y.H.), Mallinckrodt Foundation (20181433 to E.Y.H.), NIH Ruth L.
Kirschstein Award (T32GM065823 to C.A.O.), and UPLIFT: UCLA Postdoctoral
Longitudinal Investment in Faculty Award (K12GM106996 to H.E.V.).
AUTHOR CONTRIBUTIONS
C.A.O., H.E.V., J.M.Y., Q.Y.L., D.J.N., and E.Y.H. performed the experiments
and analyzed the data. C.A.O., H.E.V., J.M.Y., and E.Y.H. designed the study.
C.A.O., H.E.V., and E.Y.H. wrote the manuscript. All authors discussed the re-
sults and commented on the manuscript.
DECLARATION OF INTERESTS
The authors declare no competing interests. Findings reported in the manu-
script are the subject of UCLA provisional patent application US 2017/67548.
Received: January 4, 2018
Revised: March 2, 2018
Accepted: April 19, 2018
Published: May 24, 2018
REFERENCES
Baraban, S.C., Southwell, D.G., Estrada, R.C., Jones, D.L., Sebe, J.Y., Alfaro-
Cervello, C., Garcıa-Verdugo, J.M., Rubenstein, J.L., and Alvarez-Buylla, A.
(2009). Reduction of seizures by transplantation of cortical GABAergic inter-
neuron precursors into Kv1.1 mutant mice. Proc. Natl. Acad. Sci. USA 106,
15472–15477.
Barton, M.E., Klein, B.D., Wolf, H.H., and White, H.S. (2001). Pharmacological
characterization of the 6 Hz psychomotor seizuremodel of partial epilepsy. Ep-
ilepsy Res. 47, 217–227.
Beloosesky, Y., Grosman, B., Marmelstein, V., and Grinblat, J. (2000). Convul-
sions induced by metronidazole treatment for Clostridium difficile-associated
disease in chronic renal failure. Am. J. Med. Sci. 319, 338–339.
Bough, K.J., and Rho, J.M. (2007). Anticonvulsant mechanisms of the keto-
genic diet. Epilepsia 48, 43–58.
Buffington, S.A., Di Prisco, G.V., Auchtung, T.A., Ajami, N.J., Petrosino, J.F.,
and Costa-Mattioli, M. (2016). Microbial reconstitution reverses maternal
diet-induced social and synaptic deficits in offspring. Cell 165, 1762–1775.
Calderon, N., Betancourt, L., Hernandez, L., and Rada, P. (2017). A ketogenic
diet modifies glutamate, gamma-aminobutyric acid and agmatine levels in the
hippocampus of rats: A microdialysis study. Neurosci. Lett. 642, 158–162.
Caporaso, J.G., Kuczynski, J., Stombaugh, J., Bittinger, K., Bushman, F.D.,
Costello, E.K., Fierer, N., Pena, A.G., Goodrich, J.K., Gordon, J.I., et al.
(2010). QIIME allows analysis of high-throughput community sequencing
data. Nat. Methods 7, 335–336.
Caporaso, J.G., Lauber, C.L., Walters, W.A., Berg-Lyons, D., Lozupone, C.A.,
Turnbaugh, P.J., Fierer, N., and Knight, R. (2011). Global patterns of 16S rRNA
diversity at a depth of millions of sequences per sample. Proc. Natl. Acad. Sci.
USA 108 (Suppl 1 ), 4516–4522.
Castellano, I., and Merlino, A. (2012). g-Glutamyltranspeptidases: sequence,
structure, biochemical properties, and biotechnological applications. Cell.
Mol. Life Sci. 69, 3381–3394.
Cooper, A.J., and Jeitner, T.M. (2016). Central role of glutamate metabolism in
the maintenance of nitrogen homeostasis in normal and hyperammonemic
brain. Biomolecules 6, E16.
Crawford, P.A., Crowley, J.R., Sambandam, N., Muegge, B.D., Costello, E.K.,
Hamady, M., Knight, R., and Gordon, J.I. (2009). Regulation of myocardial ke-
tone body metabolism by the gut microbiota during nutrient deprivation. Proc.
Natl. Acad. Sci. USA 106, 11276–11281.
Dahlin, M., Elfving, A., Ungerstedt, U., and Amark, P. (2005). The ketogenic diet
influences the levels of excitatory and inhibitory amino acids in the CSF in chil-
dren with refractory epilepsy. Epilepsy Res. 64, 115–125.
Dao, M.C., Everard, A., Aron-Wisnewsky, J., Sokolovska, N., Prifti, E., Verger,
E.O., Kayser, B.D., Levenez, F., Chilloux, J., Hoyles, L., et al.; MICRO-Obes
Consortium (2016). Akkermansia muciniphila and improved metabolic health
during a dietary intervention in obesity: relationship with gut microbiome rich-
ness and ecology. Gut 65, 426–436.
David, L.A., Maurice, C.F., Carmody, R.N., Gootenberg, D.B., Button, J.E.,
Wolfe, B.E., Ling, A.V., Devlin, A.S., Varma, Y., Fischbach, M.A., et al.
(2014). Diet rapidly and reproducibly alters the human gut microbiome. Nature
505, 559–563.
Derrien, M., Collado, M.C., Ben-Amor, K., Salminen, S., and de Vos, W.M.
(2008). The Mucin degrader Akkermansia muciniphila is an abundant resident
of the human intestinal tract. Appl. Environ. Microbiol. 74, 1646–1648.
Duncan, S.H., Lobley, G.E., Holtrop, G., Ince, J., Johnstone, A.M., Louis, P.,
and Flint, H.J. (2008). Human colonic microbiota associated with diet, obesity
and weight loss. Int. J. Obes. 32, 1720–1724.
Dutton, S.B., Sawyer, N.T., Kalume, F., Jumbo-Lucioni, P., Borges, K., Catter-
all, W.A., and Escayg, A. (2011). Protective effect of the ketogenic diet in Scn1a
mutant mice. Epilepsia 52, 2050–2056.
Erakovi�c, V., �Zupan, G., Varljen, J., Laginja, J., and Simoni�c, A. (2001). Altered
activities of rat brain metabolic enzymes in electroconvulsive shock-induced
seizures. Epilepsia 42, 181–189.
Everard, A., Belzer, C., Geurts, L., Ouwerkerk, J.P., Druart, C., Bindels, L.B.,
Guiot, Y., Derrien, M., Muccioli, G.G., Delzenne, N.M., et al. (2013). Cross-
talk between Akkermansia muciniphila and intestinal epithelium controls
diet-induced obesity. Proc. Natl. Acad. Sci. USA 110, 9066–9071.
Ewen, L.M., and Griffiths, J. (1973). -Glutamyl transpeptidase: elevated activ-
ities in certain neurologic diseases. Am. J. Clin. Pathol. 59, 2–9.
Fenoglio-Simeone, K.A., Wilke, J.C., Milligan, H.L., Allen, C.N., Rho, J.M., and
Maganti, R.K. (2009). Ketogenic diet treatment abolishes seizure periodicity
and improves diurnal rhythmicity in epileptic Kcna1-null mice. Epilepsia 50,
2027–2034.
Flynn, J.M., Niccum, D., Dunitz, J.M., and Hunter, R.C. (2016). Evidence and
role for bacterial mucin degradation in cystic fibrosis airway disease. PLoS
Pathog. 12, e1005846.
Cell 173, 1–14, June 14, 2018 13

Please cite this article in press as: Olson et al., The Gut Microbiota Mediates the Anti-Seizure Effects of the Ketogenic Diet, Cell (2018), https://doi.org/10.1016/j.cell.2018.04.027
Freeman, J.M., and Kossoff, E.H. (2010). Ketosis and the ketogenic diet, 2010:
advances in treating epilepsy and other disorders. Adv. Pediatr. 57, 315–329.
Frost, G., Sleeth, M.L., Sahuri-Arisoylu, M., Lizarbe, B., Cerdan, S., Brody, L.,
Anastasovska, J., Ghourab, S., Hankir, M., Zhang, S., et al. (2014). The short-
chain fatty acid acetate reduces appetite via a central homeostatic mecha-
nism. Nat. Commun. 5, 3611.
Hartman, A.L., Zheng, X., Bergbower, E., Kennedy, M., and Hardwick, J.M.
(2010). Seizure tests distinguish intermittent fasting from the ketogenic diet.
Epilepsia 51, 1395–1402.
Hornik, C.P., Benjamin, D.K., Jr., Smith, P.B., Pencina, M.J., Tremoulet, A.H.,
Capparelli, E.V., Ericson, J.E., Clark, R.H., and Cohen-Wolkowiez, M.; Best
Pharmaceuticals for Children Act—Pediatric Trials Network (2016). Electronic
health records and pharmacokinetic modeling to assess the relationship be-
tween ampicillin exposure and seizure risk in neonates. J. Pediatr. 178,
125–129.
Janik, R., Thomason, L.A.M., Stanisz, A.M., Forsythe, P., Bienenstock, J., and
Stanisz, G.J. (2016). Magnetic resonance spectroscopy reveals oral Lactoba-
cillus promotion of increases in brain GABA, N-acetyl aspartate and glutamate.
Neuroimage 125, 988–995.
Kimball, A.W., Burnett, W.T., Jr., and Doherty, D.G. (1957). Chemical protec-
tion against ionizing radiation. I. Sampling methods for screening compounds
in radiation protection studies with mice. Radiat. Res. 7, 1–12.
Klein, M.S., Newell, C., Bomhof, M.R., Reimer, R.A., Hittel, D.S., Rho, J.M., Vo-
gel, H.J., and Shearer, J. (2016). Metabolomic modeling to monitor host
responsiveness to gut microbiota manipulation in the BTBR(T+tf/j) mouse.
J. Proteome Res. 15, 1143–1150.
Koeth, R.A., Wang, Z., Levison, B.S., Buffa, J.A., Org, E., Sheehy, B.T., Britt,
E.B., Fu, X., Wu, Y., Li, L., et al. (2013). Intestinal microbiota metabolism of
L-carnitine, a nutrient in red meat, promotes atherosclerosis. Nat. Med. 19,
576–585.
Kwan, P., and Brodie, M.J. (2000). Early identification of refractory epilepsy.
N. Engl. J. Med. 342, 314–319.
Langille, M.G.I., Zaneveld, J., Caporaso, J.G., McDonald, D., Knights, D.,
Reyes, J.A., Clemente, J.C., Burkepile, D.E., Vega Thurber, R.L., Knight, R.,
et al. (2013). Nature Biotechnology 31, 814–821.
Manz, W., Amann, R., Ludwig, W., Vancanneyt, M., and Schleifer, K.H. (1996).
Application of a suite of 16S rRNA-specific oligonucleotide probes designed to
investigate bacteria of the phylum cytophaga-flavobacter-bacteroides in the
natural environment. Microbiology 142, 1097–1106.
Newell, C., Bomhof, M.R., Reimer, R.A., Hittel, D.S., Rho, J.M., and Shearer, J.
(2016). Ketogenic diet modifies the gut microbiota in a murine model of autism
spectrum disorder. Mol. Autism 7, 37.
Reikvam, D.H., Erofeev, A., Sandvik, A., Grcic, V., Jahnsen, F.L., Gaustad, P.,
McCoy, K.D., Macpherson, A.J., Meza-Zepeda, L.A., and Johansen, F.E.
(2011). Depletion of murine intestinal microbiota: effects on gut mucosa and
epithelial gene expression. PLoS ONE 6, e17996.
Remely, M., Hippe, B., Geretschlaeger, I., Stegmayer, S., Hoefinger, I., and
Haslberger, A. (2015). Increased gut microbiota diversity and abundance of
Faecalibacterium prausnitzii and Akkermansia after fasting: a pilot study.
Wien. Klin. Wochenschr. 127, 394–398.
Rogawski, M.A., Loscher, W., and Rho, J.M. (2016). Mechanisms of action of
antiseizure drugs and the ketogenic diet. Cold Spring Harb. Perspect. Med. 6,
a022780.
14 Cell 173, 1–14, June 14, 2018
Samala, R., Willis, S., and Borges, K. (2008). Anticonvulsant profile of a
balanced ketogenic diet in acute mouse seizure models. Epilepsy Res. 81,
119–127.
Sariego-Jamardo, A., Garcıa-Cazorla, A., Artuch, R., Castejon, E., Garcıa-
Arenas, D., Molero-Luis, M., Ormazabal, A., and Sanmartı, F.X. (2015). Efficacy
of the ketogenic diet for the treatment of refractory childhood epilepsy: cere-
brospinal fluid neurotransmitters and amino acid levels. Pediatr. Neurol. 53,
422–426.
Sato, S.M., andWoolley, C.S. (2016). Acute inhibition of neurosteroid estrogen
synthesis suppresses status epilepticus in an animal model. eLife 5, e12917.
Scheffer, H., Brunt, E.R., Mol, G.J., van der Vlies, P., Stulp, R.P., Verlind, E.,
Mantel, G., Averyanov, Y.N., Hofstra, R.M., and Buys, C.H. (1998). Three novel
KCNA1mutations in episodic ataxia type I families. Hum. Genet. 102, 464–466.
Semple, B.D., Blomgren, K., Gimlin, K., Ferriero, D.M., and Noble-Haeusslein,
L.J. (2013). Brain development in rodents and humans: Identifying bench-
marks of maturation and vulnerability to injury across species. Prog. Neurobiol.
106-107, 1–16.
Simeone, K.A., Matthews, S.A., Rho, J.M., and Simeone, T.A. (2016). Keto-
genic diet treatment increases longevity in Kcna1-null mice, amodel of sudden
unexpected death in epilepsy. Epilepsia 57, e178–e182.
Smith, Q.R. (2000). Transport of glutamate and other amino acids at the blood-
brain barrier. J. Nutr. 130 (4S Suppl), 1016S–1022S.
Smith, M.I., Yatsunenko, T., Manary, M.J., Trehan, I., Mkakosya, R., Cheng, J.,
Kau, A.L., Rich, S.S., Concannon, P., Mychaleckyj, J.C., et al. (2013). Gut mi-
crobiomes of Malawian twin pairs discordant for kwashiorkor. Science 339,
548–554.
Sonnenburg, J.L., and Backhed, F. (2016). Diet-microbiota interactions as
moderators of human metabolism. Nature 535, 56–64.
Stafstrom, C.E., and Rho, J.M. (2012). The ketogenic diet as a treatment para-
digm for diverse neurological disorders. Front. Pharmacol. 3, 59.
Sutter, R., Ruegg, S., and Tschudin-Sutter, S. (2015). Seizures as adverse
events of antibiotic drugs: A systematic review. Neurology 85, 1332–1341.
van der Stel, A.X., van Mourik, A., qaniewski, P., van Putten, J.P., Jagusztyn-
Krynicka, E.K., and Wosten, M.M. (2015). The Campylobacter jejuni RacRS
two-component system activates the glutamate synthesis by directly upregu-
lating g-glutamyltranspeptidase (GGT). Front. Microbiol. 6, 567.
Vuong, H.E., Yano, J.M., Fung, T.C., and Hsiao, E.Y. (2017). The microbiome
and host behavior. Annu. Rev. Neurosci. 40, 21–49.
Wang, Z.J., Bergqvist, C., Hunter, J.V., Jin, D., Wang, D.J., Wehrli, S., and Zim-
merman, R.A. (2003). In vivo measurement of brain metabolites using two-
dimensional double-quantum MR spectroscopy–exploration of GABA levels
in a ketogenic diet. Magn. Reson. Med. 49, 615–619.
Yudkoff, M., Daikhin, Y., Nissim, I., Lazarow, A., and Nissim, I. (2001). Keto-
genic diet, amino acid metabolism, and seizure control. J. Neurosci. Res.
66, 931–940.
Zuberi, S.M., Eunson, L.H., Spauschus, A., De Silva, R., Tolmie, J., Wood,
N.W., McWilliam, R.C., Stephenson, J.B., Kullmann, D.M., and Hanna, M.G.
(1999). A novel mutation in the human voltage-gated potassium channel
gene (Kv1.1) associates with episodic ataxia type 1 and sometimes with partial
epilepsy. Brain 122, 817–825.
Please cite this article in press as: Olson et al., The Gut Microbiota Mediates the Anti-Seizure Effects of the Ketogenic Diet, Cell (2018), https://doi.org/10.1016/j.cell.2018.04.027
STAR+METHODS
KEY RESOURCES TABLE
REAGENT or RESOURCE SOURCE IDENTIFIER
Bacterial and Virus Strains
Akkermansia muciniphila ATCC ATCC BAA845
Parabacteroides merdae ATCC ATCC 43184
Parabacteroides distasonis ATCC ATCC 8503
Bifidobacterium longum ATCC ATCC 15707
Chemicals, Peptides, and Recombinant Proteins
GGsTop, 3-[[(3-amino-3-carboxypropyl)
methoxyphosphinyl]oxy]benzeneacetic acid
Tocris Bioscience 4452; CAS: 926281-37-0
Mucin from porcine stomach, type III Sigma-Aldrich d M1778; CAS: 84082-64-4
L-gamma-glutamyl-3-carboxy-4-nitroanilide Gold Bio G-380-1; CAS: 63699-78-5
4 kDa FITC-dextran Sigma-Aldrich 46944; CAS: 60842-46-8
Critical Commercial Assays
Glucose Colorimetric Assay Kit Cayman Chemical Cat# 10009582
Beta-hydroxybutyrate Colorimetric Assay Kit Cayman Chemical Cat# 700190
MoBio PowerSoil Kit Mo Bio Cat# 12888-100
Deposited Data
16S rDNA sequences This paper https://qiita.ucsd.edu, 11566
Experimental Models: Organisms/Strains
Mouse: Swiss Webster, germ-free Taconic Taconic: SW GF
Mouse: Swiss Webster, specific pathogen-free Taconic Taconic: SW MPF
Mouse: Kcna1�/�: C3HeB.129S7-Kcna1tm1Tem/J Dr. Bruce Tempel JAX: 003532
Oligonucleotides
MUC1437: 6FAM-CCTTGCGGTTGGCTTA Derrien et al., 2008 Sigma Aldrich: custom oligo
BAC303: Texas Red-CCAATGTGGGGGACCTT Manz et al., 1996 Sigma Aldrich: custom oligo
Software and Algorithms
Ethovision XT 11 Noldus Cat # EX11-MAMBP-E
QIIME1.8.0 Caporaso et al., 2010 http://qiime.org/
Greengenes Lawrence Berkeley National Labs http://greengenes.lbl.gov/Download/
cgi
PICRUSt Langille et al., 2013 http://picrust.github.io/picrust/
Ponemah V5.1 Data Sciences International https://www.datasci.com/products/software/
ponemah
Neuroscore Data Sciences International https://www.datasci.com/products/software/
neuroscore
TraceFinder 3.3 ThermoFisher Scientific OPTON-30491
ImageJ National Institutes of Health https://imagej.nih.gov/ij/
Other
Ketogenic Diet Mouse Chow Envigo TD.07797.PWD
Control Diet Mouse Chow Envigo TD.150300
Standard Diet Mouse Chow LabDiet # 5010
ECT Unit Ugo Basile Model # 57800
EEG transmitters Data Sciences International PhysioTel ETA-F10
Cell 173, 1–14.e1–e6, June 14, 2018 e1
Please cite this article in press as: Olson et al., The Gut Microbiota Mediates the Anti-Seizure Effects of the Ketogenic Diet, Cell (2018), https://doi.org/10.1016/j.cell.2018.04.027
CONTACT FOR REAGENT AND RESOURCE SHARING
Further information and requests for resources and reagents should be directed to and will be fulfilled by the Lead Contact, Elaine Y.
Hsiao ([email protected])
EXPERIMENTAL MODEL AND SUBJECT DETAILS
Mice3-4 week old SPF wild-type Swiss Webster mice (Taconic Farms), GF wild-type Swiss Webster mice (Taconic Farms) and SPF
C3HeB/FeJ KCNA1 KO mice (Jackson Laboratories) were bred in UCLA’s Center for Health Sciences Barrier Facility. Breeding an-
imals were fed ‘‘breeder’’ chow (Lab Diets 5K52). Experimental animals were fed standard chow (Lab Diet 5010), 6:1 ketogenic diet
(Harlan Teklad TD.07797.PWD; Table S1) or vitamin- andmineral-matched control diet (Harlan Teklad TD.150300; Table S1). Juvenile
mice were used to i) mimic the typical use of the KD to treat pediatric and adolescent epileptic patients, ii) align the timing of mouse
brain development to early human brain development, where neurodevelopmental milestones in 3-week old mice are comparable to
those of the 2-3 year old human brain (Semple et al., 2013), and iii) preclude pre-weaning dietary treatment, where effects of the diet
on maternal behavior and physiology would confound direct effects of the diet on offspring. Mice were randomly assigned to an
experimental group. Experiments include age- and sex-matched cohorts of males and females. Consistent with prior reports (Dutton
et al., 2011), we observed no significant differences in seizure threshold or BHB levels in male versus female WT mice. All animal
experiments were approved by the UCLA Animal Care and Use Committee.
BacteriaA. muciniphila (ATCC BAA845) was cultured under anaerobic conditions at 37�C in Brain Heart Infusion (BHI) media supplemented
with 0.05% hog gastric mucin type III (Sigma Aldrich). P. merdae (ATCC 43184) and P. distasonis (ATCC 8503) were grown in anaer-
obic conditions at 37�C in Reinforced Clostridial Media (RCM). Cultures were authenticated by full-length 16S rDNA sequencing.
METHOD DETAILS
6-Hz Psychomotor Seizure AssayThe 6-Hz test was conducted as previously described (Samala et al., 2008). Pilot studies revealed no sexual dimorphism in seizure
threshold. All subsequent experimental cohorts containedmalemice. One drop (�50 ul) of 0.5% tetracaine hydrochloride ophthalmic
solution was applied to the corneas of each mouse 10-15 min before stimulation. Corneal electrodes were coated with a thin layer of
electrode gel (Parker Signagel). A constant-current current device (ECT Unit 57800, Ugo Basile) was used to deliver current at 3 s
duration, 0.2 ms pulse-width and 6 pulses/s frequency. CC50 (the intensity of current required to elicit seizures in 50% of the exper-
imental group) was measured as a metric for seizure susceptibility. Pilot experiments were conducted to identify 24 mA as the CC50
for SPF wild-type Swiss Webster mice. Each mouse was seizure-tested only once, and thus at least n > 6 mice were used to
adequately power each experiment group. To determine CC50s for each experimental group, 24 mA currents were administered
to the first mouse per experimental group per cohort, followed by fixed increases or decreases by 2 mA intervals. Mice were
restrained manually during stimulation and then released into a new cage for behavioral observation. Locomotor behavior was re-
corded using Ethovision XT software (Noldus) and quantitative measures for falling, tail dorsiflexion (Straub tail), forelimb clonus,
eye/vibrissae twitching and behavioral remission were scored manually. For each behavioral parameter, we observed no correlation
between percentage incidence during 24 mA seizures and microbiota status or group seizure susceptibility, suggesting a primary
effect of the microbiota on seizure incidence rather than presentation or form. Latency to exploration (time elapsed from when an
experimental mouse is released into the observation cage (after corneal stimulation) to its first lateral movement) was scored using
Ethovision and manually with an electronic timer. Mice were blindly scored as protected from seizures if they did not show seizure
behavior and resumed normal exploratory behavior within 10 s. Seizure threshold (CC50) was determined as previously described
(Kimball et al., 1957), using the average log interval of current steps per experimental group, where sample n is defined as the subset
of animals displaying the less frequent seizure behavior. Data used to calculate CC50 are also displayed as latency to explore for
each current intensity, where n represents the total number of biological replicates per group regardless of seizure outcome.
Glucose MeasurementsBlood samples were collected by cardiac puncture and spun through SST vacutainers (Becton Dickinson) for serum separation.
Glucose levels were detected in sera by colorimetric assay according to the manufacturer’s instructions (Cayman Chemical).
Data compiled across multiple experiments are expressed as glucose concentrations normalized to SPF controls within each
experiment.
Beta-hydroxybutyrate (BHB) MeasurementsBlood was collected by cardiac puncture and spun through SST vacutainers (Becton Dickinson) for serum separation. The colon
was washed and flushed with PBS to remove lumenal contents. Frontal cortex, hippocampus, hypothalamus and cerebellum
e2 Cell 173, 1–14.e1–e6, June 14, 2018
Please cite this article in press as: Olson et al., The Gut Microbiota Mediates the Anti-Seizure Effects of the Ketogenic Diet, Cell (2018), https://doi.org/10.1016/j.cell.2018.04.027
were microdissected and livers were harvested and washed in PBS. Tissue samples were sonicated on ice in 10 s intervals at 20 mV
in RIPA lysis buffer (Thermo Scientific). BHB levels were detected in sera by colorimetric assay according to the manufacturer’s in-
structions (Cayman Chemical). Data were normalized to total protein content as detected by BCA assay (Thermo Pierce). Data
compiled across multiple experiments are expressed as BHB concentrations normalized to SPF controls within each experiment.
16S rDNA Microbiota ProfilingBacterial genomic DNA was extracted frommouse fecal samples or colonic lumenal contents using the MoBio PowerSoil Kit, where
the sample n reflects independent cages containing 3 mice per cage in order to capture biological variation across cages and pre-
clude effects of co-housing on microbiota composition. The library was generated according to methods adapted from (Caporaso
et al., 2011). The V4 regions of the 16S rDNA gene were PCR amplified using individually barcoded universal primers and 30 ng of the
extracted genomic DNA. The PCR reaction was set up in triplicate, and the PCR product was purified using the Qiaquick PCR
purification kit (QIAGEN). The purified PCR product was pooled in equal molar concentrations quantified by the Kapa library quan-
tification kit (Kapa Biosystems, KK4824) and sequenced by Laragen, Inc. using the IlluminaMiSeq platform and 23 250bp reagent kit
for paired-end sequencing. Operational taxonomic units (OTUs) were chosen by open reference OTU picking based on 97%
sequence similarity to the Greengenes 13_5 database. Taxonomy assignment and rarefaction were performed using QIIME1.8.0
(Caporaso et al., 2010) using 85,134 reads per sample.
Microbiota ConventionalizationFecal samples were freshly collected from adult SPF Swiss Webster mice and homogenized in pre-reduced PBS at 1 mL per pellet.
100 ul of the settled suspension was administered by oral gavage to recipient GFmice. For mock treatment, mice were gavaged with
pre-reduced PBS.
Antibiotic TreatmentSPF mice were gavaged with a solution of vancomycin (50mg/kg), neomycin (100 mg/kg) and metronidazole (100 mg/kg) every
12 hours daily for 7 days, according to methods previously described (Reikvam et al., 2011), using dosages typically greater than
those used for clinical therapeutic treatment. Ampicillin (1 mg/ml) was provided ad libitum in drinking water. For mock treatment,
mice were gavaged with normal drinking water every 12 hours daily for 7 days. For Kcna1�/�mice, drinking water was supplemented
with vancomycin (500mg/ml), neomycin (1mg/ml) and ampicillin (1mg/ml) for 1 week to preclude the stress of oral gavage in seizure-
prone mice. Antibiotic-treated mice were maintained in sterile caging with sterile food and water and handled aseptically for the
remainder of the experiments.
Gnotobiotic Colonization and Bacterial Enrichment109 cfu bacteria were suspended in 200 ul pre-reduced PBS and orally gavaged into antibiotic-treated mice or germ-free mice.When
co-administered as ‘‘A. muciniphila and Parabacteroides,’’ a ratio of 2:1:1 was used for A. muciniphila: P. merdae: P. distasonis. For
mock treatment, mice were gavaged with pre-reduced PBS. Pilot studies revealed no significant differences between colonization
groups in fecal DNA concentration or 16S rDNA amplification, asmeasures relevant to bacterial load. Mice weremaintained inmicro-
isolator cages and handled aseptically. Mice were seizure tested at 14 days after colonization.
Bacterial Fluorescence In Situ Hybridization (FISH)Mouse colon was cut into distal, medial and proximal sections and fixed in 4% paraformaldehyde solution overnight at 4�C, washed
and passed through 15% and 30% sucrose solutions. Colon tissues were then embedded in optimal cutting temperature (OCT) com-
pound (Tissue-Tek) and cryosectioned into 5 um longitudinal sections (Leica CM1950). Slides were equilibrated in hybridization buffer
(0.9MNaCl, 20mMTris-HCl, 0.01%sodiumdodecyl sulfate, 10% formamide) and incubated in 10 ng/ul FISHprobe (SigmaAldrich) for
15 hr at 47�C in a humidified chamber. The probes were BAC303 (Manz et al., 1996): 50 Texas Red-CCAATGTGGGGGACCTT.
MUC1437 (Derrien et al., 2008): 50 6FAM-CCTTGCGGTTGGCTTA. Slides were then incubated for 20 min in wash buffer (0.9 M
NaCl, 20 mM Tris-HCl) pre-heated to 47�C and washed gently three times in PBS. Samples were then incubated in the dark
with 10mg/ml DAPI in PBS for 1 hour at 4�C, washed three times in PBS and mounted in Vectashield mounting medium (Vector
Labs). Images were acquired on a Leica TCS Sp5 confocal microscope using LAS AF software (Leica). A 63X oil-immersion objective
was used for imaging. Stacks spanning 10 um thickness were compressed using Fiji software (NIH).
Fecal Microbiota TransplantFecal samples were freshly collected from donor mice fed KD or CD for 14 days and suspended at 50 mg/ml in pre-reduced PBS.
Antibiotic-treated mice were colonized by oral gavage of 100 ul suspension. For mock treatment, mice were gavaged with pre-
reduced PBS. Mice were housed in microisolator cages and handled aseptically. Seizure testing was conducted at 4 days after
transplant.
Cell 173, 1–14.e1–e6, June 14, 2018 e3

Please cite this article in press as: Olson et al., The Gut Microbiota Mediates the Anti-Seizure Effects of the Ketogenic Diet, Cell (2018), https://doi.org/10.1016/j.cell.2018.04.027
Bacterial TreatmentA. muciniphila, P. merdae and P. distasonis were freshly cultured in anaerobic conditions as described above, and then washed,
pelleted and re-suspended at 53 109 cfu/ml in pre-reduced PBS. A.muciniphilawith Parabacteroideswere prepared at a 2:1:1 ratio.
For heat-killing, bacteria were placed at 95�C for 10 min. Mice were gavaged every 12 hours for 28 days with 200 ul bacterial sus-
pension or sterile pre-reduced PBS as vehicle control.
Kcna1 Seizure RecordingsEEG Implantation and Recovery
EEGs were recorded from male and female Kcna1�/� mice at 6-7 weeks of age. Kcna1+/+ littermates were used as controls. We
observed no significant differences between males and females in seizure frequency and duration. Data presented include both
sexes. Mice were anesthetized with isoflurane (5% induction, 2% maintenance) and eye ointment applied to each eye. Fur was
removed along the head, and the area was cleaned with three alternative scrubs of chlorohexidine and 70% isopropanol. In a
biosafety cabinet, mice were positioned in a stereotaxic apparatus (Harvard Biosciences) and 1 mg/kg lidocaine + 1 mg/kg bupiva-
caine was applied locally along the incision site. Using sterile surgical tools, a 2 cm incision was made along the dorsal midline from
the posterior margin of the eyes to a point midway between the scapulae. A subcutaneous pocket along the dorsal flank was created
and the pocket irrigated with sterile saline. A wireless telemetry transmitter was inserted with bi-potential leads oriented cranially. The
skull was cleanedwith 3%hydrogen peroxide followed by 70% isopropanol. Using a 1.0mmmicro drill bit, the skull was perforated to
generate two small holes halfway between the bregma and lambda, and 1-2 mm from the sagittal suture. Bilateral EEG recording
electrodes (Data Sciences International (DSI) PhysioTel, ETA-F10) were epidurally implanted over the frontoparietal cortex. Sterile
acrylic was applied to the dried area. The incision site was closed with absorbable 5-0 sutures and cleaned with 3% hydrogen
peroxide followed by 70% ethanol. Animals were housed individually in autoclaved microisolator cages and allowed to recover
for 3-5 days before recordings were initiated.
Data Acquisition and Analysis
During EEG recordings animals were freelymoving andmaintained on experimental diet. EEG traceswere acquired over 3 days using
the DSI Ponemah V5.1 data acquisition system. Seizures were identified based on characteristic spike patterns of 5 stages: A) low-
frequency background, with low-voltage spiking, B) synchronized high-frequency, high-voltage spiking, C) high-frequency, low-
voltage spiking, D) unsynchronized high-frequency, high-voltage spiking, and E) high-frequency, burst spiking. Simultaneous video
recordings of behavioral seizures were correlated with EEG recordings and scored based on an adapted Racine scale and defined by
5 stages: 1) myoclonic jerk, 2) head stereotypy and facial clonus, 3) bilateral and alternating forelimb/hindlimb clonus, 4) rearing and
falling, and 5) generalized tonic-clonic episodes (Fenoglio-Simeone et al., 2009; Simeone et al., 2016) (Video S1). Data were analyzed
by a blinded researcher using Neuroscore CNS Software (DSI). EEG signals were filtered using a 10 Hz high pass filter, and seizure
events were detected by blinded manual scoring. Seizures were defined as patterns of high-frequency, high-voltage synchronized
heterogeneous spike wave forms with amplitudes at least 2-fold greater than background with more than 6 s duration (Baraban et al.,
2009). The average spike frequency per seizure was determined as number of spikes occurring above baseline in a given seizure per
second and averaged per animal (Sato and Woolley, 2016).
Colonic Lumenal and Serum MetabolomicsSamples were collected frommice housed across independent cages, with at least 2 mice per cage. Colonic lumenal contents were
collected from terminal mouse dissections, immediately snap frozen in liquid nitrogen and stored at �80�C. Serum samples were
collected by cardiac puncture, separated using SST vacutainer tubes and frozen at �80�C. Samples were prepared using the auto-
mated MicroLab STAR system (Hamilton Company) and analyzed on GC/MS, LC/MS and LC/MS/MS platforms by Metabolon, Inc.
Protein fractions were removed by serial extractions with organic aqueous solvents, concentrated using a TurboVap system (Zymark)
and vacuumdried. For LC/MS and LC-MS/MS, sampleswere reconstituted in acidic or basic LC-compatible solvents containing > 11
injection standards and run on a Waters ACQUITY UPLC and Thermo-Finnigan LTQ mass spectrometer, with a linear ion-trap front-
end and a Fourier transform ion cyclotron resonance mass spectrometer back-end. For GC/MS, samples were derivatized under
dried nitrogen using bistrimethyl-silyl-trifluoroacetamide and analyzed on a Thermo-Finnigan Trace DSQ fast-scanning single-quad-
rupole mass spectrometer using electron impact ionization. Chemical entities were identified by comparison to metabolomic library
entries of purified standards. Following log transformation and imputation with minimum observed values for each compound, data
were analyzed using one-way ANOVA to test for group effects. P and q-values were calculated based on two-way ANOVA contrasts.
Principal components analysis was used to visualize variance distributions. Supervised Random Forest analysis was conducted to
identify metabolomics prediction accuracies.
Hippocampal MetabolomicsHippocampal tissues were homogenized in 1 mL cold 80% MeOH and vigorously mixed on ice followed by centrifugation (1.3*104
rpm, 4�C). 5 ug supernatant was transferred into a glass vial, supplemented with 5 nmol D/L-norvaline, dried down under vacuum,
and finally re-suspended in 70% acetonitrile. For the mass spectrometry-based analysis of the sample, 5 l were injected onto a Luna
NH2 (150mm x 2mm, Phenomenex) column. The samples were analyzed with an UltiMate 3000RSLC (Thermo Scientific) coupled to
a Q Exactive mass spectrometer (Thermo Scientific). The Q Exactive was run with polarity switching (+4.00 kV /�4.00 kV) in full scan
e4 Cell 173, 1–14.e1–e6, June 14, 2018
Please cite this article in press as: Olson et al., The Gut Microbiota Mediates the Anti-Seizure Effects of the Ketogenic Diet, Cell (2018), https://doi.org/10.1016/j.cell.2018.04.027
mode with anm/z range of 70-1050. Separation was achieved using A) 5 mMNH4AcO (pH 9.9) and B) ACN. The gradient started with
15% A) going to 90% A) over 18 min, followed by an isocratic step for 9 min. and reversal to the initial 15% A) for 7 min. Metabolites
were quantifiedwith TraceFinder 3.3 using accuratemassmeasurements (%3 ppm), retention times of pure standards andMS2 frag-
mentation patterns. Data analysis, including principal component analysis and hierarchical clustering was performed using R.
Amino Acid Supplementation4-week old SwissWebster SPFmice were treated with antibiotics, colonized with A. muciniphila and Parabacteroides and fed KD for
14 days, as described in methods above. Beginning on the evening of day 11, mice were injected intraperitoneally every 12 hours for
3 days with ketogenic amino acid cocktail (Sigma Aldrich)–L-leucine (2.0 mg/kg), L-lysine (2.0 mg/kg), L-tyrosine (2.4 mg/kg), L-tryp-
tophan (1.6 mg/kg), and L-threonine (3.1 mg/kg) in sterile PBS. Physiologically-relevant concentrations of amino acids were calcu-
lated based on serum metabolomic data (Table S5), such that dosages for each were projected to restore blood levels to concen-
trationsmeasured in vehicle-treated SPFCD controls. Concentrations are based on physiological levels reported for each amino acid
in mouse blood (Smith, 2000) and on fold-changes observed in our metabolomics dataset for each amino acid between control SPF
CDand AkkPb KDmice (Table S5). Vehicle-treatedmicewere injectedwith PBS (200 ul/ 30 gmouse). On day 14,micewere tested for
6-Hz seizures 2 hours after the final morning amino acid injection, with a prior 1-hour acclimation period in the behavioral
testing room.
GGsTop TreatmentFor wild-typemice: 4-week old SPF SwissWebstermicewere fed CD ad libitum for 14 days. Beginning on the evening of day 11,mice
were orally gavaged every 12 hours with 13.3 mg/kg 3-[[(3-amino-3-carboxypropyl)methoxyphosphinyl]oxy]benzeneacetic acid
(GGsTop, Tocris Bioscience) in sterile water. Vehicle-treated mice were gavaged with sterile water (200 ul/ 30 g mouse). On day
14, mice were tested for 6-Hz seizures 2 hours after the final morning GGsTop gavage, with a prior 1-hour acclimation period in
the behavioral testing room. For Kcna1 mice: 3-4 week old Kcna1�/� mice were fed the CD ad libitum for 23 days. On Day 15,
EEG transmitters were implanted as described in the Kcna1 Seizure Recordings section above. On the evening of day 18, mice
were orally gavaged every 12 hours with 13.3 mg/kg GGsTop through the morning of day 21. Seizures were recorded over 3 days
by EEG beginning 2 hours after the final gavage.
Cross-Feeding in vitro AssayCross-feeding wasmeasured as previously described (Flynn et al., 2016). A. muciniphilawas embedded at 2x10⁶ cfu/ml in 5 mL pre-
reduced CD or KD-based liquid media supplemented with 1% agar at the bottom of an anaerobic tube, and P. merdae was overlaid
above it at 6x10⁶ cfu/ml in 5mL pre-reducedM9minimal media. Diet-basedmedia were generated by aseptically suspendingmouse
KD versus CD diets, described above, to 2 kcal/ml in M9 media. Pilot experiments confirmed no ectopic translocation of embedded
A. muciniphila from the agar compartment into the above M9 liquid compartment. For each time point, aliquots were taken from the
top and bottom compartments, plated in a dilution series in rich media (RCM for P. merdae and BHI + 0.05% mucins for
A.muciniphila), and colonies were counted. For GGsTop pre-treatment experiments, P. merdaewas incubated with 500 uMGGsTop
versus vehicle in RCMmedia at 37�C for 2 hours and then washed with sterile media. Pilot experiments revealed no significant effect
of GGsTop pre-treatment on P. merdae viability.
GGT Activity AssayGGT activity was measured as previously described (van der Stel et al., 2015). For anaerobic cultures, bacteria were seeded at
33 105 cfu/ml in CD- and KD-based media. 1 mL bacterial suspension was pelleted and frozen at �80�C for 1 hr. Separate aliquots
of the same suspension were plated in BHI mucin agar media or RCM and incubated at 37�C in a Coy anaerobic chamber for later
data normalization by bacterial cfu. Pellets were then resuspended in 250 ul lysis buffer (50 mM Tris-HCl with 1 ug/ml lysozyme) and
incubated on ice for 30 min. For fecal samples, one pellet was weighed and homogenized in 1 mL lysis buffer. Bacterial and fecal
suspensions were then sonicated (QSonica 125) and centrifuged at 12000 xg for 10 min at 4�C. 20 ul supernatant was mixed with
180 ul substrate buffer (2.9 mM L-gamma-glutamyl-3-carboxy-4-nitroanilide (Gold Bio), 100 mM of glycylglycine (Sigma Aldrich),
100 mM Tris-HCl), and 500 uM GGsTop (if noted). Absorbance at 405 nm denoting production of 3-carboxy-4-nitroaniline was
measured every minute for 1 hr at 37�C using an automated multimode plate reader (Biotek Synergy H1).
Intestinal Permeability AssayMice were fasted for 4 hr beginning at 7am before gavage with 0.6 g/kg 4 kDa FITC-dextran (Sigma Aldrich). 4 hours after gavage,
serum samples were collected by cardiac puncture, diluted 3-fold in water and read in duplicate for fluorescence intensity at 521 nm
using a Synergy H9 multimode plate reader (Biotek) against a standard dilution series of stock FITC-dextran in 3-fold diluted normal
mouse serum in water.
Cell 173, 1–14.e1–e6, June 14, 2018 e5
Please cite this article in press as: Olson et al., The Gut Microbiota Mediates the Anti-Seizure Effects of the Ketogenic Diet, Cell (2018), https://doi.org/10.1016/j.cell.2018.04.027
QUANTIFICATION AND STATISTICAL ANALYSIS
Statistical analysis was performed using Prism software (GraphPad). Data were assessed for normal distribution and plotted in the
figures as mean ± SEM. For each figure, n = the number of independent biological replicates. No samples or animals were excluded
from the analyses. Differences between two treatment groups were assessed using two-tailed, unpaired Student t test with Welch’s
correction. Differences among > 2 groups with only one variable were assessed using one-way ANOVAwith Bonferroni post hoc test.
Taxonomic comparisons from 16S rDNA sequencing analysis were analyzed by Kruskal-Wallis test with Bonferroni post hoc test.
Data for Kcna1 mice were analyzed by non-parametric Mann-Whitney test. Two-way ANOVA with Bonferroni post hoc test was
used for R 2 groups with two variables (e.g., seizure time course, BHB time course, metabolomics data, bacterial growth curves).
One-way ANOVA with repeated-measures and Bonferroni post hoc test was used for GGT assays. Significant differences emerging
from the above tests are indicated in the figures by *p < 0.05, **p < 0.01, ***p < 0.001, ****p < 0.0001 Notable near-significant differ-
ences (0.5 < p < 0.1) are indicated in the figures. Notable non-significant (and non-near significant) differences are indicated in the
figures by ‘‘n.s..’’
DATA AND SOFTWARE AVAILABILITY
The accession number for the 16S rDNA sequencing data andmetadata reported in this paper is QIITA (https://qiita.ucsd.edu/): 11566.
e6 Cell 173, 1–14.e1–e6, June 14, 2018

Supplemental Figures
A C
B D
Figure S1. The Ketogenic Diet Alters Relative Abundances of Particular Bacterial Taxa from the Gut Microbiota, Related to Figure 1
(A) Weight gain (top) and food (consumption) over 14 days on CD versus KD. n = 9, 9, 12, 3 (weight); n = 3 (food).
(B) Alpha diversity based on 16S rDNA sequencing of the fecal gutmicrobiota on days 0, 4, 8 and 14 after treatment with the control diet (CD, top) versus ketogenic
diet (KD, bottom) n = 3 per time point.
(C) Heatmap of 16S rDNA sequencing data, where columns represent bacterial taxa indicated by their lowest resolved taxonomic levels. Rows represent fecal
samples collected fromCDor KD-fedmice at Day 0 (pre-treatment), 4, 8 or 14, where gray fields indicatemice fedCD and blue indicate mice fed KD. Phylogenetic
classifications are based on weighted UniFrac data. Asterisks denote statistical significance between CD and KD groups (excluding Day 0). Red text highlights
A. muciniphila and Parabacteroides. n = 3.
(D) Relative abundances of select bacterial taxa that are enriched in SPF mice fed KD (top row) or CD (bottom row). n = 3.
Data are presented as mean ± SEM. Kruskal-Wallis with Bonferroni: *p < 0.05, **p < 0.01, ***p < 0.001, ****p < 0.0001. n.s. = not statistically significant. CD =
control diet, KD = ketogenic diet.
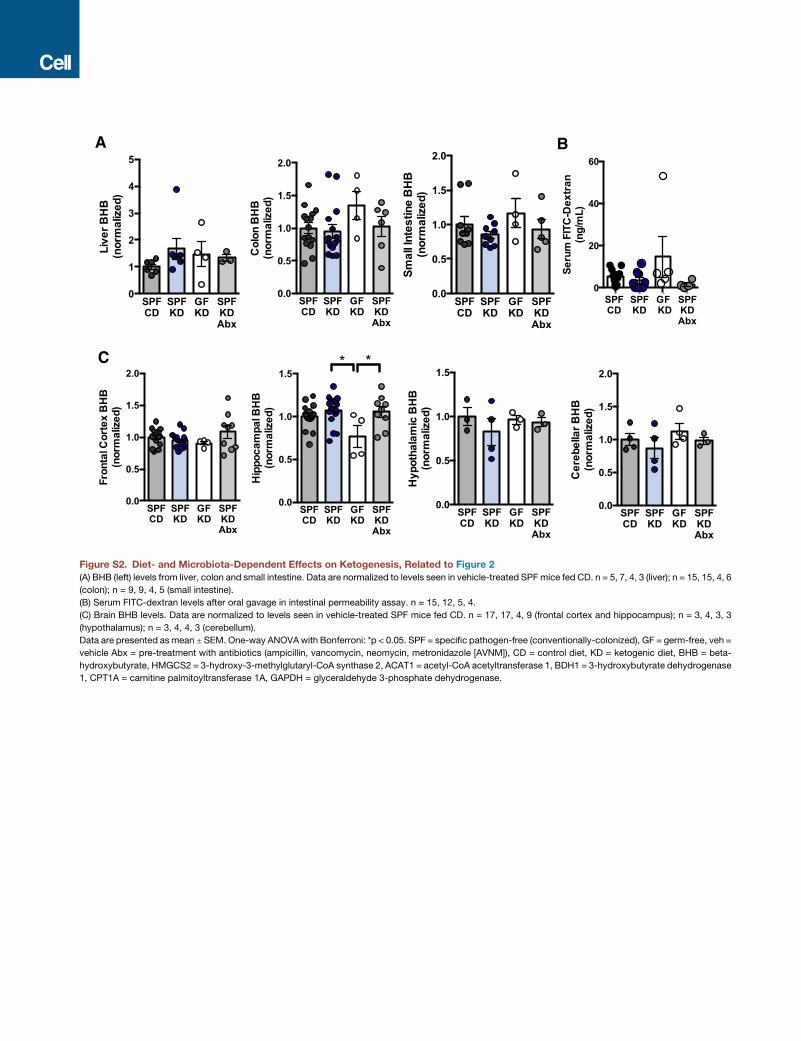
A B
C
Figure S2. Diet- and Microbiota-Dependent Effects on Ketogenesis, Related to Figure 2
(A) BHB (left) levels from liver, colon and small intestine. Data are normalized to levels seen in vehicle-treated SPF mice fed CD. n = 5, 7, 4, 3 (liver); n = 15, 15, 4, 6
(colon); n = 9, 9, 4, 5 (small intestine).
(B) Serum FITC-dextran levels after oral gavage in intestinal permeability assay. n = 15, 12, 5, 4.
(C) Brain BHB levels. Data are normalized to levels seen in vehicle-treated SPF mice fed CD. n = 17, 17, 4, 9 (frontal cortex and hippocampus); n = 3, 4, 3, 3
(hypothalamus); n = 3, 4, 4, 3 (cerebellum).
Data are presented asmean ± SEM. One-way ANOVAwith Bonferroni: *p < 0.05. SPF = specific pathogen-free (conventionally-colonized), GF = germ-free, veh =
vehicle Abx = pre-treatment with antibiotics (ampicillin, vancomycin, neomycin, metronidazole [AVNM]), CD = control diet, KD = ketogenic diet, BHB = beta-
hydroxybutyrate, HMGCS2 = 3-hydroxy-3-methylglutaryl-CoA synthase 2, ACAT1 = acetyl-CoA acetyltransferase 1, BDH1 = 3-hydroxybutyrate dehydrogenase
1, CPT1A = carnitine palmitoyltransferase 1A, GAPDH = glyceraldehyde 3-phosphate dehydrogenase.

A
B
C
D
Figure S3. Colonization, Weight, Glucose, and BHB Levels after Abx Treatment, Related to Figure 3
(A) Relative abundance of Akkermansia muciniphila (left) and Parabacteroides (right), measured by 16S rDNA sequencing, after colonization of Abx-treated SPF
mice. n = 3, 3, 3, 3, 3, 3, 4, 7, 4, 3, 3, 3 cages.
(B) Cecal weight (left) andmouseweight (right) at 14 days after dietary treatment in Abx-treated SPFmice colonized with different bacterial taxa. n = 28, 28, 12, 32,
6, 16, 12, 14, 18, 15, 6, 6.
(C) Serum glucose (left) and BHB (right) concentrations at 14 days after dietary treatment in Abx-treated SPF mice colonized with different bacterial taxa. n = 12,
11, 11, 8, 6, 14, 6, 14, 6 (glucose); n = 18, 18, 12, 19, 6, 16, 12, 6, 18, 6, 12, 6 (BHB).
(D) Seizure thresholds in response to 6-Hz stimulation in SPF mice pre-treated with vehicle or Abx, and colonized with A. muciniphila and P. merdae (Pbmerd),
P. distasonis (Pbdist), or both (left). n = 8, 5, 6. Behavior in representative cohort of seizure-tested mice (right). Yellow line at y = 10 s represents threshold for
scoring seizures, and yellow triangle at 24 mA denotes starting current per experimental cohort. n = 16, 25.
Data are presented as mean ± SEM. One-way ANOVA with Bonferroni: *p < 0.05, **p < 0.01, ***p < 0.001, ****p < 0.0001. SPF = specific pathogen-free
(conventionally-colonized), GF = germ-free, CD = control diet, KD = ketogenic diet, CC50 = current intensity producing seizures in 50% of mice tested, veh =
vehicle, Abx = pre-treated with antibiotics (ampicillin, vancomycin, neomycin, metronidazole [AVNM]), Pb = Parabacteroides (P. merdae and P. distasonis), Akk =
Akkermansia muciniphila, AkkPb = A. muciniphila, P. merdae and P. distasonis, Bf = Bifidobacterium longum.
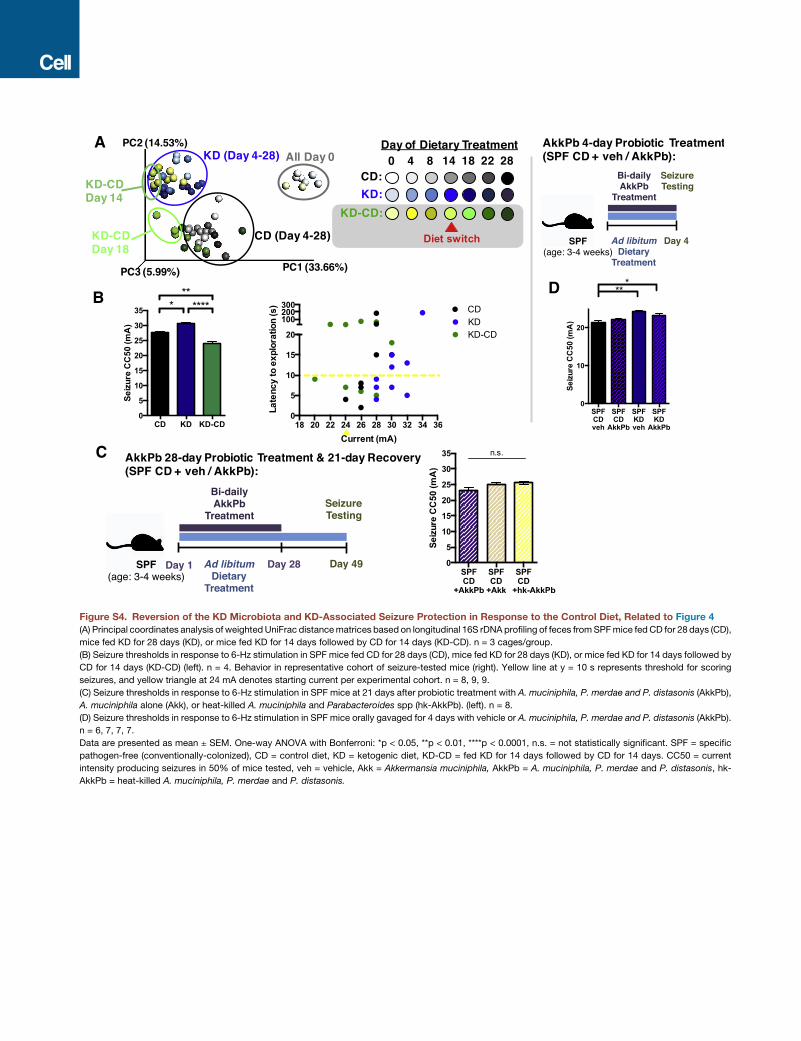
A
BD
C
Figure S4. Reversion of the KD Microbiota and KD-Associated Seizure Protection in Response to the Control Diet, Related to Figure 4
(A) Principal coordinates analysis of weightedUniFrac distancematrices based on longitudinal 16S rDNA profiling of feces fromSPFmice fedCD for 28 days (CD),
mice fed KD for 28 days (KD), or mice fed KD for 14 days followed by CD for 14 days (KD-CD). n = 3 cages/group.
(B) Seizure thresholds in response to 6-Hz stimulation in SPF mice fed CD for 28 days (CD), mice fed KD for 28 days (KD), or mice fed KD for 14 days followed by
CD for 14 days (KD-CD) (left). n = 4. Behavior in representative cohort of seizure-tested mice (right). Yellow line at y = 10 s represents threshold for scoring
seizures, and yellow triangle at 24 mA denotes starting current per experimental cohort. n = 8, 9, 9.
(C) Seizure thresholds in response to 6-Hz stimulation in SPF mice at 21 days after probiotic treatment with A. muciniphila, P. merdae and P. distasonis (AkkPb),
A. muciniphila alone (Akk), or heat-killed A. muciniphila and Parabacteroides spp (hk-AkkPb). (left). n = 8.
(D) Seizure thresholds in response to 6-Hz stimulation in SPF mice orally gavaged for 4 days with vehicle or A. muciniphila, P. merdae and P. distasonis (AkkPb).
n = 6, 7, 7, 7.
Data are presented as mean ± SEM. One-way ANOVA with Bonferroni: *p < 0.05, **p < 0.01, ****p < 0.0001, n.s. = not statistically significant. SPF = specific
pathogen-free (conventionally-colonized), CD = control diet, KD = ketogenic diet, KD-CD = fed KD for 14 days followed by CD for 14 days. CC50 = current
intensity producing seizures in 50% of mice tested, veh = vehicle, Akk = Akkermansia muciniphila, AkkPb = A. muciniphila, P. merdae and P. distasonis, hk-
AkkPb = heat-killed A. muciniphila, P. merdae and P. distasonis.
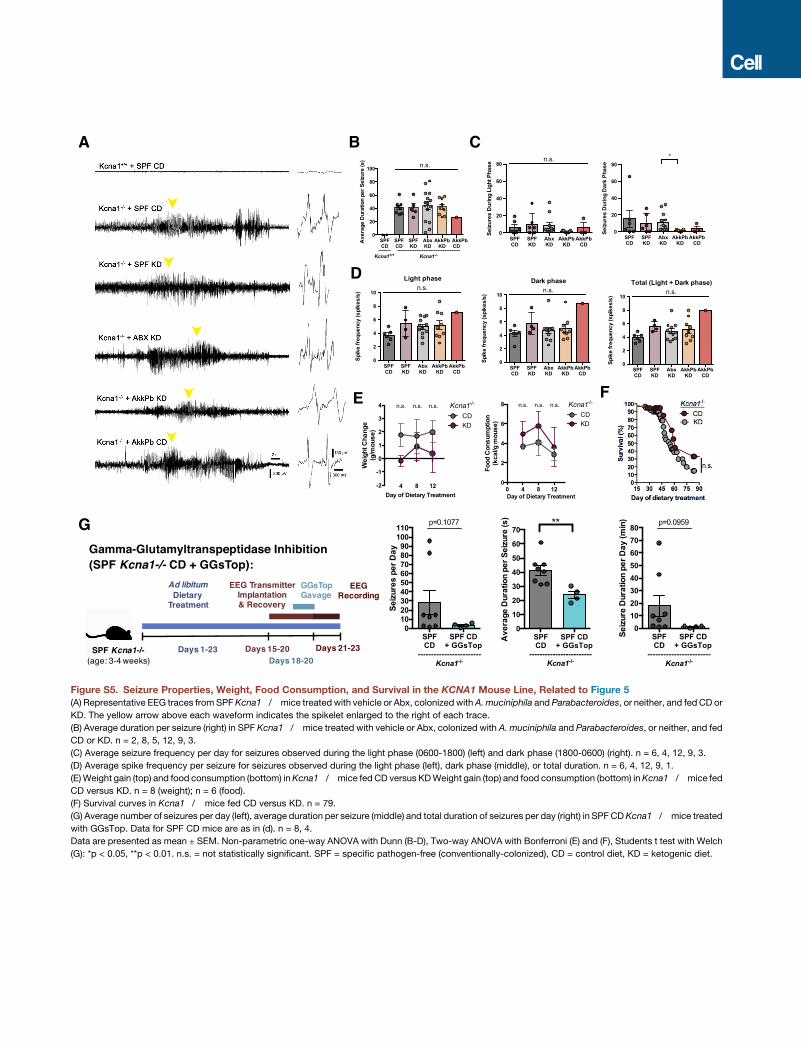
A B C
D
E F
G
Figure S5. Seizure Properties, Weight, Food Consumption, and Survival in the KCNA1 Mouse Line, Related to Figure 5(A) Representative EEG traces from SPFKcna1�/�mice treated with vehicle or Abx, colonized withA.muciniphila and Parabacteroides, or neither, and fed CD or
KD. The yellow arrow above each waveform indicates the spikelet enlarged to the right of each trace.
(B) Average duration per seizure (right) in SPF Kcna1�/�mice treated with vehicle or Abx, colonized with A. muciniphila and Parabacteroides, or neither, and fed
CD or KD. n = 2, 8, 5, 12, 9, 3.
(C) Average seizure frequency per day for seizures observed during the light phase (0600-1800) (left) and dark phase (1800-0600) (right). n = 6, 4, 12, 9, 3.
(D) Average spike frequency per seizure for seizures observed during the light phase (left), dark phase (middle), or total duration. n = 6, 4, 12, 9, 1.
(E)Weight gain (top) and food consumption (bottom) inKcna1�/�mice fedCD versus KDWeight gain (top) and food consumption (bottom) inKcna1�/�mice fed
CD versus KD. n = 8 (weight); n = 6 (food).
(F) Survival curves in Kcna1�/� mice fed CD versus KD. n = 79.
(G) Average number of seizures per day (left), average duration per seizure (middle) and total duration of seizures per day (right) in SPF CDKcna1�/�mice treated
with GGsTop. Data for SPF CD mice are as in (d). n = 8, 4.
Data are presented as mean ± SEM. Non-parametric one-way ANOVA with Dunn (B-D), Two-way ANOVA with Bonferroni (E) and (F), Students t test with Welch
(G): *p < 0.05, **p < 0.01. n.s. = not statistically significant. SPF = specific pathogen-free (conventionally-colonized), CD = control diet, KD = ketogenic diet.

A
B
C
D
Figure S6. The Colonic Lumenal, Serum, and Hippocampal Metabolomes Are Modulated by the Ketogenic Diet and Microbiota Status,
Related to Figure 6
(A) Number of statistically significant alterations in metabolites out of the 622 detected in colonic lumen and 670 detected in serum. Values noted in black text are
total number of metabolites altered, with values in green denoting upregulation and values in red denoting downregulation. n = 8 cages/group.
(B) Levels of non-gamma glutamylated amino acids in colonic lumenal contents from SPF mice fed CD, SPF mice fed KD, Abx-treated mice fed KD, and AkkPb-
colonized mice fed KD. n = 8 cages/group.
(C) Levels of non-gamma glutamylated amino acids in sera fromSPFmice fedCD, SPFmice fed KD, Abx-treatedmice fed KD, and AkkPb-colonizedmice fed KD.
n = 8 cages/group.
(D) Levels of GABA and glutamate in hippocampal lysates from SPFmice fed CD, SPF mice fed KD, Abx-treated mice fed KD and AkkPb-colonized mice fed KD.
n = 5
Data are presented as mean ± SEM. Two-way ANOVA contrasts: *p < 0.05, **p < 0.01, ***p < 0.001, ****p < 0.0001. n.s. = not statistically significant. CD = control
diet, KD = ketogenic diet, SPF = specific pathogen-free (conventionally-colonized), veh = vehicle, Abx = pre-treated with antibiotics (ampicillin, vancomycin,
neomycin, metronidazole [AVNM]), AkkPb = A. muciniphila, P. merdae and P. distasonis, a.u. = arbitrary units, BHB = beta-hydroxybutyrate.
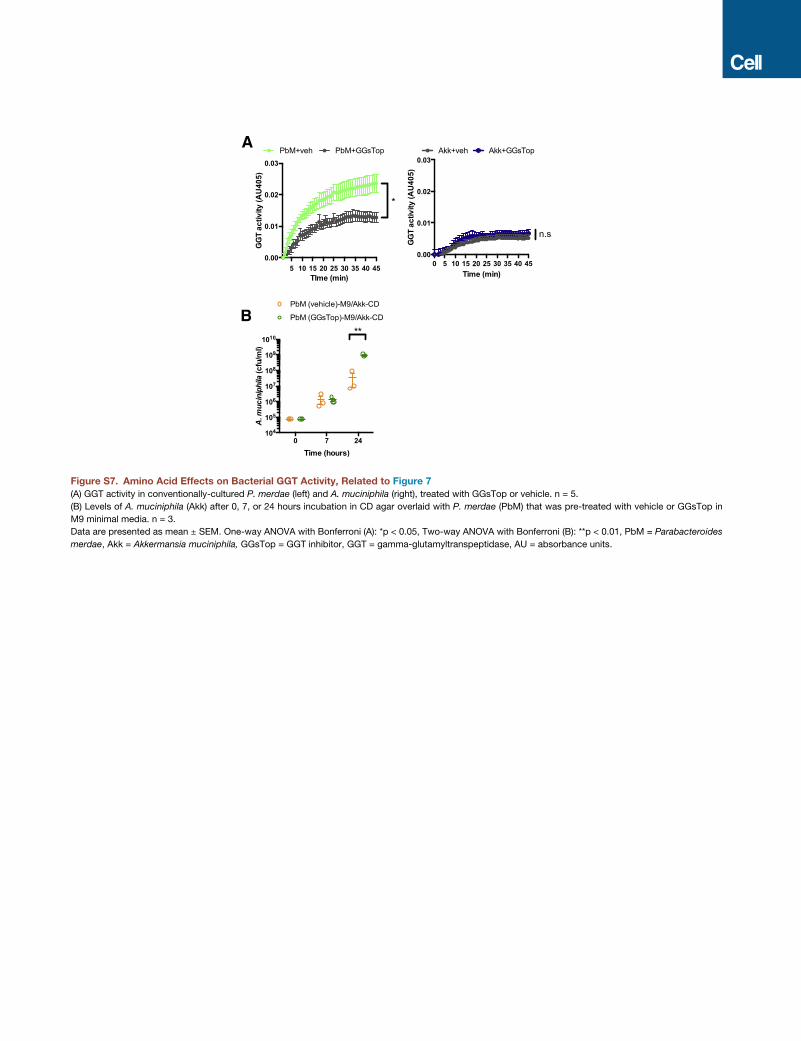
A
B
Figure S7. Amino Acid Effects on Bacterial GGT Activity, Related to Figure 7
(A) GGT activity in conventionally-cultured P. merdae (left) and A. muciniphila (right), treated with GGsTop or vehicle. n = 5.
(B) Levels of A. muciniphila (Akk) after 0, 7, or 24 hours incubation in CD agar overlaid with P. merdae (PbM) that was pre-treated with vehicle or GGsTop in
M9 minimal media. n = 3.
Data are presented as mean ± SEM. One-way ANOVA with Bonferroni (A): *p < 0.05, Two-way ANOVA with Bonferroni (B): **p < 0.01, PbM = Parabacteroides
merdae, Akk = Akkermansia muciniphila, GGsTop = GGT inhibitor, GGT = gamma-glutamyltranspeptidase, AU = absorbance units.