Embed Size (px)
Citation preview
THE GUINNESS GLOBAL ENERGY REPORT
Developments and trends for investors in the global energy sector September 2016
Tel: +44 (0) 20 7222 5703 Email: [email protected] Web: guinnessfunds.com
Guinness Asset Management Ltd is authorised and regulated by the
Financial Conduct Authority
HIGHLIGHTS FOR AUGUST
OIL Brent and WTI up; OPEC freeze contemplated again
Brent and WTI oil traded up in the month; WTI rose by $3 to $45/bbl and Brent rose by $4 to $47/bbl. There was renewed discussion of an OPEC-Russia production freeze, though underlying OPEC supply has risen by over 0.5m b/day since May. Structural rebalancing of the oil market continued, with US onshore production falling by 83k b/day.
NATURAL GAS US gas prices steady as undersupply and weather erodes surplus Henry Hub prices remained steady in August, rising from $2.88 to $2.89/mcf aided by warmer weather in the United States and structural (i.e. weather adjusted) undersupply (c. 2-3 Bcf/day) as onshore production declines. There remains a surplus of gas in storage, but this has been reduced to 0.3 Tcf vs 1 Tcf at the start of the Summer.
EQUITIES
Energy outperforms the broad market The MSCI World Energy Index rose in August by 0.8%, outperforming the MSCI World Index which rose by 0.1% (all in US dollar terms). So far in 2016, the Energy Index is up by 15.2%, versus the MSCI World up by 5.4%.
CHART OF THE MONTH Global upstream CAPEX spend set for four-year decline The fall in the oil price since 2014 has resulted in a significant change in the spending behaviour of the global oil community. With global upstream capital expenditure expected to fall again in 2017, this will represent the fourth consecutive year of spending declines. Even the 1998/99 downcycle, also caused by oversupply, only saw a single year of capex decline, as did the 2008/09 global recession. The effects of the slowdown in spending will be felt increasingly towards the end of the decade, as the pipeline of new production projects coming onstream diminishes. Global upstream CAPEX growth vs oil price (1998-2018e)
-30%
-20%
-10%
0%
10%
20%
30%
40%
0
20
40
60
80
100
120
140
Up
stre
am C
AP
EX (y
ear/
year
ch
ange
%)
Oil
pri
ce (
Bre
nt
$/b
bl)
Global upstream capex Oil price (Brent ($/bbl)
Source: Simmons International, Guinness Asset Management
GUINNESS GLOBAL ENERGY FUND
Fund size: $304m (31.08.16)
The Guinness Global Energy Fund
invests in listed equities of companies
engaged in the exploration, production
and distribution of oil, gas and other
energy sources. We believe that over
the next twenty years the combined
effects of population growth, developing
world industrialisation and diminishing
fossil fuel supplies will force energy
prices higher and generate growing
profits for energy companies.
The Fund is run by Tim Guinness, Will
Riley and Jonathan Waghorn. The
investment philosophy, methodology
and style which characterise the
Guinness approach have been applied to
the management of energy equity
portfolios since 1998.
Important information about this report
This report is primarily designed to inform you about recent developments in the energy markets invested in by the Guinness Global Energy Fund. It also provides information about the Fund’s portfolio, including recent activity and performance. This document is provided for information only and all the information contained in it is believed to be reliable but may be inaccurate or incomplete; any opinions stated are honestly held at the time of writing, but are not guaranteed. The contents of the document should not therefore be relied upon. It is not an invitation to make an investment nor does it constitute an offer for sale.
The Guinness Global Energy Report September 2016
Guinness Global Energy Fund guinnessfunds.com
The value of investments and the income from them can go down as well as up. Guinness Asset Management is authorised and regulated by the Financial Conduct Authority. 2
Contents
1. AUGUST IN REVIEW ................................................................................................ 2
2. MANAGER’S COMMENTS ....................................................................................... 7
3. PERFORMANCE Guinness Global Energy Fund ...................................................... 9
4. PORTFOLIO Guinness Global Energy Fund ......................................................... 10
5. OUTLOOK ............................................................................................................. 13
3. APPENDIX Oil and gas markets historical context .............................................. 23
1. AUGUST IN REVIEW i) Oil market
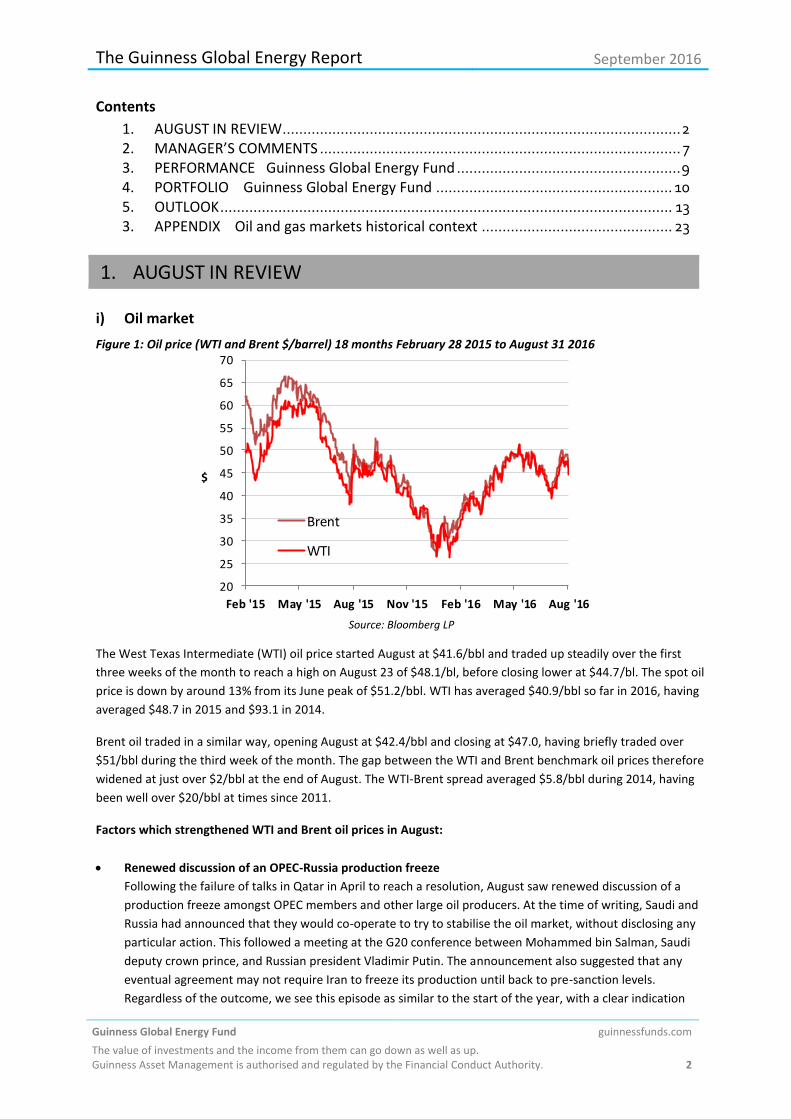
Figure 1: Oil price (WTI and Brent $/barrel) 18 months February 28 2015 to August 31 2016
20
25
30
35
40
45
50
55
60
65
70
Feb '15 May '15 Aug '15 Nov '15 Feb '16 May '16 Aug '16
$
Brent
WTI
Source: Bloomberg LP
The West Texas Intermediate (WTI) oil price started August at $41.6/bbl and traded up steadily over the first
three weeks of the month to reach a high on August 23 of $48.1/bl, before closing lower at $44.7/bl. The spot oil
price is down by around 13% from its June peak of $51.2/bbl. WTI has averaged $40.9/bbl so far in 2016, having
averaged $48.7 in 2015 and $93.1 in 2014.
Brent oil traded in a similar way, opening August at $42.4/bbl and closing at $47.0, having briefly traded over
$51/bbl during the third week of the month. The gap between the WTI and Brent benchmark oil prices therefore
widened at just over $2/bbl at the end of August. The WTI-Brent spread averaged $5.8/bbl during 2014, having
been well over $20/bbl at times since 2011.
Factors which strengthened WTI and Brent oil prices in August:
Renewed discussion of an OPEC-Russia production freeze
Following the failure of talks in Qatar in April to reach a resolution, August saw renewed discussion of a
production freeze amongst OPEC members and other large oil producers. At the time of writing, Saudi and
Russia had announced that they would co-operate to try to stabilise the oil market, without disclosing any
particular action. This followed a meeting at the G20 conference between Mohammed bin Salman, Saudi
deputy crown prince, and Russian president Vladimir Putin. The announcement also suggested that any
eventual agreement may not require Iran to freeze its production until back to pre-sanction levels.
Regardless of the outcome, we see this episode as similar to the start of the year, with a clear indication
The Guinness Global Energy Report September 2016
Guinness Global Energy Fund guinnessfunds.com
The value of investments and the income from them can go down as well as up. Guinness Asset Management is authorised and regulated by the Financial Conduct Authority. 3
that OPEC and Russia do not wish the floor for the oil price to be much below $50/bbl. Together, Saudi and
Russia produce just over 20% of world oil supply.
US oil production decline
US onshore oil production declined in June 2016 (latest data point) by 83,000 b/day. This was lower than
the April and May 2016 declines of 151,000 and 100,000 b/day but still well above declines seen in
February and March. Onshore production is down by around 1m b/day from the March 2015 peak. We
expect US oil production to decline throughout 2016 if oil prices remain at or around current levels.
Fall in NYMEX non-commercial short position
The New York Mercantile Exchange (NYMEX) non-commercial crude oil futures short position (WTI) fell
sharply in August. After rising to 295m contracts at the end of July (versus February 2016’s all-time high of
359m contracts), the short position declined to 197m contracts at the end of August. Typically there is a
strong inverse correlation between the short position and the oil price.
Factors which weakened WTI and Brent oil prices in August:
Increase in OPEC supply over the Summer
According to the latest IEA report, oil supply from OPEC rose by around 0.6m b/day between May and July
(the latest data point available). The majority of this increase, 0.4m b/day, came from Saudi, which can be
partly explained by a summer ramp-up for electricity burn relating to air-conditioning, but also likely relates
to Saudi jockeying for position ahead of the current discussions on a freeze to OPEC production.
US oil drilling rig count starting to increase
The Baker Hughes oil directed rig count continued its modest recovery during the month, increasing from
374 at the end of August to 406 at the end of August, up by a total of 32 rigs over the month. The rig count
reached a low of 316 rigs in May 2016, having peaked in October 2014 at 1,609 rigs.
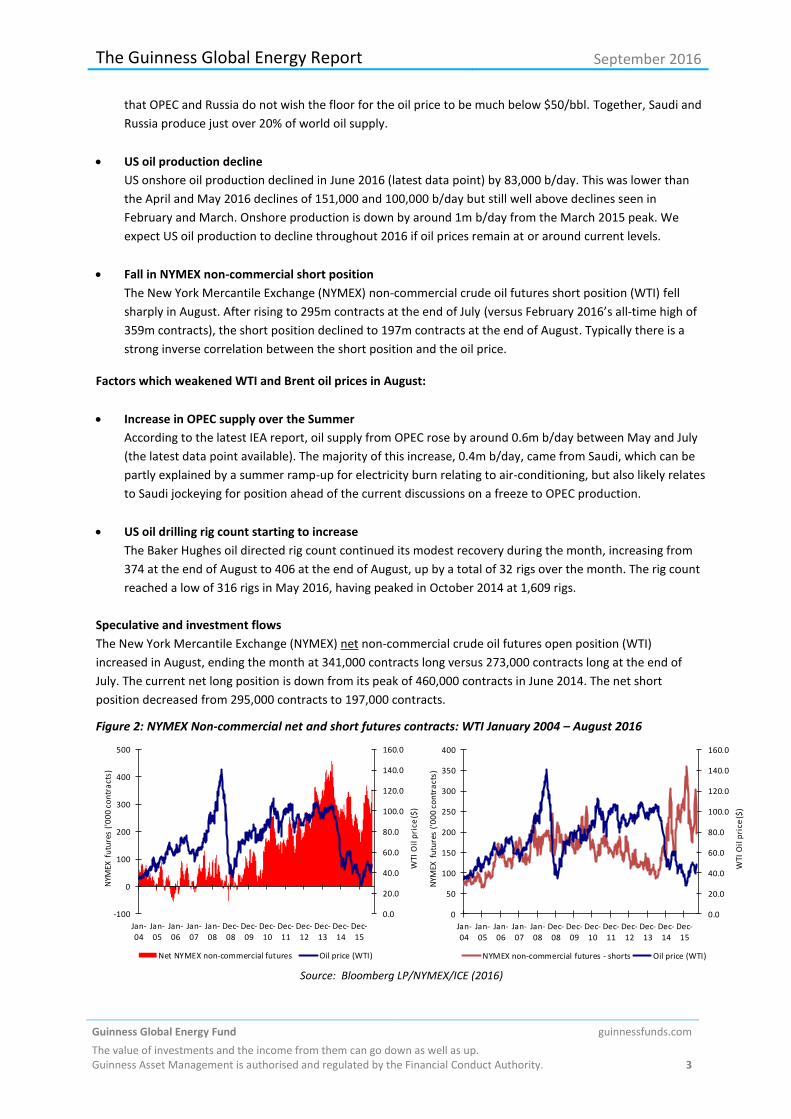
Speculative and investment flows
The New York Mercantile Exchange (NYMEX) net non-commercial crude oil futures open position (WTI)
increased in August, ending the month at 341,000 contracts long versus 273,000 contracts long at the end of
July. The current net long position is down from its peak of 460,000 contracts in June 2014. The net short
position decreased from 295,000 contracts to 197,000 contracts.
Figure 2: NYMEX Non-commercial net and short futures contracts: WTI January 2004 – August 2016
0.0
20.0
40.0
60.0
80.0
100.0
120.0
140.0
160.0
-100
0
100
200
300
400
500
Jan-
04
Jan-
05
Jan-
06
Jan-
07
Jan-
08
Dec-
08
Dec-
09
Dec-
10
Dec-
11
Dec-
12
Dec-
13
Dec-
14
Dec-
15
WTI
Oil
pri
ce ($
)
NYM
EX f
utu
res
('0
00
co
ntr
act
s)
Net NYMEX non-commercial futures Oil price (WTI)
0.0
20.0
40.0
60.0
80.0
100.0
120.0
140.0
160.0
0
50
100
150
200
250
300
350
400
Jan-
04
Jan-
05
Jan-
06
Jan-
07
Jan-
08
Dec-
08
Dec-
09
Dec-
10
Dec-
11
Dec-
12
Dec-
13
Dec-
14
Dec-
15
WTI
Oil
pri
ce ($
)
NYM
EX f
utu
res
('0
00
co
ntr
act
s)
NYMEX non-commercial futures - shorts Oil price (WTI)
Source: Bloomberg LP/NYMEX/ICE (2016)
The Guinness Global Energy Report September 2016
Guinness Global Energy Fund guinnessfunds.com
The value of investments and the income from them can go down as well as up. Guinness Asset Management is authorised and regulated by the Financial Conduct Authority. 4
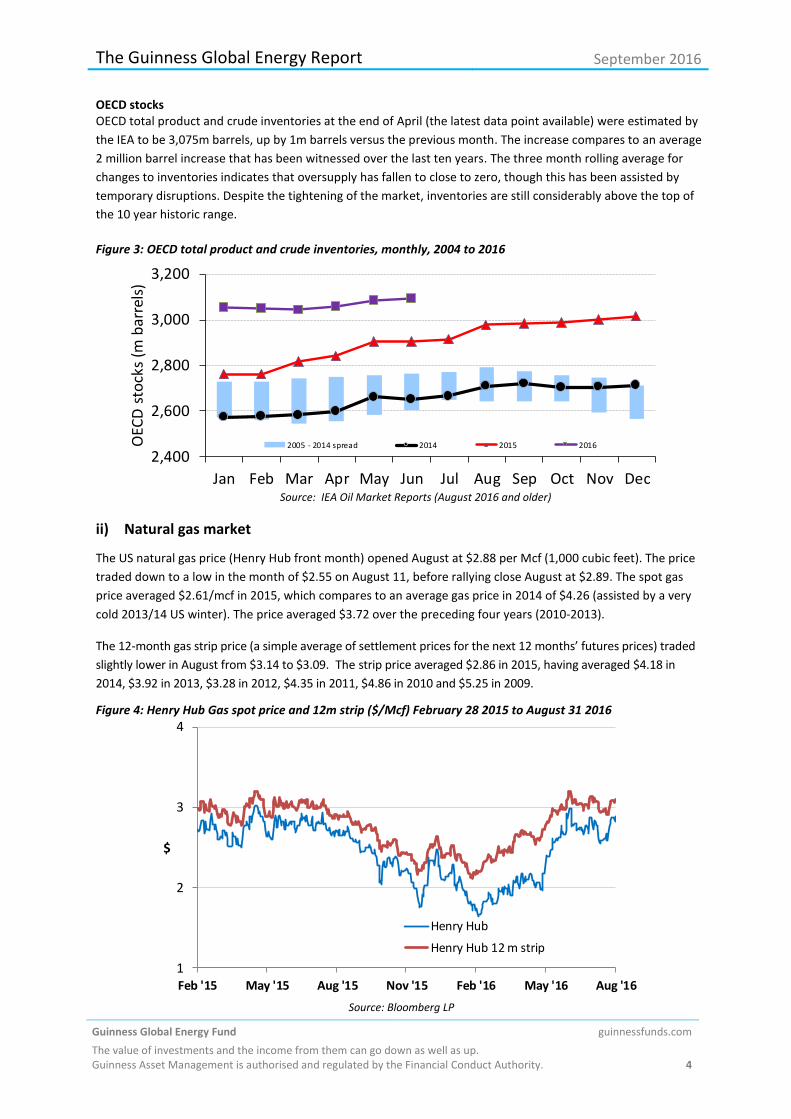
OECD stocks OECD total product and crude inventories at the end of April (the latest data point available) were estimated by
the IEA to be 3,075m barrels, up by 1m barrels versus the previous month. The increase compares to an average
2 million barrel increase that has been witnessed over the last ten years. The three month rolling average for
changes to inventories indicates that oversupply has fallen to close to zero, though this has been assisted by
temporary disruptions. Despite the tightening of the market, inventories are still considerably above the top of
the 10 year historic range.
Figure 3: OECD total product and crude inventories, monthly, 2004 to 2016
2,400
2,600
2,800
3,000
3,200
Jan Feb Mar Apr May Jun Jul Aug Sep Oct Nov Dec
OEC
D s
tock
s (m
bar
rels
)
2005 - 2014 spread 2014 2015 2016
Source: IEA Oil Market Reports (August 2016 and older)
ii) Natural gas market
The US natural gas price (Henry Hub front month) opened August at $2.88 per Mcf (1,000 cubic feet). The price
traded down to a low in the month of $2.55 on August 11, before rallying close August at $2.89. The spot gas
price averaged $2.61/mcf in 2015, which compares to an average gas price in 2014 of $4.26 (assisted by a very
cold 2013/14 US winter). The price averaged $3.72 over the preceding four years (2010-2013).
The 12-month gas strip price (a simple average of settlement prices for the next 12 months’ futures prices) traded
slightly lower in August from $3.14 to $3.09. The strip price averaged $2.86 in 2015, having averaged $4.18 in
2014, $3.92 in 2013, $3.28 in 2012, $4.35 in 2011, $4.86 in 2010 and $5.25 in 2009.
Figure 4: Henry Hub Gas spot price and 12m strip ($/Mcf) February 28 2015 to August 31 2016
1
2
3
4
Feb '15 May '15 Aug '15 Nov '15 Feb '16 May '16 Aug '16
$
Henry Hub
Henry Hub 12 m strip
Source: Bloomberg LP
The Guinness Global Energy Report September 2016
Guinness Global Energy Fund guinnessfunds.com
The value of investments and the income from them can go down as well as up. Guinness Asset Management is authorised and regulated by the Financial Conduct Authority. 5
Factors which strengthened the US gas price in August included:
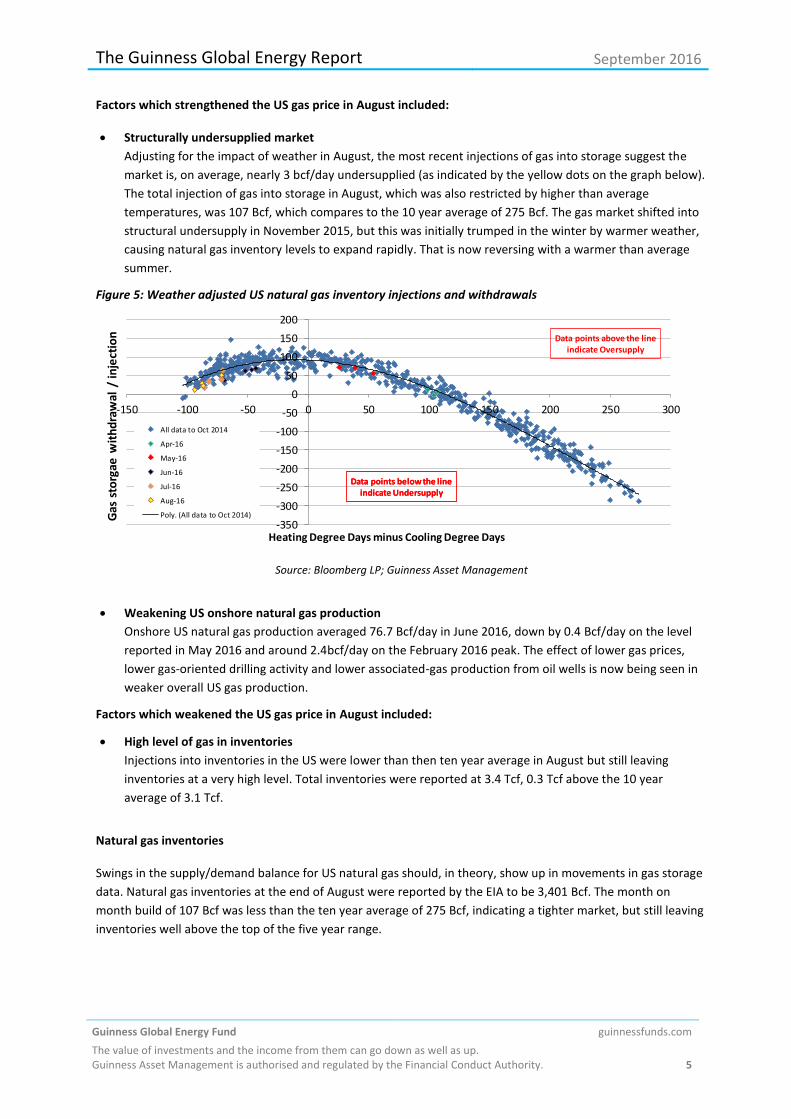
Structurally undersupplied market
Adjusting for the impact of weather in August, the most recent injections of gas into storage suggest the
market is, on average, nearly 3 bcf/day undersupplied (as indicated by the yellow dots on the graph below).
The total injection of gas into storage in August, which was also restricted by higher than average
temperatures, was 107 Bcf, which compares to the 10 year average of 275 Bcf. The gas market shifted into
structural undersupply in November 2015, but this was initially trumped in the winter by warmer weather,
causing natural gas inventory levels to expand rapidly. That is now reversing with a warmer than average
summer.
Figure 5: Weather adjusted US natural gas inventory injections and withdrawals
-350
-300
-250
-200
-150
-100
-50
0
50
100
150
200
-150 -100 -50 0 50 100 150 200 250 300
Gas
sto
rgae
wit
hd
raw
al /
inje
ctio
n
Heating Degree Days minus Cooling Degree Days
All data to Oct 2014
Apr-16
May-16
Jun-16
Jul-16
Aug-16
Poly. (All data to Oct 2014)
Data points below the lineindicate Undersupply
Data points below the lineindicate Undersupply
Data points above the lineindicate Oversupply
Source: Bloomberg LP; Guinness Asset Management
Weakening US onshore natural gas production
Onshore US natural gas production averaged 76.7 Bcf/day in June 2016, down by 0.4 Bcf/day on the level
reported in May 2016 and around 2.4bcf/day on the February 2016 peak. The effect of lower gas prices,
lower gas-oriented drilling activity and lower associated-gas production from oil wells is now being seen in
weaker overall US gas production.
Factors which weakened the US gas price in August included:
High level of gas in inventories
Injections into inventories in the US were lower than then ten year average in August but still leaving
inventories at a very high level. Total inventories were reported at 3.4 Tcf, 0.3 Tcf above the 10 year
average of 3.1 Tcf.
Natural gas inventories Swings in the supply/demand balance for US natural gas should, in theory, show up in movements in gas storage
data. Natural gas inventories at the end of August were reported by the EIA to be 3,401 Bcf. The month on
month build of 107 Bcf was less than the ten year average of 275 Bcf, indicating a tighter market, but still leaving
inventories well above the top of the five year range.
The Guinness Global Energy Report September 2016
Guinness Global Energy Fund guinnessfunds.com
The value of investments and the income from them can go down as well as up. Guinness Asset Management is authorised and regulated by the Financial Conduct Authority. 6
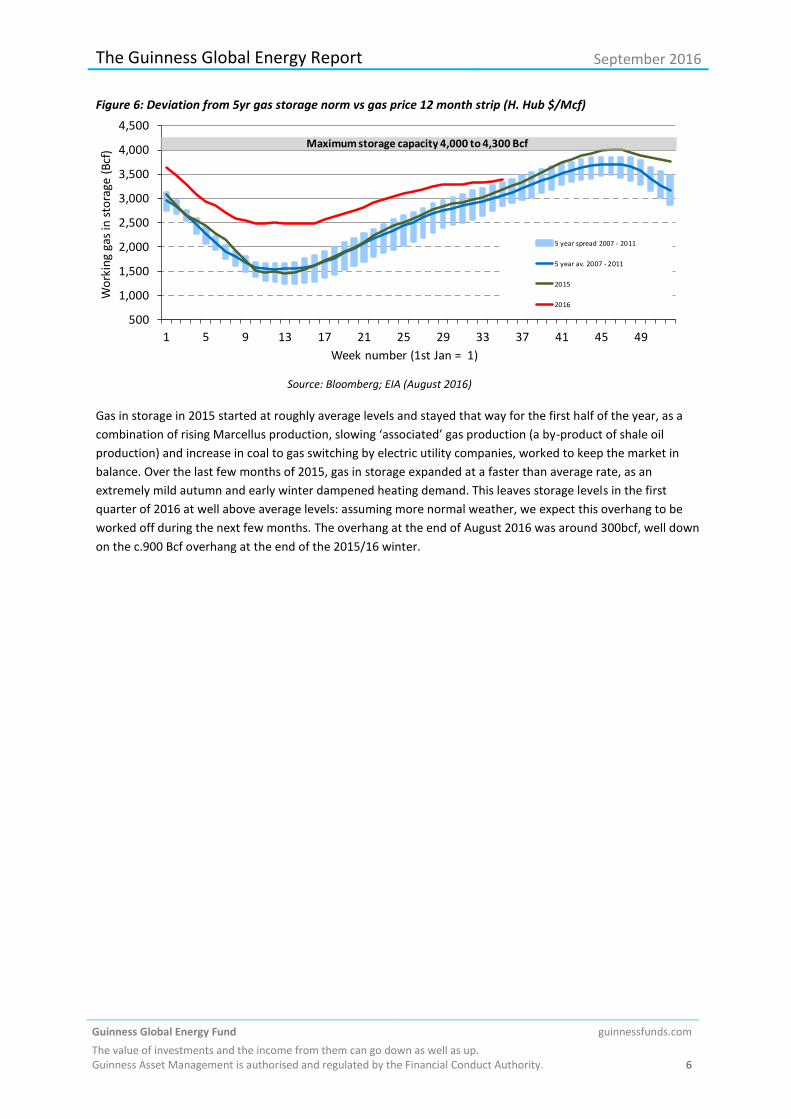
Figure 6: Deviation from 5yr gas storage norm vs gas price 12 month strip (H. Hub $/Mcf)
500
1,000
1,500
2,000
2,500
3,000
3,500
4,000
4,500
1 5 9 13 17 21 25 29 33 37 41 45 49
Wo
rkin
g ga
s in
sto
rage
(B
cf)
Week number (1st Jan = 1)
5 year spread 2007 - 2011
5 year av. 2007 - 2011
2015
2016
Maximum storage capacity 4,000 to 4,300 Bcf
Source: Bloomberg; EIA (August 2016)
Gas in storage in 2015 started at roughly average levels and stayed that way for the first half of the year, as a
combination of rising Marcellus production, slowing ‘associated’ gas production (a by-product of shale oil
production) and increase in coal to gas switching by electric utility companies, worked to keep the market in
balance. Over the last few months of 2015, gas in storage expanded at a faster than average rate, as an
extremely mild autumn and early winter dampened heating demand. This leaves storage levels in the first
quarter of 2016 at well above average levels: assuming more normal weather, we expect this overhang to be
worked off during the next few months. The overhang at the end of August 2016 was around 300bcf, well down
on the c.900 Bcf overhang at the end of the 2015/16 winter.
The Guinness Global Energy Report September 2016
Guinness Global Energy Fund guinnessfunds.com
The value of investments and the income from them can go down as well as up. Guinness Asset Management is authorised and regulated by the Financial Conduct Authority. 7
2. MANAGER’S COMMENTS We recently attended an energy conference in Scotland, attended mainly by US listed energy companies, and
thought we would take this opportunity to share some of the key themes (predominantly North American
focused) that emerged.
Coming off life support as efficiency gains come through…
As one would expect, the US oil patch is working vigorously to adapt as best it can to the current $40-50/bl oil
price environment. The service companies appear to be finding it harder to cope than the exploration &
production companies, with many still taking contracts at zero EBITDA margins. All found the freefall of oil prices
in 2015 to be a truly difficult experience, and whilst the current oil price still sits below $50/bbl, it at least buys
the E&P companies some breathing space versus the sub $40/bbl conditions experienced earlier in the year.
… meaning that one can now do what two used to do
It appears that “900 is the new 2,000” as fewer drilling rigs will be required to deliver oil production growth from
US unconventionals. The key factor driving production growth will be the amount (volume) and quality of
fractured unconventional reservoir. With each rig drilling more wells, each well accessing more reservoir and
each section of reservoir being fracced better, the rig count will increasingly become a redundant metric.
According to Southwestern, four to six gas drilling rigs are achieving what 16 were achieving three years ago.
This represents a shift in the cost base, with less capex going to land rig operators and more to the
completion/pressure pumping operators. And for land drillers, with land drilling rig utilisation at around 35%, it
will be some time yet before pricing improves. The exploration and production companies will be befitting from
this for a while and the better quality, better integrated service companies (like our portfolio holdings
Halliburton and Schlumberger) will likely gain market share.
With efficiency gains developing, there is limited clarity on threshold economics
Core North American unconventionals are now at the lower end of the non-OPEC cost curve as efficiency gains
are making the sweet spots of some oil plays comfortably economic at as low as $40/bl WTI. A number of the
exploration and production companies now suggest that we will now see ‘lower for a bit longer’ oil prices as a
result but the service companies just cannot see enough activity being carried out, at current prices, to allow
growth from the US oil patch. We were reminded by one service company that for all the talk of better
efficiencies, US onshore oil production is declining 70-80,000 b/day month on month at current oil prices.
Instead, we see US onshore oil growing again at prices of somewhere between $50/bl and $70/bl.
STACK/SCOOP play earning a place at the top table
Whilst the Permian basin remains by far the largest attractor of capital in the US unconventional market, the
most talked about shifts in capital allocation were towards the STACK and SCOOP plays in Oklahoma. These
assets, particularly the STACK, have become Tier 1 assets, albeit that their overall scale is smaller than the big ‘3’
of the Permian, Eagleford and Bakken. It was pleasing to hear of these developments with respect to some of the
Guinness Energy Fund holdings in these plays (Devon Energy, Newfield Exploration, Apache and QEP Resources).
Natural gas market has quietly tightened although new supply potential is plentiful
There was very little discussion about the natural gas market but a greater consensus on pricing direction with
$3/mcf to $3.50/mcf as the likely bounds. Above $3.50/mcf, coal fire power generation will start to retake
market share while below $3/mcf will lead to increased domestic and export (via LNG and pipe) demand plus
production declines outside Appalachia.
The Guinness Global Energy Report September 2016
Guinness Global Energy Fund guinnessfunds.com
The value of investments and the income from them can go down as well as up. Guinness Asset Management is authorised and regulated by the Financial Conduct Authority. 8
Not so easy for all regions although there were some pockets of improvement
Whilst we heard plenty about developments in the US unconventional space, we must remind ourselves that we
are talking about improvements in a segment of the market that delivers 3-4m b/day of oil into a world market
of 96m b/day. It was noticeable that offshore construction and drilling companies continue to face extremely
challenging markets, with offshore rig contract terminations expected to continue into 2017. There has been
some speculation that new deepwater rigs would be ordered in the next few months: Noble Corporation
responded that they “were not likely even to build a rowing boat” in current conditions, such is the level of
vessel oversupply at present. We were also reminded of the effects of low exploration activity, with 2015 being
the poorest year for oil exploration success since 1947.
Elsewhere internationally, sustained high levels of activity were reported by service companies in the Middle
East (and Saudi Arabia especially), whilst the most challenging onshore environment was deemed to be Latin
America, perhaps with the exception of Argentina.
What did we conclude?
The efficiency gains and cost control that we heard about from exploration and production companies in North
America, and elsewhere, will improve the margins and returns of the sector. This is clearly a positive, since
history shows that the combination of cost control, efficiency gains and improved use of capital all allow for
higher ROCE and therefore better valuations (especially reflected through higher price/book valuations which
correlate with ROACE).
On our current estimates, we see the Majors and large/mid cap E&P companies delivering ROACE of less than 1%
in 2016 (at $40/bl) and only 6% in 2017 (at $65/bl). These returns are around half the 10-yr average level for the
companies, so we are left with reasonable hope that either oil prices will be higher or cost control and
efficiencies will be better; or maybe there will be a combination of the two.
The Guinness Global Energy Report September 2016
Guinness Global Energy Fund guinnessfunds.com
The value of investments and the income from them can go down as well as up. Guinness Asset Management is authorised and regulated by the Financial Conduct Authority. 9
3. PERFORMANCE Guinness Global Energy Fund
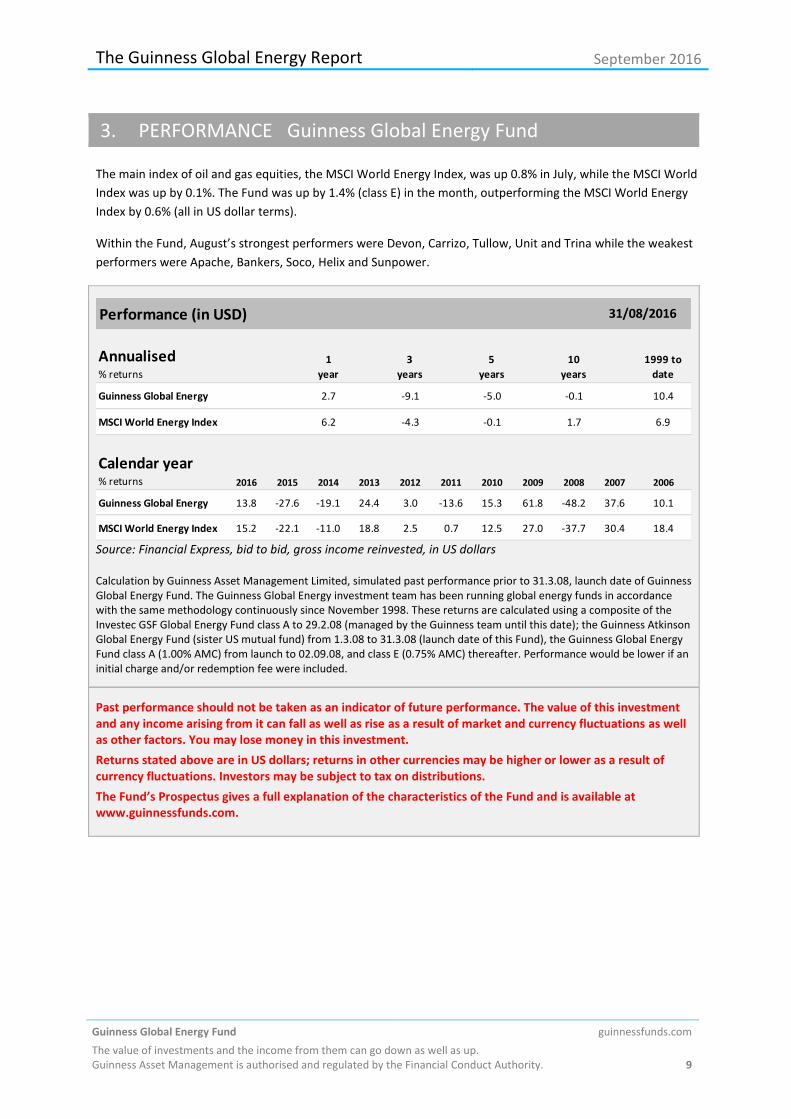
The main index of oil and gas equities, the MSCI World Energy Index, was up 0.8% in July, while the MSCI World
Index was up by 0.1%. The Fund was up by 1.4% (class E) in the month, outperforming the MSCI World Energy
Index by 0.6% (all in US dollar terms).
Within the Fund, August’s strongest performers were Devon, Carrizo, Tullow, Unit and Trina while the weakest
performers were Apache, Bankers, Soco, Helix and Sunpower.
Performance (in USD)
Annualised % returns
1
year
3
years
5
years
10
years
1999 to
date
Guinness Global Energy 2.7 -9.1 -5.0 -0.1 10.4
MSCI World Energy Index 6.2 -4.3 -0.1 1.7 6.9
Calendar year % returns 2016 2015 2014 2013 2012 2011 2010 2009 2008 2007 2006
Guinness Global Energy 13.8 -27.6 -19.1 24.4 3.0 -13.6 15.3 61.8 -48.2 37.6 10.1
MSCI World Energy Index 15.2 -22.1 -11.0 18.8 2.5 0.7 12.5 27.0 -37.7 30.4 18.4
31/08/2016
Source: Financial Express, bid to bid, gross income reinvested, in US dollars Calculation by Guinness Asset Management Limited, simulated past performance prior to 31.3.08, launch date of Guinness Global Energy Fund. The Guinness Global Energy investment team has been running global energy funds in accordance with the same methodology continuously since November 1998. These returns are calculated using a composite of the Investec GSF Global Energy Fund class A to 29.2.08 (managed by the Guinness team until this date); the Guinness Atkinson Global Energy Fund (sister US mutual fund) from 1.3.08 to 31.3.08 (launch date of this Fund), the Guinness Global Energy Fund class A (1.00% AMC) from launch to 02.09.08, and class E (0.75% AMC) thereafter. Performance would be lower if an initial charge and/or redemption fee were included.
Past performance should not be taken as an indicator of future performance. The value of this investment and any income arising from it can fall as well as rise as a result of market and currency fluctuations as well as other factors. You may lose money in this investment.
Returns stated above are in US dollars; returns in other currencies may be higher or lower as a result of currency fluctuations. Investors may be subject to tax on distributions.
The Fund’s Prospectus gives a full explanation of the characteristics of the Fund and is available at www.guinnessfunds.com.
The Guinness Global Energy Report September 2016
Guinness Global Energy Fund guinnessfunds.com
The value of investments and the income from them can go down as well as up. Guinness Asset Management is authorised and regulated by the Financial Conduct Authority. 10
4. PORTFOLIO Guinness Global Energy Fund
Buys/Sells
In August we made no switches in the fund.
Sector Breakdown
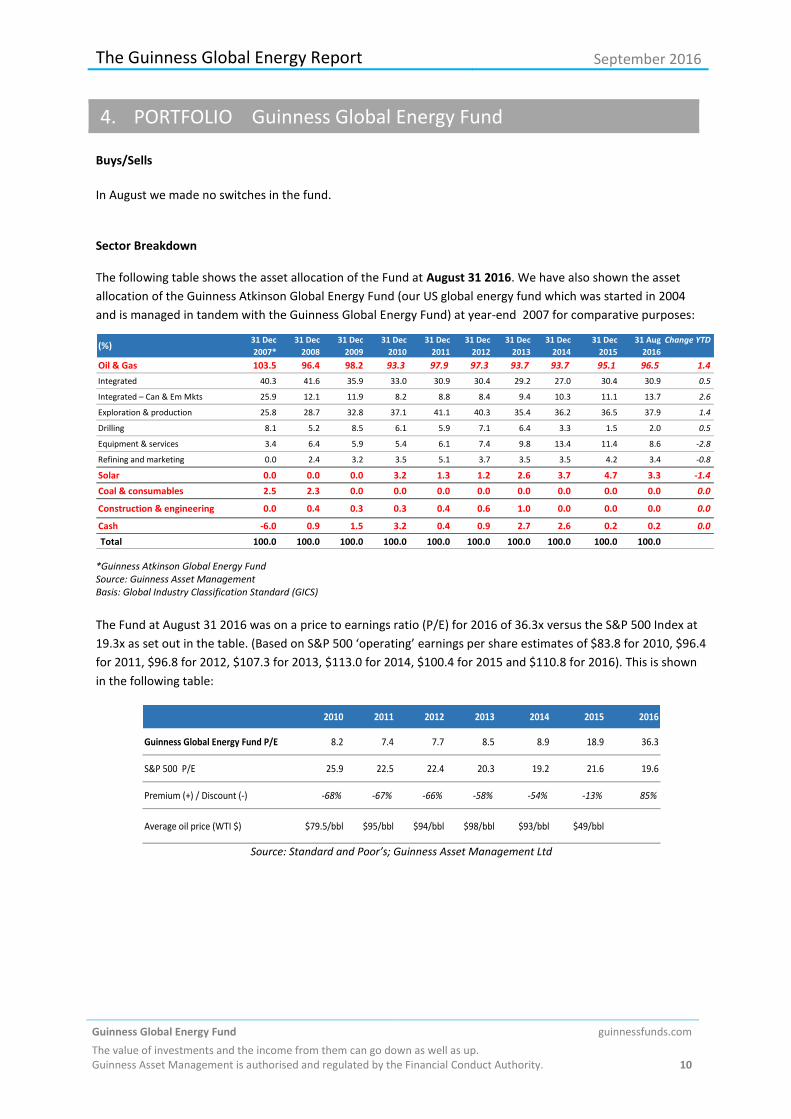
The following table shows the asset allocation of the Fund at August 31 2016. We have also shown the asset
allocation of the Guinness Atkinson Global Energy Fund (our US global energy fund which was started in 2004
and is managed in tandem with the Guinness Global Energy Fund) at year-end 2007 for comparative purposes:
(%)31 Dec
2007*
31 Dec
2008
31 Dec
2009
31 Dec
2010
31 Dec
2011
31 Dec
2012
31 Dec
2013
31 Dec
2014
31 Dec
2015
31 Aug
2016
Change YTD
Oil & Gas 103.5 96.4 98.2 93.3 97.9 97.3 93.7 93.7 95.1 96.5 1.4
Integrated 40.3 41.6 35.9 33.0 30.9 30.4 29.2 27.0 30.4 30.9 0.5
Integrated – Can & Em Mkts 25.9 12.1 11.9 8.2 8.8 8.4 9.4 10.3 11.1 13.7 2.6
Exploration & production 25.8 28.7 32.8 37.1 41.1 40.3 35.4 36.2 36.5 37.9 1.4
Drilling 8.1 5.2 8.5 6.1 5.9 7.1 6.4 3.3 1.5 2.0 0.5
Equipment & services 3.4 6.4 5.9 5.4 6.1 7.4 9.8 13.4 11.4 8.6 -2.8
Refining and marketing 0.0 2.4 3.2 3.5 5.1 3.7 3.5 3.5 4.2 3.4 -0.8
Solar 0.0 0.0 0.0 3.2 1.3 1.2 2.6 3.7 4.7 3.3 -1.4
Coal & consumables 2.5 2.3 0.0 0.0 0.0 0.0 0.0 0.0 0.0 0.0 0.0
Construction & engineering 0.0 0.4 0.3 0.3 0.4 0.6 1.0 0.0 0.0 0.0 0.0
Cash -6.0 0.9 1.5 3.2 0.4 0.9 2.7 2.6 0.2 0.2 0.0
Total 100.0 100.0 100.0 100.0 100.0 100.0 100.0 100.0 100.0 100.0
*Guinness Atkinson Global Energy Fund Source: Guinness Asset Management Basis: Global Industry Classification Standard (GICS)
The Fund at August 31 2016 was on a price to earnings ratio (P/E) for 2016 of 36.3x versus the S&P 500 Index at
19.3x as set out in the table. (Based on S&P 500 ‘operating’ earnings per share estimates of $83.8 for 2010, $96.4
for 2011, $96.8 for 2012, $107.3 for 2013, $113.0 for 2014, $100.4 for 2015 and $110.8 for 2016). This is shown
in the following table:
2010 2011 2012 2013 2014 2015 2016
Guinness Global Energy Fund P/E 8.2 7.4 7.7 8.5 8.9 18.9 36.3
S&P 500 P/E 25.9 22.5 22.4 20.3 19.2 21.6 19.6
Premium (+) / Discount (-) -68% -67% -66% -58% -54% -13% 85%
Average oil price (WTI $) $79.5/bbl $95/bbl $94/bbl $98/bbl $93/bbl $49/bbl
Source: Standard and Poor’s; Guinness Asset Management Ltd
The Guinness Global Energy Report September 2016
Guinness Global Energy Fund guinnessfunds.com
The value of investments and the income from them can go down as well as up. Guinness Asset Management is authorised and regulated by the Financial Conduct Authority. 11
Portfolio holdings
Our integrated and similar stock exposure (c.44%) is comprised of a mix of mid cap, mid/large cap and large cap
stocks. Our five large caps are Exxon, Chevron, BP, Royal Dutch Shell and Total. Mid/large and mid-caps are ENI,
Statoil, Hess and OMV. At August 31 2016 the median P/E ratios of this group were 19.3x/32.2x 2015/2016
earnings. We also have two Canadian integrated holdings, Suncor and Imperial Oil. Both companies have
significant exposure to oil sands in addition to downstream assets.
Our exploration and production holdings (c.38%) give us exposure most directly to rising oil and natural gas
prices. We include in this category non-integrated oil sands companies, as this is the GICS approach. The stock
here with oil sands exposure is Canadian Natural Resources. The pure E&P stocks have a bias towards the US
(Newfield, Devon, Carrizo and QEP Resources), with four other names (Apache, Occidental, ConocoPhillips,
Noble) having significant international production and two (Tullow and Bankers Petroleum) which are European
and African focused respectively. One of the key metrics behind a number of the E&P stocks held is low
enterprise value / proven reserves. Almost all of the US E&P stocks held also provide exposure to North
American natural gas.
We have exposure to four (pure) emerging market stocks in the main portfolio, though one is a half-position, and
in total represent 11% of the portfolio. Two are classified as integrateds (Gazprom and PetroChina) and two as
E&P companies (CNOOC and SOCO International). Gazprom is the Russian national oil and gas company which
produces approximately a quarter of the European Union gas demand and trades on 3.4x 2016 earnings.
PetroChina is one of the world’s largest integrated oil and gas companies and has significant growth potential
and, alongside CNOOC, enjoys advantages as a Chinese national champion. SOCO International is an E&P
company with production in Vietnam.
We have useful exposure to oil service stocks, which comprise around 10% of the portfolio. The stocks we own
are split between those which focus their activities in North America (land driller Unit Corp) and those which
operate in the US and internationally (Helix, Halliburton and Schlumberger).
Our independent refining exposure is currently in the US in Valero, the largest of the US refiners. Valero has a
reasonably large presence on the US Gulf Coast and is benefitting from the rise in US exports of refined products
seen in recent times.
Our alternative energy exposure is currently one position of the fund split equally between across three
companies: JA Solar, Trina Solar and Sunpower. JA Solar and Trina are both Chinese solar cell and module
manufacturers, whilst Sunpower is a more diversified US solar developer. We see them as well placed to benefit
from the expansion in the solar market we expect to continue for a number of years.
The Guinness Global Energy Report September 2016
Guinness Global Energy Fund guinnessfunds.com
The value of investments and the income from them can go down as well as up. Guinness Asset Management is authorised and regulated by the Financial Conduct Authority. 12
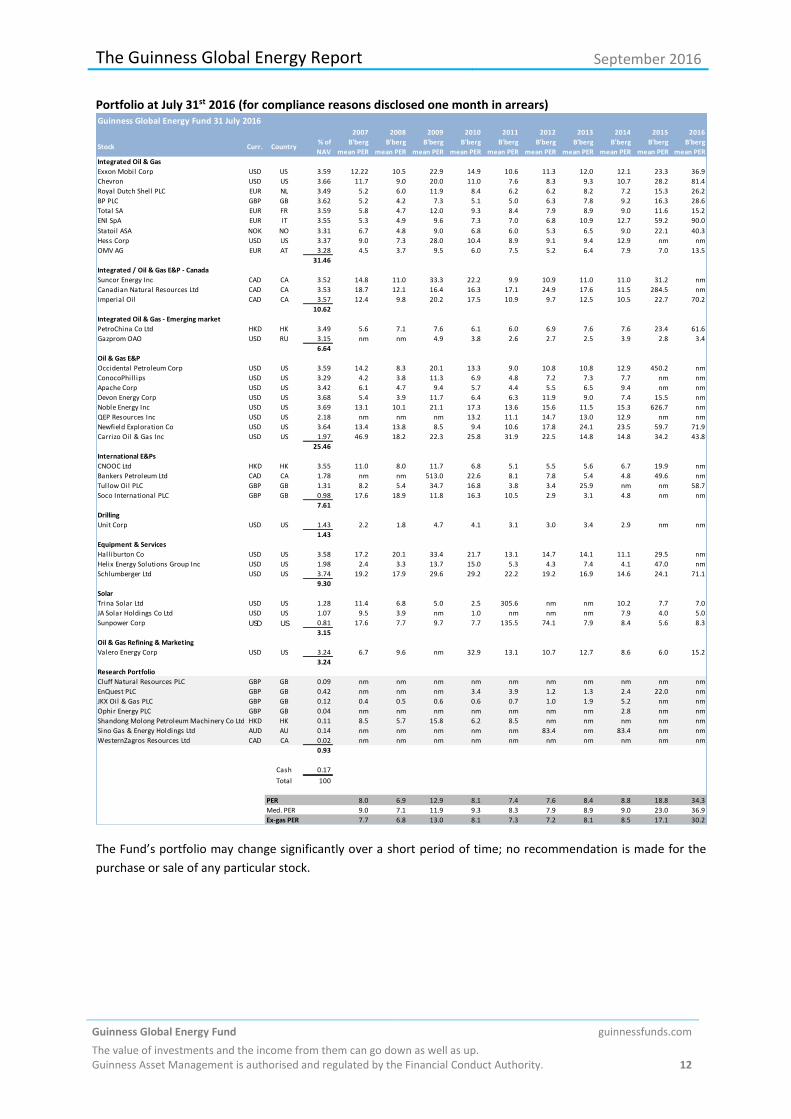
Portfolio at July 31st 2016 (for compliance reasons disclosed one month in arrears) Guinness Global Energy Fund 31 July 2016
2007 2008 2009 2010 2011 2012 2013 2014 2015 2016
Stock Curr. Country% of
NAV
B'berg
mean PER
B'berg
mean PER
B'berg
mean PER
B'berg
mean PER
B'berg
mean PER
B'berg
mean PER
B'berg
mean PER
B'berg
mean PER
B'berg
mean PER
B'berg
mean PER
Integrated Oil & Gas
Exxon Mobil Corp USD US 3.59 12.22 10.5 22.9 14.9 10.6 11.3 12.0 12.1 23.3 36.9
Chevron USD US 3.66 11.7 9.0 20.0 11.0 7.6 8.3 9.3 10.7 28.2 81.4
Royal Dutch Shell PLC EUR NL 3.49 5.2 6.0 11.9 8.4 6.2 6.2 8.2 7.2 15.3 26.2
BP PLC GBP GB 3.62 5.2 4.2 7.3 5.1 5.0 6.3 7.8 9.2 16.3 28.6
Total SA EUR FR 3.59 5.8 4.7 12.0 9.3 8.4 7.9 8.9 9.0 11.6 15.2
ENI SpA EUR IT 3.55 5.3 4.9 9.6 7.3 7.0 6.8 10.9 12.7 59.2 90.0
Statoil ASA NOK NO 3.31 6.7 4.8 9.0 6.8 6.0 5.3 6.5 9.0 22.1 40.3
Hess Corp USD US 3.37 9.0 7.3 28.0 10.4 8.9 9.1 9.4 12.9 nm nm
OMV AG EUR AT 3.28 4.5 3.7 9.5 6.0 7.5 5.2 6.4 7.9 7.0 13.5
31.46
Integrated / Oil & Gas E&P - Canada
Suncor Energy Inc CAD CA 3.52 14.8 11.0 33.3 22.2 9.9 10.9 11.0 11.0 31.2 nm
Canadian Natural Resources Ltd CAD CA 3.53 18.7 12.1 16.4 16.3 17.1 24.9 17.6 11.5 284.5 nm
Imperial Oil CAD CA 3.57 12.4 9.8 20.2 17.5 10.9 9.7 12.5 10.5 22.7 70.2
10.62
Integrated Oil & Gas - Emerging market
PetroChina Co Ltd HKD HK 3.49 5.6 7.1 7.6 6.1 6.0 6.9 7.6 7.6 23.4 61.6
Gazprom OAO USD RU 3.15 nm nm 4.9 3.8 2.6 2.7 2.5 3.9 2.8 3.4
6.64
Oil & Gas E&P
Occidental Petroleum Corp USD US 3.59 14.2 8.3 20.1 13.3 9.0 10.8 10.8 12.9 450.2 nm
ConocoPhill ips USD US 3.29 4.2 3.8 11.3 6.9 4.8 7.2 7.3 7.7 nm nm
Apache Corp USD US 3.42 6.1 4.7 9.4 5.7 4.4 5.5 6.5 9.4 nm nm
Devon Energy Corp USD US 3.68 5.4 3.9 11.7 6.4 6.3 11.9 9.0 7.4 15.5 nm
Noble Energy Inc USD US 3.69 13.1 10.1 21.1 17.3 13.6 15.6 11.5 15.3 626.7 nm
QEP Resources Inc USD US 2.18 nm nm nm 13.2 11.1 14.7 13.0 12.9 nm nm
Newfield Exploration Co USD US 3.64 13.4 13.8 8.5 9.4 10.6 17.8 24.1 23.5 59.7 71.9
Carrizo Oil & Gas Inc USD US 1.97 46.9 18.2 22.3 25.8 31.9 22.5 14.8 14.8 34.2 43.8
25.46
International E&Ps
CNOOC Ltd HKD HK 3.55 11.0 8.0 11.7 6.8 5.1 5.5 5.6 6.7 19.9 nm
Bankers Petroleum Ltd CAD CA 1.78 nm nm 513.0 22.6 8.1 7.8 5.4 4.8 49.6 nm
Tullow Oil PLC GBP GB 1.31 8.2 5.4 34.7 16.8 3.8 3.4 25.9 nm nm 58.7
Soco International PLC GBP GB 0.98 17.6 18.9 11.8 16.3 10.5 2.9 3.1 4.8 nm nm
7.61
Drilling
Unit Corp USD US 1.43 2.2 1.8 4.7 4.1 3.1 3.0 3.4 2.9 nm nm
1.43
Equipment & Services
Halliburton Co USD US 3.58 17.2 20.1 33.4 21.7 13.1 14.7 14.1 11.1 29.5 nm
Helix Energy Solutions Group Inc USD US 1.98 2.4 3.3 13.7 15.0 5.3 4.3 7.4 4.1 47.0 nm
Schlumberger Ltd USD US 3.74 19.2 17.9 29.6 29.2 22.2 19.2 16.9 14.6 24.1 71.1
9.30
Solar
Trina Solar Ltd USD US 1.28 11.4 6.8 5.0 2.5 305.6 nm nm 10.2 7.7 7.0
JA Solar Holdings Co Ltd USD US 1.07 9.5 3.9 nm 1.0 nm nm nm 7.9 4.0 5.0
Sunpower Corp USD US 0.81 17.6 7.7 9.7 7.7 135.5 74.1 7.9 8.4 5.6 8.3
3.15
Oil & Gas Refining & Marketing
Valero Energy Corp USD US 3.24 6.7 9.6 nm 32.9 13.1 10.7 12.7 8.6 6.0 15.2
3.24
Research Portfolio
Cluff Natural Resources PLC GBP GB 0.09 nm nm nm nm nm nm nm nm nm nm
EnQuest PLC GBP GB 0.42 nm nm nm 3.4 3.9 1.2 1.3 2.4 22.0 nm
JKX Oil & Gas PLC GBP GB 0.12 0.4 0.5 0.6 0.6 0.7 1.0 1.9 5.2 nm nm
Ophir Energy PLC GBP GB 0.04 nm nm nm nm nm nm nm 2.8 nm nm
Shandong Molong Petroleum Machinery Co Ltd HKD HK 0.11 8.5 5.7 15.8 6.2 8.5 nm nm nm nm nm
Sino Gas & Energy Holdings Ltd AUD AU 0.14 nm nm nm nm nm 83.4 nm 83.4 nm nm
WesternZagros Resources Ltd CAD CA 0.02 nm nm nm nm nm nm nm nm nm nm
0.93
Cash 0.17
Total 100
PER 8.0 6.9 12.9 8.1 7.4 7.6 8.4 8.8 18.8 34.3
Med. PER 9.0 7.1 11.9 9.3 8.3 7.9 8.9 9.0 23.0 36.9
Ex-gas PER 7.7 6.8 13.0 8.1 7.3 7.2 8.1 8.5 17.1 30.2
The Fund’s portfolio may change significantly over a short period of time; no recommendation is made for the
purchase or sale of any particular stock.
The Guinness Global Energy Report September 2016
Guinness Global Energy Fund guinnessfunds.com
The value of investments and the income from them can go down as well as up. Guinness Asset Management is authorised and regulated by the Financial Conduct Authority. 13
5. OUTLOOK
i) Oil market
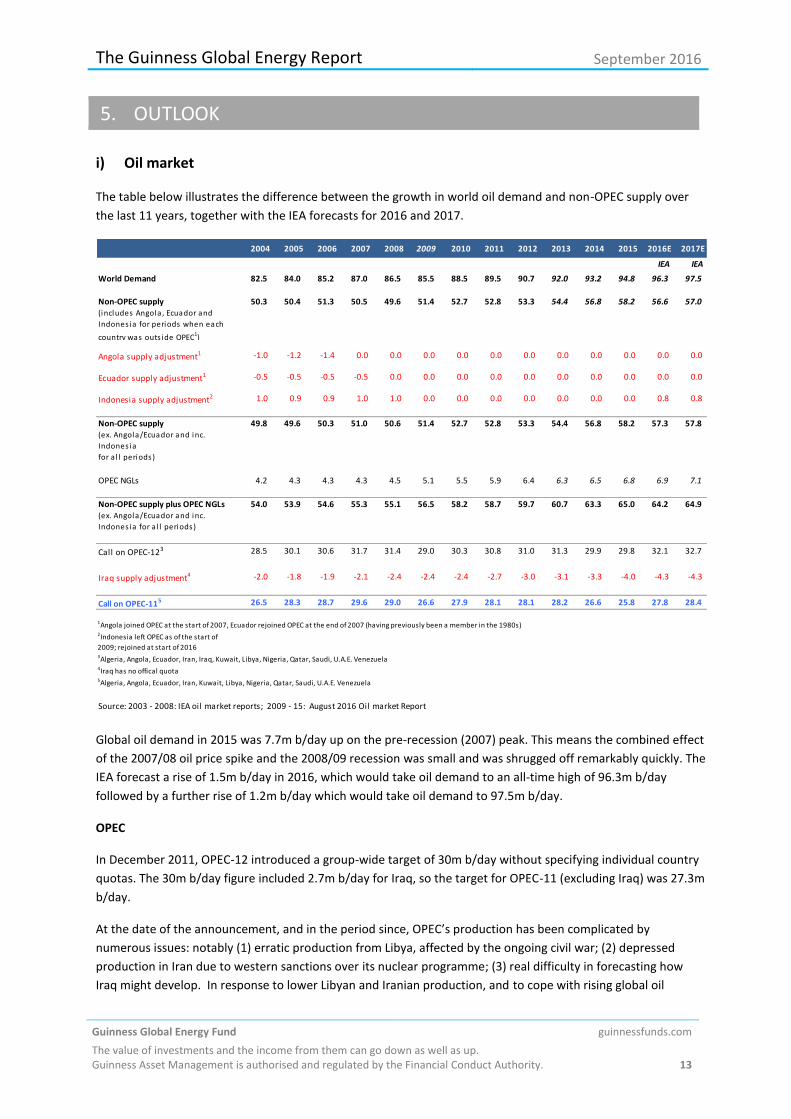
The table below illustrates the difference between the growth in world oil demand and non-OPEC supply over
the last 11 years, together with the IEA forecasts for 2016 and 2017.
2004 2005 2006 2007 2008 2009 2010 2011 2012 2013 2014 2015 2016E 2017E
IEA IEA
World Demand 82.5 84.0 85.2 87.0 86.5 85.5 88.5 89.5 90.7 92.0 93.2 94.8 96.3 97.5
Non-OPEC supply (includes Angola , Ecuador and
Indones ia for periods when each
country was outs ide OPEC1)
50.3 50.4 51.3 50.5 49.6 51.4 52.7 52.8 53.3 54.4 56.8 58.2 56.6 57.0
Angola supply adjustment1 -1.0 -1.2 -1.4 0.0 0.0 0.0 0.0 0.0 0.0 0.0 0.0 0.0 0.0 0.0
Ecuador supply adjustment1 -0.5 -0.5 -0.5 -0.5 0.0 0.0 0.0 0.0 0.0 0.0 0.0 0.0 0.0 0.0
Indonesia supply adjustment2 1.0 0.9 0.9 1.0 1.0 0.0 0.0 0.0 0.0 0.0 0.0 0.0 0.8 0.8
Non-OPEC supply (ex. Angola/Ecuador and inc.
Indones ia
for a l l periods)
49.8 49.6 50.3 51.0 50.6 51.4 52.7 52.8 53.3 54.4 56.8 58.2 57.3 57.8
OPEC NGLs 4.2 4.3 4.3 4.3 4.5 5.1 5.5 5.9 6.4 6.3 6.5 6.8 6.9 7.1
Non-OPEC supply plus OPEC NGLs(ex. Angola/Ecuador and inc.
Indones ia for a l l periods)
54.0 53.9 54.6 55.3 55.1 56.5 58.2 58.7 59.7 60.7 63.3 65.0 64.2 64.9
Call on OPEC-123 28.5 30.1 30.6 31.7 31.4 29.0 30.3 30.8 31.0 31.3 29.9 29.8 32.1 32.7
Iraq supply adjustment4 -2.0 -1.8 -1.9 -2.1 -2.4 -2.4 -2.4 -2.7 -3.0 -3.1 -3.3 -4.0 -4.3 -4.3
Call on OPEC-115 26.5 28.3 28.7 29.6 29.0 26.6 27.9 28.1 28.1 28.2 26.6 25.8 27.8 28.4
1Angola joined OPEC at the start of 2007, Ecuador rejoined OPEC at the end of 2007 (having previously been a member in the 1980s)2Indonesia left OPEC as of the start of
2009; rejoined at start of 20163Algeria, Angola, Ecuador, Iran, Iraq, Kuwait, Libya, Nigeria, Qatar, Saudi, U.A.E. Venezuela4Iraq has no offical quota5Algeria, Angola, Ecuador, Iran, Kuwait, Libya, Nigeria, Qatar, Saudi, U.A.E. Venezuela
Source: 2003 - 2008: IEA oil market reports; 2009 - 15: August 2016 Oil market Report Global oil demand in 2015 was 7.7m b/day up on the pre-recession (2007) peak. This means the combined effect
of the 2007/08 oil price spike and the 2008/09 recession was small and was shrugged off remarkably quickly. The
IEA forecast a rise of 1.5m b/day in 2016, which would take oil demand to an all-time high of 96.3m b/day
followed by a further rise of 1.2m b/day which would take oil demand to 97.5m b/day.
OPEC
In December 2011, OPEC-12 introduced a group-wide target of 30m b/day without specifying individual country
quotas. The 30m b/day figure included 2.7m b/day for Iraq, so the target for OPEC-11 (excluding Iraq) was 27.3m
b/day.
At the date of the announcement, and in the period since, OPEC’s production has been complicated by
numerous issues: notably (1) erratic production from Libya, affected by the ongoing civil war; (2) depressed
production in Iran due to western sanctions over its nuclear programme; (3) real difficulty in forecasting how
Iraq might develop. In response to lower Libyan and Iranian production, and to cope with rising global oil
The Guinness Global Energy Report September 2016
Guinness Global Energy Fund guinnessfunds.com
The value of investments and the income from them can go down as well as up. Guinness Asset Management is authorised and regulated by the Financial Conduct Authority. 14
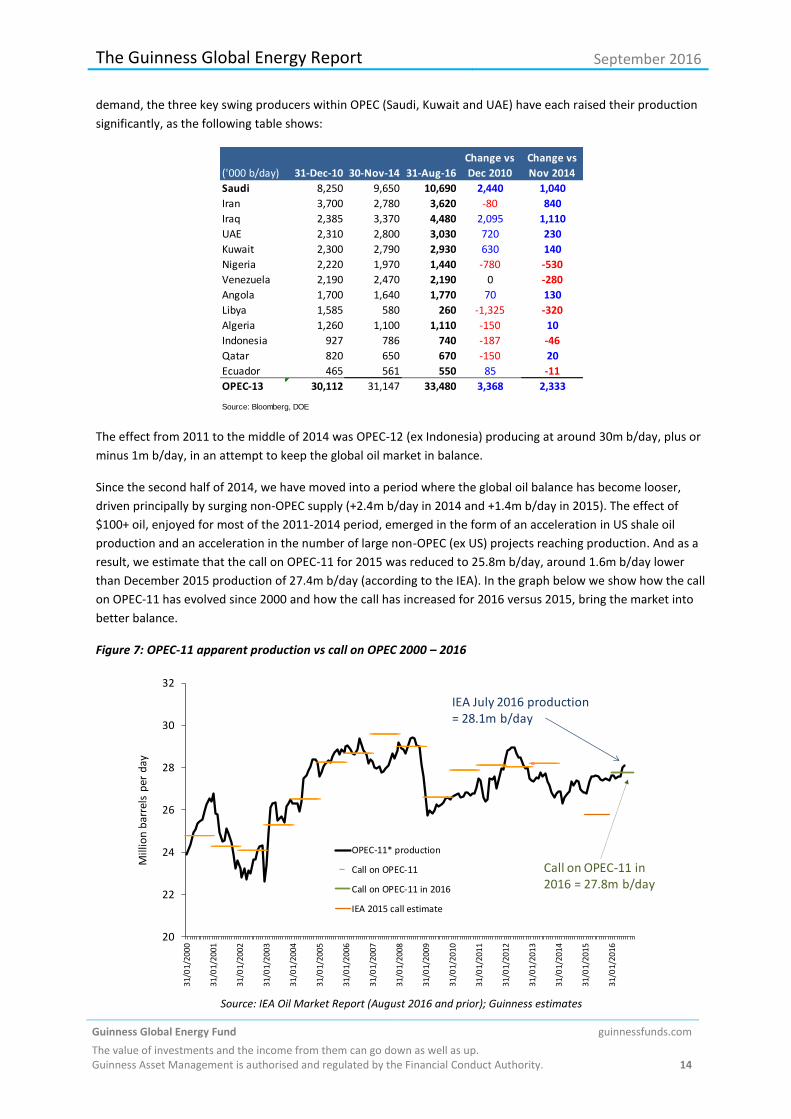
demand, the three key swing producers within OPEC (Saudi, Kuwait and UAE) have each raised their production
significantly, as the following table shows:
('000 b/day) 31-Dec-10 30-Nov-14 31-Aug-16
Change vs
Dec 2010
Change vs
Nov 2014
Saudi 8,250 9,650 10,690 2,440 1,040
Iran 3,700 2,780 3,620 -80 840
Iraq 2,385 3,370 4,480 2,095 1,110
UAE 2,310 2,800 3,030 720 230
Kuwait 2,300 2,790 2,930 630 140
Nigeria 2,220 1,970 1,440 -780 -530
Venezuela 2,190 2,470 2,190 0 -280
Angola 1,700 1,640 1,770 70 130
Libya 1,585 580 260 -1,325 -320
Algeria 1,260 1,100 1,110 -150 10
Indonesia 927 786 740 -187 -46
Qatar 820 650 670 -150 20
Ecuador 465 561 550 85 -11
OPEC-13 30,112 31,147 33,480 3,368 2,333
Source: Bloomberg, DOE
The effect from 2011 to the middle of 2014 was OPEC-12 (ex Indonesia) producing at around 30m b/day, plus or
minus 1m b/day, in an attempt to keep the global oil market in balance.
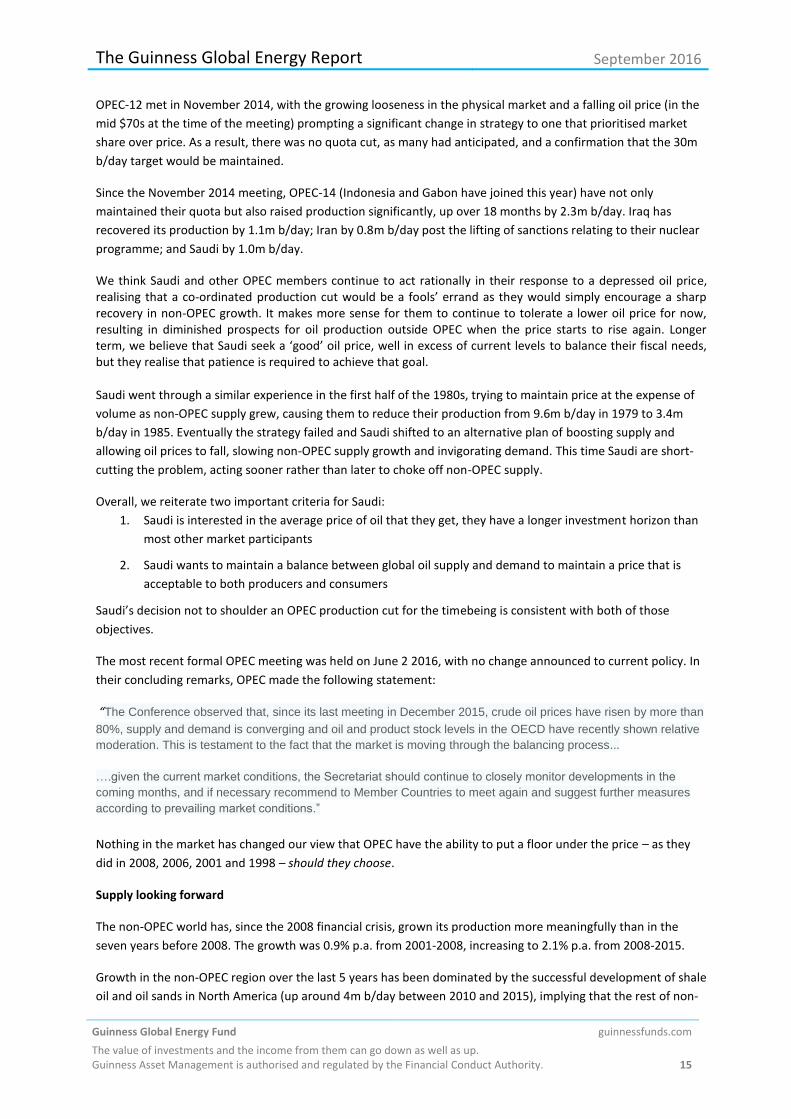
Since the second half of 2014, we have moved into a period where the global oil balance has become looser,
driven principally by surging non-OPEC supply (+2.4m b/day in 2014 and +1.4m b/day in 2015). The effect of
$100+ oil, enjoyed for most of the 2011-2014 period, emerged in the form of an acceleration in US shale oil
production and an acceleration in the number of large non-OPEC (ex US) projects reaching production. And as a
result, we estimate that the call on OPEC-11 for 2015 was reduced to 25.8m b/day, around 1.6m b/day lower
than December 2015 production of 27.4m b/day (according to the IEA). In the graph below we show how the call
on OPEC-11 has evolved since 2000 and how the call has increased for 2016 versus 2015, bring the market into
better balance.
Figure 7: OPEC-11 apparent production vs call on OPEC 2000 – 2016
20
22
24
26
28
30
32
31/0
1/20
00
31/0
1/20
01
31/0
1/20
02
31/0
1/20
03
31/0
1/20
04
31/0
1/20
05
31/0
1/20
06
31/0
1/20
07
31/0
1/20
08
31/0
1/20
09
31/0
1/20
10
31/0
1/20
11
31/0
1/20
12
31/0
1/20
13
31/0
1/20
14
31/0
1/20
15
31/0
1/20
16
Mill
ion
bar
rels
per
day
OPEC-11* production
Call on OPEC-11
Call on OPEC-11 in 2016
IEA 2015 call estimate
Call on OPEC-11 in 2016 = 27.8m b/day
IEA July 2016 production= 28.1m b/day
Source: IEA Oil Market Report (August 2016 and prior); Guinness estimates
The Guinness Global Energy Report September 2016
Guinness Global Energy Fund guinnessfunds.com
The value of investments and the income from them can go down as well as up. Guinness Asset Management is authorised and regulated by the Financial Conduct Authority. 15
OPEC-12 met in November 2014, with the growing looseness in the physical market and a falling oil price (in the
mid $70s at the time of the meeting) prompting a significant change in strategy to one that prioritised market
share over price. As a result, there was no quota cut, as many had anticipated, and a confirmation that the 30m
b/day target would be maintained.
Since the November 2014 meeting, OPEC-14 (Indonesia and Gabon have joined this year) have not only
maintained their quota but also raised production significantly, up over 18 months by 2.3m b/day. Iraq has
recovered its production by 1.1m b/day; Iran by 0.8m b/day post the lifting of sanctions relating to their nuclear
programme; and Saudi by 1.0m b/day.
We think Saudi and other OPEC members continue to act rationally in their response to a depressed oil price, realising that a co-ordinated production cut would be a fools’ errand as they would simply encourage a sharp recovery in non-OPEC growth. It makes more sense for them to continue to tolerate a lower oil price for now, resulting in diminished prospects for oil production outside OPEC when the price starts to rise again. Longer term, we believe that Saudi seek a ‘good’ oil price, well in excess of current levels to balance their fiscal needs, but they realise that patience is required to achieve that goal.
Saudi went through a similar experience in the first half of the 1980s, trying to maintain price at the expense of
volume as non-OPEC supply grew, causing them to reduce their production from 9.6m b/day in 1979 to 3.4m
b/day in 1985. Eventually the strategy failed and Saudi shifted to an alternative plan of boosting supply and
allowing oil prices to fall, slowing non-OPEC supply growth and invigorating demand. This time Saudi are short-
cutting the problem, acting sooner rather than later to choke off non-OPEC supply.
Overall, we reiterate two important criteria for Saudi:
1. Saudi is interested in the average price of oil that they get, they have a longer investment horizon than
most other market participants
2. Saudi wants to maintain a balance between global oil supply and demand to maintain a price that is
acceptable to both producers and consumers
Saudi’s decision not to shoulder an OPEC production cut for the timebeing is consistent with both of those
objectives.
The most recent formal OPEC meeting was held on June 2 2016, with no change announced to current policy. In
their concluding remarks, OPEC made the following statement:
“The Conference observed that, since its last meeting in December 2015, crude oil prices have risen by more than
80%, supply and demand is converging and oil and product stock levels in the OECD have recently shown relative
moderation. This is testament to the fact that the market is moving through the balancing process...
….given the current market conditions, the Secretariat should continue to closely monitor developments in the
coming months, and if necessary recommend to Member Countries to meet again and suggest further measures
according to prevailing market conditions.”
Nothing in the market has changed our view that OPEC have the ability to put a floor under the price – as they
did in 2008, 2006, 2001 and 1998 – should they choose.
Supply looking forward
The non-OPEC world has, since the 2008 financial crisis, grown its production more meaningfully than in the
seven years before 2008. The growth was 0.9% p.a. from 2001-2008, increasing to 2.1% p.a. from 2008-2015.
Growth in the non-OPEC region over the last 5 years has been dominated by the successful development of shale
oil and oil sands in North America (up around 4m b/day between 2010 and 2015), implying that the rest of non-
The Guinness Global Energy Report September 2016
Guinness Global Energy Fund guinnessfunds.com
The value of investments and the income from them can go down as well as up. Guinness Asset Management is authorised and regulated by the Financial Conduct Authority. 16
OPEC region grew by only around 0.5m b/day over the period, despite the sustained high oil price until mid
2014.
After the strongest year for non-OPEC production in 2014 (+2.4m b/day) since 1978, non-OPEC growth in 2015
was also strong, at 1.4m b/day. Whilst sub $60 oil environment has caused significant deferral and cancellation
of new developments, start-up projects that were sanctioned before the fall in the oil price are still coming to
completion, creating this resilience in production. However, the effect of sub $60 oil will impact more in 2016,
when non-OPEC supply is expected to fall by around 0.9m b/day. Based on current forecasts of higher oil prices
in 2017, the IEA has recently forecast that non-OPEC supply recovers by 0.2m b/day in 2017.
Looking further ahead to how global oil supply may evolve in the current oil price environment, we must
consider in particular increases in supply from three regions: North America, Iraq and Libya.
The growth in US shale oil production, in particular from the Bakken, Permian and Eagleford basins, raises the
question of how much more there is to come. New oil production from these sources amounts peaked in April
2015 at around 4m b/day and is now in decline. Our assessment is that US shale oil is a high cost source of oil but
one where growth is viable, on average, at $50-70 oil prices. In total, it could be comparable in size to the UK
North Sea, i.e. it could grow by around a further 3m b/day over the next five years, but only if the price is
sufficiently high to incentivise growth. The rate of development is heavily dependent on the cashflow available
to producing companies, which tends to be recycled immediately into new wells. Naturally, cashflows available
for reinvestment in a sub $50 world are far lower than in a $100+ world, so initially slowed the growth rate, then
sent production into month on month decline. Indeed, we note that production has declined since the peak by
over 1.0m b/day, as of June 2016.
As for Iraq, the questions of how big an increase is likely, in what timescale, and how other OPEC members react
are all important issues. Iraqi production was running at 4.5m b/day in August 2016 (according to Bloomberg),
up from 3.7m b/day at the start of 2015. However, unrest in the country, strained government finances and a
likely slowdown in investment from foreign partners does not fill us with confidence that significant growth
beyond here can easily be achieved.
With the recovery in Iranian production in 2016, the one country globally that still has the potential for a
meaningful rebound is Libya. At its peak, Libya was producing around 1.6m b/day, but civil war since 2012 has
reduced production to around 0.3-0.5m b/day for most of the last four years. If the country is able to re-open its
key export facilities (Es Sider, Zawiya, Ras Lanuf and Zuetina), we believe it possible for production to recover by
around 0.5m b/day, however any further gains are likely to be muted given the extent of above-ground damage
to oil infrastructure that has occurred.
Looking longer term, other opportunities to exploit unconventional oil likely exist internationally using
techniques established in the US, notably in Argentina (Vaca Muerta), Russia (Bazhenov), China (Tarim and
Sichuan) and Australia (Cooper). However, the US is far better understood geologically; the infrastructure in the
US is already in place; service capacity in the US is high; and the interests of the landowner are aligned in the US
with the E&P company. In most of the rest of the world, the reverse of each of these points is true, and as a
result we see international shale being 5-10 years behind North America.
Demand looking forward
The IEA reported that demand grew in 2015 by around 1.8m b/day, and expect 2016/2017 growth of 1.5m/1.2m
b/day. We see it as logical that demand growth in 2016 will be lower than 2015, since lower oil prices generally
stimulate one-off positive demand events. That said, demand growth of anything over 1m b/day in 2016, despite
The Guinness Global Energy Report September 2016
Guinness Global Energy Fund guinnessfunds.com
The value of investments and the income from them can go down as well as up. Guinness Asset Management is authorised and regulated by the Financial Conduct Authority. 17
weaker macro-economic factors, it would still represent above average growth when compared to the last 5
years.
The IEA’s global demand growth forecast for 2016 comprises an increase in non-OECD demand of 1.3m b/day
and a slight increase in OECD demand. The components of this non-OECD demand growth can be summarised as
follows:
Figure 8: Non-OECD oil demand
m b/day
2010 2011 2012 2013 2014 2015 2016e 2017e 2011 2012 2013 2014 2015 2016e 2017e
Asia 19.7 20.3 21.4 22.1 22.8 23.9 24.8 25.6 0.6 1.1 0.7 0.7 1.1 0.9 0.8
Middle East 7.3 7.4 7.8 7.9 8 8.3 8.3 8.5 0.1 0.4 0.1 0.1 0.3 0 0.2
Latin America 6 6.2 6.4 6.7 6.8 6.7 6.7 6.7 0.2 0.2 0.3 0.1 -0.1 0 0
FSU 4.1 4.4 4.6 4.7 4.9 4.9 5.0 5.1 0.3 0.2 0.1 0.2 0 0.1 0.1
Africa 3.5 3.5 3.8 3.9 4.0 4.1 4.2 4.4 0 0.3 0.1 0.1 0.1 0.1 0.2
Europe 0.7 0.7 0.7 0.7 0.7 0.7 0.7 0.7 0 0 0 0 0 0 0
Total 41.3 42.5 44.7 46.0 47.2 48.6 49.7 51.0 1.2 2.2 1.3 1.2 1.4 1.1 1.3
Demand Growth
Source: IEA Oil Market Report (August 2016)
As can be seen, Asia has settled down into a steady pattern of growth since 2010, and accounts for the majority
of expected growth in 2016 and 2017. Historically, China has been the most important component of this
growth, but signs are emerging that India is likely to be the greatest contributor in 2016.
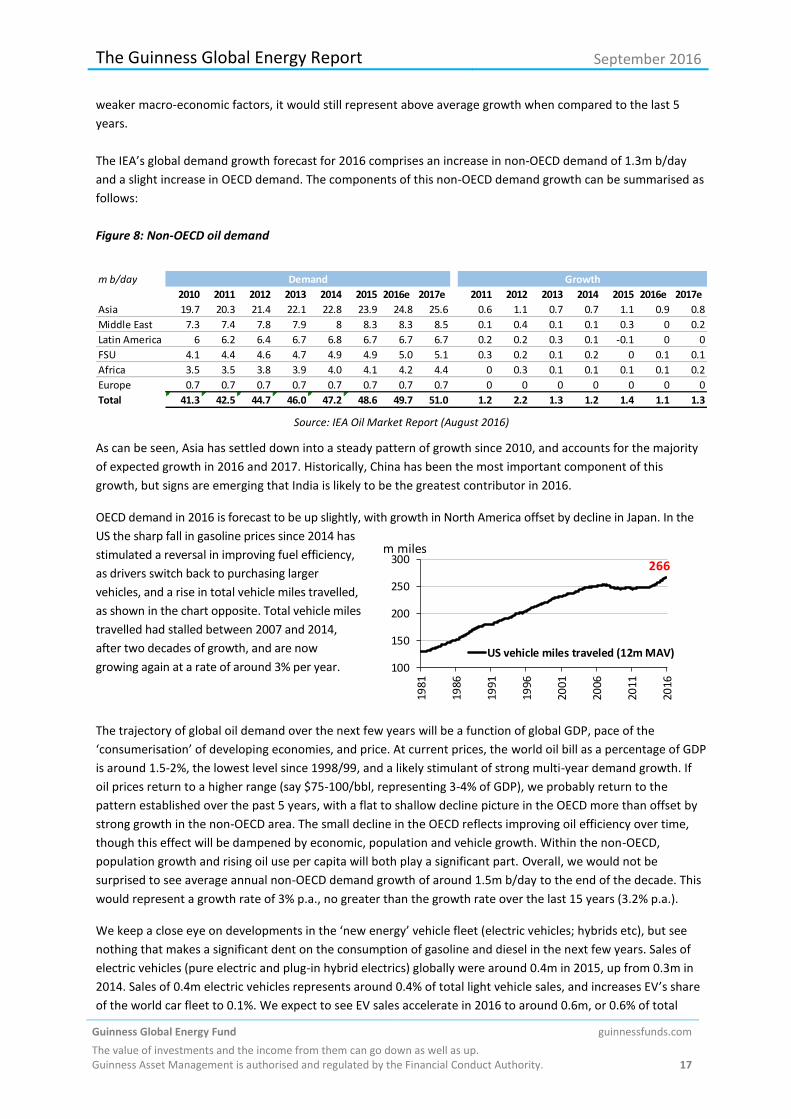
OECD demand in 2016 is forecast to be up slightly, with growth in North America offset by decline in Japan. In the
US the sharp fall in gasoline prices since 2014 has
stimulated a reversal in improving fuel efficiency,
as drivers switch back to purchasing larger
vehicles, and a rise in total vehicle miles travelled,
as shown in the chart opposite. Total vehicle miles
travelled had stalled between 2007 and 2014,
after two decades of growth, and are now
growing again at a rate of around 3% per year.
The trajectory of global oil demand over the next few years will be a function of global GDP, pace of the
‘consumerisation’ of developing economies, and price. At current prices, the world oil bill as a percentage of GDP
is around 1.5-2%, the lowest level since 1998/99, and a likely stimulant of strong multi-year demand growth. If
oil prices return to a higher range (say $75-100/bbl, representing 3-4% of GDP), we probably return to the
pattern established over the past 5 years, with a flat to shallow decline picture in the OECD more than offset by
strong growth in the non-OECD area. The small decline in the OECD reflects improving oil efficiency over time,
though this effect will be dampened by economic, population and vehicle growth. Within the non-OECD,
population growth and rising oil use per capita will both play a significant part. Overall, we would not be
surprised to see average annual non-OECD demand growth of around 1.5m b/day to the end of the decade. This
would represent a growth rate of 3% p.a., no greater than the growth rate over the last 15 years (3.2% p.a.).
We keep a close eye on developments in the ‘new energy’ vehicle fleet (electric vehicles; hybrids etc), but see
nothing that makes a significant dent on the consumption of gasoline and diesel in the next few years. Sales of
electric vehicles (pure electric and plug-in hybrid electrics) globally were around 0.4m in 2015, up from 0.3m in
2014. Sales of 0.4m electric vehicles represents around 0.4% of total light vehicle sales, and increases EV’s share
of the world car fleet to 0.1%. We expect to see EV sales accelerate in 2016 to around 0.6m, or 0.6% of total
266
100
150
200
250
300
1981
1986
1991
1996
2001
2006
2011
2016
US vehicle miles traveled (12m MAV)
m miles

The Guinness Global Energy Report September 2016
Guinness Global Energy Fund guinnessfunds.com
The value of investments and the income from them can go down as well as up. Guinness Asset Management is authorised and regulated by the Financial Conduct Authority. 18
global sales. Even applying an aggressive growth rate to EV sales, we see EVs comprising less than 1% of the
global car fleet in 2020.
Conclusions about oil
The table below summarises our view by showing our oil price forecasts for WTI and Brent in 2016 against their
historic levels, and rises/falls in percentage terms that we have seen in the period from 2002 to 2015.
Figure 9: Average WTI & Brent yearly prices, and changes
Oil price (inflation adjusted) Est
12 month MAV 1986-2001 2002 2003 2004 2005 2006 2007 2008 2009 2010 2011 2012 2013 2014 2015 2016
WTI 30 33 38 49 66 75 82 104 68 84 99 94 98 93 49 45
Brent 30 32 35 46 64 75 82 103 67 84 115 112 108 99 52 45
Brent/WTI (12m MAV) 30 33 37 48 65 75 82 104 68 84 107 103 103 96 51 45
Brent/WTI y-on-y change (%) 8% 12% 30% 37% 15% 9% 26% -35% 24% 27% -4% 0% -7% -47% -11%
Brent/WTI (5yr MAV) 30 25 32 37 42 51 61 75 79 82 89 93 93 99 92 80
We expect oil to trade in a $40-55 range in the near term. This is an unsupported level which may fluctuate
significantly. If this price range persists, we expect North American unconventional supply declines to decelerate
but continue.
In 2016/17 the likelihood is that the price will fluctuate quite widely but move on an upwards trajectory as
accelerating emerging country demand growth and US shale oil growth flattening slowly tightens the global oil
supply/ demand balance. The world oil bill at around $50 per barrel would represent 2% of 2015 Global GDP,
42% under the average of the 1970 – 2015 period (3.4%). A return to oil representing 3.4% of GDP implies an oil
price of around $85/barrel.
We believe that Saudi’s long-term objective remains to maintain a ‘good’ oil price, significantly higher than
current levels.
Natural gas market
US supply & demand: recent past
On the demand side, industrial gas demand and electricity gas demand, each about a third of total US gas demand,
are key. Commercial and residential demand, which make up the final third, have been fairly constant on average
over the last decade – although yearly fluctuations due to the coldness of winter weather can be marked.
Industrial demand (of which around 35% comes from petrochemicals) tends to trend up and down depending on
the strength of the economy, the level of the US dollar and the differential between US and international gas
prices. Between 2000 and 2009 industrial demand was in steady decline, falling from 22.2 Bcf/day to 16.9
Bcf/day. Since 2009 the lower gas price (particularly when compared to other global gas prices) and recovery
from recession has seen demand rebound, up in 2015 to around 21.2 Bcf/day.
Electricity gas demand (i.e. power generation) is affected by weather, in particular warm summers which drive
demand for air conditioning, but the underlying trend depends on GDP growth and the proportion of
incremental new power generation each year that goes to natural gas versus the alternatives of coal, nuclear
and renewables. Gas has been taking market share in this sector: in 2015, 33% of electricity generation was
powered by gas, up from 22% in 2007. The big loser here is coal which has consistently given up market share
over the past 10 years.
Total gas demand in 2015 (including Canadian and Mexican exports) was around 80.9 Bcf/day, up by 3.1 Bcf/day
(4.0%) vs 2014 and up 7.2 Bcf/day (10%) vs the 5 year average. The biggest change in 2015 vs 2014 is power
The Guinness Global Energy Report September 2016
Guinness Global Energy Fund guinnessfunds.com
The value of investments and the income from them can go down as well as up. Guinness Asset Management is authorised and regulated by the Financial Conduct Authority. 19
generation (+2.9 Bcf/day), with low prices causing an acceleration in coal to gas switching by the electric utility
sector. Exports of gas to Mexico (+0.7 Bcf/day) were also up strongly in 2015, as the network of gas pipelines
from Texas into Mexico expands.
Overall, whilst gas demand in the US has been strong over the past five years, it has been overshadowed by a
rise in onshore supply, pulling the gas price lower.
The supply side fundamentals for natural gas in the US are driven by 5 main moving parts: onshore and offshore
domestic production, net imports of gas from Canada, exports of gas to Mexico and imports of liquefied natural
gas (LNG). Of these, onshore supply is the biggest component, making up over 85% of total supply.
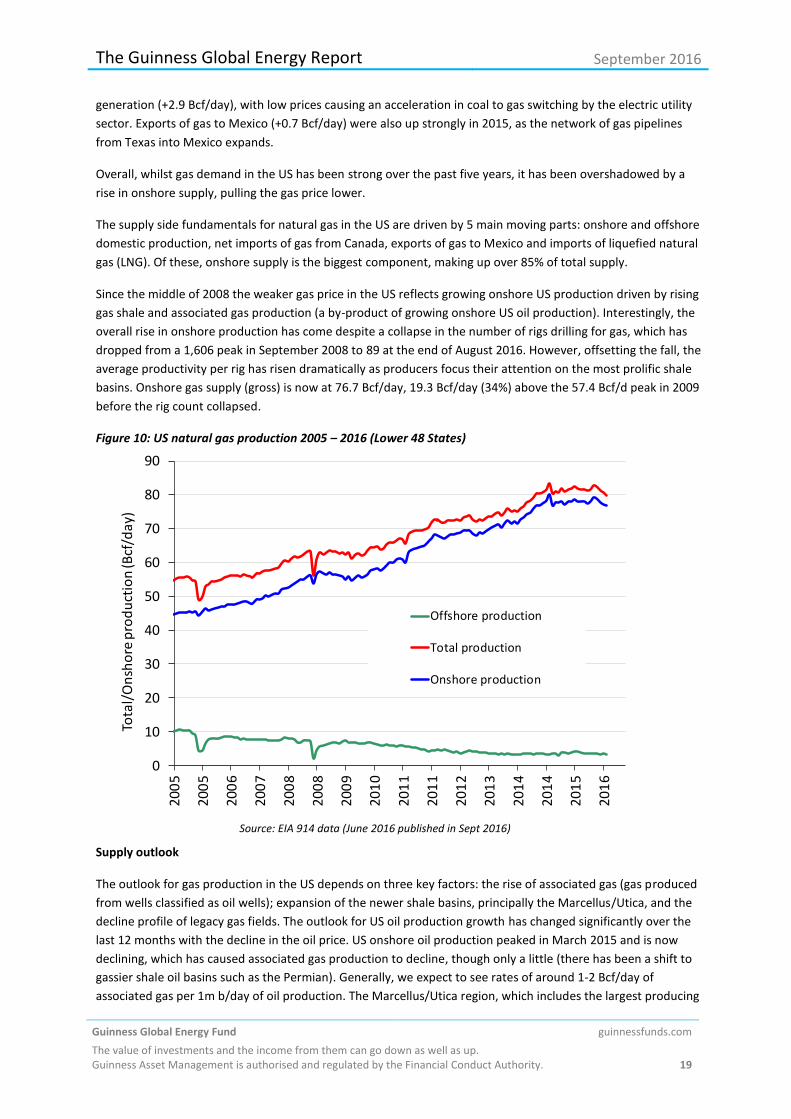
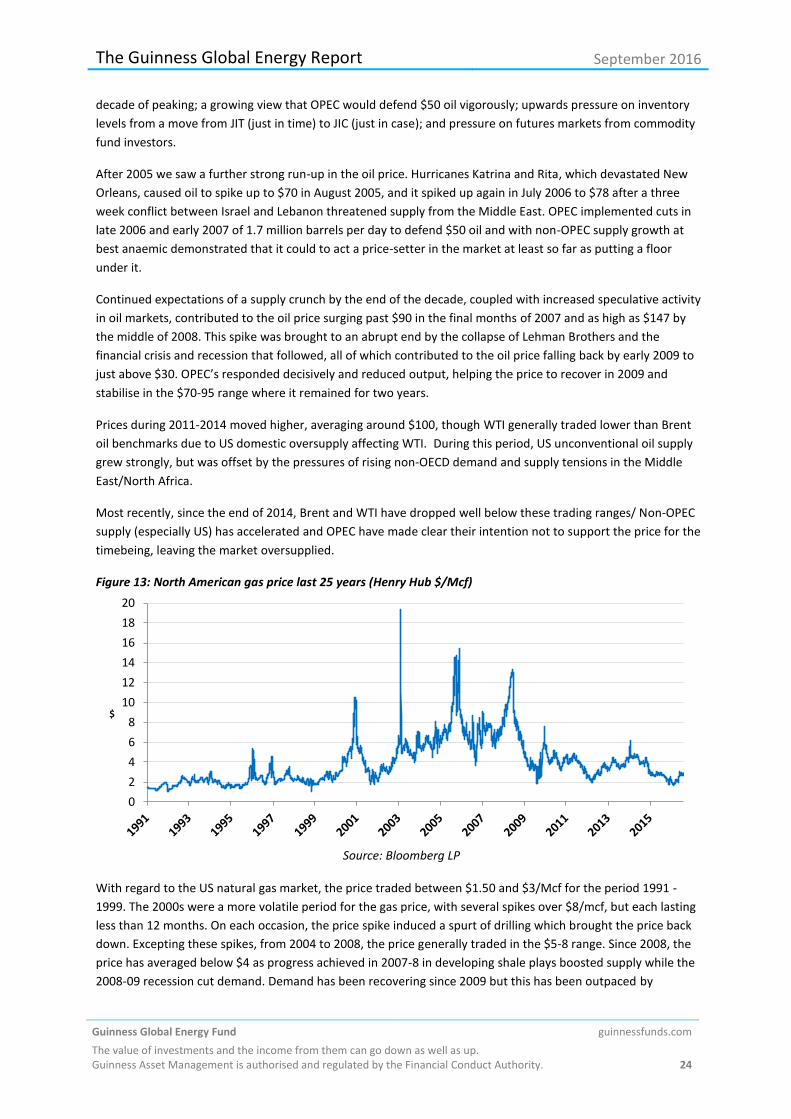
Since the middle of 2008 the weaker gas price in the US reflects growing onshore US production driven by rising
gas shale and associated gas production (a by-product of growing onshore US oil production). Interestingly, the
overall rise in onshore production has come despite a collapse in the number of rigs drilling for gas, which has
dropped from a 1,606 peak in September 2008 to 89 at the end of August 2016. However, offsetting the fall, the
average productivity per rig has risen dramatically as producers focus their attention on the most prolific shale
basins. Onshore gas supply (gross) is now at 76.7 Bcf/day, 19.3 Bcf/day (34%) above the 57.4 Bcf/d peak in 2009
before the rig count collapsed.
Figure 10: US natural gas production 2005 – 2016 (Lower 48 States)
0
10
20
30
40
50
60
70
80
90
20
05
20
05
20
06
20
07
20
08
20
08
20
09
20
10
20
11
20
11
20
12
20
13
20
14
20
14
20
15
20
16
Tota
l/O
nsh
ore
pro
du
ctio
n (B
cf/d
ay)
Offshore production
Total production
Onshore production
Source: EIA 914 data (June 2016 published in Sept 2016)
Supply outlook
The outlook for gas production in the US depends on three key factors: the rise of associated gas (gas produced
from wells classified as oil wells); expansion of the newer shale basins, principally the Marcellus/Utica, and the
decline profile of legacy gas fields. The outlook for US oil production growth has changed significantly over the
last 12 months with the decline in the oil price. US onshore oil production peaked in March 2015 and is now
declining, which has caused associated gas production to decline, though only a little (there has been a shift to
gassier shale oil basins such as the Permian). Generally, we expect to see rates of around 1-2 Bcf/day of
associated gas per 1m b/day of oil production. The Marcellus/Utica region, which includes the largest producing
The Guinness Global Energy Report September 2016
Guinness Global Energy Fund guinnessfunds.com
The value of investments and the income from them can go down as well as up. Guinness Asset Management is authorised and regulated by the Financial Conduct Authority. 20
gas field in the US and the surrounding region, reached production of around 17 Bcf/day in 2015. Further growth
is likely over the next couple of years, but only if local price differentials improve from the extreme levels seen in
recent months. Then there is an expected decline in legacy gas fields, particularly if the gas drilling rig count stays
low. Considering these factors together, we expect US onshore gas production growth to slow rapidly in 2016
(reaching around 0.4bcf/day) but see potential for a recovery in growth rates (to c.1-2 Bcf/day per annum for the
next two or three years), but only if the price remains in the $2.50-$3mcf range.
2009 2010 2011 2012 2013 2014 2015 2016 (est)
Onshore production - average (Bcf/day) 55.9 58.6 64.6 68.4 70.2 75.3 78.1 78.5
Change (Bcf/day) 0.9 2.7 5.9 3.9 1.8 5.1 2.8 0.4
Change (%) 1.7% 4.8% 10.1% 6.0% 2.6% 7.2% 3.7% 0.5%
Source: EIA; Guinness estimates
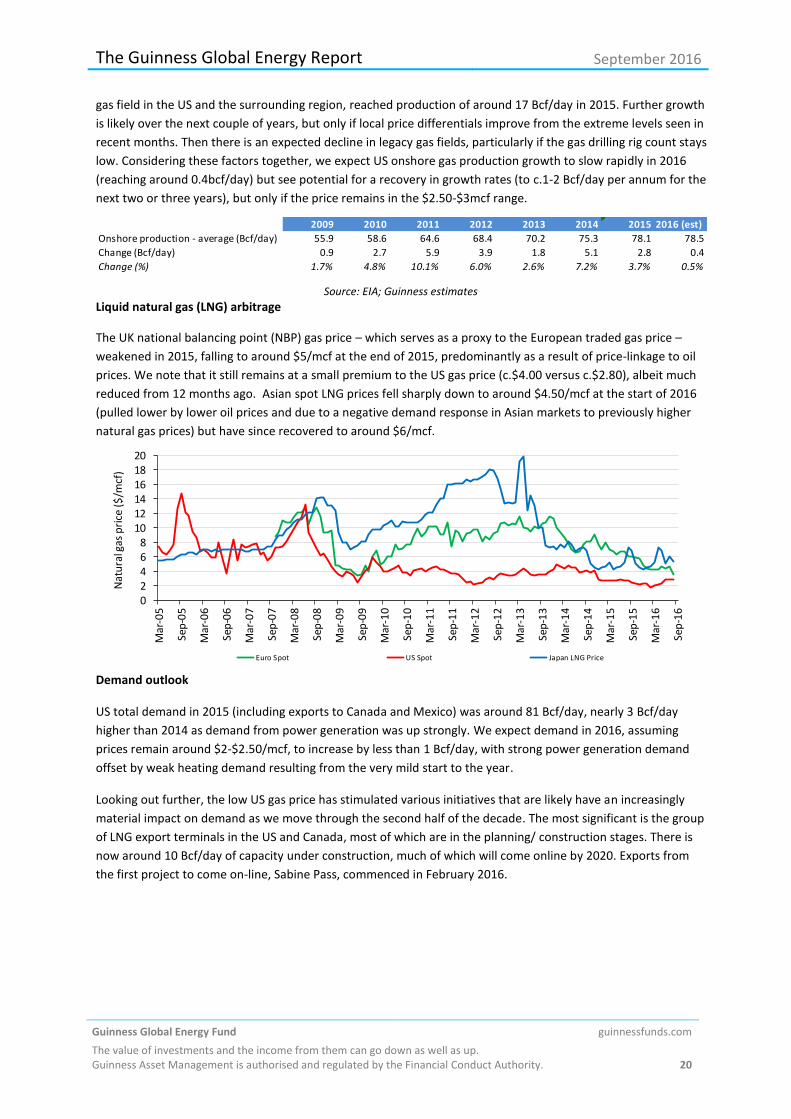
Liquid natural gas (LNG) arbitrage
The UK national balancing point (NBP) gas price – which serves as a proxy to the European traded gas price –
weakened in 2015, falling to around $5/mcf at the end of 2015, predominantly as a result of price-linkage to oil
prices. We note that it still remains at a small premium to the US gas price (c.$4.00 versus c.$2.80), albeit much
reduced from 12 months ago. Asian spot LNG prices fell sharply down to around $4.50/mcf at the start of 2016
(pulled lower by lower oil prices and due to a negative demand response in Asian markets to previously higher
natural gas prices) but have since recovered to around $6/mcf.
02468
101214161820
Mar
-05
Sep
-05
Mar
-06
Sep
-06
Mar
-07
Sep
-07
Mar
-08
Sep
-08
Mar
-09
Sep
-09
Mar
-10
Sep
-10
Mar
-11
Sep
-11
Mar
-12
Sep
-12
Mar
-13
Sep
-13
Mar
-14
Sep
-14
Mar
-15
Sep
-15
Mar
-16
Sep
-16
Nat
ura
l gas
pri
ce (
$/m
cf)
Euro Spot US Spot Japan LNG Price
Demand outlook
US total demand in 2015 (including exports to Canada and Mexico) was around 81 Bcf/day, nearly 3 Bcf/day
higher than 2014 as demand from power generation was up strongly. We expect demand in 2016, assuming
prices remain around $2-$2.50/mcf, to increase by less than 1 Bcf/day, with strong power generation demand
offset by weak heating demand resulting from the very mild start to the year.
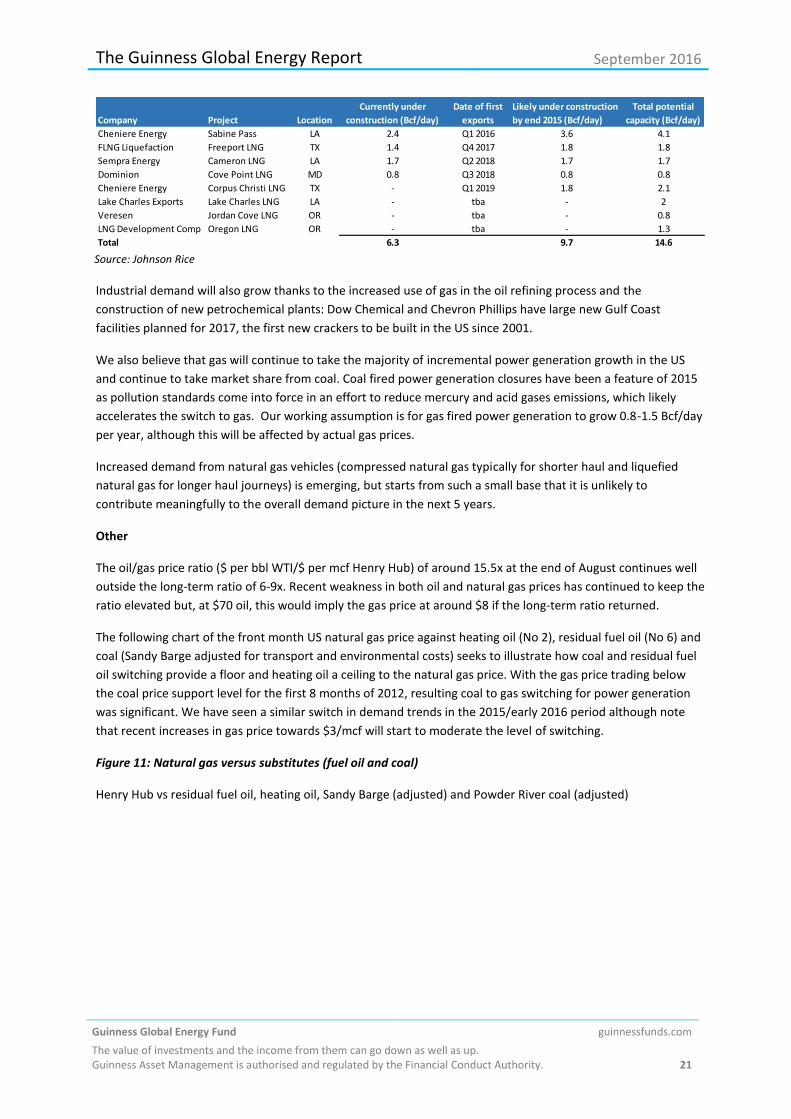
Looking out further, the low US gas price has stimulated various initiatives that are likely have an increasingly
material impact on demand as we move through the second half of the decade. The most significant is the group
of LNG export terminals in the US and Canada, most of which are in the planning/ construction stages. There is
now around 10 Bcf/day of capacity under construction, much of which will come online by 2020. Exports from
the first project to come on-line, Sabine Pass, commenced in February 2016.
The Guinness Global Energy Report September 2016
Guinness Global Energy Fund guinnessfunds.com
The value of investments and the income from them can go down as well as up. Guinness Asset Management is authorised and regulated by the Financial Conduct Authority. 21
Company Project Location
Currently under
construction (Bcf/day)
Date of first
exports
Likely under construction
by end 2015 (Bcf/day)
Total potential
capacity (Bcf/day)
Cheniere Energy Sabine Pass LA 2.4 Q1 2016 3.6 4.1
FLNG Liquefaction Freeport LNG TX 1.4 Q4 2017 1.8 1.8
Sempra Energy Cameron LNG LA 1.7 Q2 2018 1.7 1.7
Dominion Cove Point LNG MD 0.8 Q3 2018 0.8 0.8
Cheniere Energy Corpus Christi LNG TX - Q1 2019 1.8 2.1
Lake Charles Exports Lake Charles LNG LA - tba - 2
Veresen Jordan Cove LNG OR - tba - 0.8
LNG Development Comp Oregon LNG OR - tba - 1.3
Total 6.3 9.7 14.6 Source: Johnson Rice
Industrial demand will also grow thanks to the increased use of gas in the oil refining process and the
construction of new petrochemical plants: Dow Chemical and Chevron Phillips have large new Gulf Coast
facilities planned for 2017, the first new crackers to be built in the US since 2001.
We also believe that gas will continue to take the majority of incremental power generation growth in the US
and continue to take market share from coal. Coal fired power generation closures have been a feature of 2015
as pollution standards come into force in an effort to reduce mercury and acid gases emissions, which likely
accelerates the switch to gas. Our working assumption is for gas fired power generation to grow 0.8-1.5 Bcf/day
per year, although this will be affected by actual gas prices.
Increased demand from natural gas vehicles (compressed natural gas typically for shorter haul and liquefied
natural gas for longer haul journeys) is emerging, but starts from such a small base that it is unlikely to
contribute meaningfully to the overall demand picture in the next 5 years.
Other
The oil/gas price ratio ($ per bbl WTI/$ per mcf Henry Hub) of around 15.5x at the end of August continues well
outside the long-term ratio of 6-9x. Recent weakness in both oil and natural gas prices has continued to keep the
ratio elevated but, at $70 oil, this would imply the gas price at around $8 if the long-term ratio returned.
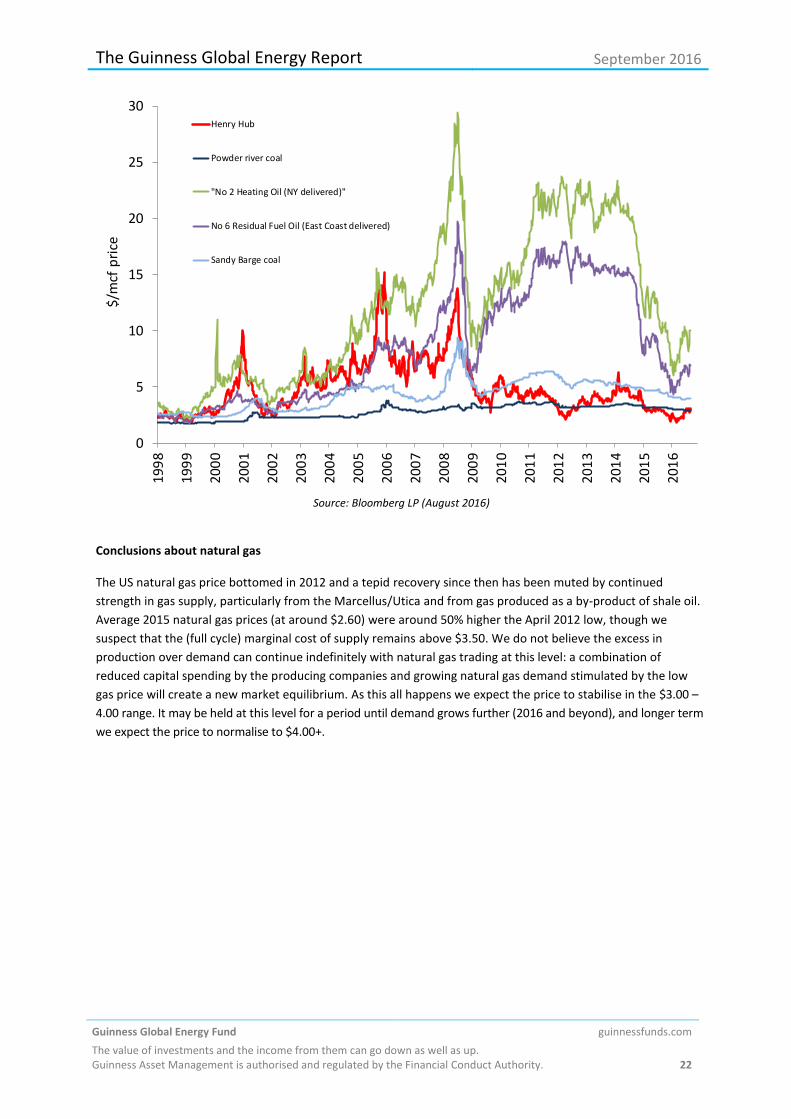
The following chart of the front month US natural gas price against heating oil (No 2), residual fuel oil (No 6) and
coal (Sandy Barge adjusted for transport and environmental costs) seeks to illustrate how coal and residual fuel
oil switching provide a floor and heating oil a ceiling to the natural gas price. With the gas price trading below
the coal price support level for the first 8 months of 2012, resulting coal to gas switching for power generation
was significant. We have seen a similar switch in demand trends in the 2015/early 2016 period although note
that recent increases in gas price towards $3/mcf will start to moderate the level of switching.
Figure 11: Natural gas versus substitutes (fuel oil and coal)
Henry Hub vs residual fuel oil, heating oil, Sandy Barge (adjusted) and Powder River coal (adjusted)
The Guinness Global Energy Report September 2016
Guinness Global Energy Fund guinnessfunds.com
The value of investments and the income from them can go down as well as up. Guinness Asset Management is authorised and regulated by the Financial Conduct Authority. 22
0
5
10
15
20
25
30
19
98
19
99
20
00
20
01
20
02
20
03
20
04
20
05
20
06
20
07
20
08
20
09
20
10
20
11
20
12
20
13
20
14
20
15
20
16
$/m
cf p
rice
Henry Hub
Powder river coal
"No 2 Heating Oil (NY delivered)"
No 6 Residual Fuel Oil (East Coast delivered)
Sandy Barge coal
Source: Bloomberg LP (August 2016)
Conclusions about natural gas
The US natural gas price bottomed in 2012 and a tepid recovery since then has been muted by continued
strength in gas supply, particularly from the Marcellus/Utica and from gas produced as a by-product of shale oil.
Average 2015 natural gas prices (at around $2.60) were around 50% higher the April 2012 low, though we
suspect that the (full cycle) marginal cost of supply remains above $3.50. We do not believe the excess in
production over demand can continue indefinitely with natural gas trading at this level: a combination of
reduced capital spending by the producing companies and growing natural gas demand stimulated by the low
gas price will create a new market equilibrium. As this all happens we expect the price to stabilise in the $3.00 –
4.00 range. It may be held at this level for a period until demand grows further (2016 and beyond), and longer term
we expect the price to normalise to $4.00+.
The Guinness Global Energy Report September 2016
Guinness Global Energy Fund guinnessfunds.com
The value of investments and the income from them can go down as well as up. Guinness Asset Management is authorised and regulated by the Financial Conduct Authority. 23
3. APPENDIX Oil and gas markets historical context
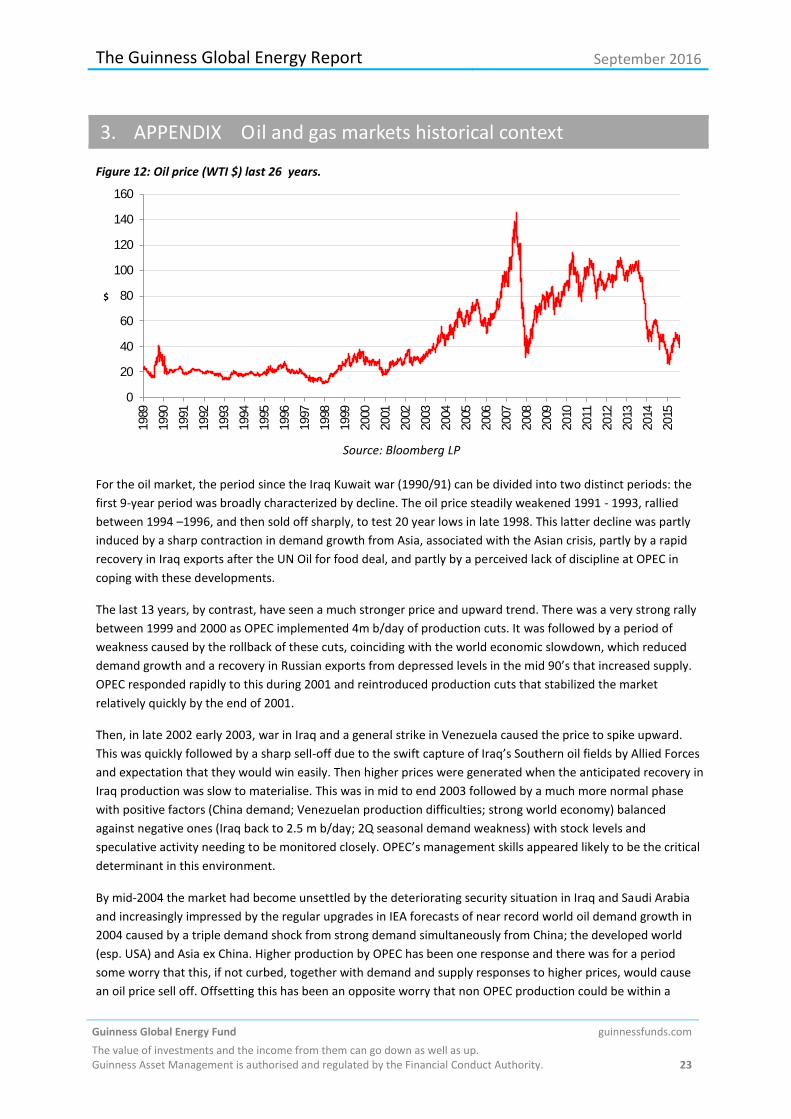
Figure 12: Oil price (WTI $) last 26 years.
0
20
40
60
80
100
120
140
160
1989
1990
1991
1992
1993
1994
1995
1996
1997
1998
1999
2000
2001
2002
2003
2004
2005
2006
2007
2008
2009
2010
2011
2012
2013
2014
2015
$
Source: Bloomberg LP
For the oil market, the period since the Iraq Kuwait war (1990/91) can be divided into two distinct periods: the
first 9-year period was broadly characterized by decline. The oil price steadily weakened 1991 - 1993, rallied
between 1994 –1996, and then sold off sharply, to test 20 year lows in late 1998. This latter decline was partly
induced by a sharp contraction in demand growth from Asia, associated with the Asian crisis, partly by a rapid
recovery in Iraq exports after the UN Oil for food deal, and partly by a perceived lack of discipline at OPEC in
coping with these developments.
The last 13 years, by contrast, have seen a much stronger price and upward trend. There was a very strong rally
between 1999 and 2000 as OPEC implemented 4m b/day of production cuts. It was followed by a period of
weakness caused by the rollback of these cuts, coinciding with the world economic slowdown, which reduced
demand growth and a recovery in Russian exports from depressed levels in the mid 90’s that increased supply.
OPEC responded rapidly to this during 2001 and reintroduced production cuts that stabilized the market
relatively quickly by the end of 2001.
Then, in late 2002 early 2003, war in Iraq and a general strike in Venezuela caused the price to spike upward.
This was quickly followed by a sharp sell-off due to the swift capture of Iraq’s Southern oil fields by Allied Forces
and expectation that they would win easily. Then higher prices were generated when the anticipated recovery in
Iraq production was slow to materialise. This was in mid to end 2003 followed by a much more normal phase
with positive factors (China demand; Venezuelan production difficulties; strong world economy) balanced
against negative ones (Iraq back to 2.5 m b/day; 2Q seasonal demand weakness) with stock levels and
speculative activity needing to be monitored closely. OPEC’s management skills appeared likely to be the critical
determinant in this environment.
By mid-2004 the market had become unsettled by the deteriorating security situation in Iraq and Saudi Arabia
and increasingly impressed by the regular upgrades in IEA forecasts of near record world oil demand growth in
2004 caused by a triple demand shock from strong demand simultaneously from China; the developed world
(esp. USA) and Asia ex China. Higher production by OPEC has been one response and there was for a period
some worry that this, if not curbed, together with demand and supply responses to higher prices, would cause
an oil price sell off. Offsetting this has been an opposite worry that non OPEC production could be within a
The Guinness Global Energy Report September 2016
Guinness Global Energy Fund guinnessfunds.com
The value of investments and the income from them can go down as well as up. Guinness Asset Management is authorised and regulated by the Financial Conduct Authority. 24
decade of peaking; a growing view that OPEC would defend $50 oil vigorously; upwards pressure on inventory
levels from a move from JIT (just in time) to JIC (just in case); and pressure on futures markets from commodity
fund investors.
After 2005 we saw a further strong run-up in the oil price. Hurricanes Katrina and Rita, which devastated New
Orleans, caused oil to spike up to $70 in August 2005, and it spiked up again in July 2006 to $78 after a three
week conflict between Israel and Lebanon threatened supply from the Middle East. OPEC implemented cuts in
late 2006 and early 2007 of 1.7 million barrels per day to defend $50 oil and with non-OPEC supply growth at
best anaemic demonstrated that it could to act a price-setter in the market at least so far as putting a floor
under it.
Continued expectations of a supply crunch by the end of the decade, coupled with increased speculative activity
in oil markets, contributed to the oil price surging past $90 in the final months of 2007 and as high as $147 by
the middle of 2008. This spike was brought to an abrupt end by the collapse of Lehman Brothers and the
financial crisis and recession that followed, all of which contributed to the oil price falling back by early 2009 to
just above $30. OPEC’s responded decisively and reduced output, helping the price to recover in 2009 and
stabilise in the $70-95 range where it remained for two years.
Prices during 2011-2014 moved higher, averaging around $100, though WTI generally traded lower than Brent
oil benchmarks due to US domestic oversupply affecting WTI. During this period, US unconventional oil supply
grew strongly, but was offset by the pressures of rising non-OECD demand and supply tensions in the Middle
East/North Africa.
Most recently, since the end of 2014, Brent and WTI have dropped well below these trading ranges/ Non-OPEC
supply (especially US) has accelerated and OPEC have made clear their intention not to support the price for the
timebeing, leaving the market oversupplied.
Figure 13: North American gas price last 25 years (Henry Hub $/Mcf)
0
2
4
6
8
10
12
14
16
18
20
$
Source: Bloomberg LP
With regard to the US natural gas market, the price traded between $1.50 and $3/Mcf for the period 1991 -
1999. The 2000s were a more volatile period for the gas price, with several spikes over $8/mcf, but each lasting
less than 12 months. On each occasion, the price spike induced a spurt of drilling which brought the price back
down. Excepting these spikes, from 2004 to 2008, the price generally traded in the $5-8 range. Since 2008, the
price has averaged below $4 as progress achieved in 2007-8 in developing shale plays boosted supply while the
2008-09 recession cut demand. Demand has been recovering since 2009 but this has been outpaced by
The Guinness Global Energy Report September 2016
Guinness Global Energy Fund guinnessfunds.com
The value of investments and the income from them can go down as well as up. Guinness Asset Management is authorised and regulated by the Financial Conduct Authority. 25
continued growth in onshore production, driven by the prolific Marcellus/Utica field and associated gas as a by-
product of shale oil production.
North American gas prices are important to many E&P companies. In the short-term, they do not necessarily
move in line with the oil price, as the gas market is essentially a local one. (In theory 6 Mcf of gas is equivalent to
1 barrel of oil so $60 per barrel equals $10/Mcf gas.) It remains a regional market more than a global market
because the infrastructure to export LNG from North America is not yet in place.
The Guinness Global Energy Report September 2016
Guinness Global Energy Fund guinnessfunds.com
The value of investments and the income from them can go down as well as up. Guinness Asset Management is authorised and regulated by the Financial Conduct Authority. 26
IMPORTANT INFORMATION AND RISK FACTORS
Issued by Guinness Asset Management Limited, authorised and regulated by the Financial Conduct Authority.
This report is primarily designed to inform you about recent developments in the energy markets invested in by the Guinness Global Energy Fund. It may also provide information about the Fund’s portfolio, including recent activity and performance. It contains facts relating to the energy market and our own interpretation. Any investment decision should take account of the subjectivity of the comments contained in the report.
This document is provided for information only and all the information contained in it is believed to be reliable but may be inaccurate or incomplete; any opinions stated are honestly held at the time of writing, but are not guaranteed. The contents of the document should not therefore be relied upon. It should not be taken as a recommendation to make an investment in the Fund or to buy or sell individual securities, nor does it constitute an offer for sale.
Risk The Guinness Global Energy Fund is an equity fund. Investors should be willing and able to assume the risks of equity investing. The value of an investment and the income from it can fall as well as rise as a result of market and currency movement, and you may not get back the amount originally invested. The Fund invests only in companies involved in the energy sector; it is therefore susceptible to the performance of that one sector, and can be volatile. Details on the risk factors are included in the Fund’s documentation, available on our website.
Documentation The documentation needed to make an investment, including the Prospectus, the Key Investor Information Document (KIID) and the Application Form, is available from the website www.guinnessfunds.com , or free of charge from:-
the Manager: Capita Financial Managers (Ireland) Limited, 2 Grand Canal Square, Grand Canal Harbour, Dublin 2, Ireland; or,
the Promoter and Investment Manager: Guinness Asset Management Ltd, 14 Queen Anne's Gate, London SW1H 9AA.
Residency In countries where the Fund is not registered for sale or in any other circumstances where its distribution is not authorised or is unlawful, the Fund should not be distributed to resident Retail Clients. NOTE: THIS INVESTMENT IS NOT FOR SALE TO U.S. PERSONS.
Structure & regulation The Fund is a sub-fund of Guinness Asset Management Funds PLC (the “Company”), an open-ended umbrella-type investment company, incorporated in Ireland and authorised and supervised by the Central Bank of Ireland, which operates under EU legislation. If you are in any doubt about the suitability of investing in this Fund, please consult your investment or other professional adviser.
Switzerland The prospectus and KIID for Switzerland, the articles of association, and the annual and semi-annual reports can be obtained free of charge from the representative in Switzerland, Carnegie Fund Services S.A., 11, rue du Général-Dufour, 1204 Geneva, Switzerland, Tel. +41 22 705 11 77, www.carnegie-fund-services.ch. The paying agent is Banque Cantonale de Genève, 17 Quai de l'Ile, 1204 Geneva, Switzerland.
Telephone calls may be recorded and monitored.
Tel: +44 (0) 20 7222 5703 Email: [email protected] Web: guinnessfunds.com
Guinness Asset Management is authorised and regulated by the
Financial Conduct Authority


![Graphics: Merrill Corp - Guinness Guinness Atkinson Funds ......Renminbi Yuan & Bond Fund TM Merrill Corp - Guinness Guinness Atkinson Funds Semi-Annual Report [Funds] 033-075340 06-30-2012](https://img.pdfslide.us/doc/110x75/602a92ec51b9e0293a534dd6/graphics-merrill-corp-guinness-guinness-atkinson-funds-renminbi-yuan.jpg)