Embed Size (px)
Citation preview
The Green Party’sAlternative Energy Review
March 2003
Dr David Toke
and
David Olivier
with a foreword by
Jean Lambert MEP
Promoted and published by Spencer Fitz-Gibbon for theGreen Party of England & Wales
both at 1a Waterlow RoadLondon N19 5NJ
Tel 020 7561 0282 Fax 020 7272 [email protected]

1
ForewordBy Jean Lambert, Green MEP for London
Global temperatures could rise by 1.4 to 5.8°C over the next century,according to the Intergovernmental Panel on Climate Change (IPCC).Despite repetitive rhetoric in Government policy, the real meaning behindthis prediction has not been understood or addressed.
It is unbelievable that, in this day and age, arguments are still being hadover semantics – what do we mean by “Climate Change”. This debate willno doubt still be raging as the waters of the Thames begin to lap around thedoors in Downing Street.
Now is the time to make change happen. Radical change is neededand it must be strategic, inclusive and systematic. Most importantly itneeds to be visionary and focused.
It is evident from the process of the Government’s Energy Review that it isnot yet prepared to commit to such change. Their review:
• Has no focus on the necessity to radically reduce energy consumptionnor on how this can be done with negligible impact on quality of life;
• Still considers renewable energy an add-on to the energy grid, ratherthan a force behind it;
• Still does not rule nuclear power – that gross iniquity of the 20th Century– as unsafe, despite the wealth of physical proof that it is neither costefficient, safe or reliable.
By the end of 2001 the German solar PV programme had delivered 35,000solar roofs. Where are we in the UK? In just one month, more applicationswere approved under the German programme than are predicted for theentire three year UK Major Demonstration Programme.
As MEP for London, I have a vested interest in the outcome of this review,as it will affect the lives of my 7 million constituents. Around half of the UK’sassets most under threat by climate change lie within the Thames region;750,000 London homes are at risk from storms. The Thames Barrier lastyear required more than double the annual closure requirements that it wasdesigned for.
Flooding in London could cause £20 billion damage, threatening London’sfuture international commercial viability, which should give the City pause forthought and cause for action: it should consider a longer term rationale ofdirecting its investment power and how to reduce its own physical energydemands.
We must reduce our energy demands and meet our needs in waysthat place as little stress on the environment as possible. Suchchanges will improve the quality of life for all people, both now and inthe future. It is time to change – we first need the energy to do it!
In this review, the Green Party is laying the real issues on the table.
Editor/Co-author
Dr David Toke i
Author:
David Olivier ii.
Jean Lambert MEP at theSolar Century showrooms inLondon
2
Executive Summary
S1 This alternative energy report is a down-to-earth antidote to the ‘greenwashed’ content ofthe Government’s own Energy White Paper ‘Our Energy Future’, published in February 2003.It is the usual New Labour story of a lot of spin but little substance! We are glad to see that theWhite Paper does not support building more nuclear power stations. However, given that newnuclear build has been widely regarded as economically impracticable in a privatised electricitynetwork and that it would require the reversal of longstanding policy begun by Mrs Thatcher’sGovernment in 1990, this cannot be regarded as a major triumph for radical green politics.
S2 The focus on the issue of whether the new nuclear plant should be built has distractedmuch needed attention from the mechanisms of achieving cuts in carbon dioxide emissions. Itis nice to see an improved long term target for cutting carbon dioxide. However, the WhitePaper’s targets are meaningless without a much clearer programme of measures to achieveenergy efficiency. Moreover the Government’s commitment to renewable energy is still half-hearted. Our alternative report gives green activists a range of practical measures to campaignfor at both local and national levels.
Energy Efficiency
S3 Large-scale energy efficiency cannot possibly be achieved when public sector bodies ata level lower than central government have practically no resources to employ thesignificant numbers of staff needed to implement a meaningful programme. For example,the Government’s White Paper mentions targets for energy efficiency in housing; yet hardlya single local authority (we can find none) has even made detailed and comprehensivemeasurements of how much energy is being used by the housing stock in their area. TheGovernment talk spin and greenwash!
S4 The Government is wrong when it implies (in the White Paper) that the energy efficiencyof only 5 per cent of the UK energy economy can be directly influenced by governmentprocurement policies covering buildings and equipment. Our report shows, in detail, how atleast 26 per cent of the energy economy (by carbon dioxide emissions) can be directlyinfluenced by extremely cheap (usually money saving) measures taken by public sectorinstitutions. The Government can, by various means, also have an influence on the rest ofthe energy economy. A range of specific measures and ways of implementing them arecovered in this report which will lead to real cuts of 11 per cent of UK carbon dioxideemissions by 2020. These are cuts which are additional to existing Governmentprogrammes.
S5 We need to employ significant numbers of people, at both national and especially atlocal/decentralized levels, to implement these measures. Energy efficiency needs to beorganized with Treasury support involving performance indicators, top-sliced additionalfunding and other mechanisms put in place to ensure thoroughgoing training andappointment of energy efficiency personnel in local government and other public sectorinstitutions.
S6 Much, if not most, of the rest of the energy economy can be influenced by theGovernment. The Government can make it a condition for large contractors who wish to dobusiness with Government that they follow guidelines, training and practices which ensureenergy efficient outcomes.

3
S7 The Government has increased the target for installing combined heat and power (CHP)to 10 GWe by 2010. But how is this to be achieved? Our report suggests somestraightforward planning mechanisms which the Government have ignored. Above all, CHPoperators need to be given premium prices for electricity sold to the grid.
Renewable Energy
S8 The Treasury has succeeded in watering down the commitment, made tentatively in theWhite Paper, to supply 20 per cent of UK electricity from renewable sources by 2020.Progress towards this ‘aspiration’, starting with 10 per cent by 2010, is only advocated ‘aslong as the cost to customers is acceptable’. The costs of new renewable sources like windpower are much less than the costs of nuclear power, yet the Government has not askedelectricity customers about the ‘acceptability’ of continuing large subsidies for nuclearpower. Even a 20 per cent target for renewable electricity is no more than Denmark hasachieved since 1985. Our windy island can do much better.
S9 The Government’s own wrong-headed ‘free market’ financial mechanisms used tosupport renewable energy, allied to the totally unjustified opposition of the Ministry ofDefence to wind power schemes, have been the biggest factors holding back renewableenergy power since 1990. The White Paper does nothing to reduce financial uncertaintyfacing renewable energy developers and it fails to advocate the establishment of anindependent means of adjudicating objections to wind power schemes made by theMinistry of Defence.
S10 Guaranteed minimum payments for electricity from windfarms are needed to speeddeployment of both offshore and onshore wind power schemes and real, not token,encouragement needs to be given to community investment in renewable energy schemes.Local Government and other public sector bodies need to sign up for renewable energysupply contracts. To make much greater use of solar power, the Green Party advocates theinclusion of solar panels as mandatory in all new buildings.
Nuclear Power
S11 Despite the greenwash, the bulk of Government energy investment is still going tonuclear power. More than half energy R&D goes to nuclear and less than a quarter goes torenewable energy. The Government is pouring money onto British Energy, some of itthrough a loan, and a lot of it financed by backdoor means through payments for‘decommissioning’ costs given to British Nuclear Fuels. Let us save the UK a lot of money(and a lot of nuclear waste) by phasing out nuclear power. This can be quickly achievedbecause of the excess electricity generating capacity in existence.
S12 The report begins with a statement of some objectives. Then we say something aboutnuclear power. Following on from this we insert the ‘Energy Efficiency in the Public Sector’report. This is the main part of our report. Following this we say something about renewableenergy. The sections on energy efficiency and renewable energy contain a range ofsuggestions for action by local authorities and other public sector institutions.
4
1. Objectives of energy strategy1.1 Our over-riding objective is to develop an energy strategy that is clean, safe, cheap and secure. Thisimmediately rules out nuclear power on all four criteria, as we shall describe in the next section. It means thatfossil fuel sources which are already cheap must be made cleaner and must be phased out in favour of cleanrenewable energy sources which are becoming or will become cheaper through being given access to markets.
1.2 Cleaner energy means energy that cuts down on production of acid emissions, carbon dioxide and hazardous,particularly nuclear, wastes. Of particular importance are the achievement of energy security and reduction ofcarbon dioxide emissions. Both of these aims are enhanced by promoting energy efficiency and renewableenergy.
1.3 Given the dangers posed by global warming, it is vital to achieve radical reductions in greenhouse gas, andespecially, carbon dioxide emissions. We know that increasing carbon dioxide levels in the atmosphere areoccurring, and that this is increasing, and will increase, temperature levels. This will lead to rising sea levels.Geological history, which cannot be explained without postulating a strong link between carbon dioxide levels inthe atmosphere and global temperatures, suggests that temperature increases of 4-5 degrees K could havedisastrous consequences. On top of this, the need to conserve oil and gas in order to avoid energy resourcecrises and their political consequences ought to propel sustainable energy policies onto to the top of politicalagendas.
1.4 The United Nations’ Intergovernmental Panel on Climate Change has said that global carbon dioxideemissions need to be reduced by 60 per cent in order to stabilize the climate. An ethically justifiable UK target is areduction of at least 85 per cent by 2050 because it leaves room for the developing countries to make less of acut than 60 per cent.
1.5 So far UK Governments have succeeded in achieving their international commitments for carbon dioxidereduction, but then the target of stabilising 1990 emissions by 2000 (agreed at the Rio Earth Summit in 1992) wasnever a very challenging target. In fact UK carbon dioxide emissions in the year 2000 were some seven-and-a-half percent less compared to 1990. The biggest cause of this was the shift in electricity production from inefficientpower stations fired by coal which has a high carbon content to more efficient power stations fired by natural gas,which has a much lower carbon content.
1.6 The UK Government has a target of reducing 1990 carbon dioxide emissions by 20 per cent by 2010. In its2003 White Paper ‘Our Energy Future’ the Government accepted a target of cutting carbon dioxide emissions by60 per cent by 2050 compared to current levels. The acceptance of this target, and some other targets in theWhite Paper, represents an acceptance of some green rhetoric, but without the means of implementing a greenagenda. The Government’s targets for renewable energy deployment are half-hearted and the means ofachieving even the present targets are inadequate. The White Paper says practically nothing about the specificsof how energy efficiency improvements can be achieved and there is a failure to even acknowledge the need tohave a major increase in personnel organizing energy efficiency in grass roots bodies such as local authorities.
1.7 We detail, in this report, how we can substitute energy efficiency for nuclear power in terms of substituting forthe carbon dioxide emissions that are otherwise saved by nuclear power’s non-fossil electricity generation.Contrary to the impression given by some, if no more nuclear power stations are built, this need not jeopardizeGovernment targets for carbon dioxide reductions. Savings in carbon dioxide through practical energy efficiencymeasures can much more than replace any carbon savings through nuclear power stations without any significantincrease in taxation. However, there will be need for a major overhaul of public sector-led training, planning andlocal delivery mechanisms to accommodate energy efficiency practices.
1.8 Of course, we wish to go beyond the Government’s programme, and hence further measures will benecessary. If we combine a radical programme of energy efficiency, a major drive to deploy renewable energy tosupply 40 per cent of electricity by 2020 and also energy taxation measures it should be feasible to go waybeyond the Government’s own present target of 20 per cent cuts in carbon dioxide emissions by 2020. Hence theGreen Party aims to achieve cuts in carbon dioxide emissions of 40 per cent by 2020 (compared to 1990).
1.9 It is unfortunate that the central argument of the Government’s energy review has been about nuclear powerrather than about energy efficiency. Because of this, and the debate about the continued viability of the nuclearpower sector, we need to spend some time discussing the nuclear option.

5
2. More nuclear power?2.1 The nuclear industry often complains that its critics are ‘hysterical’ about the danger of accidents and theyinsist that modern nuclear power stations do not leak much radioactivity. The lack of any solution to the disposalof nuclear waste is glossed over. The nuclear industry do not, of course, say much about radioactive leaks whenthey are talking about Sellafield Reprocessing Plant which routinely dumps large quantities of liquid waste into theIrish Sea. In fact the nuclear industry propagates a number of myths about itself and its activities.
2.2 The energy security myth. Nuclear power will not increase our energy security. Nuclear power stations runon uranium, a radioactive substance whose extraction has resulted in terrible losses of life among miners aroundthe world and terrible amounts of radioactive mining wastes. Quite apart from the fact that it is no type of securitythat is achieved at somebody else’s expense, if all the world greatly increased the contribution of nuclear powersufficient to make a major impact on reducing carbon dioxide emissions we would find that we would have a‘uranium’ security crisis.
2.3 The decommissioning myth. Ever since 1990 when the Conservatives privatized electricity and thenrealized that the privately owned electricity industry would not build new nuclear power stations the nuclearindustry has cultivated the notion that it is the costs of decommissioning old nuclear power stations that makesthe industry expensive. This myth is propagated for three reasons:
a) First, it distracts attention from the fact that the reason that nuclear power stations are not build by the privatesector are that they are incredibly expensive to build and could not possibly generate even half enough incomefrom electricity sales to justify them being built on standard commercial criteria.
b) Second, it allows the industry to claim money from the state to finance ‘decommissioning’. This money is thennot used for ‘decommissioning’ but is instead spent to keep commercial operations of nuclear power afloat. Thelatest example of this are the back door subsidies given to British Energy when it had a financial crisis in 2002.British Nuclear Fuels Limited (BNFL) agreed to take a cut in the money it receives (from British Energy) forreprocessing spent nuclear fuel rods (a totally pointless, extremely negative, process anyway) and in return BNFLwas given an increase in the funds it gets to ‘decommission’ old nuclear power stations.
c) Third, the nuclear industry uses the decommissioning argument to prolong the life of hopelessly uneconomicpower stations. It says that nuclear power stations cost so much to decommission that you have to keep thepower stations running. Well, we do not argue with the point that turning the nuclear power station sites into greenfield is an incredibly expensive process. However, the nuclear industry have no intention of doing this, and it islaid out quite clearly in their plans that after some modest work to remove actively radioactive materials the plantwill be left to fester for many decades. Hence the nuclear industry can claim it needs vast sums for‘decommissioning’ from the state while in reality this money is used to subsidise normal commercial operations,so keeping plants going. Decommissioning funds are, in reality, about keeping the nuclear power stations going,not closing them down. This is a good example of what George Orwell (in his book ‘1984’) called ‘doublethink’.
2.4 The cheaper new design myth.
a) This is the oldest and longest running myth of them all, yet it is still being rolled out in the 21st century. In fact,successive models of nuclear power stations have become more and more expensive. That has a lot to do withthe fact that people demand high safety standards. Nuclear chiefs say the chances of having an accident areremote. You bet people want this to be so! Another reason is that other energy sources have become relativelycheaper while nuclear power cannot increase its efficiency because of the limitations of generating electricity fromsteam.
b) The cost structure of building new nuclear power stations is truly horrendous, as exemplified by the last one,Sizewell B. The industry say the next one will be cheaper. But why on earth should that happen. Why should webelieve that when this line always turned out to be nonsense in the past?
c) According to official accounts, Sizewell B power station cost, in 2003 prices 3600 million pounds of state moneyto build; but that does not include interest on money borrowed during construction, which is something allcommercial power stations have to pay for. When you include that, even at a low 8 per cent discount rate, thetotal cost rises (in 2003 prices) to around 4900 million pounds. In cost per KW of capacity this means about 4500pounds per kilowatt, which is over twice what it costs to build wind turbines to produce the same amount ofelectricity.
2.5 How on earth would new nuclear power stations be funded? You would not find a financial organisation thatwould believe the figures the nuclear industry gave them, let alone lend them money. Hence the Governmentwould have to set up a mechanism whereby British Energy, or some such company, would be given virtually a

6
blank cheque to spend many billions of funds diverted from taxpayers and electricity consumers. No doubt thenuclear industry would talk about the need to pay ‘decommissioning costs’ which would once again be diverted forother purposes. There would certainly be a dramatic increase in electricity prices – maybe up to a third. This is ina world where the Government will not even increase prices by one per cent to fund energy efficiency measuresthat pay for themselves in the end.
2.6 Energy analysts were not at all surprised that the 2003 Energy White Paper did not propose ‘new nuclearbuild’. We should not regard this Government decision as a great step forward given the inherent impracticality ofbuilding more nuclear power stations and the fact that a nuclear ‘no-build’ policy has been established since theThatcher Government in 1990. See also the 1995 Energy White Paper which was produced under the MajorGovernment. The decision merely represents the avoidance of production of even more nuclear waste and theavoidance, for the Government, of what would have been a major political own-goal.
Phasing out nuclear power
2.7 The Green Party believes that nuclear power should be phased out as rapidly as possible. Given the massiveover-capacity of electricity generation in the market at the moment, there is little doubt that this could be achievedvery quickly without any problems for the electricity supply system. Many have claimed that the Government willhave difficulties achieving its carbon dioxide reduction targets if no new nuclear power stations are built. Thiswould certainly have little effect on the target for 2010 as the Government do not plan on retiring large proportionsof nuclear power capacity until after that date. Nevertheless, we strongly contest the claim that it will createproblems even by the year 2020, by which time the bulk of nuclear power will have been retired according toGovernment plans.
2.8 Our report on energy efficiency, which details a range of measures that will substitute for nuclear power, willbe part of a strategy to achieve carbon dioxide reductions well over and above those set by the Government. Westress that while a nuclear power building programme will be extremely expensive (compared to other energysupplies), the energy efficiency programme can be mostly self-financing (being cheaper than existing forms ofenergy supply). Although the Green Party regards energy taxation as being desirable in the context of reachingmore radical targets for reduction in carbon dioxide emissions, significant increases are not required for thefulfilment of the energy efficiency programme outlined in the report which follows:
7
3. Energy Efficiency
Summary and Overview
3.1 This report identifies policy initiatives which could improve the end-use energy efficiency of the UK publicsector and save on CO2 emissions. They involve national and local government procuring more energy-efficientbuildings, vehicles, electrical office equipment and domestic appliances.
3.2 They also involve public sector initiatives to influence private sector purchasing habits on buildings, vehiclesand electrical equipment. But this move forward would still be government-led, utilising initiatives which arealready open to the public sector via land ownership, or via its financial contribution to housing associations andother bodies. We need to overcome the considerable knowledge deficit that exists on the subject of energyefficiency. The number of people who know about energy efficiency must be dramatically expanded andtheir contribution to building and equipment planning and procurement must be routine at all levels.
3.3 The Government’s 2003 Energy White Paper greatly understates the impact that public sector initiatives canmake on energy efficiency. The White Paper offers few practical means of organising such initiatives apart fromdressing up a review of government procurement as an energy efficiency measure when this is likely to be aperipheral, and only superficially treated, objective. The Government seems to think that spin is a substitute forsubstance. It is, for example, quite ludicrous for the Government to publish targets for energy efficiency in housingwhen there is no, or practically no, local authority that has made even properly calculated energy consumption ofhouses in its area. Local authorities lack the staff to achieve even this limited objective. Hardly a single localauthority (we can find none) has even measured how much energy is used by the housing stock in their area,disaggregated into old housing and modern housing (after the various Building Regulations are applied). Althoughenergy use for some types of public building, such as schools, has been tabulated, no authoritativemeasurements on random samples exist for housing, which uses far more energy in total than even schools.
3.4 The report highlights the need for a more pro-active approach to energy efficiency, with a growing contributionfrom renewable energy to a reduced demand. The report estimates the potential savings in energy and CO2 fromthese initiatives over two timescales. First, the short term, around two years from now - say by the year 2005.Second the medium term, by the year 2020. The identified CO2 savings are 1.9 M tonnes per year by 2005 and15.7 M tonnes per year by 2020. This would represent a saving in these sectors of around 11 per cent by 2020, afigure which will increase further when use of combined heat and power (CHP) in new housing developments istaken into account. It should be emphasised that the effect of the actions outlined in this report will continue after2020 and the proportions of energy efficiency savings will increase.
3.5 It should be stressed that these savings do not take into account future improvements in energy efficiencytechnology. Moreover such measures can be implemented through a thorough programme of training, redesignof investment allocation procedures, the issuing of appropriate guidelines for buildings and equipmentprocurement to public sector institutions and appointment of large numbers of staff with the required knowledgeas energy managers. This needs to be co-ordinated through energy efficiency offices in every GovernmentDepartment, with a central unit in the Treasury with levers such as top slicing for energy efficiency investment andthe setting up of a performance indicator for energy efficiency in local authorities and other public sector bodies.These measures, in themselves, do not require significant increases in taxation or in the cost of supplying energysince they are mostly self-financing through energy savings. The case for increasing energy taxation, however, isstill very strong in view of the need to achieve higher carbon dioxide reductions than the Government’s target of20 per cent reduction in 1990 levels of carbon dioxide by 2010.
3.6 Although this report covers only 26 per cent of the energy economy (as measured by carbon dioxideemissions) we believe that equivalent savings are possible in other sectors of the economy and in the privatesector. This nationwide improvement could be achieved, in many instances, by a requirement that companieswith substantial contracts with the Government should meet energy efficiency best practice standards.For example, use of energy efficient vehicles by companies and adoption of energy efficiency procurement andtraining programmes similar to that which can be adopted in Government could achieve objectives that are similarto that which can be achieved in the public sector. Overall, we would expect that the approach considered in thisreport will lead to cuts of 11 per cent in the energy economy as a whole by 2020. This will much more thancompensate for the decline in nuclear power associated with a planned phase-out of nuclear energy.
3.7 The Government has projected that carbon dioxide emissions will fall, on the basis of its own programme, by19 per cent by 2010 compared to 1990 iii, although it has not published projections of the effects of itsprogrammes beyond this date. However the energy efficiency measures implied by this report will much morethan compensate for the phase-out of nuclear energy that will have occurred by 2020. Energy efficiency

8
measures and renewable energy measures substituting for only 5 per cent of the UK’s carbon dioxide emissionswould be needed to compensate for the decline of nuclear power in this period. This demonstrates just howmodest the Government’s targets are and how it would be possible to adopt more radical carbon dioxidereduction targets as well as phasing out nuclear power. Cuts of 30 per cent of 1990 UK carbon dioxide emissionsare attainable by 2020 with this phase-out even without more radical measures such as carbon taxes. The GreenParty believes that such strategies are needed in order to produce cuts of 40 per cent in carbon dioxide levels by2020.
3.8 The report concentrates on public sector procurement of better buildings, vehicles and electrical equipment. Itbriefly describes other government action which would prepare the ground for greater CO2 savings later in the21st. century.
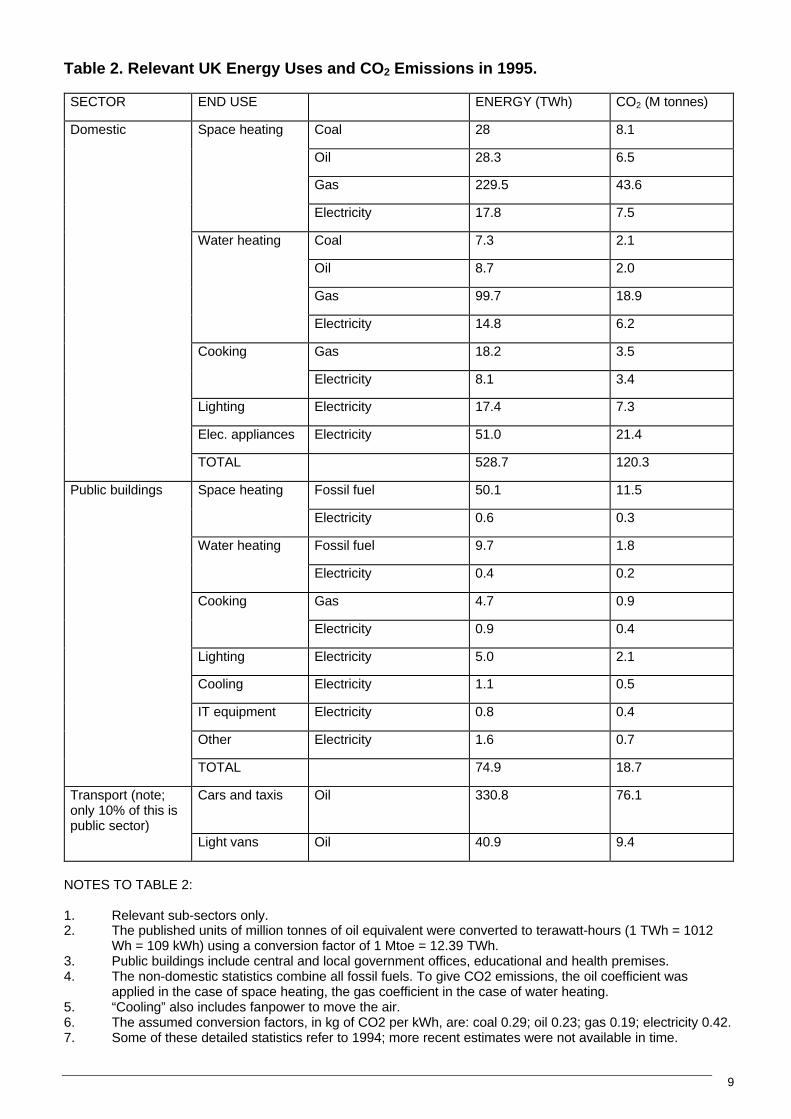
3.9 Table 1 shows the trends in UK energy use from 1990 to 2000. Table 2 shows in more detail how energy wasused in 1995 in relevant sectors of the economy 1.
Table 1. UK Primary Energy Consumption (TWh/yr).
SECTOR 1990 2000 AVERAGE GROWTH RATE
Domestic buildings 767 913 1.7 % per yr
Public and commercial buildings 423 530 2.2 %/yr
Industry 794 736 -0.7 %/yr
Transport 662 766 1.4 %/yr
TOTAL 2647 2945
3.10 These overall increases in electricity consumption have not translated into increases in carbon dioxideemissions. In fact carbon dioxide emissions actually declined by 7.5 per cent in 1990-2000 because of changes inthe fuel mix (mainly coal to gas), and a big improvement in power stations efficiencies. The Government expectscarbon dioxide emissions to fall (on the basis of its own programme) by nearly 20 per cent by 2010.
3.11 The actions discussed in this report are additional to the measures assumed by the Government, forexample the effect of new building regulations, climate change levy etc which the Government have implementedor to which they have committed themselves.
3.12 In their submission to the Government’s Energy review Friends of the Earth said that retirement of existingnuclear power stations will mean that their contribution to electricity supply will decline from 21 per cent in 2000 toaround 7 per cent by 2020. Because electricity contributes around 30 per cent of UK carbon dioxide emissionsthis would be equivalent to a saving, through energy efficiency, of under 5 per cent of carbon dioxide emissionsthroughout the energy economy as a whole. This will be much more than achieved as a result of the savingsproduced as a result of the implementation of the recommendations contained in this report.
9
Table 2. Relevant UK Energy Uses and CO2 Emissions in 1995.
SECTOR END USE ENERGY (TWh) CO2 (M tonnes)
Domestic Space heating Coal 28 8.1
Oil 28.3 6.5
Gas 229.5 43.6
Electricity 17.8 7.5
Water heating Coal 7.3 2.1
Oil 8.7 2.0
Gas 99.7 18.9
Electricity 14.8 6.2
Cooking Gas 18.2 3.5
Electricity 8.1 3.4
Lighting Electricity 17.4 7.3
Elec. appliances Electricity 51.0 21.4
TOTAL 528.7 120.3
Public buildings Space heating Fossil fuel 50.1 11.5
Electricity 0.6 0.3
Water heating Fossil fuel 9.7 1.8
Electricity 0.4 0.2
Cooking Gas 4.7 0.9
Electricity 0.9 0.4
Lighting Electricity 5.0 2.1
Cooling Electricity 1.1 0.5
IT equipment Electricity 0.8 0.4
Other Electricity 1.6 0.7
TOTAL 74.9 18.7
Transport (note;only 10% of this ispublic sector)
Cars and taxis Oil 330.8 76.1
Light vans Oil 40.9 9.4
NOTES TO TABLE 2:
1. Relevant sub-sectors only.2. The published units of million tonnes of oil equivalent were converted to terawatt-hours (1 TWh = 1012
Wh = 109 kWh) using a conversion factor of 1 Mtoe = 12.39 TWh.3. Public buildings include central and local government offices, educational and health premises.4. The non-domestic statistics combine all fossil fuels. To give CO2 emissions, the oil coefficient was
applied in the case of space heating, the gas coefficient in the case of water heating.5. “Cooling” also includes fanpower to move the air.6. The assumed conversion factors, in kg of CO2 per kWh, are: coal 0.29; oil 0.23; gas 0.19; electricity 0.42.7. Some of these detailed statistics refer to 1994; more recent estimates were not available in time.

10
3.13 The rapid rise in UK road transport energy between 1990 and 2000 was due to a 14% increase in fuel use byHGVs and a 26% rise in fuel use by light vans. Fuel use by cars rose by 1%. Experts consider road transportenergy use to be roughly stable; the rise in freight travel is substantially offset by a more favourable trend withcars.
3.14 The largest rise in CO2 emissions was from electricity use in non-domestic buildings. It more than doubledfrom 1990 to 2000. This rate of growth far exceeds the growth of oil use in the transport sector. Table 2 has abreakdown of how electricity was used in public sector buildings.
3.15 Not only is energy use in non-domestic buildings outpacing energy growth in the transport sector, but so isenergy consumption in domestic buildings. Over the period 1990-2000, the fuel consumed to heat UK dwellingsrose an order of magnitude faster than fuel consumption by cars. Electricity consumption by domestic appliancesrose even faster.
3.16 The media rarely mention this adverse trend, so what are the reasons behind soaring energy use bybuildings? It seems that with growing incomes, thermal comfort and electrical equipment ownership and use aresteadily rising and that these are outweighing a lethargic improvement in the energy efficiency of UK buildings.The media stress transport energy, but to halt the growth in CO2 emissions we also need a huge effort onbuildings.
3.17 This report looks into the possibility of a range of public sector initiatives to procure more energy-efficientpublic buildings, vehicles and electrical equipment. It also discusses the scope for further public sector action toinfluence the energy efficiency of private and social housing, office and retail buildings.
3.18 This influence over the private sector can utilise several possible “levers”. One is where the public sectorowns proposed development land. Another is where the public sector provides some funding to certain types ofbuildings; e.g., it supports social housing and certain industrial buildings. Another is through the developmentcontrol (planning) system.
3.19 The end of this report gives estimates of the potential savings in energy and CO2 over two timescales. Firstin the shorter term, around two years from now. Second in the longer term, around 20 years from now. These aresavings from three initiatives:
1. Procure more fuel-efficient vehicles for public sector fleets;2. Improve existing public building energy use from “typical” to “good practice” by 2013 and set
tighter standards still for new buildings;3. Use the local authority funding input to ask RSLs to set tighter energy performance standards
on new housing than would otherwise be achieved.
3.20 We have been unable to quantity the savings from a range of other measures, but we believe that they couldbe substantial.
3.21 Our proposed steps do not directly discuss initiatives taken in the private sector, although we would expectmeasures to ensure that action in the private sector follows Government leadership on energy efficiency, as isdiscussed elsewhere. Our proposals are primarily a case of the public sector showing leadership with the privatesector introducing schemes that match Government schemes that have been developed. The detailed energysavings in this report neglects the fuel savings which could flow from other central government reforms to providefundamental support for energy efficiency. They also neglect savings associated with policies such as ensuringthat all new housing developments are fired by community heating supplied by CHP. This report thereforerepresents an incomplete programme compared to what can realistically be achieved in saving energy by 20202

11
Domestic buildings – scope for energy efficiency
International gap
3.22 UK dwellings are less energy-efficient than dwellings in other developed countries; e.g., Germany and theUSA. Table 3 has a striking comparison of the gap in performance.
Table 3. Energy Consumption of Housing to Different Standards.
ENERGY EFFICIENCY STANDARD MEASURED ENERGY CONSUMPTION kWh/m2yr (nt1)
1. Normal new German houses (nt2) 140
2. UK housing stock 300 (nt3)
3. Normal new UK houses >200 (nt4)
4. UK typical “ultra-low-energy housing” (nt5) 150
5. UK best “ultra-low energy housing” (nt6) 75
6. German Passive Housing 32
NOTES:
1. Sum of the gas or oil (sometimes coal) used for heating and hot water and the electricity used for lights andappliances.
2. In terms of the need for space heating energy, the German climate is as severe as the climate of northern England -rather more severe than the England or Wales average.
3. Estimated roughly from recent overall energy statistics. The former figure was about 280.4. No measurements exist. The quoted UK figures are in fact theoretical calculations, using over-optimistic U-values.
Anecdotal evidence and more precise calculations suggest that the real figure is probably in the range 200-250.5. See reference. 2.6. Typical of fairly well-designed and -built schemes; e.g., Reyburn House, Embleton House, Lower Watts House and
since then the Garnham House.
3.23 On average the sample of about 200 “ultra-low-energy homes” consumes half as much energy as the UKhousing stock. But it uses more than a normal new German house!
3.24 Historically, UK buildings had lower internal temperatures than buildings on the continent; e.g., in Germany,Austria, the Czech Republic, Sweden and Poland. It is clear that UK comfort standards are increasing towardscontinental levels and that this is one reason why building energy use, especially in housing, is rising so much.
Reality versus theory
3.25 There is doubt over the as-built energy efficiency of modern UK housing. Anecdotal evidence suggests that ituses more energy than the government’s models predict3.
3.26 The UK’s 1990-2000 energy statistics also show something is badly amiss. Domestic gas consumption inthis decade rose faster than domestic floor area. We do not yet know how much of this growth is due to oldhouses being better-heated and how much is due to new housing being built in an energy-wasting manner.
3.27 Across most of mainland Europe, there is no large discrepancy between theory and practice. In Germanyand Switzerland the law states the maximum energy consumption of a new house or office (under standardoccupancy conditions; e.g. 20 degrees C indoors all the time). One party, usually the architect, has a legal duty toensure that this construction standard is met.
3.28 The disparity in construction quality between the UK and central Europe probably explains why the EuropeanCommission felt it realistic to issue a Directive on the Energy Performance of Buildings. The very term “energyperformance” implies over-optimism over the capability of the UK construction industry. A minority of UK buildingsperform pretty well, but most parties in the industry need considerable training and education before the energyconsumption of ordinary buildings will ever match the designer’s predictions.

12
Policy initiatives
Social housing
3.29 Registered social landlords (RSLs) construct about 10% of new UK dwellings. In recent years, this amountedto about 17,000 dwellings per year.
3.30 Central government makes a grant to social housing via the Housing Corporation. Via this route, RSLs arealready being asked to meet slightly higher energy efficiency standards in their new dwellings. Local governmentalso makes a financial contribution to new social housing. If a council is committed to energy efficiency, it coulduse this funding as a lever to insist that RSLs meet higher standards than the Housing Corporation requires.
3.31 The Housing Corporation already requires RSLs to incorporate some energy-efficient features (BRE Eco-Homes Plus) and build houses which in principle are more energy-efficient than the Building Regulations. Thisneeds to be modified so that RSL dwellings must meet a minimum energy performance (at normal operatingconditions). It would then be possible to require an improved energy performance standard in new housing.
3.32 Central government could also permit RSLs to provide lights and appliances in new rented housing to energyefficiency standards above the legal minimum. Today RSLs are discouraged from including anything in the rentapart from a bare, unfurnished shell. Low-income tenants lack the capital to buy efficient appliances; the landlordcould provide them.
3.33 When RSLs refurbish housing, they can be asked to meet a higher standard than current BuildingRegulations. Good models for radical improvements exist on mainland Europe. In the late 1980s, the town ofSchiedam, Netherlands superinsulated an estate of 450 solid-walled flats which dated from the 1950s. The gasconsumption for space heating was reduced by over 50%, and yet comfort increased dramatically; tenants couldafford a warm home for the first time ever. Previously only one room in the flats had been heated.
3.34 Over the period from now to 2020, RSL housing energy performance would improve to some extent anyway,influenced by the Building Regulations and extra Housing Corporation requirements. We assume that furtherintervention leads to the fossil fuel consumption of a dwelling being reduced by 3,000 kWh/yr, and electricityconsumption being reduced by 800 kWh/yr, versus what it would otherwise have been.
Council Housing
3.35 Local Authorities should apply a similarly wide range of energy efficiency measures to council housing -which is directly under their control. To guard against costs being passed on to tenants, a national governmentfunding stream should be made available for this specific purpose.
Private housing
Speculative developers
3.36 Legally, local government cannot influence the energy efficiency of private housing estates, except possiblyvia clauses in its planning policy. For example, local authorities can pressure developers to use district heatingwhich can then be supplied by combined heat and power (CHP) schemes. But, if councils own development land,they can force the developers of such land to meet much higher energy efficiency standards than the BuildingRegulations.
3.37 This mechanism deserves to be used more. Milton Keynes used it for many years; the DevelopmentCorporation owned the land on which the town was built. The National Trust is using it to oblige the developers ofa 600+ house estate in Cheshire to meet a performance standard based on proposals from the DTLR for "Longer-Term Insulation Standards” 4.
Self-build homes
3.38 These dwellings, constructed by or for a particular owner, now account for about 18% of new UK dwellings,and for about 50% of all new detached houses. The proportion is slowly rising but it remains far below the level inother developed countries. In Germany, Austria and Belgium, for instance, 50+ % of all new dwellings are self-build.

13
3.39 Several reports suggest that self-build is the market sector which has most interest in building really energy-efficient houses, well beyond Building Regulations. This is not altogether surprising; if people control theconstruction of their new house, they are more inclined to do something to reduce the running costs.
3.40 Most land which is scheduled to receive planning permission for housing is controlled by large developers,who already own options on much of the land around most UK towns and cities. This tends to restrict access toland by self-builders. It would be very helpful if local authorities would try to level the playing field. Several actionsare possible:
1. Require developers who obtain planning permission to sell a proportion of sites as serviced single plots toself-builders;
2. Permit sites that have previously been occupied by houses to be redeveloped. In south-east England thisdoes not always happen and Greenfield sites may be developed instead; and/or
3. Change the criteria so that more “windfall sites” - the type most available to self-builders - receiveplanning permission.
3.41 The government’s Design Advice scheme is normally available to those developing buildings >500 m2 in floorarea. It could be extended downwards so that one-off houses - other than mansions - are eligible. Participationwould be voluntary but councils could advertise it to all who apply for planning permission.
3.42 In terms of costs and benefits, an extension of Design Advice could be justified if self-builders who receivethe benefit of an expert consultation undertake to implement the advice in full. Perhaps this could be enforced bymaking the recommendations part of the planning permission documents.
All dwellings
3.43 To investigate the disparity between theory and reality we must urgently survey utility bills (especially spaceheating) for a large random sample of modern housing. This statistical data can then be compared with the gas,oil and electricity bills which were predicted when the houses received Building Regulations approval (SAPcalculations). Internal air temperatures and floor areas also need to be checked, as part of the analysis.
3.44 Ideally, the sample would be nationwide, making it statistically representative of construction in the whole ofEngland and Wales. Failing that, perhaps 5-10 district councils spread widely across the country couldcollaborate, but even a study in one district could be better than none at all. Today we know almost nothing of thetrue energy performance of modern housing which was constructed in accordance with the 1982, 1990 and 1995Building Regulations.

14
Non-domestic buildings – scope for energy conservation3.45 There now appear to be over ten German office blocks which use 20% as much energy as normal UKoffices. These exemplary buildings were all designed and constructed in the last five years. Also near the top ofthe energy efficiency scale, the UK has some very energy-efficient exemplars. For instance, the 1994 ElizabethFry Building at the University of East Anglia uses 80% less energy for heating than a normal university building;the Woodhouse Health Centre in Sheffield uses 50% less total energy than a normal doctor’s surgery, etc.
3.46 Moving down the scale towards more normal buildings, Table 4 lists typical and good practice energy use forseveral types of local government building. Only 5-10% of buildings reach the good practice figures.
Table 4. Typical and good practice energy use - local government buildings.
BUILDING TYPE ENERGY USE kWh/m2yr TYPICAL GOOD PRACTICE
Town/city halls Gas 170 112
Electricity 111 84
Libraries Gas 172 112
Electricity 47 32
Police stations Gas 410 295
Electricity 60 45
Primary schools Gas 164 113
Electricity 32 22
Secondary schools Gas 144 108
Electricity 33 25
NOTES:
1. These figures refer to existing buildings, not new ones.2. The ratio of good practice to typical energy use is: gas 70%, electricity 74%.3. Source: www.actionenergy.org4. Local government also includes senior citizens’ homes and social services buildings. Residential homes are not
included in the above categories but need to be tackled; a typical home has energy bills of £15,000/year.
Simple examples of “short payback” best practice measures in existing buildings include:
1. Replace inefficient lighting systems. All systems over five years old are obsolete in these terms,as are some newer systems. Advanced lighting systems with electronic control gear, T5 tubesand efficient luminaires can run with 25-30% the power of “normal” systems installed in the1980s. The annual savings could reach £15,000 (100,000-150,000 tonnes of CO2) in a medium-sized office block;
2. Install automatic lighting controls so that rooms are not lit when they are unoccupied or whendaylight is available;
3. Install improved heating controls and condensing boilers;4. Change from electric space or water heating to gas (or to LPG or oil);5. Install CHP plant (on suitable sites);
3.47 Buildings all have their own unique inefficiencies. Local authorities can get some professional advice free,courtesy of central government’s Action Energy (formerly Energy Efficiency Best Practice Program). Usually thehighest short-term returns are secured by improving the services, not the building fabric. Most improvementsbefore 2010 would inevitably be of this type. If a building owner carries out a total refurbishment, the scope forenergy efficiency is nearly as good as when designing a new building. Large improvements can be considered atthat time to the fabric, insulation and glazing.

15
3.48 An example of a very focused effort on building energy efficiency is BT PLC. BT reduced its buildings’ totalenergy consumption (excluding the telephone network) by 11% between April 1997 and March 2002. Its real-timeenergy monitoring system detects energy waste the moment it begins.
Policy initiatives
Government buildings
Existing stock
3.49 We should adopt a bold policy of improving the existing building stock from “typical” to “good practice” withina decade. We should aim to maintain the same rate of improvement until at least 2020. This amounts to a majorpolitical commitment, but it is open to local government to make the funds available and act to improve its townhalls, council offices, schools, fire stations, police stations and residential homes. It would also affect centralgovernment departments, regional government offices, the NHS, universities and colleges.
3.50 Starting in 2003, we would be 20% of the way to “good practice” by 2005. With this pace of improvement wewould save 6% of existing gas consumption and 5% of existing electricity consumption by 2005, and around 50%and 40% respectively by 2020.
New buildings
3.51 We can set somewhat more stringent standards for new public buildings. This step will not have a significantimpact by 2005, but it could be saving useful amounts of energy and CO2 by 2020. We have been unable toestablish a precise figure so it is excluded from our total.
3.52 To reach 30-40% of current “typical” energy use is not technically difficult in new buildings. Most projectscould probably reach an intensity <30% tomorrow if the design team know what they are doing, and if the owneror tenant chooses very energy-efficient electrical equipment.
3.53 As regards the building itself; i.e., heating, lighting, cooling, ventilation, etc but excluding electricalequipment, a prerequisite is that someone in the design team, or an outside expert, monitors the energy-relatedfeatures and the somewhat complex interaction between them as the design develops. A government leafletpoints out that strategic decisions, taken at the inception of a building design, can save 50% of its subsequentenergy use. At most this is possible at no extra initial cost. Sometimes there is a capital cost saving5. The tragedyis that this rarely happens, because the usual building procurement process is so dysfunctional.
3.54 The public sector can influence the energy efficiency of other non-residential buildings, in a small way. If anypart of the public sector sells land for commercial or industrial development it can set a legal requirement that thedeveloper exceeds the energy efficiency requirements in the Building Regulations.
3.55 It should be mandatory that new housing estates and public buildings should be designed to be served bydistrict heating and small-scale CHP. Local councils can exert influence on this through planning rules backed upby the issue of planning policy advice from the Government. The potential energy savings of this are not includedin this report, but such savings are likely to be substantial.

16
Electrical equipment – scope for energy efficiency3.56 As an important part of the problem, this report briefly reviews IT equipment. In 1994 this accounted for 7%of all the electricity used by public/commercial buildings. The proportion has risen since then but it is not clear byhow much.
3.57 Large personal computers (PCs) can easily consume 150 watts when they are switched on and not in use. Ifsuch a PC is left on all the time, which sometimes happens, it will consume more primary energy than a smallfuel-efficient car and emit nearly as much CO2. This is not widely-known. One effective move is to give workerslaptop PCs. They use around 90% less electricity than desktop PCs. Some laptop TFT colour screens use only 10watts. Although laptops can have less computing power or fewer features, they also have advantages:
1. Enhanced mobility, so workers no longer need a separate PC at home;2. Laptops work for a few hours after the start of a power cut, so work can continue while PCs are
progressively shut down;3. LCD screens emit no ionising radiation;4. LCD screens emit less heat, which may reduce eyestrain;5. The mobility of laptops makes them more prone to theft, but if need be workers can lock laptops inside
desks as an extra precaution, making them more secure than desktops.
3.58 Pacific Gas & Electricity (PG&E) gave most of its staff laptop PCs in the early 1990s. At that time, energyefficiency activity was at its peak. PG&E was the largest private electric utility in California.
3.59 The other option is to use special software on desktop PCs and modify them to use less electricity. Most PCssold today have automatic electricity-saving controls to meet the Energy Star standard, which was developed bythe US Environmental Protection Agency but has spread worldwide.
3.60 Many desktop PCs in the corporate workplace have the Energy Star features disabled by the company’s ITdepartment. Energy Star is incompatible with Windows NT. Many PCs display “screen-savers” when not in use -on anecdotal evidence, 50% or more of them do. The name screen-saver is misleading; PCs in this stateconsume electricity at full power.
3.61 If, for some special reason, laptops are not applicable, the best option is to implement commercially-available software packages which shut down systems when needed, even if the PCs are networked. Theseautomatic “power down” systems can be applied to all desktop PCs, but they are unlikely to save more electricitythan Energy Star controls would have saved, had they been enabled.
Policy initiatives
3.62 There is a case for mass-producing laptop PC technology in its entirety and incorporating it into all desktopPCs, but this is only likely to happen if a large number of public authorities demand such machines. Individualsand small businesses lack the buying power to shift the market.There are some common objections to laptops. These include limited features, small hard disks and inferiorkeyboards. These do not seem to be intrinsic deficiencies - rather, many producers deliberately made laptopssmaller to appeal to their perceived niche market.
3.63 Besides efficient PCs, government also needs to procure energy-efficient photocopiers, printers, telephonesystems, etc. It should only be buying equipment which has a low standby electricity consumption. An informalstandard has attracted attention in countries like Germany, the Netherlands, Switzerland, Sweden and the USA,that electronic devices on standby should consume no more than 1 watt. There is no legislation yet but there arevoluntary agreements in countries such as Switzerland. In 2000 the US Federal Government passed an ExecutiveOrder to require government departments to purchase electrical equipment using a maximum of 1 watt when onstandby.
Improving all electrical equipment should be seen as a big part of improving the energy efficiency of public sectorbuildings and in reversing the upward trend in electricity consumption. Success in this effort by local governmentwill be recorded on the electricity meters of town halls, police stations, etc.
17
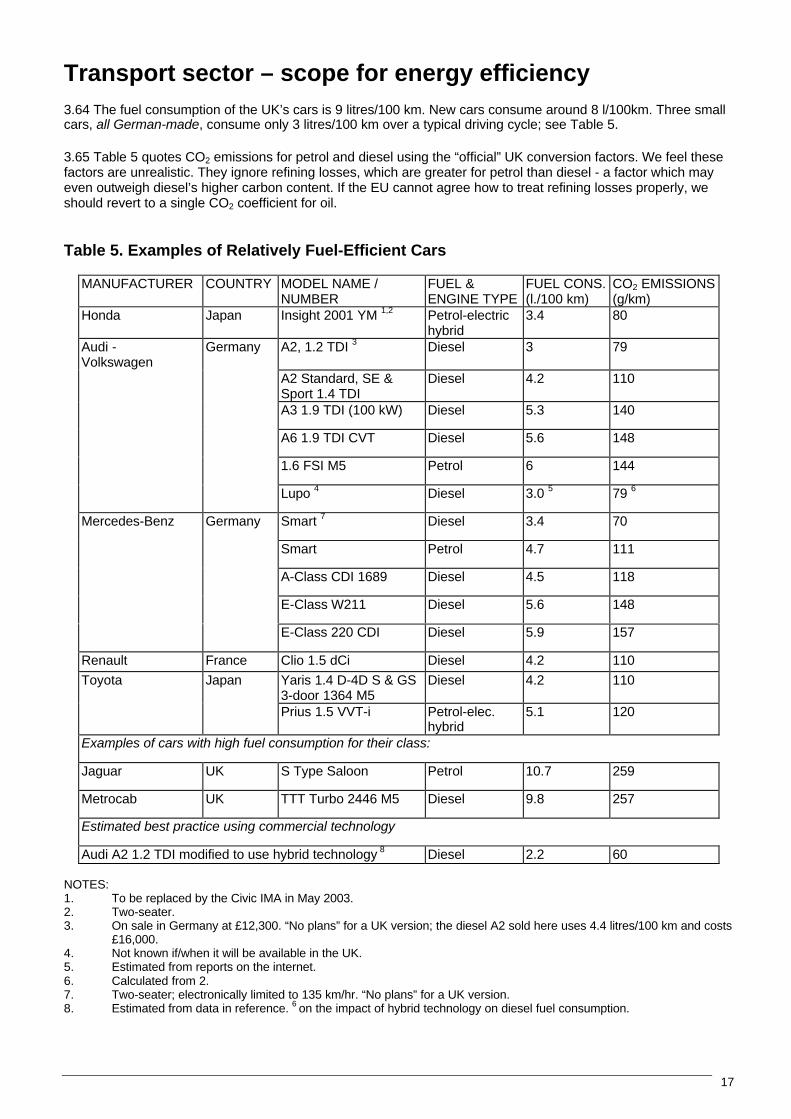
Transport sector – scope for energy efficiency3.64 The fuel consumption of the UK’s cars is 9 litres/100 km. New cars consume around 8 l/100km. Three smallcars, all German-made, consume only 3 litres/100 km over a typical driving cycle; see Table 5.
3.65 Table 5 quotes CO2 emissions for petrol and diesel using the “official” UK conversion factors. We feel thesefactors are unrealistic. They ignore refining losses, which are greater for petrol than diesel - a factor which mayeven outweigh diesel’s higher carbon content. If the EU cannot agree how to treat refining losses properly, weshould revert to a single CO2 coefficient for oil.
Table 5. Examples of Relatively Fuel-Efficient Cars
MANUFACTURER COUNTRY MODEL NAME /NUMBER
FUEL &ENGINE TYPE
FUEL CONS.(l./100 km)
CO2 EMISSIONS(g/km)
Honda Japan Insight 2001 YM 1,2 Petrol-electrichybrid
3.4 80
Audi -Volkswagen
Germany A2, 1.2 TDI 3 Diesel 3 79
A2 Standard, SE &Sport 1.4 TDI
Diesel 4.2 110
A3 1.9 TDI (100 kW) Diesel 5.3 140
A6 1.9 TDI CVT Diesel 5.6 148
1.6 FSI M5 Petrol 6 144
Lupo 4 Diesel 3.0 5 79 6
Mercedes-Benz Germany Smart 7 Diesel 3.4 70
Smart Petrol 4.7 111
A-Class CDI 1689 Diesel 4.5 118
E-Class W211 Diesel 5.6 148
E-Class 220 CDI Diesel 5.9 157
Renault France Clio 1.5 dCi Diesel 4.2 110
Toyota Japan Yaris 1.4 D-4D S & GS3-door 1364 M5
Diesel 4.2 110
Prius 1.5 VVT-i Petrol-elec.hybrid
5.1 120
Examples of cars with high fuel consumption for their class:
Jaguar UK S Type Saloon Petrol 10.7 259
Metrocab UK TTT Turbo 2446 M5 Diesel 9.8 257
Estimated best practice using commercial technology
Audi A2 1.2 TDI modified to use hybrid technology 8 Diesel 2.2 60
NOTES:1. To be replaced by the Civic IMA in May 2003.2. Two-seater.3. On sale in Germany at £12,300. “No plans” for a UK version; the diesel A2 sold here uses 4.4 litres/100 km and costs
£16,000.4. Not known if/when it will be available in the UK.5. Estimated from reports on the internet.6. Calculated from 2.7. Two-seater; electronically limited to 135 km/hr. “No plans” for a UK version.8. Estimated from data in reference. 6 on the impact of hybrid technology on diesel fuel consumption.

18
3.66 There was an 18% decline in the UK’s fuel consumption per car-km. from 1970 to 1995. This isdisappointing. Back in 1976, cars with a fuel consumption of 3 l./100 km were on the drawing board and ready formarket. Over 25 years later, these cars have not been launched here - only in Germany.
3.67 There is a voluntary agreement between EU governments and car makers to improve new cars to 140 g/kmof CO2 by 2008. The agreement amounts to about a 2.5%/year improvement in fuel efficiency for the whole EU.But our informal surveys suggest that many UK new “mass market” cars consume 8 l./100 km of fuel and emitover 180 g/km of CO2, making us sceptical about the UK’s role in this progress.
3.68 We suspect that long-term technologies like hydrogen fuel cells are being used as a smokescreen forinaction today on super-efficient diesel and petrol hybrid cars. These hybrid cars can run on petrol-alcohol ordiesel-vegetable oil blends, offering a smooth and easy transition to renewables.
3.69 Why do the German producers of these “3 litre” cars decline to supply the UK market? Perhaps they believethat the UK has no interest in fuel efficiency. We admit that the Deputy Prime Minister’s choice of car tends tosupport this view! See the entries near the bottom of Table 5.
3.70 Even within the limitations of the UK market, though, big improvements are possible. The fuel consumptionof BT’s fleet of vehicles fell by 9.8% between 1996 and 2000 while vehicle-km rose. To “do its bit”, BT boughtfuel-efficient vehicles and implemented knowledge on topics as diverse as low rolling resistance tyres, syntheticlubricants, driving habits et al. Its improvement continues.
Policy initiatives
3.71 Public authorities today could procure the most fuel-efficient cars and vans on the market for their fleets. Byagreeing to purchase sufficient volumes, they could possibly press German companies to make their “3 litre” carsin RH drive. It is reasonable to require a 45% reduction now in the fuel consumption of new cars and steadyimprovements thereafter; see Table 6.
Table 6. Proposed Average Fuel Consumption, Public Sector Car Purchases
YEAR AVERAGE FUEL CONSUMPTION RELATIVE ENERGY INTENSITY
2003 4.5 litres/100 km 0.50
2005 3.5 litres/100 km 0.39
2010 3.0 litres/100 km 0.33
2015 2.5 litres/100 km 0.28
NOTES:1. Fuel consumption over a mixed urban/rural driving cycle.2. Relative energy intensity compared to the UK stock of cars, not new cars.
3.72 We were unable to find out exactly what percentage of UK cars and light vans are owned or leased by publicauthorities. In the absence of these statistics, we have made a working assumption of 10% of cars and we haveneglected vans. Examples of public sector vehicles include police cars and vans, the central government car fleet,university and local government vans and so on.
3.73 It is assumed that these fleets will be fully replaced within five years. By 2020, this market sector will then bedriving cars that use 2.5 litres per 100 km. Before 2010, vehicles procured by the public sector in 2003-04 will beon the second-hand market and saving fuel for subsequent owners, who may be even more concerned about fueleconomy than buyers of new cars - used car owners normally pay more in fuel costs than in depreciation.

19
3.74 Many medium-sized diesel cars in Table 6 and on the government website www.vca.gov.uk consume 40-50% less fuel than a London taxi-cab and emit 80-90% less particulates. Councils should encourage taxidrivers - they license them - to replace current fleets by clean diesel cars and should assess the feasibility ofsetting a CO2 reductions target as a licensing condition. We also suggest that the London congestion chargeshould exempt, or make concessions to, cars with low CO2 emissions (urban/cold driving cycle).
3.75 We have evaluated fuel savings on the basis of the total fuel consumed by cars and taxis; see Table 2. Weassume that even in a business-as-usual scenario fuel consumption would fall linearly by 20% by 2020 - slightlyabove the pace of the last 25 years - and we deduct this from our saving. The procurement of more efficientmodels then leads to fuel and CO2 savings as in Table 7.
Table 7. Road Vehicle Fuel Savings.
YEAR DELIVERED ENERGY TWh/year CO2 (M tonnes/year)
2005 3.3 0.8
2020 34.4 7.9
NOTES:1. Assumes public sector purchases do not influence purchases of other new cars;2. Assumes a mean vehicle life of ten years;3. Based on 10% of the car fleet being influenced.
We can also start to make renewable fuels available to those who have to use cars and eliminate some bizarretaxation anomalies that have developed, three examples being:
1. Waste vegetable oil used in efficient diesel-engined cars pays nearly full excise duty;2. Non-renewable LPG used in inefficient petrol-engined cars pays reduced excise duty and the
conversions receive government grants;3. Electricity used in electric cars - which mostly comes from non-renewable sources - pays no
excise duty.
National savings
3.76 Table 8 sets out the savings arising from these three initiatives. The other proposed initiatives, for which wehave been unable to estimate a saving, are given later in Section 10.
Table 8. National Energy and CO2 Savings.
Sector EnergyCarrier
Delivered EnergySaving (TWh/year)
CO2 Saving (Mtonnes/year)
Initiative(s)
2005 2020 2005 2020
DWELLINGS Fossil fuel - 0.8 - 0.1 Tighter rules for RSLs; allow RSLsto provide appliances
Electricity - 0.2 - 0.1
PUBLICBUILDINGS
Fossil fuel 3.9 34.8 0.9 7.7 Improve existing public bldgs. to“good practice” by 2013
Electricity 0.5 4.7 0.2 2
TRANSPORT:Cars and light vans
Oil 3.3 34.4 0.8 7.9 Procure fuel-efficient cars forpublic sector fleets
TOTAL 8 74.9 1.9 15.7
NOTE:1. Assumes today’s CO2 coefficients for fossil fuel and electricity;2. Assumes that the fossil fuel saved in the domestic sector is gas.3. Potential CO2 savings from inproved energy efficiency of council housing stock not included.
20
A policy shift
History
3.77 For decades the UK has “sold” energy efficiency as a money-saving investment. This has sent a subtlesignal that energy efficiency is useful, but optional. The UK’s improvement in energy efficiency over the last 30years has been 1.8% per year, and not even this modest rate of progress quite represents a genuineimprovement, because part of it is due to the UK’s shift from manufacturing industry to services. Nor does the rateof improvement appear to have speeded up since 1990, when climate change first appeared as a serious threat.
3.78 What should we in fact be doing? We should be treating energy efficiency as an essential climate-savinginvestment, and designing our energy policy around it. Let us briefly examine UK energy trends since 1970. Overthese 30 years, our energy-to-GDP ratio fell to 0.57 of its initial value. But the growth in GDP outweighed the rateof increase in energy efficiency. So, despite making a steady but slow energy efficiency improvement, the UK’senergy consumption rose.
Future
3.79 Over the next three decades, suppose that we put energy efficiency at the heart of energy policy. Thismeans implementing policies which capture peoples’ imagination and financially rewarding the behaviour wewant; i.e., less CO2. The result could be that we more than double the rate of improvement in the energy/GDPratio, from 1.8% per year to 3.9%/year. If we achieve this, the energy/GDP ratio would fall to 0.30 of its presentvalue by 2030.
3.80 For the sake of argument, suppose that the UK economy grows as fast from 2002 to 2030 as it did in theperiod 1970-2000, as measured by GDP. On these assumptions, UK primary energy consumption over the next28 years would drop by 42%. If renewables contribute 30% of primary energy in 2030 then our energy-relatedCO2 emissions would drop to 40% of the present level. We assume that CO2 emissions from the UK’s non-renewable energy sources, measured in kg per kWh of primary energy, stay level.
International targets
3.80 Denmark’s official target is to cut national CO2 emissions by 60% by 2030 - very comparable to our UKscenario. Environmental groups want the Danish target to be 70%.
3.81 In September 2002 the German Environment Ministry released a study of the potential for energy efficiencyin which Germany’s energy-related CO2 emissions would fall by 80% by 2050. This would coincide with thenuclear phase-out which has been agreed in Germany.
Implementation
3.82 As other countries have found, energy efficiency needs not one big initiative but lots of small ones. It needs ahighly interdisciplinary effort. The reality of what happens is not just based on engineering and physics.Understanding peoples’ behaviour is also a matter of psychology and history.
3.83 If we wish to more than double the historic rate of improvement in energy efficiency we have to avoid re-inventing expensive wheels and making needless errors. To help us there is a wealth of experience from somecountries of what works and delivers “negawatts” fast, together with copious knowledge of what doesn’t work. Asa civil servant once put it, the technology isn’t rocket science!
3.84 In the last decade, Denmark, California and two other western US states, Washington and Oregon, havestabilised or decreased their per capita electricity consumption, despite economic growth. The UK has nevermanaged this. Why not? Because we have never treated electrical end-use efficiency as a serious rival to coal ornuclear power, only as an adjunct. Accordingly, utilities have never made it a business priority, despite manyefficiency measures being cheaper than the 2-3 p/kWh which it costs to run existing coal and nuclear plants.
3.85 Our institutional setup signals that energy efficiency ranks pretty low. Responsibility for policy is spreadamong DTLR, DTI, DEFRA, the Scottish Parliament and the Welsh Assembly. We see a more supportive

21
arrangement in the USA. The federal Department of Energy (DoE) provides support to state governments, someof which have programs of their own; funds public sector centres of excellence, e.g., the National RenewableEnergy Laboratory and Lawrence Berkeley National Laboratory and directly commissions reports on safe energyfrom private consulting engineers and other experts. DoE’s Office of Energy Efficiency and Renewable Energypursues the two key ingredients as an integrated whole.
3.86 In 2000 the Royal Commission on Environmental Pollution said that the UK should expand its energyefficiency R,D&D expenditure to the level of the USA, Germany and other developed countries which spend tentimes more per capita as a percentage of GDP 7. This has not happened.
3.87 In September 2002 the UK, alone among developed countries, declined to support the Sustainable BuildingsConference in Norway. The DTI issued a statement: “... There are successful schemes running and the need forinternational benchmarks is minimal”. In our opinion, most UK energy-efficient building projects are only“successful” if the international benchmarks are ignored; please refer to Table 3. Perhaps this is what the DTImeant!
3.88 UK policy measures need to be overhauled, not just expanded. While some existing programs may beinspired, many others are inept. The UK also has a tendency to change good programs for the worse; e.g., theEnergy Design Advice Scheme 1992-98 vis-a-vis its successors, and terminate programs before they have takeneffect.
3.89 Stability is part of the key to success. Stability comes once energy efficiency is treated as a subject whichreally matters. The policies and programs which are used to implement the more advanced energy efficiencystandards must be fine-tuned and sustained for years, even decades, before they will start to deliver large CO2
savings. Canada’s R-2000 Program began in 1980, it is still going and was recently extended to at least 2006.
R,D&D on Advanced Buildings
3.90 The Building Regulations are still widely thought of as “recommended” standards or even as “good practice”.They are the lowest building standard which is still legal and anyone who builds to a lesser standard could intheory go to prison! The government needs to write separate “good practice” energy efficiency standards in detail,or commission appropriate bodies to write them, then update them regularly so that they stay ahead of theBuilding Regulations.
3.91 These standards must be phrased in terms of measured energy performance, not predicted energyconsumption. When local authorities sell development land, they could then cite these standards in the salecontract and be sure that they are imposing an enforceable condition on the developer.
3.92 Higher energy efficiency standards must be the subject of government-led R,D,D&D (research, development,demonstration & dissemination) projects. The more advanced these projects are, compared to current BuildingRegulations, the more they need sufficient public funding to go ahead.
3.93 When, in 1998, UK parties attempted to implement the most advanced buildings (German Passive HouseStandard; energy consumption 10% of current UK practice) with 50% private funding, the private sector declinedto take part. We were left watching as Sweden, Germany, Switzerland, Austria and France went ahead. Canada’sC-2000 Program was another model of its kind, so was PG&E’s ACT3 Program in the USA; both showed the needfor a more hands-on approach to energy-efficient buildings.
3.94 Historically the UK government has issued leaflets and brochures on “good energy efficiency practice” andleft it there, as though this guarantees that the relevant technology will be rapidly-replicated. Architects whodesign new public sector buildings say that these government leaflets count for little with their clients, who stillassert that energy efficiency costs a lot and is irrelevant to their project(s). If we do not address this prevailingmindset, many glossy government leaflets will continue to be printed but building energy consumption, asrecorded on the gas and electricity meters, will continue to rise.

22
Recommendations3.95 Table 9 has a full list of possible actions for different branches of the public sector to take.
Table. List of Possible Public Sector Initiatives.
Buildings Central government Local government
1. Procure its new buildings to higherenergy efficiency standards. Use its ownDesign Advice scheme on all newbuildings and refurbishments.
1. Procure its new buildings to higher energyefficiency standards. Use central government’sDesign Advice scheme on all new buildings andrefurbishments.
2. Bring up its existing building stock to“best practice” within a decade.
2. Improve its existing building stock to “bestpractice” within a decade.
3. Impose similar energy efficiencyrequirements on any developmentland which it sells.
3. Impose similar energy efficiency requirementson any development land which it sells.
4. Advise NHS, universities and collegesto do the same as 1,2&3 1.
4. Advise its police authority to do the same as1,2&3 2.
5. Instruct government agencies torequire higher standards in the manybuildings which they financially support.
5. Provide more support and encouragement inits own planning policy for self-builders.
6. Extend Design Advice to smallerbuildings.
6. Commission outstanding research; e.g.,survey the true energy performance (utility bills)of a large random sample of modern housing.
7. Instruct Government agencies toincorporate district/community heatingand combined heat and power systemsin public buildings, and issue planningguidance to local authorities to mandatedistrict heating for new housing estates
7. Use the planning approval system to pressuredevelopers of new housing estates and publicbuildings to install community heating systemswhich can be connected to combined heat andpower plant.
8. Organise combined heat and power schemescovering existing buildings and local industry
Vehicles 1. Buy energy-efficient cars and vans forits own fleet.
1. Buy energy-efficient cars and vans for its ownfleet.
2. Change MPs’ travel expenses system3.
2. Ensure that its own travel expenses systemdoes not favour [or penalises] “gas-guzzlers”.
3. Pressure taxi drivers to buy more fuel-efficientcars through the licensing system
ElectricalEquipment
1. Buy energy-efficient electrical officeequipment for its buildings.
1. Buy energy-efficient electrical office equipmentfor its own buildings.
2. Advise NHS, universities and collegesto do the same.
2. Advise its police authority to do the same.
NOTES:
1. The UK has a system of central government funding for public bodies such as universities, colleges and the NHS. Ifdevelopers are forced to build to higher standards, central government may need to compensate these institutions for atemporary loss in land value before the required energy-efficient construction becomes widespread and cheap. This point hasnot been studied in detail.2. UK police forces are part of local government.3. Currently MPs with larger-engined cars can claim expenses at higher rates.
3.96 As is made clear in the next section, there is nothing even vaguely resembling an infrastructure that willenable effective training for and implementation of energy efficiency. However, officers of the Building ResearchEstablishment and the Energy Saving Trust can advise on various practical issues of energy efficiency.
23
Recommendations for Political Action3.98 Central to the achievement of all these recommendations is the development of a programme of appointingenergy efficiency personnel and ensuring that thorough training in energy efficiency is given to appropriatepersons in all institutions that order energy using equipment and which procure new buildings and refurbishexisting buildings. Many years ago the Audit Commission recommended that 10 per cent of all energy spendingbe allocated for investment on energy conservation and that for every million pounds worth of spending thereshould be one full time employee organizing energy efficiency.
3.99 These recommendations have never been implemented, and moreover even these recommendations arewoefully inadequate for the sort of programme envisaged in this report. We believe that a minimum of threepersons per million pounds per annum of energy spending is necessary. These persons would be part situated ininstitutions such as local authorities and part situated even closer to the ground in places like individual schoolsand hospitals, albeit part time in the case of smaller units such as schools or social care facilities which do notspend sufficient amounts on energy to warrant a full time energy efficiency worker.
3.100 What does this mean in practical activities? The Government needs to have a well-resourced best practiceenergy efficiency office in each of its Departments. This needs to a) produce regularly updated guidance onenergy efficiency measures to be adopted through purchase of energy using equipment, new buildings andrefurbishment and re-tooling of existing facilities b) Co-ordinate, with the Treasury at the hub, the incorporation ofenergy efficiency considerations into every aspect of Governmental and government-related activity. c) Forexample, in the schools sector, the Department for Education and Science energy efficiency office would organizea national training programme appropriate for local authority energy efficiency officials, architects who designschools and teachers in schools. At least one teacher in each school should have (paid, part time) responsibilityfor advising the Head Teacher on energy efficiency. They will be trained in the details of ordering the most energyefficient equipment, whether they be computer systems, photocopiers, and liaising with architects about energyefficiency in building developments. Schools will be able to access funds for investment in energy savingmeasures (e.g. lighting or heating controls) from ‘top sliced’ funds held by the local authority and managed bytheir energy efficiency offices.
3.101 The Government needs to set up a specific performance indicator for energy efficiency in local authorities.Extra money needs to be allocated to local authorities for energy efficiency. Money for investment in energyefficiency needs to be top-sliced from local authority budgets and there needs to be a energy efficiency officehoused in the Treasury itself responsible for co-ordinating energy efficiency activities. There needs to be a cabinetsub-committee established to ensure co-ordination between energy efficiency units which need to be establishedin every Government department. Existing institutions such as the Building Research Establishment and theEnergy Saving Trust will have a vitally important role in these processes and their expertise will be expanded toprovide intelligence for the training services and programme evaluations conducted by the Treasury and othergovernmental departments.
3.102 Of course greater central activity is only one side of the coin. There also needs to be greaterdecentralization with financial incentives being built into systems so that local units benefit directly from achievingenergy savings. Local authorities need greater planning powers to enable them to insist on energy efficientpractices. For example, planning authorities need to insist that new housing estates are built using district heatingand combined heat and power, a measure that is not accounted for in this report but which would deliversignificant savings of natural gas and carbon dioxide emissions. At the same time there needs to be an overhaulof British heating engineering training to bring it up towards standards and practices in countries likeDenmark,The Netherlands, Sweden and Germany.
3.103 It cannot be stressed too strongly that pale reflections of such schemes are no more than token gestures.Sticking up posters urging people to turn off lights, turn down the heating (British buildings already being amongthe coldest in Europe) and even (as had been done to a limited extent in some local authorities) having peoplecounting energy used is, on its own, of little or no value. As suggested above, knowledge about energy efficiencypractices need to be routinised in everyday equipment ordering and building development. Investment in energyefficiency needs also to be routinised in all purchases, building and planning decisions.
3.104 Looking wider than this, basic and regularly updated training needs to be afforded to all personnel involvedin making energy equipment/infrastructural decisions. Some professions, such as architects, builders, electricalcontractors and many others need especial attention. Universities have a great role to play in the upgrading ofenergy efficiency training. National vocational, A Level and GCSE qualifications (especially those relating toCDT) need to pay greater emphasis to energy efficiency techniques.
3.105 In addition, the building procurement program of many public bodies needs to be urgently made moreintegrated, and less dysfunctional, with the objective that energy efficiency issues are considered sensibly and

24
coherently throughout the inception, design and construction process of a new building and thereafter. There is nocost associated with this if the design process is properly-integrated so that effective communication takes placebetween clients, design teams and builders. According to the January 2003 report on schools from the NationalAudit Office, on average the PFI process has reduced the build quality of new schools - and probably theirenergy efficiency too - taking us in exactly the opposite direction from that in which we need to go.
3.106 We would anticipate that most of these changes in training, personnel, equipment and buildingsprocurement policies can be transferred to the private sector, something which is not covered in this report. Onemeasure is use of procurement agreements whereby companies with extensive contracts with Government agreeto energy efficiency strategies similar to those being organized in the public sector. Hence, for example, companycars and other energy using equipment could become more energy efficient. Such action will have knock-oneffects for the rest of the economy as market pressure generally raises the energy efficiency of energy usingequipment that is available of the market. These strategies can be amplified further by the adoption of moreregular updating of, for example, the EU refrigerator energy labeling and minimum energy efficiency standardsschemes.
Conclusions3.107 There is a large scope for the public sector to “do its bit”. Three steps are listed which could save around1.9 M tonnes per annum of CO2 emissions by 2005 and 15.7 M tonnes/annum by 2020. Extension of thesepractices into the 74 per cent of the energy economy (the private sector) not covered by this report private sectorshould extend these savings to much more than 25 M tones/annum by 2020.
3.108 The government is responsible for setting new background conditions which favour a low-carbon future.These include a fundamental policy shift from investment in energy supply to investment in energy efficiency,coupled with institutional reforms so that people participating in this move face as easy a path as theircounterparts on mainland Europe. Only after setting the stage in this way can the government justifiably demandthat the private sector plays its role in securing a safe energy future.
3.109 The UK has limited local government powers, and they are still being reduced, so more responsibility forpublic sector action rests with central government than it does in countries with more devolved constitutions; e.g.,the USA, Germany, Italy and Switzerland. Yet, after reading this report, those in local government should be ableto see many initiatives that they can take without reference to Whitehall. That having been said, Whitehall needsto ‘get its act into gear’, and fast. It is doubtful whether all of the Government’s present targets will be met withoutmore emphasis on appointment of staff at all levels (from grass roots to every Government Department) toorganize energy efficiency, plus ring-fenced investment in energy efficiency and training programmes. Thereneeds to be a thorough overall of all Governmental policy levers to ensure that energy efficiency is takenseriously. We are already well behind Denmark and Germany in practical (if not rhetorical) terms. There needs tobe comprehensive training programmes for all those in the public sector who order equipment of buildings usingenergy.
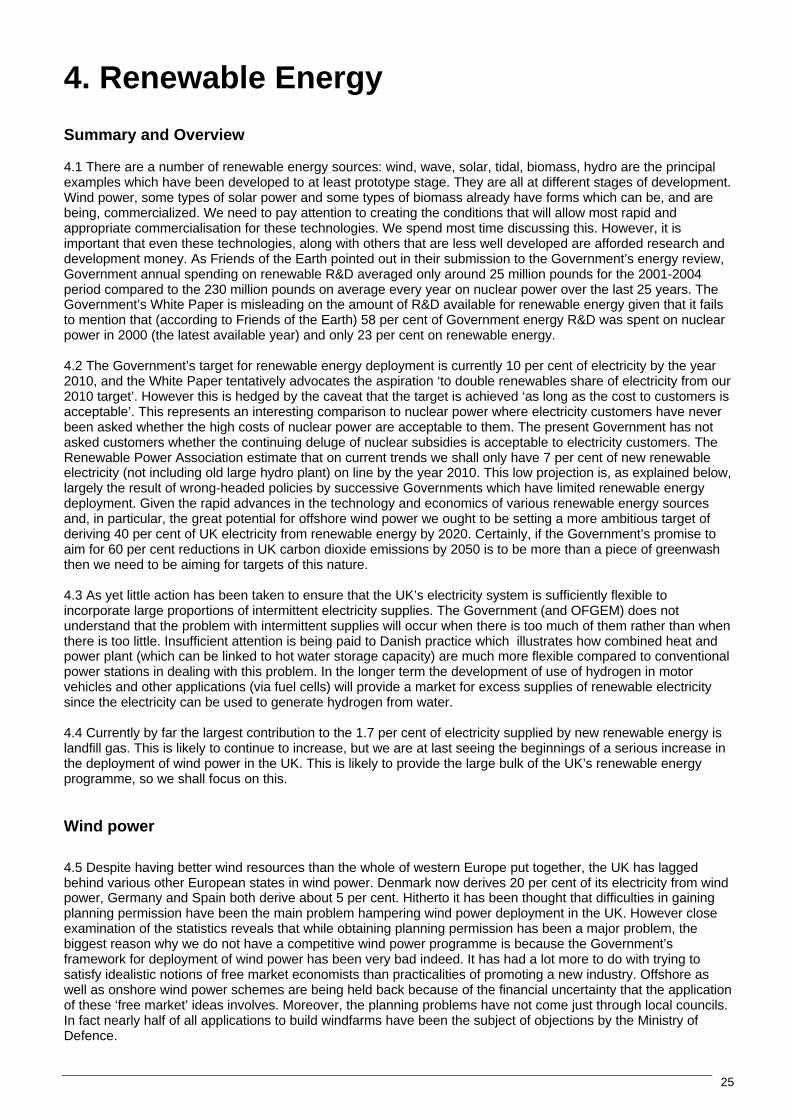
25
4. Renewable Energy
Summary and Overview
4.1 There are a number of renewable energy sources: wind, wave, solar, tidal, biomass, hydro are the principalexamples which have been developed to at least prototype stage. They are all at different stages of development.Wind power, some types of solar power and some types of biomass already have forms which can be, and arebeing, commercialized. We need to pay attention to creating the conditions that will allow most rapid andappropriate commercialisation for these technologies. We spend most time discussing this. However, it isimportant that even these technologies, along with others that are less well developed are afforded research anddevelopment money. As Friends of the Earth pointed out in their submission to the Government’s energy review,Government annual spending on renewable R&D averaged only around 25 million pounds for the 2001-2004period compared to the 230 million pounds on average every year on nuclear power over the last 25 years. TheGovernment’s White Paper is misleading on the amount of R&D available for renewable energy given that it failsto mention that (according to Friends of the Earth) 58 per cent of Government energy R&D was spent on nuclearpower in 2000 (the latest available year) and only 23 per cent on renewable energy.
4.2 The Government’s target for renewable energy deployment is currently 10 per cent of electricity by the year2010, and the White Paper tentatively advocates the aspiration ‘to double renewables share of electricity from our2010 target’. However this is hedged by the caveat that the target is achieved ‘as long as the cost to customers isacceptable’. This represents an interesting comparison to nuclear power where electricity customers have neverbeen asked whether the high costs of nuclear power are acceptable to them. The present Government has notasked customers whether the continuing deluge of nuclear subsidies is acceptable to electricity customers. TheRenewable Power Association estimate that on current trends we shall only have 7 per cent of new renewableelectricity (not including old large hydro plant) on line by the year 2010. This low projection is, as explained below,largely the result of wrong-headed policies by successive Governments which have limited renewable energydeployment. Given the rapid advances in the technology and economics of various renewable energy sourcesand, in particular, the great potential for offshore wind power we ought to be setting a more ambitious target ofderiving 40 per cent of UK electricity from renewable energy by 2020. Certainly, if the Government’s promise toaim for 60 per cent reductions in UK carbon dioxide emissions by 2050 is to be more than a piece of greenwashthen we need to be aiming for targets of this nature.
4.3 As yet little action has been taken to ensure that the UK’s electricity system is sufficiently flexible toincorporate large proportions of intermittent electricity supplies. The Government (and OFGEM) does notunderstand that the problem with intermittent supplies will occur when there is too much of them rather than whenthere is too little. Insufficient attention is being paid to Danish practice which illustrates how combined heat andpower plant (which can be linked to hot water storage capacity) are much more flexible compared to conventionalpower stations in dealing with this problem. In the longer term the development of use of hydrogen in motorvehicles and other applications (via fuel cells) will provide a market for excess supplies of renewable electricitysince the electricity can be used to generate hydrogen from water.
4.4 Currently by far the largest contribution to the 1.7 per cent of electricity supplied by new renewable energy islandfill gas. This is likely to continue to increase, but we are at last seeing the beginnings of a serious increase inthe deployment of wind power in the UK. This is likely to provide the large bulk of the UK’s renewable energyprogramme, so we shall focus on this.
Wind power
4.5 Despite having better wind resources than the whole of western Europe put together, the UK has laggedbehind various other European states in wind power. Denmark now derives 20 per cent of its electricity from windpower, Germany and Spain both derive about 5 per cent. Hitherto it has been thought that difficulties in gainingplanning permission have been the main problem hampering wind power deployment in the UK. However closeexamination of the statistics reveals that while obtaining planning permission has been a major problem, thebiggest reason why we do not have a competitive wind power programme is because the Government’sframework for deployment of wind power has been very bad indeed. It has had a lot more to do with trying tosatisfy idealistic notions of free market economists than practicalities of promoting a new industry. Offshore aswell as onshore wind power schemes are being held back because of the financial uncertainty that the applicationof these ‘free market’ ideas involves. Moreover, the planning problems have not come just through local councils.In fact nearly half of all applications to build windfarms have been the subject of objections by the Ministry ofDefence.

26
4.6 As the Table 1 below shows, the majority of windfarms planning applications determined in the UK haveachieved planning approval. The best result has been in Scotland and Northern Ireland, the worst in Wales.
4.7 The amount of wind power capacity given planning approval in England would have exceeded the amount ofcapacity refused approval if just one particular proposal for a large windfarm planned in Northumberland had notbeen vetoed by the Ministry of Defence! Strangely, in Germany, Denmark and Spain there are virtually noexamples of windfarms being successfully rejected by the military authorities. Is their radar better than ours? Areour pilots less good at avoid wind turbines? (How do they fare with hills and tall trees?) The White Paper promisesto ‘simplify procedures for accommodating our national security needs’ and that the MOD should explainproblems of siting windfarms in particular places. However there is no commitment to establish an independentmeans of assessing the claims made by the military about specific cases (as exists in other countries). Hence theMOD can continue to exercise an effective veto on wind farm planning applications without having their claimssubjected to independent adjudication.
4.8 We can see in Table 1 below that the Non-Fossil Fuel Obligation (NFFO) schemes, have, since 1994 onlybrought on line around a quarter of the schemes in terms of capacity of the contracts awarded. However, over halfof the capacity has never resulted in any planning applications because the proposed windfarms wereuneconomic. This was a consequence of the competitive bidding mechanisms that drove developers to bidunrealistically low bids in terms of electricity prices that they would be paid for their output. The competitiveprogramme had the effect of generating large amounts of capacity from very cheap, large schemes that existedonly in fantasyland.
Table 1
All wind power Planning Outcomes for the UK for NFFOs 3/4/5, SROs 1/2/3 and NI NFFO
Planning consentgranted
Planning consentrefused
No applicationpursued
MW (DNC) 215 206 589Number of schemes 81 55 108Average size (MWDNC)
2.7 3.7 5.5
Source: RENEW magazine
Notes: A. Figures are in ‘declared net capacity’ (DNC) which is counted as 43 per cent of installedcapacity to make a comparison with the output of non-intermittent conventional plant. B. I haveinsufficient data on planning outcomes of NFFO 1and 2 to include them in this table. 61 MW (DNC) outof 97 MW (DNC) worth of wind power contracts were commissioned in these tranches
4.9 Although the new ‘Renewables Obligation’ mechanism removes many of the constraints on developers its freemarket in ‘renewable certificates’ means that there is great uncertainty over the amount of money wind powerproducers will be paid in the future. This is an intolerable situation given that conventional gas power developershave 15 year contracts.
4.10 This uncertainty over future income is an even bigger problem for offshore wind power than onshore windpower because of the greater expense involved in developing a given capacity of offshore compared to onshorewind power. Yet the offshore wind power resource is especially large. A report written by AEA Technology forGreenpeace demonstrated how a quarter of the UK’s electricity demand could be supplied merely using offshorewindfarms based off East Anglia. The cost calculated for this would be less than half of what it would cost, basedon Sizewell B’s costs, to supply an equivalent amount of electricity from nuclear power. Offshore wind power isa vitally important resource that must be speedily exploited. On the other hand onshore wind power,which is becoming especially cheap, can be much more effectively developed with a better constructedand co-ordinated programme.
4.11 So it seems that the biggest constraint on wind power development continues to be the priority that NewLabour gives to free market economics compared to the priority of bringing sustainable energy systems on line.Renewable energy developers need certainty about what they will receive in income in the future. That is how thebig programmes have been developed in Denmark, Germany and Spain. Given that the type of payment systemand the issue of the Ministry of Defence opposing wind power schemes are both Government matters we can

27
quite safely say that the bulk of the problems faced by the renewable energy industry have been created by HerMajesty’s Government itself.
4.12 One thing that has been lacking in the UK is community ownership of wind power. In Denmark and Germanythere are many owners of shares in wind turbine companies. This means that the wind power industry can rely ona large ‘army’ of supporters out in the country who can argue for the industry and offset the claims of those whodo not like wind power. However in the UK, the shares are owned by major power companies and banks, so it ismore difficult to mobilize political support even though wind power is supported by the large majority of people inthe UK.
4,13 The Government should offer minimum fixed prices for electricity from wind power schemes. Plannersshould encourage schemes which will have high levels of community ownership. Local authorities can helpdevelop renewable energy by agreeing long term supply contracts with renewable energy projects, thuscircumventing the problem of uncertainty over income for wind power and other schemes. Information oncompanies willing to help is available from the Renewable Power Association and the British Wind EnergyAssociation.
4.14 On the planning level local authorities can make things easier for proposers of wind power and otherrenewable energy schemes. They can do this by stipulating areas where wind power schemes can be sitedaccording to the local plan (of course with an emphasis on where wind power is mosttechnically and economically feasible). In the past local authorities have, in their structure plans, merely indicatedwhere wind power schemes are not suitable. Planning authorities could also encourage developers to offersignificant proportions of the shares in the schemes to local investors.
Other renewables
4.15 Solar photovoltaics (PV), wave power and offshore tidal power are all electricity technologies that needresearch and development support. However, this should be support that leads to actual deployment that pavesthe way for commercial development rather than desk top studies. Solar thermal (heating water) needs to begiven more consistent support and tax incentives. Despite the wide number of designs available for wave powerdevices, development of this technology proceeds at a painfully slow pace because of lack of funds. Meanwhilebillions of euros are have been, and continue to be, poured into fusion research without producing any device thatis even remotely close to commercialization.
4.16 Solar PV in fact is already gaining access to various ‘niche’ markets, and the Greater London Authority hasbeen considering various ways of promoting PV and other renewable sources. One approach, pioneered byMerton Council, is to insist that 10 per cent of the buildings energy needs should come from renewable energy.This encourages developers to use solar PV as a finishing rather than equally expensive finishings like marble.Another activity which should be pursued is to use solar PV to power lighting and other energy systems that maybe too expensive to connect to the local grid, for example, lighting on bus shelters or in parks.
4.17 To make much greater use of solar power, the Green Party advocates the inclusion of solar panels asmandatory in all new buildings. Green Party Councillors are pressing for this to be implemented through theplanning machinery with developers having the option of installing either solar photovoltaic or solar thermalsystems.
28
REFERENCES AND BIBLIOGRAPHY
i. David Olivier, BSc MInstE MASHRAE, is Principal of ENERGY ADVISORY ASSOCIATES, 1Moores Cottages, Bircher, Leominster, Herefordshire HR6 0AX. Tel: (01568) 780868. E-mail:[email protected] Web: www.EnergyAdvisoryAssociates.co.uk. DavidOlivier has written the large majority of the material in the section on Energy Efficiency.
ii. Dave Toke, B.A., PGCE. M.Soc.Sci, PhD is a lecturer in politics and sociology at the University ofBirmingham. He is author of two books on energy and the environment and he is currentlyengaged in a programme of research into accounting for factors that influence the planningoutcomes of wind power schemes. E-mail: [email protected]
iii. Department of Environment, Transport and the Regions, (2000) ‘Climate Change – The UKProgramme’, London: HMSO, see Section 2 in particularhttp://www.defra.gov.uk/environment/climatechange/cm4913/pdf/section2.pdf
1. Energy Paper 66, Energy Consumption in the UK. ISBN 0-11-515439-6. DTI (1997).
2. D. Olivier, J. Willoughby et al, Review of Ultra-Low-Energy Homes. Published by BRECSU asGeneral Information Reports (1996). Available free from (01923) 664258 [email protected]
3. D. Olivier, “Building in Ignorance”. For Energy Efficiency Services for Oxfordshire. Published byAssociation for the Conservation of Energy (October 2001). Downloadable from www.ukace.org
4. Proposals for Amending the Energy Efficiency Provisions. A Consultation Paper issued by theBuilding Regulations Division, DETR (2000)."
5. Anon, “Environmentally-Smart Buildings: A Quantity Surveyor’s Guide to the Cost-Effectiveness ofEnergy-Efficient Offices”. Good Practice Guide 274 (1999). Available free [email protected]
6. IEE Review (January 2003).
7. Royal Commission Environmental Pollution, The Changing Climate (2000). www.rcep.org.uk
8. “Biodiesel”, Env. Bldg. News, pp. 7- 14 (January 2003). www.buildinggreen.com
9. Malcolm Fergusson, Analysis for PIU on Transport in the Energy Review. Final Report. Institute forEuropean Environmental Policy, London (December 2001).www.strategy.gov.uk/2002/energy/report/working%20papers/Fergusson.pdf
![ASTRY GALVEZ RAMON GALVEZ - Belize Judiciary · 2020. 3. 24. · [12] There is some slight suggestion in Vidrine that a party’s contribution to the other party’s premarriage property](https://img.pdfslide.us/doc/110x75/5fe2207476b5b837b2321f74/astry-galvez-ramon-galvez-belize-judiciary-2020-3-24-12-there-is-some-slight.jpg)


![other tenant’s one party’s “[e]limination of a right of](https://img.pdfslide.us/doc/110x75/6231690a42f5350e346d7d3a/other-tenants-one-partys-elimination-of-a-right-of-.jpg)