Embed Size (px)
Citation preview

The Great Australian Dream: Density and Aspirations in Sydney
A global assessment of the relevance of aspirations in influencing spatial planning in cities
Laila Mehrpour
NAWIC 2012 International Women’s Day Scholarship White Paper

Abstract
Since the post war period, Sydney has experienced high levels of growth and subsequent low density urban sprawl. Today, the vast majority of the city is primarily a residential environment with a predominantly low density, detached housing form across much of the city. As a result, Sydney is experiencing a number of problems not uncommon to sprawling cities in general: declining and costly infrastructure, lack of affordable housing close to amenities and increasing economic segregation.
Despite the clear need for a more proactive and sustainable approach to housing, particularly in the context of Sydney’s wider aspirations of becoming a global city, the perception of continued demand for low density suburban housing is consistently cited as the primary obstacle to the provision of housing at higher, more sustainable densities. Higher density housing is widely viewed as an affront to the Great Australian Dream – the aspiration to own a house and land. This study reviews the continued relevance of the Great Australian Dream as a driver of housing development in Sydney.
The Great Australian Dream and the cultural contexts from which it emerged are examined against the theoretical framework of two opposing schools of thought – New Urbanism and New Suburbanism. Sydney’s macro aspirations (via the assessment of policy) to be a global city and micro housing aspirations (via geo-demographic segmentation) to determine the prevalence of the desire for the Great Australian Dream are assessed. The findings of these assessments are then used to examine four global cities, London, New York, Copenhagen and Detroit. The types of households perpetuating Sydney’s sprawl paradigm are identified as the control group for the purposes of this study. The equivalent types in each city are identified, and the particular types of housing in which they live, assessed.
The results of the study reveal equivalent types to the control group are present in every city, but detached housing to be at negligible levels in both London and New York, and to form a low percentage of the housing for the same types of households in Copenhagen. It was found that the housing choices made between the British and American populations are very different. A large proportion of New Yorkers were found to be equivalent types to Sydney’s control group, while they represented only a small percentage of Londoners, with the majority of these types choosing to live outside of the city confines. The findings demonstrate Sydney to be closer to the levels of detached housing and attitudes to housing as those found in Detroit. The table below shows the results of the housing forms of the control group equivalents in each city.
% control group
% of control group living in detached housing
% population in the control group and in detached housing
Sydney 43.20% 100% 43.20% London 8.28% 0.00% 0.00% New York City 58.64% 0.00% 0.00% Copenhagen 27.92% 22.17% 6.19% Detroit 65.37% 71.01% 46.42%
Containment was found to be the most important factor behind achieving successful smart growth mechanisms, in every case defined by either natural geographic containment, or an applied greenbelt. It is also found that while all of the proactively planned cities are focussed on delivering infrastructure to lower income neighbourhoods, there are still growing gaps between the top and bottom of the income scale. This was found to mainly be due to the escalation in the levels of wealth of those at the very top of the wealth scale due to the global exposure and opportunities in the cities in which they live. Overall, the Great Australian Dream in its current definition was found to be at best a redundant driver of development strategies, and at worst a destructive force for the longevity of the city. The Great Australian Dream needs to be redefined for future generations in the context of the city’s macro aspirations for its future to ensure its longevity and prosperity.

3 © Laila Mehrpour, NAWIC
ACKNOWLEDGEMENTS
There are many people to whom I am indebted for both their support and generosity with their time and
resources. Without them, the undertaking and completion of this research would have been impossible.
First and foremost, I wish to acknowledge and thank my family, particularly my mother and my late
father for their unfailing love, support and encouragement.
I wish to give my heartfelt thanks to my husband, Cameron Vella, who has been a constant source of
encouragement and support throughout the research, travel and writing process as well as my greatest
advocate.
My employer, Lend Lease, has been instrumental in allowing me the time required to explore this topic. I
particularly wish to thank Melissa Haigh for her friendship, encouragement and generosity with her
expertise and my mentor, Tony Brennan, for his vision, advocacy and support of both me and my
research.
I wish to thank the Interdisciplinary Design for the Built Environment (IDBE) course team at the
University of Cambridge, in particular Dr Sebastian Macmillan, for accepting me into the course and his
enthusiasm and encouragement which started me on this path.
My NAWIC IWD paper mentor, Anne Sutherland, for engendering a passion for this topic in me in the
first place and organising the invaluable time spent with Gehl Architects in Copenhagen and my Danish
contact, Anne Sophie Kvist of Gehl Architects, for providing an inspirational perspective into the Nordic
approach to planning and design.
The team at Mosaic Global in Nottingham, in particular Jayne Fleming, for generously supplying
valuable market data for the United Kingdom and Denmark, and making the leap in understanding the
potential impact of consumer segmentation on city planning.
Finally, I wish to thank NAWIC for giving me the opportunity and platform to explore a topic about which
I am truly passionate.

4 © Laila Mehrpour, NAWIC
CONTENTS
Abstract ................................................................................................................................................... 2
ACKNOWLEDGEMENTS ........................................................................................................................ 3
CONTENTS .............................................................................................................................................. 4
Figures and Tables ................................................................................................................................. 6
INTRODUCTION ...................................................................................................................................... 8
Methodology ............................................................................................................................................ 9
City selection process .......................................................................................................................... 10
Research ................................................................................................................................................ 11
CHAPTER 1 – THE GREAT AUSTRALIAN DREAM AND SYDNEY’S HOUSING QUANDARY ......... 13
Home Ownership and the Taxation System ....................................................................................... 14
Sydney’s Housing Quandary ............................................................................................................... 14
Affordability ........................................................................................................................................... 16
Income versus housing type ............................................................................................................... 16
CHAPTER 2 – THE THEORETICAL CONTEXT: NEW URBANISM AND NEW SUBURBANISM ....... 19
CHAPTER 3 – SYDNEY IN A GLOBALISING CONTEXT ..................................................................... 22
The role of government ........................................................................................................................ 23
Development in Greenfield areas ........................................................................................................ 24
Metropolitan Plan for Sydney .............................................................................................................. 25
Global Comparison ............................................................................................................................... 28
CHAPTER 4 – CONSUMER SEGMENTATION AND THE CONTROL GROUP ................................... 32
The control group ................................................................................................................................. 32
What is Mosaic? .................................................................................................................................... 32
How is Mosaic used? ............................................................................................................................ 33
Sydney’s Mosaic Profile ....................................................................................................................... 35
Identifying the control group - Methodology ...................................................................................... 37

5 © Laila Mehrpour, NAWIC
CHAPTER 5 – LONDON ........................................................................................................................ 40
Containment Objectives ....................................................................................................................... 40
London’s Mosaic Profile ...................................................................................................................... 41
CHAPTER 6 – NEW YORK .................................................................................................................... 43
New York’s Macro Aspirations ............................................................................................................ 43
Copenhagenising NYC ......................................................................................................................... 44
Urban Renewal ...................................................................................................................................... 44
New York’s Mosaic Profile ................................................................................................................... 46
CHAPTER 7 – COPENHAGEN .............................................................................................................. 48
Copenhagen’s Mosaic Profile .............................................................................................................. 51
CHAPTER 8 – DETROIT ........................................................................................................................ 54
CONCLUSION ........................................................................................................................................ 57
APPENDIX A – LONDON ...................................................................................................................... 61
APPENDIX B - NEW YORK AND DETROIT .......................................................................................... 63
New York ............................................................................................................................................... 63
Detroit .................................................................................................................................................... 70
REFERENCES ....................................................................................................................................... 71

6 © Laila Mehrpour, NAWIC
Figures and Tables
Figure 1.1 – Households by Income in Sydney ....................................................................................... 17
Figure 1.2 –Detached Housing in Sydney ............................................................................................... 17
Table 3.1 – Forecast Population Growth in Sydney’s subregions ........................................................... 23
Figure 3.1- Sydney’s Ten Subregions ..................................................................................................... 24
Figure 3.2 – Highest levels of detached housing in Greenfield development areas by LGA................... 25
Table 3.2 – Metropolitan Strategy Performance – Measures of Success ............................................... 26
Figure 3.3 – North Western and South Western Growth Centres in Metropolitan Sydney ..................... 27
Table 3.3 – Global Cities Index 2010 ...................................................................................................... 28
Table 3.4 – Characteristics of Global Cities ............................................................................................ 29
Figure 3.4 – Global Cities by Area and Density ...................................................................................... 31
Figure 4.1 – Mosaic Global Groups ........................................................................................................ 33
Table 4.1 – Mosaic Groups and Types by percentage for Sydney and Australia ................................... 34
Figure 4.2 – Sydney Basin Mosaic Map and Legend .............................................................................. 36
Table 4.2 –Mosaic Types most likely to live in detached housing ........................................................... 37
Figure 4.3 – Mosaic Types by distance from the city centre ................................................................... 37
Table 4.3 – Sydney’s control group by Mosaic Type .............................................................................. 38
Table 4.4 – Mosaic Global Look Up Table (Sydney’s control group Types highlighted) ......................... 38
Figure 5.1 – Greenbelt Strategy and areas of deficiency in access to nature in London ........................ 41
Table 5.1 – Mosaic UK Types of Sydney’s control group in London ....................................................... 42
Table 5.2 – Comparison of Sydney’s control group and London’s control group equivalents ................. 42
Figure 6.1 – The New York City High Line development ........................................................................ 45
Table 6.1 - Mosaic USA Types of Sydney’s control group in New York City .......................................... 46
Table 6.2 – Comparison of Sydney’s control group and New York’s control group equivalents ............. 47
Figure 7.1 – City Country Fingers and the Copenhagen Finger Plan ..................................................... 48
Figure 7.2 – Bike lanes in the northern fringe suburbs of Copenhagen .................................................. 49
Figure 7.3 – Recreation in Copenhagen is primarily carried out in public spaces ................................... 50
Table 7.1 – Mosaic Denmark Types of Sydney’s control group in Copenhagen ..................................... 51
Table 7.2 – Comparison of Sydney’s control group and Copenhagen’s control group equivalents ........ 51
Table 7.3 – Types of Housing for the Danish equivalents of Sydney’s control group ............................. 52
Table 7.4 – Dwelling stock by type of building – regional analysis (Denmark, 2009) .............................. 52
Figure 7.4 – Apartments in central Copenhagen .................................................................................... 53
Figure 8.1 – Detroit and its environs and the Detroit-Warren-Livonia MSA and Detroit-Warren-Flint CSA
................................................................................................................................................................ 54
Table 8.1 - Mosaic USA Types of Sydney’s control group in Detroit ....................................................... 55
Table 8.2 – Comparison of Sydney’s control group and Detroit’s control group equivalents .................. 56
7 © Laila Mehrpour, NAWIC
Figure 9.1 – Global Comparison of the control group in Sydney, London, New York, Copenhagen and
Detroit ..................................................................................................................................................... 58
Table A – Mosaic Global Look Up Table (Sydney’s control group highlighted) ...................................... 61
Figure A1 – Distribution Chart of percentage representation of Type B07 in the United Kingdom ......... 61
Figure A2 – Mosaic Data Chart – Type of Property ................................................................................ 62
Table B1 – Mosaic Global Look Up Table (Sydney’s control group highlighted) .................................... 63
Table B2 – Top Mosaic Types in Manhattan by Zip Code ...................................................................... 64
Table B3 –Top Types in Manhattan (Summary) ..................................................................................... 65
Table B4 – Top Mosaic Types in Queens by Zip Code ........................................................................... 66
Table B5 – Top Types in Queens (Summary) ......................................................................................... 67
Table B6 – Top Mosaic Types in Brooklyn by Zip Code ......................................................................... 67
Table B7 – Top Types in Brooklyn (Summary) ....................................................................................... 68
Table B8 – Top Mosaic Types in the Bronx by Zip Code ........................................................................ 68
Table B9 – Top Types in the Bronx (Summary) ...................................................................................... 68
Table B10 – Top Mosaic Types in Staten Island by Zip Code ................................................................ 69
Table B11 – Top Types in Staten Island (Summary) .............................................................................. 69
Table B12 – Top Mosaic Types in Detroit by Zip Code ........................................................................... 70
Table B13 – Top Types in Detroit (Summary) ......................................................................................... 70

8 © Laila Mehrpour, NAWIC
Introduction
The purpose of this paper is to assess the validity of the concept of the Great Australian Dream in
driving housing policy and development solutions in Sydney, the largest and oldest of the Australian
capitals. To date, the Great Australian Dream has had a significant role in defining the physical form of
Australia’s burgeoning urban capitals.
As with all of the country’s major urban capitals, Sydney has experienced consistently high levels of
growth since the post war period, which has manifested into widespread urban sprawl and increasingly
inadequate urban and transport infrastructure. Despite the changing needs of the city, particularly in the
context of its more recent wider aspirations to be a global city, the predominant form of housing has
remained largely unchanged since this time, ostensibly driven by demand. Planning around the
aspiration to own a house on what is popularly known as the quarter acre block, dubbed the Great
Australian Dream, continues unabated. This has resulted in a market led and largely passive approach
to growth management within the city. As a result, property prices in the urban capitals have risen to
well beyond the means of lower income households, who are driven progressively further towards the
urban fringes and away from essential infrastructure.
The issue remains inadequately addressed in policy, supported by an unhelpful governmental structure.
Much of the political rhetoric in Australia has validated this approach to housing, lobbied by private
enterprise, branding it simply, ‘the Australian way of life’ and those financially struggling who are driven
out to the urban fringes, the quasi-heroic terms of ‘Aussie battlers’ or ‘aspirationals’. Despite the clear
need for a more proactive approach to managing growth, a fear of producing ‘undesirable’ and thus,
unprofitable, housing has meant that many of the attempts at incorporating so-called smart growth
strategies have been largely token or piecemeal in nature. This approach has impacted their
effectiveness, also negatively impacting the image of higher density housing and urban consolidation
efforts amongst Sydneysiders and Australians in general.
But are the residents of Australian cities really so different from urban dwellers elsewhere in the world?
And why is residential happiness so directly tied to low densities?
The aims of this paper are two-fold: The first aim is to identify the connection between the housing
aspirations of Sydneysiders, the origins of these aspirations and why aspirations have become and
remained such a significant driver in the development and planning profile of the city. The second is to
compare these findings against those of a selection of other cities around the world that are using both
passive and proactive planning policies and the way in which such decisions have shaped these cities.
The study takes place against the theoretical backdrop of the New Urbanism and New Suburbanism
movements, which occupy opposite ends of the thought spectrum on the perceived ideal levels of

9 © Laila Mehrpour, NAWIC
governmental involvement and the prescriptiveness of policy. The ultimate aim of this paper is to
determine whether the notion of the Great Australian Dream is still a relevant development and strategic
planning driver for the future of Sydney.
Methodology
In July 2012 the current NSW State Government released A New Planning System for NSW Green
Paper (the Green Paper), which promises a “blueprint for change” based around four fundamental
reforms in the areas of community participation, strategic focus, streamlined approval and provision of
infrastructure. As a state planning proposal paper, it is qualitative rather than quantitative in terms of its
proposals and non-specific in terms of its plans for Sydney as a unique urban region in NSW. It aims to
follow the Metropolitan/Regional Growth Plans (p.10, p.26), the latest of which was The Metropolitan
Development Program (2008/09). Produced by the previous government, it is the main planning
instrument for the Sydney metropolitan area.
The Metropolitan Development Program and its associated paper, the Metropolitan Strategy Review:
Sydney Towards 2036 Discussion Paper (2011) include data on the Local Government Areas which
have experienced the highest levels of housing growth in the last ten years, including the areas in which
this growth has been primarily in the form of detached, low density housing in Greenfield areas.
Greenfield areas are an important parameter as development in these areas has materially contributed
to the horizontal expansion of the city and the resulting strain on infrastructure. It has also contributed to
the growing economic segregation within the metropolitan area, which has seen low income households
driven progressively further towards the urban fringes by the rising costs of housing and away from
essential amenities.
Each section of this paper will aim to address the new planning outcomes proposed by the Green Paper
as the most recent of the planning instruments. Particularly in the context of its plans to review
“international best practice for measuring the success of plans” (p.31), observations recorded in the
cities visited for this paper, as well as in the conversations with local experts will be contextualised
within the framework proposed by the Green Paper.
In order to measure and quantify the housing aspirations of the residents of Sydney, this study will make
use of consumer segmentation analysis, a highly interrogated form of census and population data,
which will determine the resident profile of the low density sprawl paradigm. The tool used for this
assessment is a geo-demographic segmentation tool known as Mosaic, developed by Experian PLC1,
which also offers a globally consistent classification system, known as Mosaic Global. There is currently
Mosaic data available for 24 countries worldwide. Mosaic Global operates on the basis that the world’s
1 Experian PLC is a FTSE 100 listed company specialising in information services and data analytics. Its headquarter are in Dublin, Ireland and Nottingham, UK

10 © Laila Mehrpour, NAWIC
cities share the same residential patterns – that is, that people everywhere are essentially the same and
as a result, can be classified using a consistent taxonomy.
This is most helpful in enabling cross-comparisons across geographies. In the context of this study,
once the resident profile of Sydney has been determined, the same groups of people will be examined
in a selection of cities worldwide, employing both proactive and passive growth management strategies.
The ultimate aim of this exercise is to determine the types of housing acceptable to the same types of
households in other cities globally, and the contextual parameters that influence these choices. These
parameters can then be assessed against the factors that drive housing choices in Sydney, and assist
in the assessment of the Great Australian Dream as a relevant policy driver.
City selection process
The four cities selected for this exercise are London, New York, Copenhagen and Detroit. According to
Sydney’s Metropolitan Strategy Review (2011), “The future of the Sydney region and more broadly the
whole of New South Wales (NSW) is integrally linked to the success of Sydney as a Global City. The
city’s global status needs to be enhanced.” (NSW Department of Planning and Infrastructure, p.7)
According to the research carried out by a variety of global journals and research bodies such as the
Foreign Policy Journal and the Global and World Cities Research Network on the topic of the nature of
global cities, both London and New York consistently and invariably feature at the top of global cities
indexes. This forms the basis of their selection for this study.
Copenhagen has also been selected as it is widely acknowledged to be the kind of city to which cities
such as London and New York aspire, due to its highly successful urban planning mechanisms. Indeed,
the term ‘Copenhagenisation’ is derived from the efforts undertaken by the city to progressively reduce
its reliance on travel by private car, and improve the mobility of its residents through other means (most
notably by bicycle). It was formally integrated into the spatial planning strategies of many global cities,
including both London and New York.
The equivalent types to the types of households who are seen to be the primary market for detached
housing on the urban fringes in Sydney are assessed in these three cities to determine the extent to
which they make up the resident base of each, and the dwelling types which make up the housing
norms for these types of households in each city.
Also as part of this study, one additional city adversely affected by the global economic downturn is
assessed. In the United States, the advent of global economic crisis has brought the argument for better
planned cities into relief as many middle-American towns and cities bear the brunt of the economic
crisis. A notable example is the city of Detroit. Indeed the New York Times recently went so far as to say

11 © Laila Mehrpour, NAWIC
that “it was predominantly the collapse of the car-dependent suburban fringe that caused the mortgage
collapse.” (Leinberger, C. New York Times, 26th November, 2011)
This is not a phenomenon limited to the United States alone. Indeed, globally, cities most known for
their so-called “market-led” urban planning have largely been those hit hardest by the economic
collapse – Athens, Dublin and Madrid, the capitals of countries well known for their recessional troubles,
were all cited in a 2006 report as worst case examples of city planning long before the economic crisis.
(Finfacts, 2006)
The determining factor behind the selection of the final city has been the quality of the available Mosaic
data for each city option. It is most readily available in detailed and accurate form for the United States,
and thus the city of Detroit has been selected. However, each city would be a worthwhile case study for
further research and could perhaps aid in the identification of any potential links between economic
volatility and the strategic planning of these cities.
By undertaking the outlined exercise, the aim is to demonstrate the potential impacts of market led
housing strategies and conversely, of proactive growth management on the long term liveability and
prosperity of the city. Most importantly, it contextualises the reasons behind the limited success of some
of the smart growth strategy elements already being deployed in Sydney through this global
examination.
The study has been supplemented by on the ground observations in Copenhagen, London and New
York, advice and data provided by the team at Mosaic Global and input from the team at Gehl Architects
in Copenhagen, David Higgins, Managing Director of Network Rail in the United Kingdom and
Alexandros Washburn, Chief Urban Designer for the New York City Department of City Planning.
Research
Much of the research around smart growth strategies is qualitative and theoretical. The most current,
pertinent and practical research in this area in Australia has been carried out by the Grattan Institute,
“an independent think tank focussed on Australian public policy, (which) aims to provide independent,
rigorous and practical advice to improve policy outcomes” (Weidmann et al, 2011, p.1).
In 2011, the Grattan Institute published a series of research papers focussed on quantifying the demand
and supply of housing in Sydney. They pointed out that there is a mismatch between housing supply
and demand in Sydney and note that aspirations for new housing are invariably driven by the existing
stock (Kelly et al, 2011a):

12 © Laila Mehrpour, NAWIC
In short, many of the detached houses in the ... suburbs are a legacy of a time when Sydney
(was a) different city. Today’s stock reflects attitudes formed and decisions made under
different conditions, some of which no longer apply (Kelly et al, 2011a, p.25)
This is an important point because changes to housing stock happen very slowly (Kelly et al, 2011a) but
also because it is one of the most important factors in the perpetuation of the Great Australian Dream
paradigm and consequently, detached housing sprawl:
As a general trend, due to an aging population (ABS, 2011) households are also shrinking in size
(number of people per household) (Kelly et al, 2011b). However, higher density housing in Sydney still
represents little more than a quarter of all dwellings (Darcy, M., 2008). It was also recently revealed that
in 2009 Australia overtook the US in producing, on average, the largest houses in the world. (Johanson,
S., 2011-08-22, smh.com.au) It is therefore a fair assessment of housing supply in the Sydney market to
say that while households (number of persons per dwelling) are shrinking, houses themselves are
growing in size.

13 © Laila Mehrpour, NAWIC
Chapter 1 – The Great Australian Dream and Sydney’s Housing Quandary
“Only the rich can afford to buy a house within 25km of the city”
Andrea Dixon Herald Sun Sydney, 30th April, 1998
The concept of the Great Australian Dream emerged during the post war period and is traditionally
associated with the ownership of a detached house on a so-called quarter acre block (approximately
1011 square metres), the unit of measurement by which the abundant vacant land around Sydney was
hastily subdivided in the post war period to accommodate a growing population. The term itself was
derived from the American Dream, which described a similar phenomenon in the United States in the
late 1940s. With its origins during this formative period, the Great Australian Dream is indelibly marked
on the Australian psyche as a cornerstone of Australian identity.
Sydney was endowed with a sophisticated and extensive heavy rail system relatively early in its life.
Prior to the advent of the public transport system in 1851, the city was a compact walking city, a product
of its inception during the Victorian era, with a mix of working class and middle class housing clustered
within walking distance of commercial centres, shops and factories. As with the United Kingdom, with
the arrival of a reliable public transport system, the upper and middle classes and even some better
paid members of the working class, could now aspire to a house and garden in fresh country air. These
new residential suburbs were built along train lines radiating out from the city centre. (Forster, 2010)
A segregation of suburbs developed but instead of concentric rings of increasing affluence as could be
observed in London, Sydney and the other Australian cities were characterised by sectors of different
social status, governed largely by the topography and the surrounding natural landscape. Areas of
working class housing developed on the flat unattractive tracts of land, while upper and middle class
suburbs emerged along the leafy foreshore, to the north of the harbour and east of the city and
docklands. (Forster, 2010)
Notably, Sydney and the other Australian urban capitals were already characterised by the very large
areas that the cities covered. Typical population densities were at 20-25 persons per hectare compared
with over 200 for London (Frost, 1990). The reasons for this were manifold. Land was both abundant
and cheap. There was very little heritage of pre-industrial housing and what little there was, existed in
Sydney alone. Australian cities were commercial in nature and there was a consequentially large middle
class. Even manual labour incomes were relatively high. (Forster, 2010)
About fifty percent of Australians were owner occupiers compared with only ten per cent of the British
(Frost, 1990). Also, the bulk of the growth occurred after the introduction of public transport, which freed
people from the need to live close to their workplaces, which was mostly in the city centre. It was the

14 © Laila Mehrpour, NAWIC
combination of the above that allowed many city dwellers, many of whom originated from the United
Kingdom to achieve what Frost (1990, p.44) has called “the Anglo-Saxon desire for the privacy of living
in a suburban city”. It is this desire that has left an indelible mark on the Australian psyche as the most
fundamental of lifestyle aspirations, over a century later.
Home Ownership and the Taxation System
Census data from 1947 shows that in Sydney the level of home ownership was roughly what it had
been since the nineteenth century in almost all of the capitals. Around 40 per cent of dwellings were
owner occupied in Sydney. In 1961, this figure had risen to 68 per cent – an astonishing jump in just 14
years. These were some of the highest levels of home ownership in the world. (Forster, 2010)
The federal government policies greatly favoured owner occupation through a highly incentivised
taxation system for home owners. Many home purchasers were able to obtain housing loans at greatly
subsidised rates from the banks, and in addition to this, there were special schemes for the large
number of returning servicemen. Even the so-called ‘normal’ interest rates were subject to tight controls.
Overall, government policy made owner-occupation much more financially attractive than renting
(Forster, 2010) Home ownership was all but synonymous with new, detached housing, and had become
no longer a luxury but an expectation, as had car ownership. The low level of investment in the inner
city suburbs, other than in the form of freeway infrastructure, had also helped to make the suburbs more
desirable by comparison. Therefore, as Forster points out, “while Australian families may have freely
chosen the suburban way of life, the circumstances, partly shaped by governments, had made it difficult
for them to make any other choice”. (2010, p.25)
Sydney’s Housing Quandary
While the famed quarter-acre block has been somewhat of an exaggeration for most Sydney
households, housing blocks of 500 square metres and more have dominated housing development in
the middle and outer ring suburbs developed since World War II. This subdivision and development of
previously rural or vacant (so-called Greenfield) areas around Sydney has formed a large part of the
accommodation strategy for Sydney’s growing population since the city’s inception, but escalated in
particular since this period.
According to the most recent data from the Australian Bureau of Statistics, there are approximately 4.1
million residents in Sydney, in approximately 1.5 million dwellings. Almost 940,000 of these are
detached houses which equates to 62.6% compared with a national average of over 75%. (Darcy, M.,
2008)
While the release of land for detached development has slowed in recent years, there is an ongoing
belief in both public and private enterprise that continued land subdivision should form at least part of
15 © Laila Mehrpour, NAWIC
the ongoing housing strategy of the city, and this is reflected in the current metropolitan plan for the city,
despite a recent planning history that abstractly acknowledges that this manner of continued growth is
unsustainable. Gleeson attributes this abstraction to “generations of policymakers and public officials
who simply have no idea how to design and implement collective solutions to the increasing array of
problems thrown up by deregulated markets.” (2010, p.3)
This is a significant point for Sydney’s ailing transport system. Each state government’s tenure is
accompanied by promises to improve rail networks in underserviced areas, particularly on the urban
fringes, only to find, once again, that the cost of running infrastructural services in such low density
areas is prohibitive, no matter how it is funded. (Benson, S., dailytelegraph.com.au, 2008-10-31)
Under environmental and economic pressures, and in response to the increasing prevalence of smaller
households, the last two decades have seen a growing trend towards increasing the number of denser
multi-unit apartment buildings. This, combined with changes to planning laws designed to address
concerns over the environmental and economic costs of urban sprawl, resulted in a 30 per cent
increase in the number of apartments in Sydney between 1996 and 2006. (Darcy, M. 2008)
However, even such incremental change in the housing profile of the city has engendered vehement
protests from various quarters, both private and public sector, with the president of one community
action group stating in a widely distributed report “Unless we are vigilant, high-density zealots will do
their best to reverse centuries of gains and drive us back towards a Dickensian gloom.” (Recsei, T,
“Save Our Suburbs” in Demographia, 2010) The reasons behind this apprehension are manifold, but as
pointed out by Kelly et al:
Despite the easygoing bravado, Australians have a pronounced private streak. They don’t want
their pleasure or pain heard by neighbours and resent being drawn into the daily lives (...) of
those around them. Living in smaller, communally oriented spaces brings this fear to the
forefront. (2011b, p. 12)
To contextualise this however, in general, unless policy changes are wholesale and committed to the
overall vision of proactive growth management, the housing profiles of cities are slow to change (Kelly
et al, 2011a). The enduring prevalence of the Great Australian Dream as a housing aspiration and
development driver is at least partly determined by the fact that aspirations for new housing are
invariably motivated by the existing stock (Kelly et al, 2011a), and thus the paradigm continues to
perpetuate itself.
The public debate around housing in Australia is dominated by commentary on the price of a
detached house and land package, and tends to focus disproportionately on one household
type, that of young families...the only certainty seems to be that when people are asked to

16 © Laila Mehrpour, NAWIC
choose anything they want, they typically say they’d like a large detached house near the
centre of the city (Kelly et al, 2011a, p.4)
Affordability
Australia’s brief settlement history is largely one of metropolitan primacy. All of the Australian capitals
are highly polarised by the cost of housing, but the expansive low density area of Sydney as well as its
harbour and unique topography have cemented housing in Sydney as the key to great wealth for some
and long term poverty for others.(Darcy, M., 2008)
Sydney also has a much publicised ‘crisis of affordability’. While it is undoubtedly the most expensive
city in Australia to live in, much of the concern around this issue can be attributed to media induced
panic drawn from reports such as the annual Demographia International Housing Affordability Survey.
Demographia is a US based company, but the figures from this report are widely published in mass
media in Australia in particular. In 2011, Sydney was ranked third on the table of Severely Unaffordable
Housing Markets. Demographia's index sets a notional 'affordability standard' of 3 times the gross
average household income which all major Australian cities exceed by at least a factor of two – but
Sydney in 2011 was over three times the standard at 9.2 times the average national income.
However, this measure is a somewhat misleading benchmark, as incomes in Sydney also tend to be
well over the median national household income. Interestingly, Demographia ascribes the lack of
affordability in Sydney to the increased amount of prescriptive land use strategies and the recent limits
on land releases imposed by the state government. This approach certainly implies that the primary
form of housing development should be associated with governmental land releases, which for Sydney,
is almost entirely Greenfield, and ignores the possibility of infill, or higher density development as a
viable alternative. Due to its high levels of circulation in mass media, it is also materially contributing to
the public’s suspicion of smart growth strategies and higher density housing models.
Income versus housing type
Another common misconception in Sydney is that detached housing is directly tied to high incomes,
hence the aspirational nature of detached living in Australia. Figure 1.1 shows the map of Sydney colour
coded by income, and highlights the highest income per annum by locality. On the basis of this
information, coastal suburbs are the wealthiest and most prosperous, whilst the outer suburban areas
are occupied by the lowest income bracket. It also shows a city that is made up mostly of extremes. The
two predominant colour bands are High and Low and high income earners are clearly the most
prevalent type. Sydney is, for a large portion of the population, a wealthy city.

17 © Laila Mehrpour, NAWIC
Figure 1.1 – Households by Income in Sydney
Source: Pacific Micromarketing Mosaic Australia Profiles 2008 – Balancing the Books> Household Income Per Annum>High Earnings
The map in Figure 1.2 shows the way in which detached housing is currently arranged in Sydney. It
clearly shows a bias towards high levels of separate housing on the urban fringes with gradually
declining levels towards the city centre.
Figure 1.2 –Detached Housing in Sydney
Source: Pacific Micromarketing, Mosaic Australia Profiles 2008 – Living Space>Housing Type> Separate Housing

18 © Laila Mehrpour, NAWIC
As mentioned earlier, the average percentage representation of detached housing in Sydney is 62.6%.
It indicates that the distribution of wealth is not necessarily directly aligned with regions high in detached
housing representation. While there is an over-representation of detached homes on the urban fringes,
housing in these areas also corresponds directly with economic disadvantage. This is mainly because
residents with adequate financial capacity will generally make their housing decisions based on the
desirability or centrality of the location as opposed to whether or not the house is detached. It would
therefore stand to reason that the Great Australian Dream and its manifestation of detached housing on
the urban fringes is largely associated with and marketed to the economically disadvantaged.
While the Great Australian Dream remains a significant cornerstone of Australian identity, in the Sydney
of today, the expectations arising from it have been a difficult obstacle to overcome for policy makers.
This is partly fuelled by media induced panic based on simplistic data that has tended to attribute lack of
affordability to a shortage of land supply rather than an oversupply of houses that are too large and thus
too expensive for households that are shrinking in size.

19 © Laila Mehrpour, NAWIC
Chapter 2 – The theoretical context: New Urbanism and New Suburbanism
“Cities are an immense laboratory of trial and error, failure and success, in city building and city design. This is the laboratory in which city planning should have been learning and forming and testing its
theories.”
Jane Jacobs, The Death and Life of Great American Cities, 1961
This chapter aims to contextualise this study within the theoretical framework of New Urbanism and its
more recent counterpart New Suburbanism. Both schools of thought focus on the development of cities
that directly address the housing and ultimate aspirations of its residents. Both emerged in the United
States.
New Urbanism aims to address growth and the housing challenge by focussing on increasing densities,
urbanising sprawling suburban areas and building better designed and smaller dwellings which are
closer to the urban core.
New Suburbanism focuses on maintaining low density housing and decentralisation, allowing
development to take the form driven by the market. It was developed largely as a response to the
increase in influence of the New Urbanism movement which has enjoyed growing uptake and advocacy
of its principles amongst local governments across the United States.
The New Urbanism movement emerged in the United States in the 1980s but its origins lie in as far
back as the early 1960s, with Jane Jacobs’ seminal The Death and Life of Great American Cities
(1961). Since then, a multitude of papers, books and publications have been devoted to the topic of
New Urbanism or, as known in the Australian context, urban consolidation or smart growth.
The movement has slowly reformed property development and urban planning, particularly in the United
States, with its advocacy of walkable neighbourhoods, higher densities and mixed use, and the
reduction of sprawl, automobile dependency and single-use neighbourhoods.
New Urbanism also advocates a stronger public transport network and walkability. In areas where its
principles have been applied, such as New York City and Copenhagen, lanes of traffic have been
removed to be replaced by public open spaces, expanded sidewalks and cycle paths. The aim of these
principles is above all else, to reduce reliance on travel by private car, but also has the added benefit of
making the streets safer for pedestrians, cyclists and even motorists, by slowing down and reducing
traffic in urban areas. It must be noted that in Sydney, some of these principles have been applied with
the introduction of cycle paths in the urban core and there is an intention to incorporate more wholesale
strategic principles (NSW Department of Planning and Infrastructure, 2008/09). The first and most
significant of these steps has been the limitation of land release on the urban fringes, outlined in the
following chapter.

20 © Laila Mehrpour, NAWIC
New Urbanism also aims to address deeper social ills such as the segregation of society by income. As
pointed out by Duany et al, “the rich have often taken refuge from the poor but never with such
precision” (2010, p. 43). Indeed, consumer segmentation and geo-demographic assessment tools have
made it possible and simple to see these segregations in existing settlements, but many suburban
developers actually set out to develop economically divided enclaves within subdivisions in an attempt
to sell the concept of exclusivity. By making incremental adjustments to the physical forms of cities, and
planning out segregation, New Urbanists argue that a wide variety of incomes, races and classes can
live in harmony within a small geographic footprint. This measure also attempts to ensure that the
poverty cycle is not perpetuated and enclaves of poverty do not develop.
The same sidewalks, the same parks, and the same corner store serve everyone from the
C.E.O. to the local librarian. Sharing the same public realm, these people have the opportunity
to interact, and thus come to realize that they have little reason to fear each other. (Duany et
al, 2010, p. 47)
The counter movement to New Urbanism, The New Suburbanism, emerged in 2005, with a paper
prepared by Joel Kotkin and the US based The Planning Centre entitled “The New Suburbanism: The
realists guide to the American future”. The challenge both movements are addressing is universal – the
challenge of housing future growth, which regardless of geography appears to be 40 - 50% growth by
2030 (UN Population Fund et al, 2007). However, the context within which New Suburbanism is
operating is almost entirely and unabashedly US-centric.
Projections for expansion of the built environment — estimated to grow 50 percent by 2030 —
will be in the suburbs and exurbs, most particularly in sprawling, lower-density and auto-
dependent cities of the South and West... This can best be done, not by rejecting the suburban
ideal—which would violate the essential desires of most Americans — but by crafting ways to
make it work in a better, more efficient and humane way.(Kotkin et al, 2005, p.1)
New Suburbanism argues for a diluted version of many New Urbanist principles but without, amongst
other things, what it calls a “zealous commitment to mass transit” (Kotkin et al, 2005, p.19) While New
Suburbanism may be the lesser known movement of the two, upon examination of sprawling cities, its
principles are more widely adopted in cities with more passive planning strategies, including Sydney. Its
principles closely mirror the viewpoint of the afore-mentioned Demographia report, which argues for so-
called ‘pro-choice’ urban development – in other words, market led development.
The reason for this is simply that it adheres to the economic framework of developers and private
enterprise, and in many ways, takes the path of least resistance when confronted with obstacles,
planning, geographical, market or otherwise.

21 © Laila Mehrpour, NAWIC
This type of ‘let the market decide’ planning was mentioned in the European Environment Agency’s
2006 report on Dublin as a worst case scenario of urban planning practices:
Ronan Uhel, who heads the EEA's spatial analysis unit, is reported in The Irish Times as
saying that Ireland was ‘very much on the map in relation to urban sprawl - not just in Dublin,
but also around towns and villages throughout the country’ as a result of ‘extremely passive’
planning policies. (Finfacts, 2006)
There is proof in the outcomes of cities like Dublin that this passive approach to urban planning only
creates further problems. At best, this is because the founding principles tend to be misconstrued and
manipulated by developers to maximise profits, and allowed at a local government level to achieve local
and not metropolitan objectives.
There is evidence in the widely adopted framework of New Urbanism that the provision of dwellings at
higher densities does not have to manifest into a “relentless stomp of grey concrete and asphalt...of
drab shadows of upward rising, smothering unit blocks” (Demographia, 2010). Indeed, the aims of New
Urbanism are to counteract the monotony and single use zoning associated with residential subdivisions
to promote diversity, integration and a ultimately, a richer urban experience. However, as Kotkin points
out, the case must be made for the persistence of the ‘universality’ of the aspiration to own your own
home. The real challenge is to determine whether the forces which perpetuate this trend are entirely
market driven or a combination of policy, funding and market assumptions.

22 © Laila Mehrpour, NAWIC
Chapter 3 – Sydney in a Globalising Context
“the concept of 'global city' or 'world city' … can be interpreted as a means of trying to legitimise what are for many people painful economic-social dislocations”
Frank Stillwell, Globalisation and Cities: An Australian Political Economy Perspective, 1997
There is an inherent dichotomy in Sydney’s urban identity. It is important to understand that Australian
cities are primarily residential environments, with very small urban cores surrounded by vast expanses
of suburban sprawl (Forster 2010). In Sydney, alongside a yearning for a low density, suburban, almost
provincial existence, there is also a pride in the city’s status as the most cosmopolitan of the Australian
capitals, and a keenness to promote Sydney as a world city. Indeed, in the most recent metropolitan
plan for the city, Sydney was defined by the New South Wales State Government as Australia’s only
truly global city (Department of Planning and Infrastructure, 2010, p.7)
Stillwell defined globalisation as “the intensification of international economic connections” (1997, p.7) in
the closely related areas of finance, trade, investment and production (Forster, 2010). The effects of
globalisation have seen Sydney become Australia’s key financial control centre with finance, insurance,
property and business services the largest single employment category in Sydney. (Forster, 2010) In
terms of lifestyle, the pride in the city’s cosmopolitan identity perhaps arises from the fact that the
globalisation of Australian cities has meant that the cities have become “less inward looking and
parochial and perhaps more exciting to live in” (Forster, 2010, p38). The rise of the private sector has
had a profound impact on the way in which development is funded and approved and the globalising
context in which this is occurring is facilitating and enabling this trend. Importantly, this is not a new
trend, nor is it unique to Australia.
In the developed world, the global financial markets are driven by growth, often at any cost (Gleeson,
2010). In the context of the United Kingdom, for example, Bowie (2010) noted in reference to the tenure
of the first Mayor of London, Ken Livingstone, “the private sector was an integral part of the pro-growth
consensus.... This helped to ensure that the growth-based plan was endorsed, and that they were
prepared, if reluctantly, to live with some of the mayoral policies which were less in their favour” (p. 63)
The United States is certainly no different, widely credited with pioneering this market-led enterprise.
The aspiration to cement Sydney’s global status is in pursuit of increased levels of opportunity for global
business. In order to define whether this macro desire is in line or at odds with the micro housing
desires of the population (as defined by the cultural doctrine of the Great Australian Dream), a series of
global cities have been selected for the purposes of comparison with Sydney. There is no doubt that
Sydney is now a world city and Sydney's ascent into the global housing and property markets has
introduced forces which seem at odds with the cultural ideals and notions associated with housing in
Australia.

23 © Laila Mehrpour, NAWIC
The role of government
There are three layers of government in Australian cities – Federal, State and Local. In Sydney, the
metropolitan region is governed holistically only at the state level. The NSW State Government has set
broad guidelines of strategic direction for the city, which include housing provision targets, which are
then executed at a local government level through the consents granted by the local councils. According
to the Metropolitan Development Program, Sydney is forecast to grow a further 40% in population in the
next 25 years, as indicated in Table 3.1 and Figure 3.1. This population growth will see the city grow to
a total of nearly 6 million people. Furthermore, it is expected that by 2036, one in six people will be aged
over 65 compared to the current proportion of one in eight. (NSW Department of Planning and
Infrastructure, 2008/09)
Table 3.1 – Forecast Population Growth in Sydney’s subregions
Source: NSW Department of Planning and Infrastructure, 2011, Sydney Towards 2036, Metropolitan Strategy Review Discussion Paper, Sydney, p.11
As far as housing is concerned, the current metropolitan plan for Sydney is the Metropolitan
Development Program (MDP) 2008/09. This is the second iteration of an earlier plan from 2005, the first
of its kind that addressed Sydney as a whole since the 1940s. According to NSW State Government:
The MDP is the Government's key program for tracking and managing housing supply and
covers major infill sites in existing urban areas as well as the release of land not previously
urbanised, known as Greenfield areas, typically on the metropolitan fringes. (NSW Department
of Planning and Infrastructure, 2009)

24 © Laila Mehrpour, NAWIC
Figure 3.1- Sydney’s Ten Subregions
Source: NSW State Government, 2011, Sydney Towards 2036, Metropolitan Strategy Review Discussion Paper, Sydney, p.11
Development in Greenfield areas
In the last ten years, development in Greenfield release areas accounts for the production of around
25% of all development in the Sydney region (NSW Department of Planning and Infrastructure,
2008/09). The highest levels of detached dwelling development in Greenfield areas in the Sydney
region are concentrated in eight Local Government Areas (LGAs): The Hills, Blacktown, Penrith,
Campbelltown, Liverpool, Camden, Fairfield and Holroyd. Figure 3.2 shows the location of these LGAs,
indicated in orange. Together these eight LGAs account for over three quarters of all Greenfield

25 © Laila Mehrpour, NAWIC
development in Sydney. It is this type of development that is mainly responsible for the horizontal
expansion of the city, and the resulting strain on transport and services infrastructure.
In chapter 4, the residents of these areas will be examined via geo-demographic segmentation analysis
as it is the purchasers of the homes in these areas to whom the Great Australian Dream paradigm is
most desirable and important. Developers and policy makers are primarily looking to these groups when
preparing accommodation strategies for the city. Similarly, the purported demand for detached housing
and the Great Australian Dream is typically geared towards the types of residents who favour
development in these areas due to the lower land prices.
Figure 3.2 – Highest levels of detached housing in Greenfield development areas by LGA
Source: adapted from Local Government Areas summary report in the NSW State Government Metropolitan Development Program 2008/09
Metropolitan Plan for Sydney
In 2005, the NSW State Government released a twenty five year metropolitan strategy called City of
Cities: A Plan for Sydney’s Future. The strategic target date for the implementation of the plan was
2031. Forecast growth for Sydney at the time for this year was a growth in population of 1.1 million to
5.3 million in 2031. In 2010 a revised Metropolitan Strategy Review was released with a revised end

26 © Laila Mehrpour, NAWIC
date of 2036. This was partially due to the fact that little headway had been made in the last 5 years in
achieving the targeted outcomes. Indeed the new metropolitan plan laid out the aims, measures and
benchmarks of 2005 against their performance by 2010 in Table 3.2, indicating that out of the six key
areas of improvement, only one had improved, while the other five areas had worsened.
Table 3.2 – Metropolitan Strategy Performance – Measures of Success
2005 Aim Measure Benchmark 2010 Metropolitan Review Enhance Liveability
Quality of Living Maintain or improve Sydney’s index and ranking of quality of living, according to Mercer Human Resource Consulting global quality of living survey
In 2005 Sydney ranked 8 out of 260 cities in the Quality of Living Survey with an index of 105.
In 2009 Sydney ranked 10 out of 215 cities in the Quality of Living Survey, with an index of 106.3.
Strengthen Economic Competitiveness
Contribution to National Economy Maintain or increase the proportion and value of Sydney’s contribution to Gross Domestic Product (GDP).
In 1998-99, Sydney produced 23% of Australia’s value added wealth, totalling $130 billion.
In 2009 Sydney’s contribution to GDP had increased to 24.9%.
Ensure Fairness Access to Services Increase the percentage of the population living within 30 minutes by public transport of a city or major centre.
In 2005, 80% of Sydney residents can access a major centre, regional city or global Sydney within 30 minutes by public transport.
This measure remains comparable but is set to improve with the implementation of the Metropolitan Transport Plan
Protect the Environment
Environmental Footprint No increase in Sydney’s environmental footprint per capita.
In 1999, the environmental footprint of Sydney’s residents was 6.67 hectares per person (adjusted).
In 2004 Sydney’s environmental footprint had increased to 7.21 hectares per person.
Improve Governance
Metropolitan Strategy and Infrastructure Metropolitan Strategy directions and identified transport and infrastructure needs inform the annual State Infrastructure Strategy
Budget Paper 4 responds to transport and infrastructure priorities as identified in the State Infrastructure Strategy.
Improved integration of strategic land use planning and infrastructure is the focus of this review.
Source: NSW State Government, 2011, Sydney Towards 2036, Metropolitan Strategy Review Discussion Paper, Sydney
The current revision of the plan, the Metropolitan Strategy Review: Sydney Towards 2036 (2011) has
put in place a series of revised targets with an extended end date. Forecast growth has been revised
according to more recent census data, and for the next 20-25 years was found to be even greater than
that allowed for in the 2005 plan. In order to accommodate this growth, the plan is targeting over
550,000 new jobs, with around half of these jobs to be based in Western Sydney and a target of
640,000 new homes with 70% in existing areas and 30% in new Greenfield areas.
Concurrently, the plan aims to “contain Sydney’s urban footprint by protecting rural and resource lands
and only releasing land for development that meets strict sustainability criteria.” This new Greenfield
development is to be focussed only in the so-called North-West and South-Western Growth Centres.

27 © Laila Mehrpour, NAWIC
Figure 3.3 shows the location of the two areas for growth, in relation to where the majority of Greenfield
development has taken place in recent years as taken from Figure 3.2.
Figure 3.3 – North Western and South Western Growth Centres in Metropolitan Sydney
Source: adapted from Metropolitan Strategy Review, Department of Planning and Infrastructure, 2010, pg 5 and NSW Government Planning and Infrastructure, 2010, Growth Centres Commission, http://www.gcc.nsw.gov.au/the+growth+centres-5.html
The growth centres together are expected to accommodate 181,000 new dwellings as well as land for
employment in a bid to decentralise the employment opportunities in the city. Developers have criticised
this strategy as the areas identified are subject to a number of constraints including multiple land
ownership and lack of existing infrastructure, making development in these areas difficult and
expensive. The main aim of the MDP is to attempt to curb the sprawling trend by targeting specific
areas in which ‘lot production’ can occur. From the findings thus far, it can be easily surmised that the
majority of Sydney’s growing pains can be attributed to its sprawling size, a direct result of the
prevalence of the detached housing paradigm as the predominant form of development. The reason for
identifying two growth areas is an attempt to ensure that the sprawl does not continue to grow via lot
production beyond the already bloated confines of the city.

28 © Laila Mehrpour, NAWIC
Global Comparison
In order to understand the needs of global cities, a small subset was selected for cross-comparison with
Sydney on the basis of a number of criteria. The first of these criteria is global significance. As
previously indicated, this is an important yardstick, as it is a measure by which the primary planning
instrument for the Sydney region, the Metropolitan Development Program is measuring its success. All
of the cities subject to this study, therefore, are cities that feature in the table below.
Table 3.3 – Global Cities Index 2010
Source: adapted from Globalisation and World Cities Study Group and Research Network, Research Bulletin 369 , Loughborough University, UK, 2010 http://www.lboro.ac.uk/gawc/world2010.html
On the Global and World Cities 2010 roster, Sydney is featured among eight cities deemed to be its
equals or greater in terms of its global significance as a Global or World City. In this roster Sydney is
categorised as an Alpha Plus city and among the top ten cities in the world. In similar studies, Sydney
features consistently among the top ten, though invariably between eighth and tenth. The criteria for
these assessments are based on the following series of measures encompassing economic, political,
cultural and infrastructural characteristics, shown in Table 3.4.

29 © Laila Mehrpour, NAWIC
Table 3.4 – Characteristics of Global Cities
Source: adapted from Globalisation and World Cities Study Group and Research Network, Research Bulletin 369 , Loughborough University, UK, 2010 http://www.lboro.ac.uk/gawc/world2010.html
The first two cities are London and New York, due to their primacy on the global cities index. With both
cities at the top of the global cities index, an assessment of the policy framework of each is carried out
to define the kind of aspirations that cities such as London and New York have, when both have
achieved ultimate global significance status and secured the global opportunities that accompany this
status.
Jan Gehl, the urban planning consultant behind many of the strategic planning ideals upon which the
Copenhagen city plan is founded, has in recent years been engaged by the planning departments of
both London and New York in order to ‘Copenhagenise’ their cities. Copenhagen will serve as a

30 © Laila Mehrpour, NAWIC
bookend study on the New Urbanism, as the embodiment of the kind of planning outcomes to which a
global city can aspire.
As Sydney’s planning history thus far has been largely passive, it is important to assess a city that has
demonstrated its commitment to industry or market led, passive planning measures. As the strategic
planning, culture and lifestyle of New York is not typical amongst American cities, and suburban sprawl
is, an additional American example has been selected in the city of Detroit, Michigan.
Detroit’s decline during the economic downturn and indeed the years preceding it have been recently
well publicised. It is an interesting counter study for Sydney for its wholesale commitment to its industry
led planning model, which is largely aligned with many New Suburbanist principles. The assessment of
Detroit will serve as a bookend study on the New Urbanism – New Suburbanism thought spectrum.
The ultimate aim of the selection process is to enable a like for like comparison of both lifestyles and
housing models in cities which are readily comparable in terms of their cultural and financial primacy in
their respective countries. This paves the way for a fair assessment that takes into account the
complexity of the issues facing each city.
Finally to contextualise Sydney amongst the group of cities mentioned in this study, Figure 3.4 shows
the current area of Sydney at the same scale alongside the other global cities. The delineations have
been made based on the boundaries of each city. In some cases, the delineations are clear, as with
London, New York and Copenhagen. With others, the boundaries are ill defined but the distinction has
been made on the basis of the furthest point from the city in which one can live, and still be considered
to be living in that city. The four cities selected for this study are included alongside Athens, Madrid and
Dublin, mentioned earlier in the paper as examples of passive urban planning.
The darker red area shows the confines of the traditional boundaries of the metropolitan area. The
lighter red area shows the exurbs primarily dependent upon the metropolitan city proper.

31 © Laila Mehrpour, NAWIC
Figure 3.4 – Global Cities by Area and Density
Source: adapted from Google Maps 2011, Sydney data from Australian Bureau of Statistics 2011, Copenhagen data from Statistics Denmark 2011, New York and Detroit data from U.S. Census Bureau 2009, London data from Office for National Statistics 2010, Athens data from World Gazetter Metro Pop: Athens, Madrid data from Instituto Nacional de Estadistica 2011, Dublin data from Irish National Census 2006
At a glance the diagram shows Sydney to be physically similar in size to Dublin, Madrid and Detroit, all
cities noted for their passive urban planning. Sydney has the largest core metropolitan area and the
second lowest population density after Dublin. Additionally, it can be surmised from the examples
assessed in this paper, that well functioning cities are generally contained within a 20-25km radius. The
following chapters will assess the planning and policy frameworks of each city against the housing
aspirations of its residents.

32 © Laila Mehrpour, NAWIC
Chapter 4 – Consumer Segmentation and the Control Group
“During the late 1990s a new name appeared for a class of go-getters: the ‘aspirationals’... The aspirationals moved in waves from stodgy blue-collar suburbs in the big cities out to the McMansion
frontier, where behaviour, as well as buildings was masterplanned.”
Brendan Gleeson, Lifeboat Cities, 2010
This chapter will identify the types of households who contribute to the largest percentage of uptake of
the Great Australian Dream and therefore the sprawl paradigm in Sydney – that is, detached dwellings
on the urban fringe. The relevant types are identified through a process known as geo-demographic
segmentation. It is important to assess these types as opposed to all types living in detached dwellings
as they are the signifiers of the ongoing demand for the development of detached housing and hence,
further subdivisions. The equivalents to the same types of residents are then defined in each of the
global case studies to find out how residents who are aligned in terms of lifestyle and aspirations live in
each city.
The control group
In order to identify similarities between groups of people in cities around the world, a control group must
be identified. In the case of the Australian capitals, the characteristics attributed to the control group are
entrenched within the popular image of the Great Australian Dream. One term widely used in recent
political rhetoric and in industry is the ‘aspirationals’. The aspirationals form a part of the category of
households who share in the biggest percentage of uptake in developments on the urban fringes of the
capitals, and who share many common characteristics with the control group subject to this study. In
Australia, developers spend much time and resources identifying this category of people, where they
come from, what they value and most importantly, how they want to live.
Firstly, the way in which people live in Sydney today is assessed. The method selected for this analysis
is heavily reliant on so-called consumer segmentation analysis. Consumer segmentation “is the process
of classifying people into groups that have some set of similar characteristics, resulting in the ability to
be studied and targeted” (XTREMEimpakt, 2008). One of the most comprehensive and widely used
global consumer segmentation tools is Experian’s Mosaic.
What is Mosaic?
Mosaic is one of a number of geo-demography tools currently used globally by marketers for so-called
micro-marketing purposes. The information within is both geographically accurately mapped and highly
detailed, drawn in major part from census information, and supplemented by regular information drives,
mostly carried out through retailers. Though not its primary function, it is, on occasion, used by
developers as part of their development and sales strategies to understand the ‘hearts and minds’ of
33 © Laila Mehrpour, NAWIC
their potential clients. In this chapter, information from Experian’s Australian-based business, Pacific
Micromarketing, has been obtained via the Lend Lease Group research license for Australia. Additional
Mosaic Global information for use in the following chapters has been sourced directly from Experian’s
Mosaic Global team based in Nottingham, United Kingdom.
Due to its global presence and largely consistent classification across different geographies, Mosaic is a
useful tool amongst its competitors to assess the differences and similarities between the aspirations of
Australians and those living in other countries. Mosaic is already widely used by a large range of
enterprises globally, but this study will argue that the robust and globally aligned data within can and
should be used for strategic planning purposes.
The basis of Mosaic global profiling is that while there may be minor local differences related to cultural
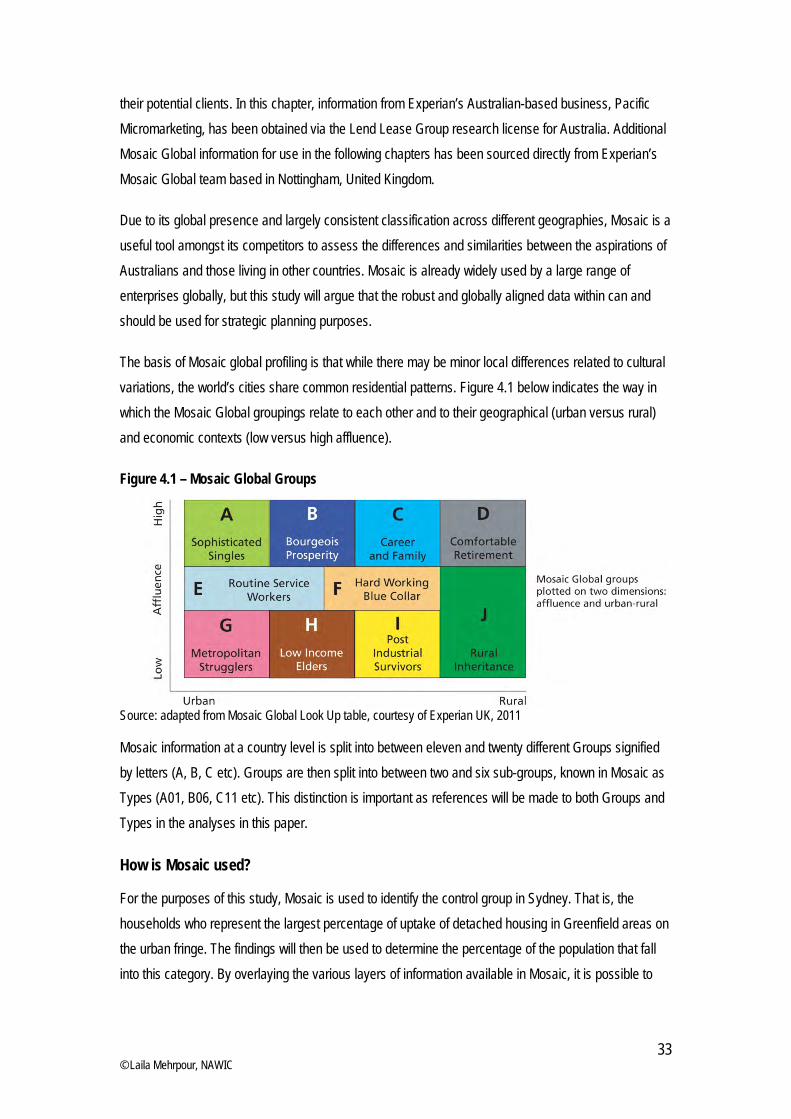
variations, the world’s cities share common residential patterns. Figure 4.1 below indicates the way in
which the Mosaic Global groupings relate to each other and to their geographical (urban versus rural)
and economic contexts (low versus high affluence).
Figure 4.1 – Mosaic Global Groups
Source: adapted from Mosaic Global Look Up table, courtesy of Experian UK, 2011
Mosaic information at a country level is split into between eleven and twenty different Groups signified
by letters (A, B, C etc). Groups are then split into between two and six sub-groups, known in Mosaic as
Types (A01, B06, C11 etc). This distinction is important as references will be made to both Groups and
Types in the analyses in this paper.
How is Mosaic used?
For the purposes of this study, Mosaic is used to identify the control group in Sydney. That is, the
households who represent the largest percentage of uptake of detached housing in Greenfield areas on
the urban fringe. The findings will then be used to determine the percentage of the population that fall
into this category. By overlaying the various layers of information available in Mosaic, it is possible to

34 © Laila Mehrpour, NAWIC
identify a finite list of Mosaic Types that represent the households who are the biggest proponents of the
Great Australian Dream.
The Mosaic Australia Groups and Types and the percentages of each in Sydney and Australia are
shown in Table 4.1. In Mosaic Australia, there are eleven Groups and forty seven Types.
Table 4.1 – Mosaic Groups and Types by percentage for Sydney and Australia

35 © Laila Mehrpour, NAWIC
Source: adapted from Pacific Micromarketing – Mosaic profile Groups and Types 2011, courtesy of Lend Lease research license
Sydney’s Mosaic Profile
Mosaic profiling is particularly powerful as the data is geographically accurately mapped. Figure 4.2
shows the colour coded map of Sydney in 2011. The associated colour banded legend shows the

36 © Laila Mehrpour, NAWIC
corresponding forty seven Types. From here it is possible to identify the residential patterns in the city.
Each coloured dot represents an individual household, and the colour itself denotes the Mosaic Type to
which the household belongs. It indicates the clustering of demographics across the city from the
harbour and seaside suburbs to the outer urban ring.
Figure 4.2 – Sydney Basin Mosaic Map and Legend
Source: Pacific Micromarketing – Mosaic profile map 2011, courtesy of Lend Lease research license
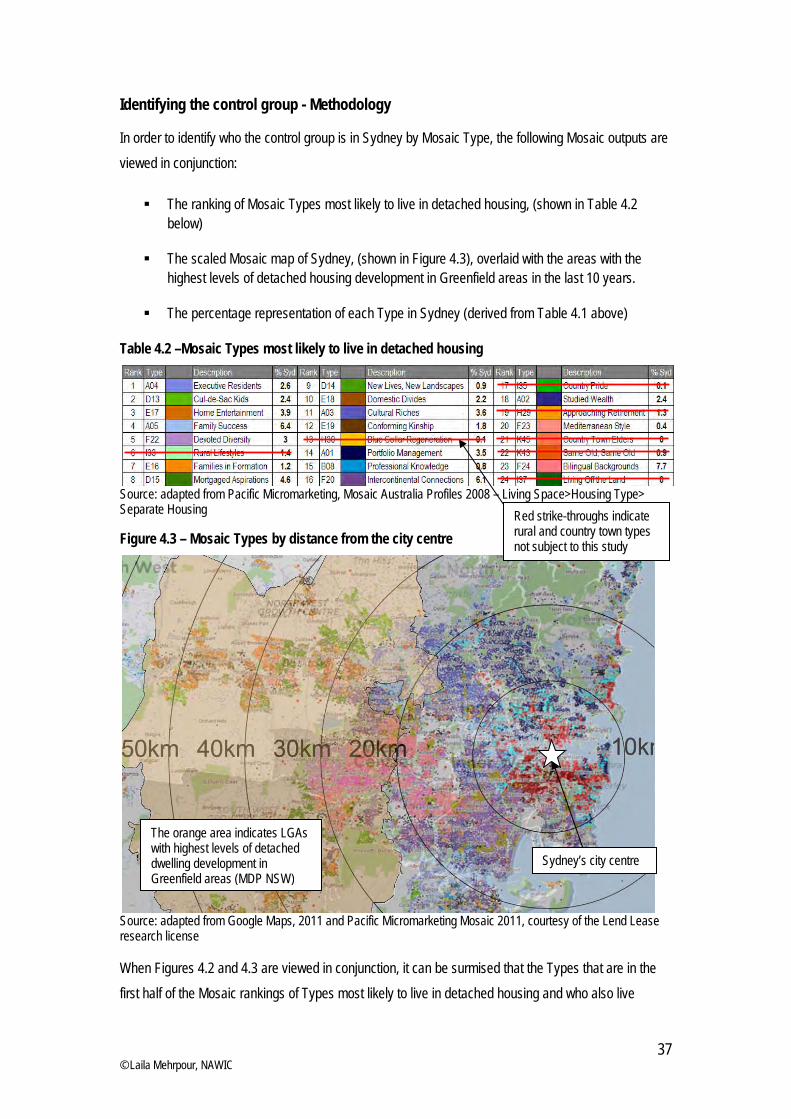
37 © Laila Mehrpour, NAWIC
Identifying the control group - Methodology
In order to identify who the control group is in Sydney by Mosaic Type, the following Mosaic outputs are
viewed in conjunction:
The ranking of Mosaic Types most likely to live in detached housing, (shown in Table 4.2 below)
The scaled Mosaic map of Sydney, (shown in Figure 4.3), overlaid with the areas with the highest levels of detached housing development in Greenfield areas in the last 10 years.
The percentage representation of each Type in Sydney (derived from Table 4.1 above)
Table 4.2 –Mosaic Types most likely to live in detached housing
Source: adapted from Pacific Micromarketing, Mosaic Australia Profiles 2008 – Living Space>Housing Type> Separate Housing
Figure 4.3 – Mosaic Types by distance from the city centre
Source: adapted from Google Maps, 2011 and Pacific Micromarketing Mosaic 2011, courtesy of the Lend Lease research license
When Figures 4.2 and 4.3 are viewed in conjunction, it can be surmised that the Types that are in the
first half of the Mosaic rankings of Types most likely to live in detached housing and who also live
Red strike-throughs indicate rural and country town types not subject to this study
The orange area indicates LGAs with highest levels of detached dwelling development in Greenfield areas (MDP NSW)
Sydney’s city centre

38 © Laila Mehrpour, NAWIC
further than 20km from the city centre are therefore the types that can be classified as the control group.
Table 4.3 contains the final list making up the control group by Mosaic Type.
Table 4.3 – Sydney’s control group by Mosaic Type
Source: adapted from data derived from Google Maps, 2011 and Pacific Micromarketing Mosaic 2011, courtesy of the Lend Lease research license
Based on this data, the Sydney control group forms a total of 43.2% of the population of Sydney – a
significant proportion. In the global assessments later in the paper we assess the Types identified above
to see how they live in other cities around the world.
Table 4.4 – Mosaic Global Look Up Table (Sydney’s control group Types highlighted)
Source: adapted from Mosaic Global Look Up table, courtesy of Experian UK, 2011
This finite list of groups and Types is then used in the Mosaic Global assessment of housing types and
lifestyles in the cities subject to this study around the world. In the second half of the paper, the findings
of the Sydney condition will be used to compare against the conditions of four global cities. The Mosaic
Global function has aligned all of the Mosaic Types at a country level into a single table. Table 4.4
represents the abbreviated version of the complete table for the countries subject to this study.
The small red outlines indicate the types identified as Sydney’s control group
Large red boxes indicate Sydney’s control group by Global Group

39 © Laila Mehrpour, NAWIC
The table has identified the Types (indicated in small red boxes) from Table 4.3, and highlighted (in the
large red boxes) the way they correlate with the Types in Denmark, the United Kingdom and the United
States.

40 © Laila Mehrpour, NAWIC
Chapter 5 – London
London is equal first in the Global Cities Index along with New York City. In the four key areas, London
ranks consistently highly in the areas of cultural, infrastructural, political and economic characteristics
and is governed by a single entity in the Greater London Authority headed by the Mayor of London. The
case study for the city of London focuses on the area known as Greater London. The current
metropolitan planning instrument for London, The London Plan, has many objectives but this chapter
will focus specifically on containment and housing.
Containment Objectives
Maintaining the city’s boundaries, green belt and open spaces have been a prominent feature of the
metropolitan plan for London since 1935. The Metropolitan Green Belt, as it became known,
subsequently became the basis of the Green Belt (London and Home Counties) Act 1938. (Bowie,
2010) While the green belts in each region are defined by local authorities, the Government sets out its
policies and principles towards the green belts in Planning Policy Guidance Note 2: Green Belts
(PPG2). The PPG2 notes that “the purposes of Green Belt policy and the related development control
policies set out in 1955 remain valid today with remarkably little alteration.” (Department for
Communities and Local Government, 1995, p5) The five purposes outlined by PPG2 of greenbelts are:
“To check the unrestricted sprawl of large built-up areas
To prevent neighbouring towns from merging into one another
To assist in safeguarding the countryside from encroachment
To preserve the setting and special character of historic towns
To assist in urban regeneration, by encouraging the recycling of derelict and other urban land” (Department for Communities and Local Government, 1995, p5)
Indeed, when a comparison is drawn with the Sydney, Detroit or Dublin condition, the greenbelt is one
of the defining successes of the London Plan, both current and previous iterations. Access to the natural
environment still plays a prominent role in the strategic development of London, with “Areas of
deficiency for access to nature” (GLA, 2010) clearly defined in the current London Plan.
Drawing lessons from the Metropolitan Green Belt strategy of the United Kingdom could also have
positive implications for solving some of Sydney’s density issues as they relate to transport
infrastructure. David Higgins, Managing Director of Network Rail in the United Kingdom, indicated that
while the delivery of heavy rail transport infrastructure may be difficult for cities with low density urban
fringes such as Sydney, alternative models may be examined which connect existing urban centres and
workforces. Successful examples of this model have been carried out in Europe – such as the
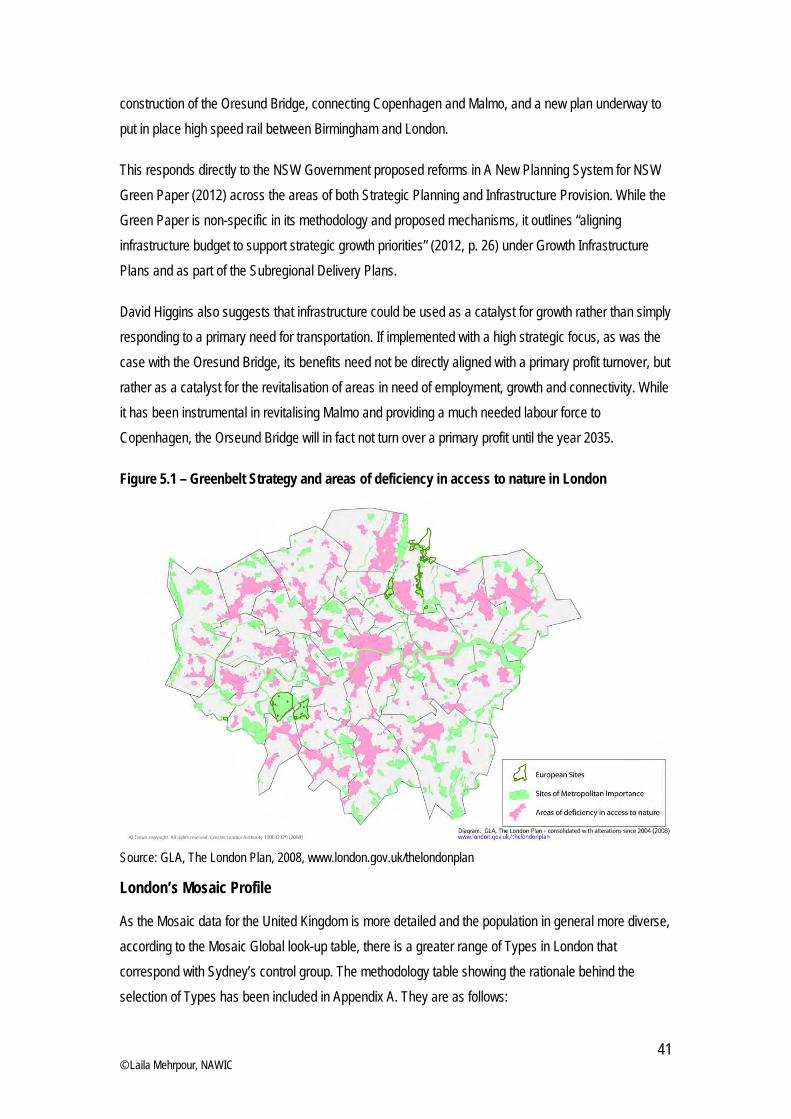
41 © Laila Mehrpour, NAWIC
construction of the Oresund Bridge, connecting Copenhagen and Malmo, and a new plan underway to
put in place high speed rail between Birmingham and London.
This responds directly to the NSW Government proposed reforms in A New Planning System for NSW
Green Paper (2012) across the areas of both Strategic Planning and Infrastructure Provision. While the
Green Paper is non-specific in its methodology and proposed mechanisms, it outlines “aligning
infrastructure budget to support strategic growth priorities” (2012, p. 26) under Growth Infrastructure
Plans and as part of the Subregional Delivery Plans.
David Higgins also suggests that infrastructure could be used as a catalyst for growth rather than simply
responding to a primary need for transportation. If implemented with a high strategic focus, as was the
case with the Oresund Bridge, its benefits need not be directly aligned with a primary profit turnover, but
rather as a catalyst for the revitalisation of areas in need of employment, growth and connectivity. While
it has been instrumental in revitalising Malmo and providing a much needed labour force to
Copenhagen, the Orseund Bridge will in fact not turn over a primary profit until the year 2035.
Figure 5.1 – Greenbelt Strategy and areas of deficiency in access to nature in London
Source: GLA, The London Plan, 2008, www.london.gov.uk/thelondonplan
London’s Mosaic Profile
As the Mosaic data for the United Kingdom is more detailed and the population in general more diverse,
according to the Mosaic Global look-up table, there is a greater range of Types in London that
correspond with Sydney’s control group. The methodology table showing the rationale behind the
selection of Types has been included in Appendix A. They are as follows:

42 © Laila Mehrpour, NAWIC
Table 5.1 – Mosaic UK Types of Sydney’s control group in London
Source: adapted from Mosaic UK Interactive Guide, Experian, 2011
However, the low percentages corresponding to each Type and the low total percentage for these
Types in London would indicate that while there may be a significant percentage of Britons who are
corresponding Types to Sydney’s control group, only a small percentage actually live in London. As
indicated by the descriptions, many of these Types have deliberately chosen semi-rural lifestyles,
outside the confines of the city. Others live in public housing, a tenure which accounts for far greater
numbers in the UK where it has a much stronger and more robust history, than in Australia. Spatially,
development areas in London are limited, and the current London Plan notes the housing shortage and
consequent lack of affordability of housing in London to be the most urgent of issues. (GLA, 2011)
The table below indicates the direct relationship between the control group in Sydney and London, and
the likelihood of these Types to live in detached housing in each city.
Table 5.2 – Comparison of Sydney’s control group and London’s control group equivalents
% control group
% of control group living in detached housing
% population in control group and in detached housing
Sydney 43.20% 100% 43.20% London 8.28% 0.00% 0.00%
Source: adapted from Mosaic UK Interactive Guide, Experian, 2011
There is very little detached housing available in London and what little there is, is well out of the reach
of the Types subject to this study. For this reason, the Types to whom detached housing is an important
lifestyle factor will forego living in London itself in favour of smaller towns in London’s exurbs.

43 © Laila Mehrpour, NAWIC
Chapter 6 – New York
“Underlying all of our efforts is a focus on the human and the neighborhood scale of the city.”
Amanda Burden City Planning Commissioner
NYC Strategic Plan, 2011
New York City is naturally contained by its peninsular topography and has a population of over 8 million
people covering an area of just 790 square kilometres. (NYC Dept of City Planning, 2011) As a globally
influential centre of politics and culture, New York’s macro aspirations for its future are focussed on
further improvement of amenity and transport for its residents, while reducing its carbon footprint.
While the current form of New York City is in general adherence to many New Urbanist principles, the
planning of the city preceded the movement, and therefore did not set out to create a New Urbanist
landscape, but rather, the New Urbanism movement drew many of its lessons from the land use
strategies of New York City.
The planning ordinances in New York City’s history have led to New Yorkers’ daily means of travel
centring on means other than travel by private car, and as a result, using 2/3 less carbon than the
average United States resident. (NYC Dept of City Planning, 2011) The current plan for New York City
is focussed on achieving decentralisation and investment in new economic hubs in some of the city’s
most neglected areas.
In general, development is actively channelled towards transit rich areas. Where development of
significant areas of residential dwellings takes place in the outer boroughs, it does so in conjunction with
the development of comparatively sized commercial space to maximise on the decentralisation
objectives of the metropolitan area (NYC Dept of City Planning, 2011) and to ensure that new housing
does not cause excessive additional loads on existing infrastructure.
New York’s Macro Aspirations
New York City already enjoys one of the most efficient transport networks in the world. An assessment
of the city’s strategic aims indicates a strong inclination towards the further improvement of transport
around the city. One of these aims is that by 2030, 95% of all new development must be within a ten
minute walk of a subway stop. Currently this figure is already at 87%. (NYC Dept of City Planning, 2011)

44 © Laila Mehrpour, NAWIC
Copenhagenising NYC
In 2009, Jan Gehl, one of the most influential figures in the contemporary documentation of the design
of the city of Copenhagen was engaged by the Department of Transport of New York City to make
similar adjustments to the streets and public spaces of New York. With the introduction of a vast
network of bike lanes across New York’s five boroughs and the incremental addition to public open
spaces by removing lanes of traffic, New York has seen a significant increase in the use of bicycles in
the city as a primary means of transport. By reducing lanes of traffic, pedestrian spaces and streets
have become safer.
It is evident that while the densities of New York City are higher than any other city in this study, it has
certainly had a positive impact on the provision of infrastructure to the city. Higher densities mean lower
costs per capita for infrastructure, a greater tax and income base for reinvestment in the city and with
which to improve amenity. The high population densities have also ensured the viability of the transport
system, as pointed out in Green Metropolis (2009), that “the most significant factor in determining the
viability of any transit system – far more significant than fare levels or demographics or willpower or
anything else – is population density” (Owen, 2009, p.119)
Urban Renewal
Perhaps the most significant of the planning mechanisms implemented by the New York City
Department of Planning is its zoning mechanisms, underlined by PlaNYC, Mayor Michael Bloomberg’s
2007 initiative to prepare the city for one million more residents by 2030. Over 97% of the 127 initiatives
were implemented within 12 months of the plans launch and subsequently expanded to include 5 more
initiatives with 400 specific milestones set for completion by 31st of December, 2013.
The underlying key to the success of the zoning plans contained within PlaNYC is its approach to
planning and zoning as fluid mechanisms with which to achieve overall city objectives rather than catch-
all long term mechanisms that aim to solve all future planning conundrums.
Alexandros Washburn, Chief Urban Designer for the New York City Department of Planning, notes that
“as long as they work, planning mechanisms don’t have to be simple”. He drew on the example of the
High Line, a recently redeveloped park in Chelsea, south of Manhattan that previously existed as an
elevated industrial railroad. The High Line is now a celebrated urban park which has been the
centrepiece of the revitalisation of the Special West Chelsea District, a rezoning of former meatpacking
and industrial warehouses into high end residential and commercial spaces. This was mainly achieved
through the use of transferable development rights (TDRs), whereby the owners of the land under the
railway, who were prevented from building up by the presence of the railway, could transfer their
development rights to adjoining properties, thereby being compensated for the land that they were not

45 © Laila Mehrpour, NAWIC
allowed to develop. The new owners of these development rights could add to their existing building by
building up to a certain extended allowable limit, which could be further extended if they proposed to
develop a certain minimum percentage of affordable housing.
Figure 6.1 – The New York City High Line development
Source: Iwan Baan, Design Boom, 2011

46 © Laila Mehrpour, NAWIC
Washburn notes that this was just one example of how complex planning mechanisms can facilitate
simple objectives. One such objective underpinning any development initiative is that the solution must
resolve at least two problems. In the case of the High Line, the TDRs answered several. They allowed
the reuse of a disused icon of the city into much needed usable open space in an area of the city
traditionally deficient in its access to open space; it allowed the owners of the land below the High Line,
who had been campaigning for its (expensive and disruptive) removal to be compensated for the land
they could not develop and finally, it facilitated the wider city objective of the development of more office
and residential space, particularly affordable residential by incentivising the new owners of the
development rights to provide them.
The High Line was also notable in the way it encompassed public engagement and community
participation. The instigating factor in the redevelopment of the High Line was the activities of a resident
and city activist group known as Friends of the High Line, who initially campaigned and subsequently
worked with the New York City Government in facilitating the redevelopment of the High Line.
It is a best practice example of all four of the planning objectives noted in the NSW Green Paper, with
exemplary community participation, provision of infrastructure, strategic focus and streamlined approval.
New York’s Mosaic Profile
The equivalent Types to Sydney’s control group make up well over half of the overall population of the
city. However, detached living in New York City is almost unheard of, even in the minor boroughs. The
following figures are drawn from both US Census information and an in depth Mosaic analysis by
zipcode for each of the five boroughs of New York City. The tabulated detail of this analysis can be
found in Appendix B.
Table 6.1 - Mosaic USA Types of Sydney’s control group in New York City
Source: adapted from Experian Mosaic USA Interactive Guide, 2011
It is clear from the data that while New York is seen to be one of the most diverse metropolises in the
world, the city is actually made up of quite a small number of very specific types of people. There is an
inherent diversity within this group, but the levels of place stratification and economic segregation in the
city are also quite high. As with London, this is driven by the high levels of extreme wealth that can be

47 © Laila Mehrpour, NAWIC
found in the city – a function of its economic base, and the ability to attract wealth and opportunities
globally.
Table 6.2 indicates the direct relationship between the control group in Sydney and New York, and the
likelihood of these types to live in detached housing in each city.
Table 6.2 – Comparison of Sydney’s control group and New York’s control group equivalents
% control group
% of control group living in detached housing
% population control group and in detached housing
Sydney 43.20% 100% 43.20% New York City 58.64% 0.00% 0.00%
Source: adapted from Mosaic USA Interactive Guide, Experian, 2011
Unlike London, there is a representation of Types who are suburban in nature, but who choose to live in
the denser surrounds of New York City. In London, the same types tended to choose not to live in
London at all.
As with London, the lack of available detached housing sees negligible numbers of New Yorkers who fit
the control group equivalent profile actually living in detached housing in the confines of the city.
Unsurprisingly, the housing types of all of New York’s five boroughs are at a higher density than
elsewhere in the country with a distinct under-representation of detached dwellings anywhere in New
York City.

48 © Laila Mehrpour, NAWIC
Chapter 7 – Copenhagen
The Danish capital is currently home to over 1.9 million inhabitants as at 2011 (Statistics Denmark,
2011) and is a working harbour city, situated along the north-eastern coastline of the island of Zealand.
The first regional plan for the Copenhagen area was initiated in 1947, primarily to combat the
uncontrolled urban growth arising from industrialisation. Called the "Finger Plan", it divided the
Copenhagen suburbs into five ‘fingers’ which were built around the S-train railway lines. This model is
relatively common in Scandinavia and certain other parts of Europe, with cities such as Stockholm and
Helsinki utilising the same method of ‘fingers’ of development concentrated around railway lines to
preserve parts of the natural landscape and to limit the spread of sprawl.
The Alexander et al tome, A Pattern Language (1977), identifies this method of planning as the third of
the regional planning patterns that “can never be designed or built in one fell swoop – but patient
piecemeal growth” (p xix) – called City Country Fingers.
If we wish to re-establish and maintain the proper connections between city and country, and
yet maintain the density of urban interactions, it will be necessary to stretch out the urbanized
area into long sinuous fingers which extend into the farmland... Not only will the city be in the
form of long narrow fingers, so will the farmlands adjacent to it. (Alexander et al, 1977, p24)
Figure 7.1 shows the Copenhagen plan against the Alexander pattern of City Country Fingers.
Figure 7.1 – City Country Fingers and the Copenhagen Finger Plan
Source: (left) Alexander et al, 1971, A Pattern Language – Towns, Buildings, Construction, Oxford University Press, New York, p.25, (right) Matthiesson, C.W., 2007, Infrastructure Factsheet, Ministry of Foreign Affairs Denmark, http://www.netpublikationer.dk/um/8583/html/chapter01.htm

49 © Laila Mehrpour, NAWIC
Overall, the finger plan worked well in guiding urban development, and is widely saluted for its foresight.
According to Pedroli et al (2007), however, the plan was not without its flaws. The finger plan model was
not suited to the pattern of development in the north but was appropriated anyway, and contained some
“indefensible ideas (such as the establishment of 15 airports to provide local, airborne commuter
services)” (Pedroli et al, 2007, p324). However, the plan has left an overall positive legacy on the city.
Copenhagen is regularly near the top of world liveability indexes and eco-rankings. Indeed the city is
aiming to be carbon neutral by the year 2025, without reliance on offsets, mainly by investing in green
energy to boost local growth (Quest, R, 2011).
Figure 7.2 – Bike lanes in the northern fringe suburbs of Copenhagen
Source: Laila Mehrpour
Additionally, a positive historical association with the bicycle continues today. Over the years, bicycles
have become a part of Copenhagen’s urban identity. City planning has facilitated this shift with some of
the most bike-friendly town planning initiatives in the world. Copenhagen planning policy notes that at
present 36% of Copenhagen’s population travels to work, school or university by bicycle, and the
planning policy is actively targeting the expansion of this figure to 40% by 2013 and 50% by 2015. The

50 © Laila Mehrpour, NAWIC
bike lanes are constantly being expanded and widened to support the ever growing number of cyclists,
and much of the network even has its own signal system.
A key signifier of the success of the Copenhagen planning system is the level of public engagement
with the development and planning of the city. The team at Gehl Architects has been involved with the
Copenhagenisation strategies implemented in New York and Melbourne, says that when it comes to the
use of their city, Copenhagenites are engaged and willing to be involved. She went on to cite the
example of the Orestaden development in Amager, the southern part of Copenhagen, which involved
little community participation. A new apartment complex located just 15 minutes from the city centre well
serviced by rail and bike paths, it promised much future growth for investors and much needed housing
for the city. And yet it achieved lacklustre results and minimal interest fro m both buyers and renters.
Anne Sophie Kvist of Gehl Architects noted that, perhaps incredibly to a Sydneysider, it failed because
of the poor quality of its outdoor and public spaces. When so much of life is lived in these shared
communal areas, it is important that the spaces are user friendly, and no promise of future financial
growth was great enough to overcome this lifestyle hurdle.
Figure 7.3 – Recreation in Copenhagen is primarily carried out in public spaces
Source: Laila Mehrpour
Copenhagenites also take great pains to “vote with their feet”. The city experiences one of the coldest
winters in the world, but the afore-mentioned 36% of the population who cycle to work, school or
university everyday as a primary means of transport only drops by 5% in Copehagen’s harsh winters.
Indeed, the city clears the snow from the cycle tracks before tackling the roads, to cater for the
“stubborn” propensity of Copenhagenites to cycle whatever the weather. The residents of Copenhagen

51 © Laila Mehrpour, NAWIC
not only believe in the initiatives deployed in the city, they make active efforts to ensure that the services
provided are used and thus, continuously improved.
Furthermore, and most notably in the context of the aims of the NSW Green Paper, the residents of
Copenhagen feel empowered and engaged with the outcomes provided for their city. As pointed out in
the Green Paper, residents in NSW also “care deeply about new development and how it changes their
neighbourhood. All members of the community must be able to have their say on the decisions that
affect them.” (p.9) Copenhagen is thus a worthwhile best practice example of how communities can be
both engaged and empowered through the planning process.
Copenhagen’s Mosaic Profile
The area of Copenhagen is just 1/48th of Sydney’s but its density is at nearly seven times that of
Sydney. It is a good counter study for Sydney due to a number of similar geographic and lifestyle
factors. As a working harbour city and a coastal city, the geographic contexts are very similar. Likewise,
as with Sydney, Copenhagen’s economic origins are mercantile in nature. Furthermore, Denmark is
highly urbanised reflecting the metropolitan primacy observed in Sydney, with approximately 85% of the
population residing in cities. 34% of the total population resides in Copenhagen.
Table 7.1 – Mosaic Denmark Types of Sydney’s control group in Copenhagen
Source: adapted from unpublished Mosaic Denmark data, courtesy of Experian UK 2011
Table 7.2 – Comparison of Sydney’s control group and Copenhagen’s control group equivalents
% control group
% of control group living in detached housing
% population control group and in detached housing
Sydney 43.20% 100% 43.20% Copenhagen 27.92% 22.17% 6.19%
Source: adapted from unpublished Mosaic Denmark data, courtesy of Experian UK, 2011
As shown in the table above, the equivalent Mosaic Types to Sydney’s control group form just under a
third of the Danish population. As with London, a number of the Types that align with Sydney’s control
group in Denmark are actually not likely to live in Copenhagen at all, but rather in semi-rural areas
within easy reach of the large cities.

52 © Laila Mehrpour, NAWIC
Table 7.3 shows the type of housing that correlates with each of the Mosaic Types indicated above. It
shows that the overwhelming percentage of the B Group Types are likely to choose to live in detached
housing. As the wealthier of the three identified Mosaic Groups that form the Danish equivalent of the
control group, they have the financial capability to have this choice. Most importantly, it indicates that
amongst the collective group, apartments are just as likely to be chosen as detached dwellings, with
semi-detached housing a viable mid-range alternative.
Table 7.3 – Types of Housing for the Danish equivalents of Sydney’s control group
Source: adapted from unpublished Mosaic Denmark data, courtesy of Experian UK 2011
The most recent publicly available dwelling data available from Statistics Denmark shows the spread of
detached housing in the different regions of Denmark as shown below. Region Hovedstaden is the
capital region – Copenhagen and its suburbs.
Table 7.4 – Dwelling stock by type of building – regional analysis (Denmark, 2009)
Source: Statistics Denmark, 2010, Statistical Yearbook 2010, Income, Construction and Housing Report 2009 data, p.16
When viewed in conjunction with the Danish Types identified as Sydney’s control group, the data above
shows that in Copenhagen, 62% of dwellings are indeed apartments, with just under 23% of people
living in detached dwellings and a further 12% living in semi-detached dwellings. It would indicate that
the reasonable trade-off for living in the capital region is to accept a denser housing model, unless one
has the financial capability to select a detached dwelling.
Amongst the most prevalent groups, as is clearly demonstrated by the data, there is a strong bias
towards higher density dwelling models, particularly apartment style living, with the sole exception to
this rule appearing to be the A Group, in the north of Copenhagen, where the detached housing
Copenhagen Region figures indicated in red box

53 © Laila Mehrpour, NAWIC
enclaves of the very wealthiest of Copenhagenites can be found. As the spread of wealth appears to be
across the entire city, it would appear that a significant portion of higher income earners also live in
apartments both in the inner city and in the suburbs. This is in direct contrast to the Sydney situation
where apartment living in the suburbs is invariably the mainstay of low income earners.
Figure 7.4 – Apartments in central Copenhagen
Source: Laila Mehrpour
Notably, one of the general trends observed in Denmark was that just as the size of households was
decreasing, the size of dwellings is increasing. This is obviously resulting in a net increase in number of
dwellings. The trend toward smaller households is also noted in Australia (Kelly et al, 2011a) with an
aging population.

54 © Laila Mehrpour, NAWIC
Chapter 8 – Detroit
One of the most prominent examples of passive, industry led planning and its possible consequences is
the city of Detroit in Michigan, USA. With a peak population of nearly 5 million, Detroit was once the
capital of the United States megalithic auto industry. Detroit is also a case study in the long term effects
of economic and ethnic segregation on the health and wellbeing of the city.
Perhaps more so than the other cities discussed in this paper, Detroit was profoundly affected by the
post war boom and subsequent democratisation of the automobile. The original footprint of the city, up
to the post war period is articulated in the darker red centre of the figure below. Both maps in the figure
demonstrate the physical form of Detroit as a city today with its ill-defined and sprawling edges.
Figure 8.1 – Detroit and its environs and the Detroit-Warren-Livonia MSA2 and Detroit-Warren-
Flint CSA3
Source: adapted from Google Maps, 2011 and http://commons.wikimedia.org/wiki/File:DetroitMSA.png
In terms of industry, the city’s governance relied for many years on the auto industry alone. Daniel
Okrent , writing for Time Magazine in 2009, points out:
If you wanted to get elected in southeastern Michigan, you had to support the party line
dictated by the Big Four — GM, Ford, Chrysler and their co-conspirator the United Auto
Workers.... Anything that might limit the industry's income was bad for the auto industry, and
anything bad for the auto industry was deemed dangerous to Detroit. (Okrent, Time, 24 Sept,
2009)
2 In the context of the US census bureau MSA refers to the Metropolitan Census area – in this case, it refers to Detroit, Warren and Livonia 3 CSA refers to the Combined Statistical Area – common where cities are made up of a number of smaller adjacent and/or related Metropolitan Statistical Areas. In this case, the CSA is Detroit and its adjacent MSAs of Warren and Flint

55 © Laila Mehrpour, NAWIC
When the auto industry of Detroit finally collapsed with the downfall of GM, it’s newly unemployed, fringe
dwelling middle and working classes had lost jobs and defaulted on loans and were subsequently forced
to leave in droves. Over the last few years, much of Detroit has been abandoned. In 2009,
unemployment in the city was at almost 30%. Once the United States 4th largest city, Detroit was, in
2009, the 11th largest and is now the 18th largest city and slipping rapidly (US Census Bureau, 2011). A
2009 parcel survey of the city found that one quarter of the residential lots in the city were either vacant
or undeveloped, and a further ten per cent unoccupied (Gallagher, 2010). The yawning gaps between
populated areas have forced the city’s infrastructure to near-collapse. The Detroit-Warren-Livonia run,
the main commuter travel path for the middle class working population is the second worst in the United
States, as identified by Woolsey for Forbes.com in 2008.
Detroit is losing population and has one of the worst commutes in America. Transit design in
Motown is, not unexpectedly, tailored to the car, yet traffic patterns aren't smooth...When you
add up all the people that walk, carpool or take public transit to work, it's only 11% of the
Detroit commuting population; that's the worst of any big city in America. (Woolsey, M., 2008)
Table 8.1 - Mosaic USA Types of Sydney’s control group in Detroit
Source: adapted from Experian Mosaic USA Interactive Guide, 2011
The analysis process for the profiling of Detroit was carried out by identifying the top three dominant
Types by zipcode in Detroit. The tabulated detail of this analysis can be found in Appendix B. The
Mosaic Profile for Detroit shows that while there are only seven Types in total that make up the Mosaic
USA equivalents of Sydney’s control group in Detroit, they make up a staggering 65.37% of the overall
population of Detroit. Indeed, there are more of these Types of households in Detroit than there are in
Sydney.
The bulk of the population of Detroit is shown to be made up of only a small number of Mosaic Types
indicating that while there is a large African American population in the city (indeed, a majority), there is
little ethnic or economic diversity. The housing typologies also remain fairly low density with an over-
representation of detached housing in 46.42% of the population. The higher density groups are only in
medium density formations of up to nine units.
Table 8.2 indicates the direct relationship between the control group in Sydney and Detroit, and the
likelihood of these types to live in detached housing in each city.

56 © Laila Mehrpour, NAWIC
Table 8.2 – Comparison of Sydney’s control group and Detroit’s control group equivalents
% control group
% of control group living in detached housing
% population control group and in detached housing
Sydney 43.20% 100% 43.20% Detroit 65.37% 71.01% 46.42%
Source: adapted from Mosaic USA Interactive Guide, Experian, 2011
In four out of the seven identified Types that correlate with Sydney’s control group, there is an over-
representation of detached single dwellings. These Types alone account for over 46% of Detroit’s
population.
The economic downturn has forced Detroit’s hand into implementing measures that should have been
implemented many years ago. The passive planning and inaction of policy makers, as well as pandering
to the whims of the city’s auto industry and market has created a situation that has seen the decline of
all of the parties involved to near extinction. The government of Detroit now plans to implement some
difficult decisions which involve relocating existing residents from sparsely populated areas in order to
ensure the continued operation of the city’s infrastructure.

57 © Laila Mehrpour, NAWIC
Conclusion
As evidenced by the market assessment carried out in Chapters 1 and 2, there is an inherent dichotomy
in the desires of Sydneysiders and in their micro and macro aspirations for the city. While there is a
desire for a continued low density profile for the city, and large suburban homes, there is also a desire
for Sydney to take its place amongst the global powerhouses and to secure global opportunities for the
continued prosperity of the city.
With the aging of the population, and a general trend towards smaller households (not unique to
Australia and observed in all of the cities subject to this study) the largest of the compromises
households have been prepared to make have tended to be in the actual features of the dwelling,
traditionally most important to young families. There has been a hitherto disproportionate focus on
young families as the dominant household type. This focus will need to shift as there is already a
significant shortage of appropriately priced and sized housing across the city in a variety of densities,
and not just on the urban fringes.
These findings are in stark contrast to the widely publicised and sensationalist figures published
annually in the mass media in Australia. A brief interrogation of the figures published indicates them to
be neither comprehensive nor rigorous in their assessments. The widely publicised findings of reports
such as Demographia’s Annual International Housing Affordability Survey has had a negative impact on
the image of higher density housing, and has succeeded in ensuring that land releases continue to form
a part of any housing strategy proposed for the city in fear of alienating the ‘Aussie battler’ and
‘aspirational’ electorates.
Furthermore, as indicated in Chapter 3, housing in Australia has traditionally been associated with
detached home ownership and supported by an incentivised taxation system that made any other
choice difficult.
The Mosaic profile for Sydney indicates that the control group forms over 40% of the overall population
of the city and tend to live over 20km from the city centre. When aligned with the same groups globally,
it was found that in London, New York and Copenhagen, the majority of the control group, to whom the
housing features characterised by an abundance of space inside the home and out are most important,
tended mostly not to live in the confines of the city at all but to live in surrounding towns with their own
sets of local amenities and infrastructure, and where required, commuting to centralised services in the
city. This has had the effect of maintaining the confines of the city and ensuring that the area of the city
remains sustainable for the provision of infrastructure of services. A few factors have contributed to this
outcome.
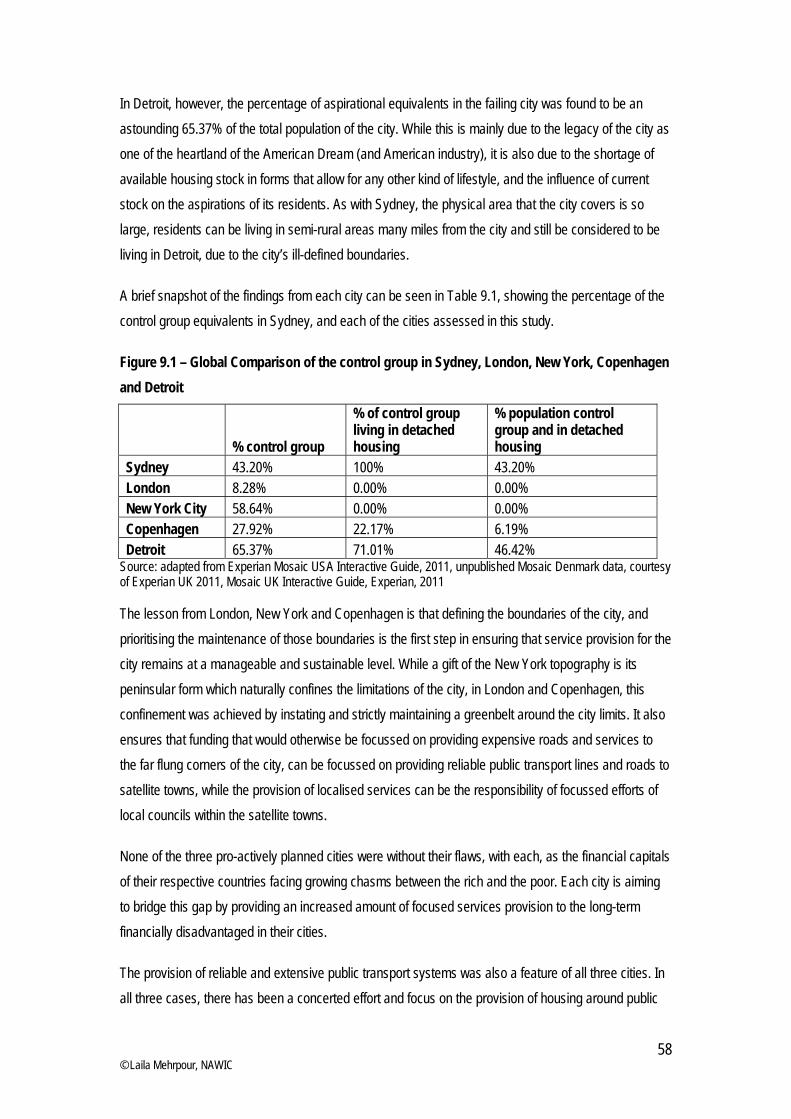
58 © Laila Mehrpour, NAWIC
In Detroit, however, the percentage of aspirational equivalents in the failing city was found to be an
astounding 65.37% of the total population of the city. While this is mainly due to the legacy of the city as
one of the heartland of the American Dream (and American industry), it is also due to the shortage of
available housing stock in forms that allow for any other kind of lifestyle, and the influence of current
stock on the aspirations of its residents. As with Sydney, the physical area that the city covers is so
large, residents can be living in semi-rural areas many miles from the city and still be considered to be
living in Detroit, due to the city’s ill-defined boundaries.
A brief snapshot of the findings from each city can be seen in Table 9.1, showing the percentage of the
control group equivalents in Sydney, and each of the cities assessed in this study.
Figure 9.1 – Global Comparison of the control group in Sydney, London, New York, Copenhagen
and Detroit
% control group
% of control group living in detached housing
% population control group and in detached housing
Sydney 43.20% 100% 43.20% London 8.28% 0.00% 0.00% New York City 58.64% 0.00% 0.00% Copenhagen 27.92% 22.17% 6.19% Detroit 65.37% 71.01% 46.42%
Source: adapted from Experian Mosaic USA Interactive Guide, 2011, unpublished Mosaic Denmark data, courtesy of Experian UK 2011, Mosaic UK Interactive Guide, Experian, 2011
The lesson from London, New York and Copenhagen is that defining the boundaries of the city, and
prioritising the maintenance of those boundaries is the first step in ensuring that service provision for the
city remains at a manageable and sustainable level. While a gift of the New York topography is its
peninsular form which naturally confines the limitations of the city, in London and Copenhagen, this
confinement was achieved by instating and strictly maintaining a greenbelt around the city limits. It also
ensures that funding that would otherwise be focussed on providing expensive roads and services to
the far flung corners of the city, can be focussed on providing reliable public transport lines and roads to
satellite towns, while the provision of localised services can be the responsibility of focussed efforts of
local councils within the satellite towns.
None of the three pro-actively planned cities were without their flaws, with each, as the financial capitals
of their respective countries facing growing chasms between the rich and the poor. Each city is aiming
to bridge this gap by providing an increased amount of focused services provision to the long-term
financially disadvantaged in their cities.
The provision of reliable and extensive public transport systems was also a feature of all three cities. In
all three cases, there has been a concerted effort and focus on the provision of housing around public

59 © Laila Mehrpour, NAWIC
transport lines and not the other way around. In New York, it has led to a highly efficient system which
aims to ensure that the outstanding majority of the city’s population are within a short walk of a subway
stop, further reducing the need to rely on private car and clearing the roads inside the city of congestion
and its air of traffic emissions.
The key feature of all three cities was the focus on so called ‘stretch’ targets well beyond the norm for
most cities. In London, the stretch goal is the access of all residents to nature and open space. In New
York, it is the aforementioned easy and universal access to reliable, efficient and affordable public
transport, and in Copenhagen, it is the achievement of the aim to be entirely carbon neutral without
relying on offsets by the year 2025.
These are the kind of stretch targets that are currently out of the reach of a sprawling city like Sydney,
as it is focussed on the provision of far more basic needs for its residents such as reliable roads, public
transport and affordable housing. It is certainly currently outside the reach of Detroit, which is focussing
its efforts simply on survival.
The danger for Sydney is that fear driven policy and media induced panic about the implications of
higher density development will continue to drive the demand for detached housing and subsequently,
sprawl, to well beyond what the city can service. In a worst case scenario, should adverse economic
conditions ever come to fruition, to face a Detroit-like future.
In order to meet Sydney’s macro aspirations of growth on a global scale, it is important for the strategic
planning of the city to address the unchecked sprawl that has become a burden on the provision of
infrastructure to the city. While this may mean that Sydneysiders will have to adapt to living in higher
density dwellings, it will, as demonstrated through the Mosaic analyses of other cities around the world,
ensure that those for whom living close to the city centre is an important factor will continue to live in the
city and will readily make the sacrifice of living in smaller better designed dwellings, should more of this
type of housing become available. The main problem in Sydney is one of supply – there simply isn’t
enough affordable choice with regard to housing types in the suburbs in which people want to live.
It is for these reasons that it can also be surmised that the days of allowing the Great Australian Dream
to drive development are long since gone – not simply because the city can no longer bear this burden,
though this is an important driver, but because with the changing needs of the population, it is simply
not aligned with the complex desires of the people anymore.
For this very reason it is important to assess and interrogate the available market data using geo-
demography tools and consumer segregation data, as the needs of the population of cities are no
longer as simple as they once were. Developers and private enterprises have already started to use this
information to drive solutions tailored to their desired outcomes, and it is important for public policy

60 © Laila Mehrpour, NAWIC
drivers and strategists to make use of all of the available information to make informed choices for the
city.
This does not mean that the Australian egalitarian cultural ideals of opportunities for all, inherent in the
concept of the Great Australian Dream, should be abandoned, rather that the new Great Australian
Dream should be redefined to embrace the true meaning of sustainable development to ensure that
equitable access to quality housing opportunities are available to future generations of Sydneysiders
and that current generations assume responsibility and stewardship of the city for their own
development activities to allow future generations of Australians the ability to realise their own Great
Australian Dream.
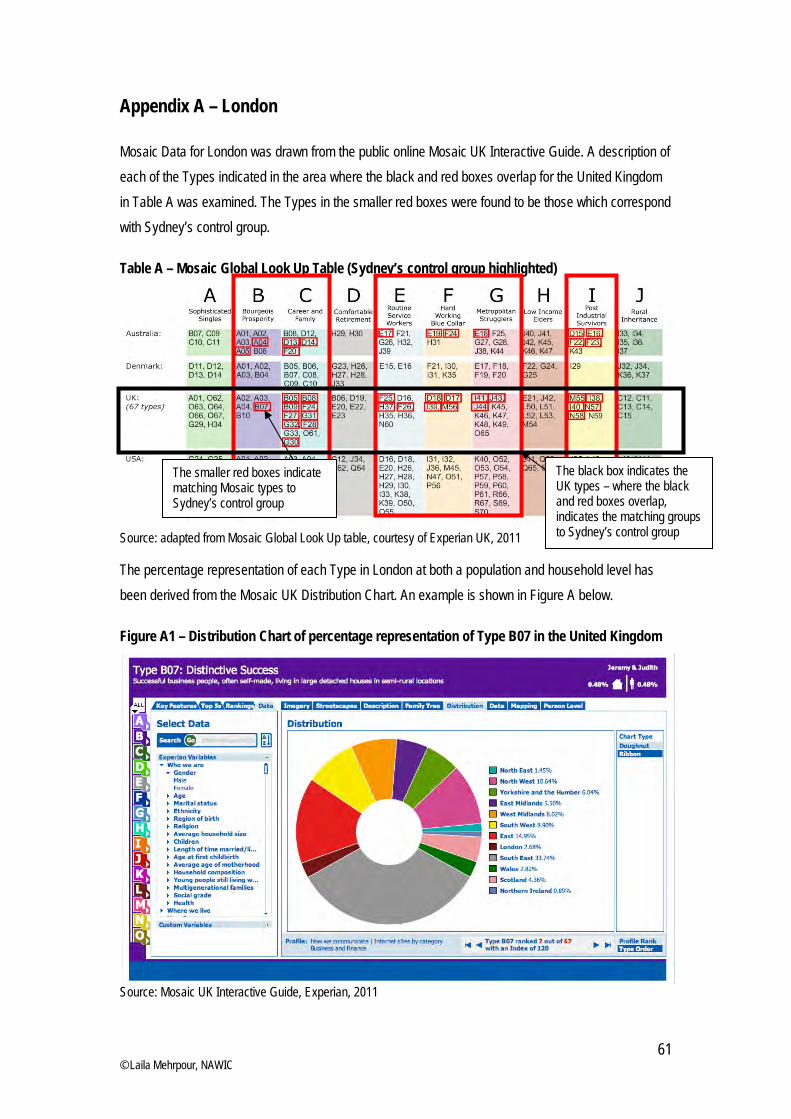
61 © Laila Mehrpour, NAWIC
Appendix A – London
Mosaic Data for London was drawn from the public online Mosaic UK Interactive Guide. A description of
each of the Types indicated in the area where the black and red boxes overlap for the United Kingdom
in Table A was examined. The Types in the smaller red boxes were found to be those which correspond
with Sydney’s control group.
Table A – Mosaic Global Look Up Table (Sydney’s control group highlighted)
Source: adapted from Mosaic Global Look Up table, courtesy of Experian UK, 2011
The percentage representation of each Type in London at both a population and household level has
been derived from the Mosaic UK Distribution Chart. An example is shown in Figure A below.
Figure A1 – Distribution Chart of percentage representation of Type B07 in the United Kingdom
Source: Mosaic UK Interactive Guide, Experian, 2011
The black box indicates the UK types – where the black and red boxes overlap, indicates the matching groups to Sydney’s control group
The smaller red boxes indicate matching Mosaic types to Sydney’s control group

62 © Laila Mehrpour, NAWIC
The percentage representation of each type is then collated and expressed as a percentage of the
overall population by household of London as defined by the Office for National Statistics, July 2010
data. The area marked as London in both Mosaic and census data relates directly to the area known as
Greater London.
The type of housing for each Mosaic Type was also examined. An example of the Mosaic output is seen
in Figure A2 below, which shows the property types for the example Type B07. A representation of 100
represents direct alignment with the United Kingdom average while numbers over or under this figure
represent an over or under-representation for each particular type of housing respectively for this
Mosaic Type.
Figure A2 – Mosaic Data Chart – Type of Property
Source: Mosaic UK Interactive Guide, Experian, 2011
While housing type data has not been specifically tabulated for London, the percentage representation
of each Mosaic Type in London is indicative enough to show the trends pertinent to this study – that is,
that the Types to whom detached living is most important will live outside of the confines of the Greater
London Area in semi rural settings, with only a small percentage of each type actually choosing to live in
London.
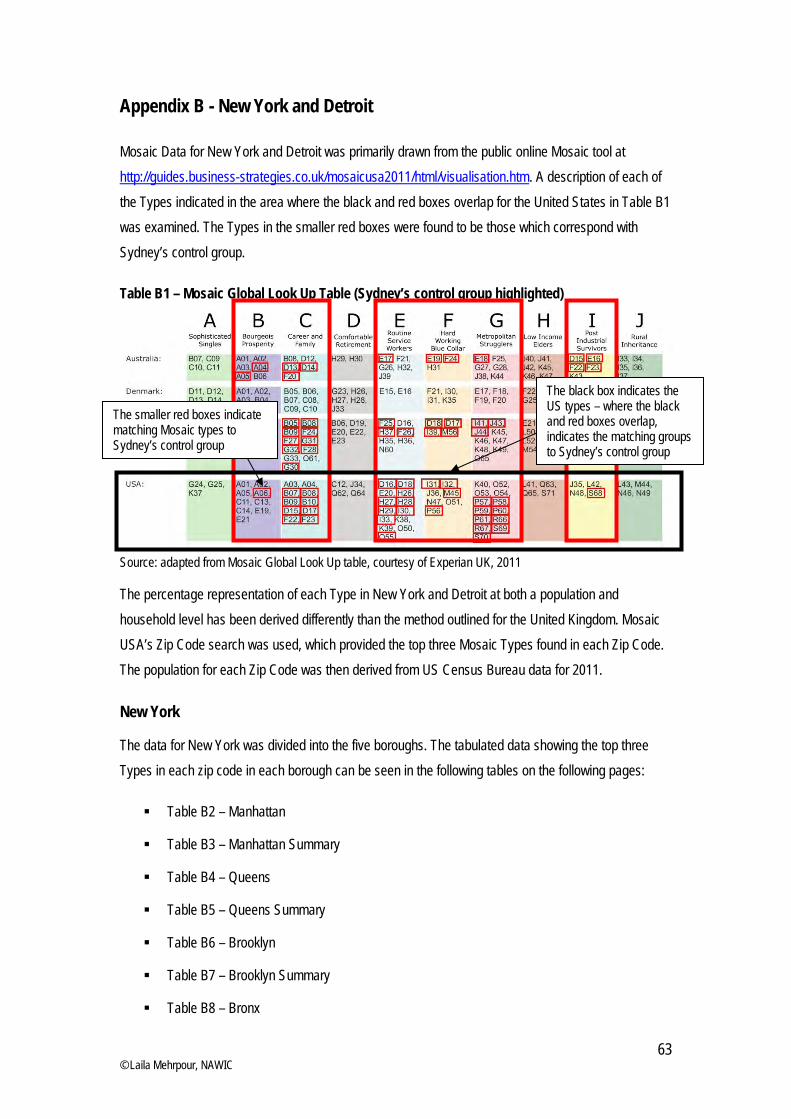
63 © Laila Mehrpour, NAWIC
Appendix B - New York and Detroit
Mosaic Data for New York and Detroit was primarily drawn from the public online Mosaic tool at
http://guides.business-strategies.co.uk/mosaicusa2011/html/visualisation.htm. A description of each of
the Types indicated in the area where the black and red boxes overlap for the United States in Table B1
was examined. The Types in the smaller red boxes were found to be those which correspond with
Sydney’s control group.
Table B1 – Mosaic Global Look Up Table (Sydney’s control group highlighted)
Source: adapted from Mosaic Global Look Up table, courtesy of Experian UK, 2011
The percentage representation of each Type in New York and Detroit at both a population and
household level has been derived differently than the method outlined for the United Kingdom. Mosaic
USA’s Zip Code search was used, which provided the top three Mosaic Types found in each Zip Code.
The population for each Zip Code was then derived from US Census Bureau data for 2011.
New York
The data for New York was divided into the five boroughs. The tabulated data showing the top three
Types in each zip code in each borough can be seen in the following tables on the following pages:
Table B2 – Manhattan
Table B3 – Manhattan Summary
Table B4 – Queens
Table B5 – Queens Summary
Table B6 – Brooklyn
Table B7 – Brooklyn Summary
Table B8 – Bronx
The black box indicates the US types – where the black and red boxes overlap, indicates the matching groups to Sydney’s control group
The smaller red boxes indicate matching Mosaic types to Sydney’s control group

64 © Laila Mehrpour, NAWIC
Table B9 – Bronx Summary
Table B10 – Staten Island
Table B11 – Staten Island Summary
The summary tables indicate the top Types found in each borough. In the context of these tables,
columns entitled Number refer to the number of persons. This has been extrapolated from the
percentage of the relevant Mosaic Type expressed as a figure of the overall population of the Zip Code.
Table B2 – Top Mosaic Types in Manhattan by Zip Code
Source: adapted from Mosaic USA Interactive Guide, Experian, 2011

65 © Laila Mehrpour, NAWIC
Table B3 –Top Types in Manhattan (Summary)
Source: adapted from Mosaic USA Interactive Guide, Experian, 2011
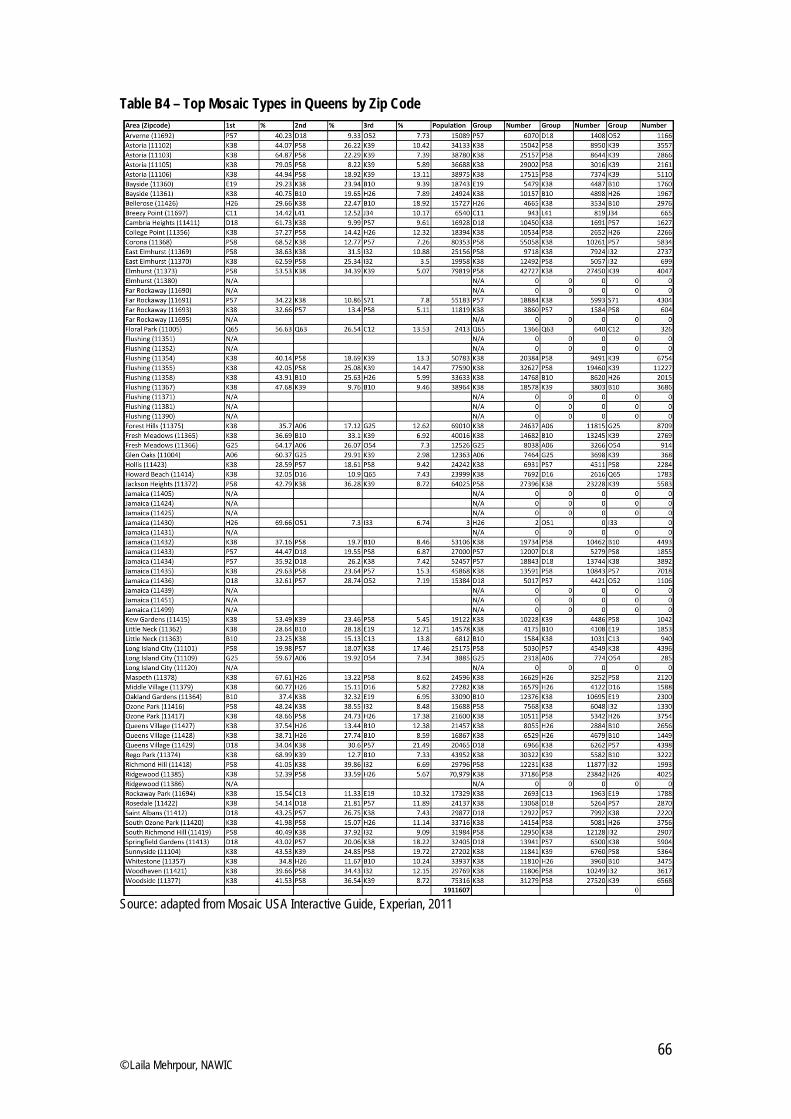
66 © Laila Mehrpour, NAWIC
Table B4 – Top Mosaic Types in Queens by Zip Code
Source: adapted from Mosaic USA Interactive Guide, Experian, 2011

67 © Laila Mehrpour, NAWIC
Table B5 – Top Types in Queens (Summary)
Source: adapted from Mosaic USA Interactive Guide, Experian, 2011
Table B6 – Top Mosaic Types in Brooklyn by Zip Code
Source: adapted from Mosaic USA Interactive Guide, Experian, 2011

68 © Laila Mehrpour, NAWIC
Table B7 – Top Types in Brooklyn (Summary)
Source: adapted from Mosaic USA Interactive Guide, Experian, 2011
Table B8 – Top Mosaic Types in the Bronx by Zip Code
Source: adapted from Mosaic USA Interactive Guide, Experian, 2011
Table B9 – Top Types in the Bronx (Summary)
Source: adapted from Mosaic USA Interactive Guide, Experian, 2011

69 © Laila Mehrpour, NAWIC
Table B10 – Top Mosaic Types in Staten Island by Zip Code
Source: adapted from Mosaic USA Interactive Guide, Experian, 2011
Table B11 – Top Types in Staten Island (Summary)
Source: adapted from Mosaic USA Interactive Guide, Experian, 2011

70 © Laila Mehrpour, NAWIC
Detroit
The data for Detroit was extrapolated in the same way as the data for New York City. The tables for the
top three Mosaic Types by Zip Code and the Summary Table are included below. The Zip Codes with
no data are representative of areas previously populated that are now abandoned or without sufficient
data for inclusion in the census.
Table B12 – Top Mosaic Types in Detroit by Zip Code
Source: adapted from Mosaic USA Interactive Guide, Experian, 2011
Table B13 – Top Types in Detroit (Summary)
Source: adapted from Mosaic USA Interactive Guide, Experian, 2011

71 © Laila Mehrpour, NAWIC
References
1. NSW Department of Planning and Infrastructure, 2009, Metropolitan Development Program,
http://www.planning.nsw.gov.au/HousingDelivery/HousingDeliveryIntroduction/Metropolitandev
elopmentprogram/tabid/126/language/en-AU/Default.aspx, Sydney, last accessed 12th July,
2012
2. NSW Government, 2012, A New Planning System for NSW Green Paper, Crown Copyright,
Sydney
3. NSW Department of Planning and Infrastructure, 2010, Metropolitan Strategy Review – Sydney:
Towards 2036 Discussion Paper, Sydney
4. Leinberger, CB, 2011, 'The Death of the Fringe Suburb', The New York Times, 25th Nov 2011,
http://www.nytimes.com/2011/11/26/opinion/the-death-of-the-fringe-suburb.html, last accessed
13th August 2012
5. Finfacts Team, 2006, ‘European Environment Agency to showcase Dublin as "worst-case
scenario" of urban planning, 4th Oct 2006,
http://www.finfacts.com/irelandbusinessnews/publish/article_10007490.shtml, last accessed
18th September 2012
6. Weidmann, B., Kelly, J-F., 2011, What Matters Most? Housing Preferences Across the
Population, Grattan Institute, Melbourne
7. Kelly, J-F., Weidmann, B., and Walsh, M., 2011a, The Housing We’d Choose, Grattan Institute,
Melbourne
8. Kelly, J-F., Weidmann, B., and Walsh, M., 2011b, Project New Home (Part 1 of 2), Grattan
Institute, Melbourne
9. Australian Bureau of Statistics, 2011, Sydney Statistical Division Population Trends, abs.gov.au
10. Darcy, M, 2008, Housing Sydney, The dictionary of Sydney,
http://www.dictionaryofsydney.org/entry/housing_sydney#page=all&ref=
11. Johanson, S., 2011, ‘Australian homes still the world’s biggest’, 22nd Aug 2011, smh.com.au,
last accessed 18th June 2012
12. Bunkera, R & Holloway, D, 2002, ‘More than fringe benefits: The values, policies, issues and
expectations embedded in Sydney's rural urban fringe’, Australian Planner, Vol. 39, no. 2, 66-71
13. Gleeson, B., 2010, Lifeboat Cities, UNSW Press, Sydney
14. McNeill, D., Dowling, R. and Fagan, R., 2005. Sydney/Global/City: An Exploration. International
Journal of Urban and Regional Research. 29 (4), pp. 935–944
15. Andrea Dixon, 1998, 'Houses in City a Bit Rich', The Sun-Herald 16 August 1998
16. Forster, C., 2010, Australian Cities: Continuity and Change (3rd Edition), Oxford University
Press, Melbourne

72 © Laila Mehrpour, NAWIC
17. Frost, L., 1990, Australian Cities in Comparative View, McPhee Gribble, Ringwood
18. ABS data compiled for Commonwealth Securities, 2009, via smh.com.au, 30th Nov, 2009
19. Benson, S., 2008, ‘Northwest Metro rail link officially shelved’, dailytelegraph.com.au, 2008-10-
31
20. Demographia, 2010, 6th Annual Demographia International Housing Affordability Survey,
www.demographia.com/dhi-ix2005q3.pdf
21. Demographia, 2011, 7th Annual Demographia International Housing Affordability Survey,
http://www.demographia.com/2011dhirls.pdf
22. Pacific Micromarketing, 2011, Mosaic Australia Interactive Guide, Brisbane
23. Jacobs, J., 1961, The Death and Life of Great American Cities, Modern Library, New York
24. Duany, A., Plater-Zyberk, E., Speck, J., 2010, Suburban Nation: The Rise of Sprawl and the
Decline of the American Dream, North Point Press, New York
25. UN Population Fund, Schlein, L., De Capua, J. & Krüger, S., 2007, ‘For humanity’s sake,
developing world must prepare for soaring urbanisation’, 28th Jun 2007,
http://www.citymayors.com/society/urban-population.html, last accessed 19th July 2012
26. Kotkin, J., Drukker, C., Murata, K.S., Priestnall, S., 2005, ‘The New Suburbanism: A Realists
Guide to the American Future’, The Planning Centre, Los Angeles
27. Frank Stilwell, Globalisation and Cities: An Australian Political Economy Perspective,
Australian National University Urban Research Program, Canberra, 1997
28. XTREMEimpakt., 2008, Consumer Segmentation,
http://www.xtremeimpakt.com/index/Capabilities/Strategic-Services/Consumer-Segmentation
Last accessed 13th Aug 2012
29. Bowie, D., 2010 Politics, Planning and Homes in a World City, Routledge, Oxon
30. NSW State Government, 2011, Sydney Towards 2036, Metropolitan Strategy Review
Discussion Paper, Sydney
31. NSW Department of Planning and Infrastructure, 2009, Metropolitan Development Program
2008/09, Sydney
32. NSW Government Planning and Infrastructure, 2010, Sydney’s Growth Centres, Growth
Centres Commission, http://www.gcc.nsw.gov.au/the+growth+centres-5.html
33. Globalisation and World Cities Study Group and Research Network, Research Bulletin 369 ,
Loughborough University, UK, 2010 http://www.lboro.ac.uk/gawc/world2010.html
34. Google, 2011, Google Maps, Sydney
35. Michael Darcy, 'Housing: the Great Divide' in John Connell, (ed), Sydney: the Emergence of a
World City, Oxford University Press, Melbourne, 2000; Michael Darcy, 'Pathways to
Homelessness: Assessing the impact of structural and socio-demographic factors on the scope
and nature of homelessness in Sydney', National Housing Conference, Brisbane, October
2001

73 © Laila Mehrpour, NAWIC
36. Experian Mosaic, 2011, Mosaic USA Interactive Guide, New York
37. Experian Mosaic, 2010, Mosaic UK Interactive Guide, Nottingham
38. Experian Mosaic, 2010, Mosaic Denmark FSS, Copenhagen
39. Experian Mosaic, 2010, Mosaic Global Look Up, Nottingham (unpublished, courtesy of the
Experian Mosaic Global team based in Nottingham, UK)
40. Department for Communities and Local Government, 1995, Planning Policy Guidance 2:
Green belts, www.communities.gov.uk, Norwich
41. GLA, 2011, The London Plan, Greater London Authority, London
42. GLA , 2008, The London Plan, www.london.gov.uk/thelondonplan
43. Ball, J, 24th November, 2011, “Wages throughout the country – How does your area
compare?”, The Guardian, http://www.guardian.co.uk/news/datablog/2011/nov/24/wages-
britain-ashe-mapped
44. NYC Department of City Planning, (2012), Agency Strategic Plan,
http://www.nyc.gov/html/dcp/html/about/strategy.shtml. Last accessed 23rd May 2012
45. Rankin, B., 2006, City Income Donuts - Radical Cartography,
http://www.radicalcartography.net/
46. Fujita, K & Hill RC, 2006, Place Stratification in Tokyo and New York, paper presented at ISA
World Congress of Sociology, Durban, South Africa, 24-29 July
47. Statistics Denmark. (2011). Population by region and time, http://www.statbank.dk/bol33, Last
accessed 13th June 2012.
48. Alexander, C., Ishikawa, S., Silverstein, M., Jacobson, M., Fiksdahl-King, I., Angel, S. (1977) A
Pattern Language: Towns, Buildings, Construction (Centre for Environmental Structure Series),
Oxford University Press
49. Matthiesson, C.W., 2007, Infrastructure Factsheet, Ministry of Foreign Affairs Denmark,
http://www.netpublikationer.dk/um/8583/html/chapter01.htm
50. Vejre, H., Primdahl, J., Brandt, J, 2007, The Copenhagen Finger Plan - Keeping a Green
Space Structure by a Simple Planning Metaphor in Pedroli B, Van Doom A, De Blust G,
Paracchini ML, Wascher D & Bunce F (Eds. 2007), Europe's living landscapes, Essays on
exploring our identity in the countryside. Landscape Europe/KNNV
51. Okrent, D, 2009, 'Detroit: The Death — and Possible Life — of a Great City', Time Magazine
US, 24th Sept 2009, http://www.time.com/time/magazine/article/0,9171,1926017,00.html, last
accessed 13th Jul 2012
52. Webber, R., 2004, 'Designing Geodemographic Classifications to meet Contemporary
Business Needs’, Journal of Interactive Marketing, 5, (3), January/March 2004
53. Webber, R., Farr, M., 2001, 'MOSAIC: From an area classification system to individual
classification’, Journal of Targeting, Measurement and Analysis for Marketing, 10 (1), August
2001

74 © Laila Mehrpour, NAWIC
54. Webber, R., 2003, 'Geodemographic analysis of similarity and proximity : their roles in the
understanding of the geography of need’, in Longley, P., Batty, M., (eds) 'Advanced Spacial
Analysis: The CASA book of GIS',ESRI press.
55. Woolsey, M., 2008, ‘Best and Worst Cities for Commuters’, Forbes.com,
http://www.forbes.com/2008/04/24/cities-commute-fuel-forbeslife-cx_mw_0424realestate.html
56. Owen, D., 2009, Green Metropolis: Why Living Smaller, Living Closer, and Driving Less Are
the Keys to Sustainability, Riverhead Books, New York
57. Minton, A, 2009, Fear and Happiness in the Twenty First Century, Penguin, London
58. Dunham-Jones, E., Williamson, J., 2011, Retrofitting Suburbia, John Wiley & Sons Publishing,
Hoboken
59. Gallagher, J.,2010, Survey finds third of Detroit lots vacant: Positive news uncovered, too, ,
Detroit Free Press, February 20, 2010
http://www.freep.com/article/20100220/BUSINESS04/2200371/1318/Survey-finds-third-of-
Detroit-lots-vacant
60. U.S. Census Bureau, 2009, ‘Annual Estimates of the Population of Combined Statistical Areas:
April 1, 2000 to July 1, 2009’
http://web.archive.org/web/20100609231528/http://www.census.gov/popest/metro/CBSA-
est2009-annual.html, last accessed 12th July, 2012
61. US Census Bureau, 2010, 2010 Census Interactive Population Search,
http://2010.census.gov/2010census/popmap/ipmtext.php?fl=26:2622000, last accessed, 12th
September 2012
62. Central Statistics Office Ireland, 2006, 2006 Census Small Area Population Statistics (SAPS),
http://census.cso.ie/censusasp/saps/boundaries/saps.htm
63. Office for National Statistics, 2011, Population Trends - No. 145, Autumn 2011 (full version),
Autumn 2011, http://www.ons.gov.uk/ons/rel/population-trends-rd/population-trends/no--145--
autumn-2011/jrd-population-trends-145.pdf, last accessed 29th September, 2012
64. Instituto Nacional de Estadistica, 2011, Population by provinces and size of municipalities,
http://www.ine.es/jaxi/menu.do?type=pcaxis&path=%2Ft20%2Fe260&file=inebase&L=1, last
accessed 29th September, 2012