Embed Size (px)
Citation preview

The Governance of Risk Management: The Importance ofDirectors’ Independence and Financial Knowledge
Georges DionneOlfa Maalaoui Chun
Thouraya Triki∗
March, 2015
Abstract
This paper tests the effects of the independence and financial knowledge of direc-tors on risk management and firm value in the gold mining industry. Our originalhand-collected database on directors’ financial education, accounting background, andfinancial experience allows us to test the effect of each dimension of financial knowledgeon risk management activities. We show that directors’ financial knowledge increasesfirm value through the risk management channel. This effect is strengthened by theindependence of the directors on the board and on the audit committee. Extending thedimension of education, we show that, following unexpected shocks to gold prices, ed-ucated hedgers are more effective than average hedgers in the industry. As a policyimplication, our results suggest adding the experience and education dimensions to the2002 Sarbanes–Oxley Act and New York Stock Exchange requirements for financialliteracy.
Keywords: Risk management governance, hedging, financial knowledge, financialliteracy, financial and accounting education of director, financial experience of director,independence of director, policy implications.
JEL Classification: D83, G14, G18, G28, G30, G32, G34, G38
∗Georges Dionne and Thouraya Triki are from HEC Montreal and Olfa Maalaoui Chun is from the KoreanAdvanced Institute of Science and Technology, Graduate School of Finance. We are very grateful to NarjessBoubakri, David Cummins, Bernard Fortin, Christian Gollier, Christian Gouriéroux, Jean Cyprien Heam,William Greene, Maria Pacurar, and Frédérique Savignac for their helpful comments. We also thank seminarparticipants at the Northern Finance Association meeting, the Australasian Banking and Finance Conference,the International Conference on Economic and Financial Risks in France, the China International Conferenceon Insurance and Risk Management, the Financial Management Association European meeting, the HongKong Institute of Business Studies, Dalhousie University, Lingnan University, and Banque de France. Pleasesend correspondence to Olfa Maalaoui Chun: [email protected].
“Risk comes from not knowing what you’re doing” —Warren Buffett.
Despite the regulatory attention given to corporate governance through the rules setby the Sarbanes–Oxley Act (SOX) and the New York Stock Exchange (NYSE) in 2002, arecent report of the Economic Co-operation and Development (OECD) attributes the 2007financial crisis to the failure of the boards in overseeing risk management systems,1 thereason often being the board’s limited knowledge and understanding of the risks involvedwhen using complex financial assets:
In dealing with losses through to the end of 2007, the report noted that some firmsmade strategic decisions to retain large exposures to super senior tranches of collateralizeddebt obligations that far exceeded the firms understanding of the risks inherent in suchinstruments, and failed to take appropriate steps to control or mitigate those risks ...In anumber of cases boards were not aware of such strategic decisions and had not put controlmechanisms in place to oversee their risk appetite, a board responsibility. (Kirkpatrick,2009, p. 7)
The report points to the failure of the board of the Union Bank of Switzerland in assess-ing the total derivative portfolio exposure of the bank, leading to a loss of USD 18.7 billionduring the fourth quarter of 2007. Later, in France, a junior trader at Société Générale suc-cessfully managed to camouflage his transactions with derivatives, leading one to believethat they were indeed hedging positions when, in fact, they were speculative positions. Ofcourse, the board of directors did not suspect the fraudulent nature of these transactionsnor did it recognize the increase in the bank’s uncovered position until the historical lossof 4.9 billion euros was realized in 2008. Similarly, in the United States, the weakness ofboards’ financial knowledge contributed to deepening the financial crisis and induced largelosses to public authorities while trying to restore the financial system.
The OECD report does not limit the importance of qualified board oversight or the needfor robust risk management to financial institutions. (Kirkpatrick, 2009, p. 2). Drawinglessons from the 2007 crisis, the report emphasizes the necessity of certifying a minimumlevel of financial knowledge for the directors on boards and those composing the audit com-mittees to ensure that they understand issues related to risk exposure and risk manage-ment. From a policy standpoint, it appears that the 2002 requirements of the independenceof board directors and audit committees, as well as financial literacy requirements, werenot sufficient to achieve the efficient governance of risk management policy, practice, andcontrol.2
1We are aware that other exchanges amended rules to regulate corporate governance in their listed firms,but we refer to the NYSE as being the largest US stock exchange, with more money at stake, with NYSEmarket capitalization around $16.6 trillion in 2014 compared to $8.5 trillion for NASDAQ.
2Section 301 of the SOX requires that “each member of the audit committee of the issuer shall be a mem-ber of the board of directors of the issuer, and shall otherwise be independent.” Section 407 requires that “the
1

market-to-book financial literacy is required by current SOX and NYSE regulations formembers of the audit committee, it is not required for the other members of the board.Moreover, there is ambiguity regarding the need and the definition of a financial expert onthe audit committee, even if this committee is responsible in overseeing the firm’s finan-cial risks according to NYSE rules. Under current regulation, financial literacy does notnecessarily mean financial expertise (financial education and experience). The qualifica-tion of financial literacy under the rules is open to interpretation by the company’s boarditself. In addition, directors who do not meet this requirement must become financiallyliterate within a reasonable yet undefined period following their appointment to the auditcommittee. SOX rules require each regulated firm to disclose whether the audit committeecomprises at least one financial expert. If not, the company must explain why. These rulesleave room for interpretation and may not be effective.3
Our goal is to explore different dimensions of financial knowledge and test whetherthey add value to the firm through the channel of risk management activities. Given theimportance regulators have given to directors’ independence, we also address the benefit ofindependent directors on the board or the audit committee and whether this requirementadds to firm value.4
We first break down the definition of the financial literacy of directors into three cat-egories. A director has a financial knowledge if he or she is i) financially active or hasfinancial experience, ii) is financially educated, or iii) possesses an accounting background.A financially active director should have some experience in the financial environment,such as having current or past activities/positions linked to finance (e.g., present or formerchief financial officer, insurer, financial analyst, financial consultant, trader, banker, risk
commission shall issue rules...to require each issuer, together with periodic reports...to disclose whether or not,and if not, the reasons therefore, the audit committee of that issuer is comprised of at least one member who isa financial expert.” The rules set by the NYSE define additional conditions concerning the independence of theboard of directors and the composition of the audit, compensation, and governance committees. Specifically,Section 303A.01 of the NYSE’s listed company manual states that “listed companies must have a majority ofindependent directors.” Section 303A.04 states that “listed companies must have a nominating/corporate gov-ernance committee composed entirely of independent directors,” while Section 303A.05 requires that “listedcompanies must have a compensation committee composed entirely of independent directors.” Finally, Sec-tion 303A.07 states that the audit committee must have a minimum of three members. Each member of theaudit committee must be financially literate; as such qualification is interpreted by the company’s board inits business judgment, or must become financially literate within a reasonable period of time after his or herappointment to the audit committee. In addition, at least one member of the audit committee must have ac-counting or related financial management expertise, as the company’s board interprets such qualification inits business judgment. In addition, Section 303.07 (D) of the NYSE’s listed company manual requires the auditcommittee “to discuss policies with respect to risk assessment and risk management.” Consequently, the auditcommittee (the board in general) is henceforth responsible for the firm’s risk management policy.
3Although some regulations ask for the creation of a risk committee to monitor the risk managementactivities of large financial institutions, we consider that the monitoring of risk management activities is theresponsibility of the audit committee, since our sample of firms comprises only public nonfinancial firms.
4Note that financial knowledge and financial literacy are used interchangeably in public and academicdocuments. Thus, we do not distinguish between these two terms and assume they are synonyms.
2

manager). A director is considered financially educated if his or her background includesa financial education (e.g., MBA, BBA, BCom). A director is considered an accountant ifhe or she has an accounting degree (e.g., CA, CPA), in accordance with the NYSE view.Our paper is the first to consider that directors can have financial knowledge due to theireducation. Besides the argument that the board members are responsible for the firm’srisk management policy and, consequently, that any change in board composition or in thebackground of its members could affect board decisions in this matter, it is important toevaluate the effect of these qualifications on risk management policy and firm value fortwo additional reasons.
First, risk management implies dealing with derivatives and other sophisticated finan-cial assets. A misunderstanding of these financial instruments may be extremely costly tothe firm and its shareholders. By examining the effect of the financial knowledge of theboard and the audit committee on hedging, we introduce a new set of explanatory variablesthat have never been tested in the literature as determinants of the firm’s risk manage-ment behavior. We also address the previously unexplored question of whether a morefinancially qualified board and audit committee are beneficial to shareholders through therisk management channel.
The financial literature provides vidence suggesting that risk management reduces thefirm cost of risk in imperfect markets and thus should be beneficial to shareholders. Forinstance, risk management can reduce tax payments (Smith and Stulz, 1985; Grahamand Rodgers, 2002), financial distress costs (Stulz, 1984), information asymmetry costs(Stulz, 1990; DeMarzo and Duffie, 1991; Breeden and Viswanathan, 1998), investmentfinancing costs (Froot, Scharfstein, and Stein, 1993; Morellec and Smith, 2002), externalfinancing costs (Campello, Lin, Ma, and Zhou, 2011), and managers’ risk aversion costs(Tufano, 1996). Therefore, a firm comprising financially knowledgeable directors capableof dynamically hedging the firm’s exposure to risk should increase its performance. Severalpapers address the relation between risk management and the market value of the firm butthey disagree on the direction of this relation. Jin and Jorion (2006) show that hedging doesnot increase firm value, while Allayannis and Weston (2001), Carter, Rogers, and Simkins(2006), Hoyt and Liebenger (2011), and Adam and Fernando (2006) obtain an oppositeresult. Campello, Lin, Ma, and Zhou (2011) find risk management eases the investmentprocess, which can also increase firm value. Using appropriate instruments, we use two-stage estimation models to test whether the predicted level of hedging increases firm valueas measured by return on equity, return on assets, Tobin’s Q, and the market-to-book.We also test these effects using systems of simultaneous equations to address potentialendogeneity between dependent and independent variables.
We use a very unique dataset comprising detailed information on corporate hedgingactivities in the gold mining industry and detailed information about the financial knowl-
3

edge of each director on the boards and audit committees included in our sample. The dataon detailed hedging activities were obtained from the same source as the data of Tufano(1996) and Adam and Fernando (2006).5
Based on the observed hedging activities, we construct quarterly hedge ratios for eachcompany during the period of the study. An important feature of our data is the fact thatour sample covers the period preceding major corporate governance problems (e.g., Enron,WorldCom) and the preparatory work that led to the 2003 enforcement of the changes incorporate governance regulation. Therefore, the observed structures of the boards andaudit committees in our sample of firms do not reflect changes made to comply with theseregulations. They were freely determined by the firms.
Second, our data provide an independent yet unique assessment of the benefits of differ-ent private governance rules on risk management activities in addition to those observed inthe 2002 regulations. Gold mining firms share a common exposure to the risk of changesin the gold price. Adam (2009) shows that most gold mining firms use options to hedgegold prices during our period of analysis. Given the multiplicity of hedging instrumentsavailable as well as this commodity’s high level of liquidity, the risk of fluctuation of thegold price must be adequately managed. Thus, what should make the difference betweendifferent hedging positions in this particular industry likely reflects differences in firmcharacteristics, including the level of directors’ financial knowledge and independence. Byaddressing the effect of directors’ financial knowledge on hedging, we also verify the ef-fectiveness of this requirement for hedging activities in this sector. Another importantfeature of our data lies in the benefits of having detailed information about the financialuniversity education and financial experience of directors carefully hand-collected fromvarious sources listed in Appendix C. Our data allow us to explore the diversity of direc-tors’ backgrounds in the financial sector and test the distinct effects of financial educationand experience on firm hedging behavior.
This paper is closely related to those of Tufano (1996) and Adam (2009). Tufano (1996)uses the same source of data over a three-year time horizon (1990 to 1993) and explores thedeterminants of risk management activities. The author particularly looks at firm-specificdata such as production cash costs, leverage, exploration activities, acquisitions, tax losscarryforwards, firm size, gold reserves, managerial stock ownership and option holdings,large block holdings, liquidity, and a measure of diversification. The results document arelation between variables related to managerial risk attitude and risk management be-havior. However, Tufano questions whether costly corporate resources attributed to firmrisk management activities are in fact devoted to firm value maximization or to managers’private risk taking. Unfortunately, the author does not test for this empirical question due
5Data on hedging activities were gracefully provided to us by Ted Reeve, a Canadian analyst who used tocover firms for Scotia Capital between 1989 and 1999.
4

to lack of data, although a more careful examination of the hypothesis is called for. We ad-dress this question in the robustness section of this paper. Specifically, we confirm Tufano’sempirical results regarding the effect of officers’ option holdings on risk management. Wealso show that part of the officers’ risk management choices may be due to their own risktaking benefits, which raises another governance issue.
We also add to this study by directly testing the impact of directors’ financial knowledgeon the risk management activity of the firm after controlling for all other firm-specific vari-ables mentioned above, including managers’ risk aversion and other corporate governancevariables. Adam (2009) considers the same sample of data that we use in this study. How-ever, instead of studying the level of risk management, the author looks at the types of riskmanagement activities. Adam shows that most gold mining firms hedge downside risk withoptions. Since the management, monitoring, and control of options and other derivativesrequire a minimum knowledge of these instruments, consideration of directors’ financialknowledge will enhance our understanding of firms’ differences in risk management.
We show how financial knowledge—education, experience, and accounting background—affects the risk management channel through which corporate governance mechanisms,including independence, become more effective to increase firm value. Our empirical evi-dence also highlights the importance of directors’ university education and suggests thatindependent financially qualified members of the board and audit committee encouragehedging activities using derivatives. Most interestingly, we find that educated hedgersare more prompt in adjusting firms’ hedge ratios following shocks in gold prices than theaverage hedgers in the industry are.
Exploring the link between risk management behavior and directors’ financial sophis-tication has important policy implications. Specifically, we construct a compliance indexthat accounts for each of the SOX and NYSE requirements. We then test whether thevalue of firms compliant with one or all of these rules increases through better risk man-agement. Our results suggest that compliance with SOX affects risk management activitybut, generally, compliance with NYSE regulation does not affect it. This suggests thathaving independent members and at least one educated member on the audit committeeis beneficial to risk management policy. However, these results are not fully satisfactoryin the sense that compliance with the two regulations does not strongly affect firm valuethrough the risk management channel.
We extend the analysis and construct a governance index accounting for independence,the three dimensions of financial knowledge (education, experience, accounting background),and the chief executive officer (CEO)–board relationship. Our index has broader coveragethan the above compliance indexes and places more emphasis on the quality of the direc-tors on the boards and audit committees, measured by the degree of their financial sophis-tication as well as their independence. Our results strongly support the idea that sound
5

corporate governance increases firm value. In our particular case, risk management is thechannel through which corporate governance becomes effective and increases firm value.
The reminder of the paper is organized as follows. Section 1 documents the relatedliterature and sketches the testable hypothesis. Section 2 describes our sample construc-tion and variable definitions. Section 3 motivates our empirical approach and presents ourresearch design. Section 4 delineates our analysis and results. Section 5 discusses the pol-icy implications of our contribution. Section 6 presents our robustness analysis. We thenconclude the paper in Section 7.
1 Literature and testable hypothesis
1.1 The board as a corporate governance mechanism
The board of directors plays a central role in any corporate governance system and isviewed as a primary means for shareholders to exercise control over top management (Koseand Senbet, 1998; Tirole, 2006). Specifically, board composition, independence, and en-gagement are key features in enhancing a firm’s corporate governance system and achiev-ing its performance goals. For instance, Armstrong, Core, and Guay (2014) show how thestructure of a board dominated by related directors increases both the level of informationasymmetry between shareholders and top management and uncertainty about firm value.A board structure dominated by independent directors has the opposite effect and leadsto an increase in firm transparency and an increase in firm value. Falato, Kadyrzhanova,and Lel (2014) show how shocks in the workload of directors can affect firm value. Suddenchanges in board structure can have negative impacts on firm value, especially when thesechanges increase board busyness, thus affecting their effective judgment and monitoring.
A tremendous amount of the literature focuses on board structure, specifically memberindependence, but with little emphasis on the value of the board’s financial knowledge.The debate on the topic of financial knowledge started with official reports such as theCalifornia Public Employees’ Retirement System Corporate Governance Market Principlesissued in 1997 and the National Association of Corporate Directors Blue Ribbon Commis-sion Report issued in 1998. At the time, both reports recognized the importance of boardindependence and also recommended financial literacy/expertise for directors, given theirimportance in monitoring firm activities. However, the 2003 regulations provided by SOXand the NYSE do not explicitly require financial knowledge for the board members; it isonly explicitly required for audit committees.
Our research focuses on the importance of the financial knowledge dimension in boardstructure. Specifically, we examine the effect of having directors on the board and auditcommittee with relevant experience and/or education in finance on the firm’s risk manage-
6
ment activity and its performance.
1.2 Benefit of financial knowledge for the board
The few papers that investigate the financial knowledge argument for board members sup-port the idea that the financial knowledge of directors adds value to the firm. Indeed, Boothand Deli (1999) and Guner, Malmendier, and Tate (2005) show that boards comprisingmembers with relevant and related financial and accounting knowledge obtain credibleand high-quality financial statement evaluations. Agrawal and Chadha (2005) supportthe benefit of having independent board directors who have financial knowledge. Theyfind that the probability of earnings restatements is lower in firms whose boards have anindependent director with a background in accounting or finance. Interestingly, the inde-pendence argument taken alone seems to have no explanatory power in their model, whichsuggests that directors’ independence becomes more effective when they also have financialknowledge.
Our paper is the first to establish such a link using the risk management activity chan-nel. To the extent that financially knowledgeable directors have a better understanding ofthe sophisticated financial tools involved in risk management activities, we expect firmswhose boards comprise financially knowledgeable directors to engage more actively inhedging the firm’s exposure to risk and to enhance its performance. The literature alreadyshows that sound corporate governance increases firm value. As an additional corporategovernance variable, we suggest different dimensions of directors’ financial knowledge andthe interaction of these dimensions with independence.
Different arguments support the conjecture that financial knowledge should benefitthe firm and shareholders, particularly in the gold mining industry. First, derivatives aresophisticated instruments and directors need a minimum level of financial knowledge tounderstand them and adequately monitor their management, as in fixing the optimal levelof risk management and choosing appropriately between options or futures instruments indifferent risky environments. In addition, directors overseeing risk management need tounderstand that derivatives can affect officers’ incentives (chief financial officer and CEO)to act in line with shareholder welfare. We refer to the agency aspect of governance relatedto risk management activities. It is well documented that officers’ holding firm options canavoid introducing incentives to reduce the volatility of firm value, because lower volatilityreduces their own options value when they are out of the money.
Second, financial knowledge is often measured by directors’ experience in finance andtheir background in accounting. There is no explicit consideration of the financial educa-tion dimension, which may be relevant to the usage of hedging instruments. Although inour sample many directors are educated, their education may not be relevant to risk man-
7

agement activities. For instance, some directors have knowledge related to their businessactivities (engineers, communication specialists, lawyers, etc.) but not to finance. Thesedirectors may not be aware of all the instruments available to hedge a firm’s exposure torisk and may not even fully understand the costs and benefits of the effective usage of so-phisticated financial instruments. In this paper, we argue that the financial knowledge ofdirectors leads to the sound corporate governance of risk management and sound corporategovernance leads to more effective risk management activities, which leads to higher firmperformance. Thus we propose the following hypothesis.
H1: The financial knowledge of directors sitting on the board has a significant effect onfirm value through the optimal risk management activities channel.
1.3 Benefit of financial knowledge for the audit committee
The audit committee’s primary task is to oversee the firm’s corporate reporting and ensurethe reliability of its financial reporting. Periodic review of the firm’s risk assessment systemand the managerial actions used to manage its risks is a critical step toward fulfilling thistask. We would expect audit committees satisfying the SOX and/or NYSE rules to provideeffective monitoring. Moreover, the NYSE’s rules require the audit committee to discussthe guidelines and policies for risk assessment and risk management.
To the best of our knowledge, no study establishes a relation between the compositionof the audit committee, the backgrounds of its members, and corporate hedging. Our paperis the first to establish such a link. Because audit committee members with financial back-grounds have the experience and training to understand risk management operations, weexpect firms with financially knowledgeable directors to engage more actively in risk man-agement when risk management increases firm value. Thus, we address the question ofwhether we should explicitly require financial knowledge for directors sitting on the auditcommittee and whether this requirement affects risk management and firm performance.We think that the audit committee, through it monitoring role, should be qualified to dealwith the financial environment, especially in critical financial episodes. Thus, we proposethe following hypothesis.
H2: The financial knowledge of directors sitting on the audit committee has a significanteffect on firm value through the risk management activities channel.
1.4 The independence argument
The standard approach in corporate finance is to view the board’s independence as closelyrelated to its efficiency. Following the same reasoning, Section 303A.01 of the NYSE’s listedcompanies manual requires a majority of independent directors on the board. Indeed,outside directors are viewed as superior monitors because their careers are not tied to the
8

firm’s CEO and consequently they are free to take decisions that may go against the CEOwithout being afraid for their positions or future compensation. This view is often referredto as the monitoring effect theory.6
Outside directors have also incentives to build reputations as expert monitors to obtainadditional director appointments and are thus more likely to maintain proper control overthe firm’s top management (Fama, 1980; Fama and Jensen, 1983). However, they are facedwith the challenge of understanding the firm’s operations, which puts their reputation inplay in case of failure. The most recent study by Armstrong, Core, and Guay (2014) showsthat firms with more independent directors sitting on the board are more transparent. Thishas the effect of reducing the uncertainty about the firm’s cash flows and thus increasingits value.
The independence argument is also a concern for members of the audit committee. Alarge body of academic literature has investigated the extent to which the independenceand financial literacy/expertise of audit committee members are beneficial to shareholders,specifically members with an accounting background.7
However, another stand of the literature questions the benefit of having independentdirectors on the audit committee. The reason is that there is no consensus that the pres-ence of outside auditors provides additional benefits to the firm. For instance, Beasley(1996), Hayes, Mehran, and Scott (2004), and Agrawal and Chadha (2005) provide argu-ments against the benefits of having independent auditors, while Carcello and Neal (2000),Abbott, Parker, and Peters (2002), and Klein (2002) show that the presence of independentauditors is beneficial to the firm.
Few papers link board composition to firm risk management activity. Again, the liter-ature does not arrive at a clear consensus on the effect of outside directors on a firm’s riskmanagement policy. For instance, Mardsen and Prevost (2005) report no effect of havingoutside directors on risk management activities. However, Fields and Keys (2003) claimoverwhelming support for outside directors providing superior monitoring and advisoryfunctions to the firm. Whidbee and Wohar (1999), Borokhovich, Brunarski, Crutchley, and
6Several papers report evidence supporting the monitoring effect theory (Weisbach, 1988; Rosenstein andWyatt,1990; Dechow and Sloan, 1996; Cotter, Shivdasani, and Zenner,1997; MacAvoy and Millstein,1999;Klein, 2002; Saat et al.,2011), while other studies report evidence against it (Fosberg, 1989; Hermalin andWeisbach, 1991; Klein, 1998; Bhagat and Black, 2002; Hayes, Mehran, and Scott, 2004).
7Agrawal and Chadha (2005) support the benefit of having independent members but with a backgroundin accounting or finance. Abbott, Parker, and Peters (2002) find that the absence of a financial expert onthe audit committee is significantly associated with an increased probability of financial misstatement andfinancial fraud. Xie, Davidson, and DaDalt (2003) show that the presence of investment bankers on the auditcommittee is associated with lower discretionary accruals in the firm. Davidson, Xie, and Xu (2004) andDeFond, Hann, and Hu (2005) report a positive market reaction following the appointment of new directorswith auditing/accounting experience. Dhaliwal, Naiker, and Navissi (2010) show that the accounting expertiseof the audit committee is positively associated with accruals quality, which suggests that accountants are moreeffective in executing the audit committee’s responsibility of insuring financial reporting.
9

Simkins (2004), and Dionne and Triki (2013) find that hedging increases with outside di-rectors.
Since risk management is a complex activity, we argue that the requirement of directorindependence is necessary but not sufficient. Independent members of the board and theaudit committee also need a minimum level of financial knowledge (education, experience,and accounting) to monitor risk management activities. Many analysts of the 2007 finan-cial crisis have mentioned that existing regulations are more focused on independence andaccounting education than on financial knowledge. Thus, we test the effect of indepen-dence and its interaction with the level and type of financial knowledge of directors on riskmanagement and firm value. We propose the following hypothesis.
H3: The independence of directors has a significant effect on risk management activitiesand firm value through its interaction with financial knowledge.
1.5 The higher education aspect of financial knowledge. Does it matter?
A main exercise in our data collection is to explore the graduate financial background ofdirectors. We are aware that a sufficient number of directors in our sample have a graduatediploma in a physics-related area. However, we argue that the dynamic management ofderivative instruments requires a minimum level of financial sophistication and expertise.Extending the above argument, we propose that directors with higher financial educationare more willing to react to unanticipated changes in gold prices by making proper adjust-ments to risk management policy to limit the firm’s exposure to risk. Thus, we propose thefollowing testable hypothesis.
H4: Financially educated directors should be more effective than the average industryin adjusting their hedging behavior following unexpected shocks to gold prices.
2 Data and variables
2.1 Sample construction (1992–1999)
Observations on the composition of the board and the audit committee are published onlyon an annual basis in the firm proxy statement. We assume that the characteristics ofcorporate governance of the firm remain constant between two consecutive general annualmeetings. We believe this assumption is reasonable since, at the general annual meeting,directors are usually elected for terms of at least one year. Moreover, the main issues ofcorporate governance (risk appetite, risk management policy, risk management strategy,control process) are usually discussed once a year with the board.
We first check the fiscal year-end for each firm in the sample during the period consid-ered. Next, we match the general annual meeting date with the closest fiscal quarter-end
10

to determine in which fiscal quarter the meeting occurred. For example, if the fiscal yearends on December 31, 1997, and the general annual meeting is held on May 28, 1997, wesuppose that the general annual meeting is held in the second quarter of the fiscal year1997. Then, we collect data on the characteristics of the firm’s corporate governance. Tolimit endogeneity and simultaneity issues, all our independent variables are measuredone quarter prior to the quarter in which the hedge ratio is observed. Therefore, we usethe corporate governance data collected from a proxy statement for all the risk manage-ment observations following the quarter in which the general annual meeting is held andwe stop at the quarter in which the next annual general meeting occurs. If we observethat the 1998 general annual meeting is held in the second quarter of 1998, the corpo-rate governance data collected from the 1997 proxy statement is used for the third andfourth quarters of 1997 and the first and second quarters of 1998. Figure 1 summarizesthe procedure used to construct our sample.
[Insert Figure 1 about here]
We use Compustat Quarterly to collect firm-specific data such as the market and bookvalues of assets, the total value of debt, the value of sales, operating income, acquisitionexpenses, selling and general expenses, depreciation and amortization, and other dataneeded to compute variables describing firms’ general characteristics listed in AppendixA.
We use firms’ proxy statements and annual reports to hand-collect information aboutthe size and composition of the board and the audit committee, the name of each directorsitting on the board and on the audit committee, the education level of each director, thecurrent and former functions of each director, the age of the CEO and the CEO’s portfolioholding of common shares and exercisable options.
We drop firms that were acquired, that filed for bankruptcy, or for which managementwas unable to locate the proxy statements or quarterly reports for the fiscal years we re-quested.8
We also hand-collected data relative to firms’ operating cash costs and exploration ex-penditures from quarterly reports. We proxy taxable income by taxable accounting earn-ings before extraordinary items and discounted operations. This information is neededto construct the Tax_save variable further documented in Appendix B. Data about insti-tutional shareholding are from the 13-F and 13-G forms available on the U.S. Securitiesand Exchange Commission website and from proxy statements. Our sample consists of
8Proxy statements and quarterly reports for the period ranging from January 1992 to December 1999 arenot available from EDGAR (for US firms) or SEDAR (for Canadian firms) for many quarters. For instance, inSEDAR, no data are available before January 1997. We had to directly contact firms and ask them to send usthe proxy statements and quarterly reports that were missing in our sample.
11

348 quarter–company observations and spans the period from January 1992 to December1999.9
We categorize directors as independent if they are not related to the management ofthe firm and are free from any interest or relationship that could conceivably affect theirability to act in the firm’s best interest, other than interest arising from shareholdings. Weeliminate current or former employees of the firm or a related entity, directors who areemployees, and partners or owners of companies that provided some service to the samplefirm or received some compensation from it during the fiscal year. Therefore, we trackthe biographical backgrounds of directors and officers, the compensation of directors, andany relationships and related transactions available in the proxy statements or in the datasources listed in Appendix C.
We categorize directors as financially active or with experience if they occupied presentlyor formerly a position as chief financial officer, treasurer, officer of an insurance or invest-ment company or a mutual fund, financial analyst, financial consultant, banker, or anyother position related to finance. By tracking the financial knowledge of directors in ourdata sources listed in Appendix C, we obtained information about 70% of the directors inour sample. Therefore, we had to send an information request to the remaining 30% ofthe directors asking for details about their financial background. To increase the responserate, we contacted i) the directors themselves, ii) the firms where the directors currentlyor previously served on the board and/or the audit committee, and iii) other firms not inour sample where the directors currently or previously served on the board and/or auditcommittee. Data collection using the questionnaire became challenging because several di-rectors in our sample had already retired or died and in those cases firms are not obligatedto disclose information about them.
We categorize directors as financially educated if they hold a finance degree or were en-rolled in a program offering finance courses (BBA, MBA, CA, BCom, etc.). Several directorsin our sample had been enrolled in qualified professional programs, by which we mean thatwe checked that the curriculum of the professional program contained a sufficient numberof finance courses to qualify as a finance degree.
Finally, we categorize directors as accountants if they have an accounting backgroundor are Chartered Accountants (CA, CPA) or have an education or activities related to ac-counting. Our final sample consists of 325 observations with complete information aboutthe educational background of the directors and 348 observations with complete informa-tion about all the other variables listed in Appendix A. Our sample contains 36 NorthAmerican gold mining companies comprising 25 Canadian firms and 11 US firms.
9Note that the majority of Canadian firms in our sample are listed in US exchanges. Accordingly, they aresubject to US legislation.
12
2.2 Variable definitions
2.2.1 Dependent variable
Following Tufano (1996), we measure a firm’s risk management activity by the delta per-centage. Detailed information used to construct this variable was gracefully provided byTed Reeve. The delta percentage for a given quarter measures the fraction of the plannedgold production to be hedged over the next three years. To obtain the hedge ratio for eachfirm–quarter, we first calculate the delta of each instrument that is used to hedge the pro-duction over the next three years. Then, we multiply each delta by the size of the hedgedposition, that is, the number of ounces of gold that are covered by the corresponding in-strument. Hence, we obtain what Tufano (1996) calls the delta ounces. The delta of theportfolio to be hedged by the firm is obtained by summing over the different delta ounces.Finally, we divide the delta of the portfolio to be hedged by the expected production of goldover the same three years of the hedge and obtain the delta percentage. Hereafter, we referto the delta percentage as the hedge ratio variable. We plot the median value of the hedgeratio in Figure 2.10
[Insert Figure 2 about here]
2.2.2 Independent variables
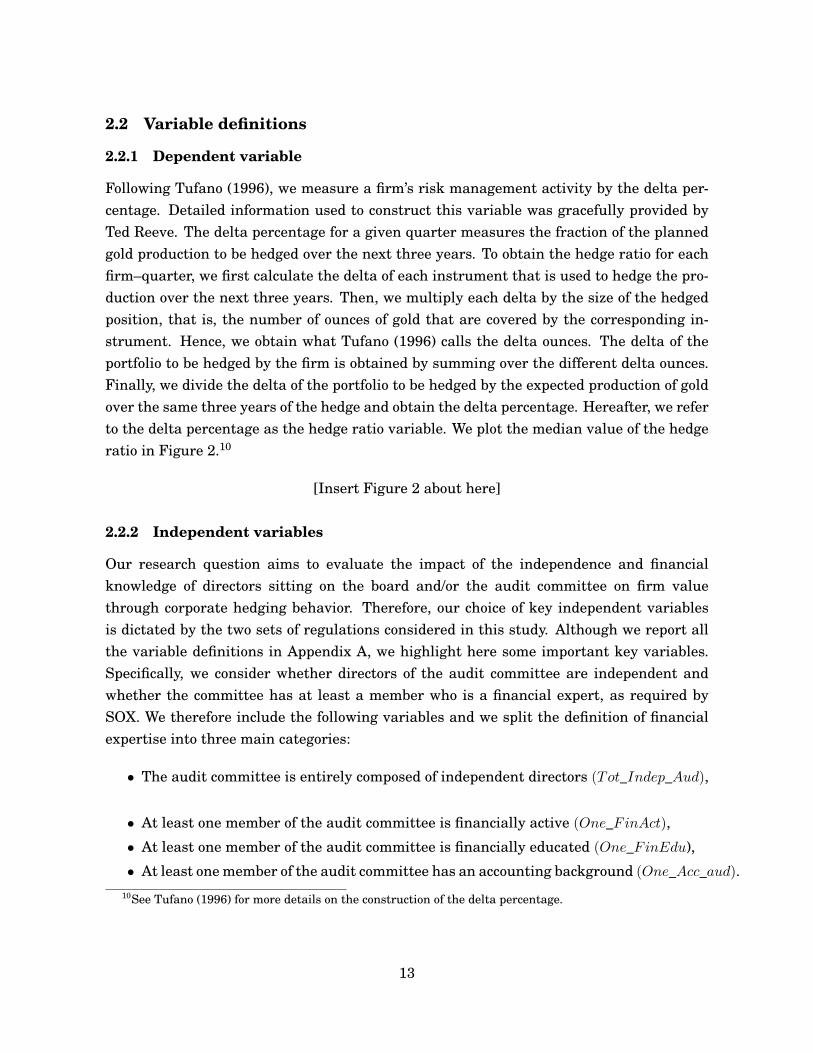
Our research question aims to evaluate the impact of the independence and financialknowledge of directors sitting on the board and/or the audit committee on firm valuethrough corporate hedging behavior. Therefore, our choice of key independent variablesis dictated by the two sets of regulations considered in this study. Although we report allthe variable definitions in Appendix A, we highlight here some important key variables.Specifically, we consider whether directors of the audit committee are independent andwhether the committee has at least a member who is a financial expert, as required bySOX. We therefore include the following variables and we split the definition of financialexpertise into three main categories:
• The audit committee is entirely composed of independent directors (Tot_Indep_Aud),
• At least one member of the audit committee is financially active (One_FinAct),
• At least one member of the audit committee is financially educated (One_FinEdu),
• At least one member of the audit committee has an accounting background (One_Acc_aud).10See Tufano (1996) for more details on the construction of the delta percentage.
13
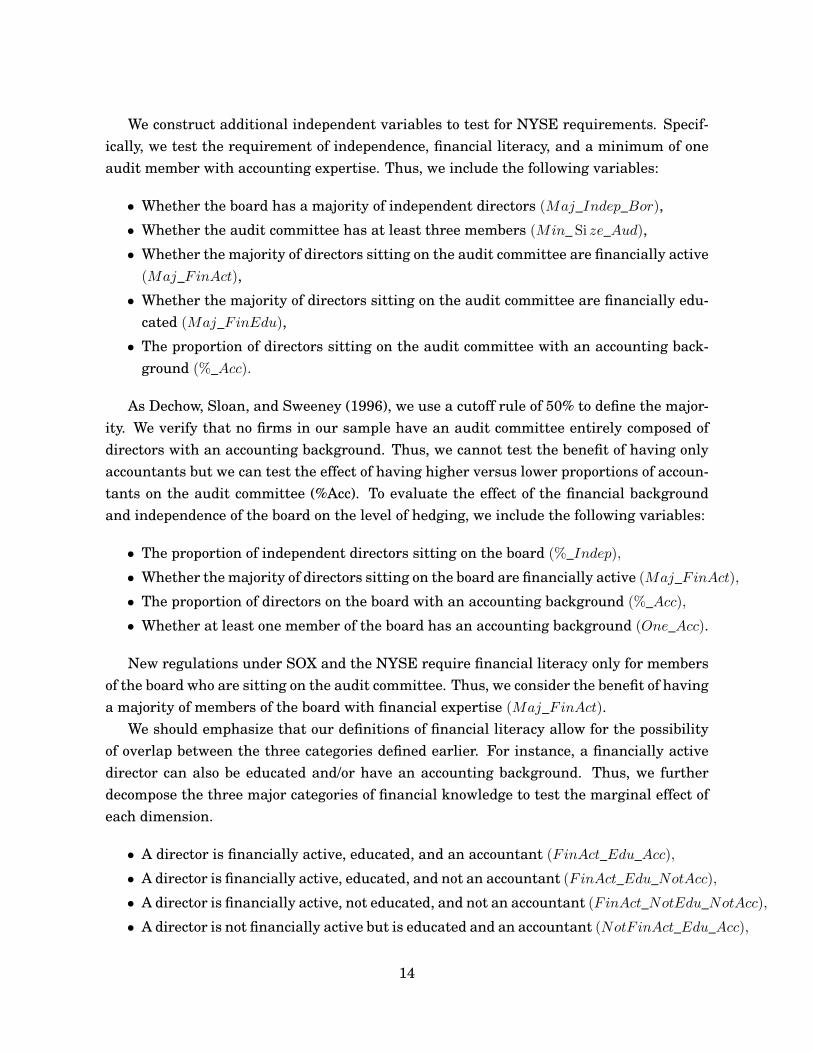
We construct additional independent variables to test for NYSE requirements. Specif-ically, we test the requirement of independence, financial literacy, and a minimum of oneaudit member with accounting expertise. Thus, we include the following variables:
• Whether the board has a majority of independent directors (Maj_Indep_Bor),
• Whether the audit committee has at least three members (Min_ Si ze_Aud),
• Whether the majority of directors sitting on the audit committee are financially active(Maj_FinAct),
• Whether the majority of directors sitting on the audit committee are financially edu-cated (Maj_FinEdu),
• The proportion of directors sitting on the audit committee with an accounting back-ground (%_Acc).
As Dechow, Sloan, and Sweeney (1996), we use a cutoff rule of 50% to define the major-ity. We verify that no firms in our sample have an audit committee entirely composed ofdirectors with an accounting background. Thus, we cannot test the benefit of having onlyaccountants but we can test the effect of having higher versus lower proportions of accoun-tants on the audit committee (%Acc). To evaluate the effect of the financial backgroundand independence of the board on the level of hedging, we include the following variables:
• The proportion of independent directors sitting on the board (%_Indep),
• Whether the majority of directors sitting on the board are financially active (Maj_FinAct),
• The proportion of directors on the board with an accounting background (%_Acc),
• Whether at least one member of the board has an accounting background (One_Acc).
New regulations under SOX and the NYSE require financial literacy only for membersof the board who are sitting on the audit committee. Thus, we consider the benefit of havinga majority of members of the board with financial expertise (Maj_FinAct).
We should emphasize that our definitions of financial literacy allow for the possibilityof overlap between the three categories defined earlier. For instance, a financially activedirector can also be educated and/or have an accounting background. Thus, we furtherdecompose the three major categories of financial knowledge to test the marginal effect ofeach dimension.
• A director is financially active, educated, and an accountant (FinAct_Edu_Acc),
• A director is financially active, educated, and not an accountant (FinAct_Edu_NotAcc),
• A director is financially active, not educated, and not an accountant (FinAct_NotEdu_NotAcc),
• A director is not financially active but is educated and an accountant (NotF inAct_Edu_Acc),
14

• A director is not financially active, is educated, and is not an accountant (FinAct_Edu_NotAcc).
According to our definition, directors with an accounting background should also beeducated. We illustrate the different cases and definitions of financial literacy in Figure 3and report descriptive statistics in Appendix D (Tables D-1 and D-2).1112
[Insert Figure 3 about here]
2.2.3 Control variables
As control variables we include determinants of risk management that are well docu-mented in the literature (e.g., Mian, 1996; Tufano, 1996; Haushalter, 2000; Adams andFernando, 2006). Specifically, we include firm size (ln(size)), the market-to-book ratio of as-sets (market-to-book), the dividend policy (dividend policy), and the existence of financialslack (quick ratio). Additionally, we control for a firm’s expected financial distress costsusing leverage (leverage) and the firm’s operating cash costs (cash cost). Financial dis-tress costs should increase firm incentives to hedge (Tufano, 1996). Similarly, we controlfor the firm’s investment opportunities using its exploration expenditures (exploration).Firms with attractive investment opportunities should hedge more extensively to ensurethe availability of the internal funding necessary to undertake these investments (Froot,Scharfstein, and Stein, 1993; Morellec and Smith, 2002). Finally, we control for the firm’shome country by including a variable (dummy US) that equals one if the firm’s origin isthe United States.
Several papers argue that risk management is more valuable when there is informationasymmetry because it will reduce the costs associated with this asymmetry. As Grahamand Rogers (2002), we use the percentage of shares held by institutions (%inst) as a proxyfor information asymmetry between the CEO and shareholders. This variable can alsoindicate that these shareholders are more diversified. Risk management activities shoulddecrease with the importance of the firm’s institutional holdings as they are willing to takemore risks than other stakeholders do.
A firm with a convex tax function should have more incentives to hedge (Smith andStulz, 1985; Graham and Rogers, 2002). Hedging allows the firm to lock onto the level oftaxable income, thus reducing the variability of the pre-tax value of assets and tax liability
11Most of the directors in our sample have some level of education, but not in finance. For instance, we countseveral directors with a bachelor’s degree or a PhD in geology, a bachelor’s or PhD in electrical engineering, ora bachelor’s or a master’s in law.
12In about 75% of cases, we count at least one audit member who is financially active and, in about 45%of cases, at least one member has an accounting background. However, in 31% of cases, one to two membersof the audit committee are financially active, financially educated, and have an accounting background. Themajority of the firms have at least one director on the board who is financially active or financially educated(97% of the cases) and at least one director with an accounting background (70% of the cases).
15

and increasing the after-tax value of assets. To capture the benefits of a convex tax func-tion on hedging, we construct the tax variable (Tax_save) proposed by Graham and Smith(1999). However, these authors consider only US legislation and tax code to calculate taxesfor all the firms in their sample. We extend the definition to include the country of origin’slegislation and tax code, thus obtaining a more accurate measure of tax savings. We pro-vide more details on the construction of this variable in Appendix B (see also Campello,Lin, Ma, and Zhou, 2011; Dionne and Triki, 2013).
Managerial risk aversion is another important determinant of risk management policyin the gold mining industry (Tufano, 1996; Petersen and Thiagarajan, 2000). We use threeproxies for managerial risk aversion: the number of the firm’s common shares held by theCEO (CEOCS), the value of options held by the CEO (ValCEOOp), and the CEO’s age (CEOage). The two first variables capture Smith and Stulz’s (1985) argument that compensationpackages leading to a concave (convex) function between the managers’ expected utility andthe firm’s value encourage managers to hedge more (less).13
The variable CEO age potentially captures the interplay between experience and educa-tion. The literature argues in favor of positive and negative relations between director ageand hedging activity. Younger directors may be more inclined to hedge (Tufano, 1996) butolder directors facing imminent retirement might prefer reducing fluctuations in a firm’svalue and hence hedge more extensively. Thus, the variable CEO age could also proxy forrisk aversion.
2.3 Summary statistics
Table 1 reports the descriptive statistics for our test and control variables. The hedge ratioindicates that firms in our sample hedge about 17% of their production of gold (as indicatedby the median of the positive hedge ratio). The hedge ratio also takes on values greaterthan one. The maximum of the hedge ratio equals 1.26. We verify that in 17 quarterlyobservations, the hedge ratio is equal to or higher than one. Therefore, some gold miningfirms are likely to hedge for speculation reasons, consistent with the results of Adam andFernando (2006), who find evidence of speculation (or selective hedging) in the industry ofgold mining. However, their results suggest that these firms realize marginal gains fromselective hedging.
[Insert Table 1 here]13We focus on the CEO’s holdings because i) variables based on directors’ and officers’ holdings mix the
incentives of different agents with different motives and ii) the CEO has the ultimate authority over an im-portant decision such as corporate hedging. However, we consider the option holdings of all officers in therobustness section.
16

Panel B of Table 1 provides summary statistics of the general characteristics of thefirms. Noticeably, our sample contains mostly Canadian firms. Institutions hold, on aver-age, 8% of the shares of the firms, while blockholders hold, on average, 17% of the shares.
Panel C of Table 1 provides summary statistics for the general characteristics of thedirectors and the CEO. The median director age is 60 years and CEOs are, on average, 54years old. The average tenure is about six years for both directors and CEOs, which meansthat they acquired experience with the company. We also note that 66% of the CEOs in oursample are also the chair at the same time.
Panels D and E of Table 1 provide descriptive statistics of the financial backgrounds ofdirectors sitting on the audit committee and the board, respectively. The audit committeeis mostly composed of at least three members. In 52% (61%) of cases, the members of theaudit committee (board) are independent. The audit committee is composed of at least onefinancially active member in 88% of cases and at least one financially educated member in87% of cases. Very few firms (8%) have an audit committee entirely composed of financiallyactive or financially educated members. In about 60% of the firms, directors sitting on theboard or the audit committee have a bachelor’s degree and, in 33% of cases, they have amaster’s or PhD degree in finance. In 47% (71%) of cases, the audit committee (board)comprises at least one accountant.
3 The model
Our methodological approach is dictated by the nature of our data. Our dependent vari-able, the hedge ratio, takes on nonnegative values yet, in about 15% of the observations inour sample, the hedge ratio is equal to zero. An observed hedge ratio of zero reflects themanagement decision to not hedge. When the observed hedge ratio is positive, it reflectsthe firm’s propensity to hedge. Therefore, the Heckman (1979) two-stage model is bestsuited to represent our data. Specifically, the first stage models the decision to hedge andthe second stage models the intensity of the hedge.
3.1 First-stage of the Heckman model
In the first stage, the dependent variable is a dummy variable; it equals zero if the firmsdoes not hedge and one if the firm hedges. We model the first stage using a probit regres-sion. Independent variables include determinants of the firm’s hedging policy: firm size (inlogarithmic form), the market-to-book ratio, the leverage ratio, the quick ratio, dividendpolicy, the benefit of having a convex tax function, and the country of origin (Mian, 1996;Tufano, 1996; Haushalter, 2000; Adams and Fernando, 2006). We also control for seasonaleffects in the data using dummy variables for each quarter and year. Using estimated re-
17

sults from the probit regression, we calculate the inverse Mills ratio to correct for potentialsample selection biases.
3.2 Second-stage of the Heckman model
In the second stage, our dependent variable is restricted to positive hedge ratios. At thisstage, we address the question of whether the financial knowledge and independence ofdirectors affect a firm’s propensity to hedge. In addition to the explanatory variables of thefirst stage, we include governance variables, such as the size of the audit committee, theindependence of directors, and our measures of financial knowledge. We also include firmleverage, the CEO’s holdings in shares and options, the convexity of the tax function, theCEO’s age, institutional holdings, and the inverse Mills ratio.
Finally, we address a few issues relative to the nature of our data. We use both fi-nancial variables published quarterly and governance variables published yearly; we canthus artificially increase our sample size, which could have the effect of biasing standarderrors downward and increasing the likelihood of finding significant effects. To avoid prob-lems of data bias, we use firm fixed effects in all our regressions, including the first-stageregressions.
3.3 Endogeneity issues
When estimating the effect of hedging on firm value, we are faced with an endogeneityproblem. Adams, Hermalin, and Weisbach (2010) document this issue and report a lackof sufficient instrumental analyses in the corporate governance literature. Many resultsmust be interpreted as the joint selection of governance policy and the policy’s effect onfirm performance. For example, a firm’s hedging activity can be correlated with unobserv-able characteristics of the firm, in which case the ordinary least square estimates of theparameters in the firm value equation could be biased. We address this endogeneity issueusing three complementary approaches. One approach is to find a suitable instrument forthe hedging equation and use the predicted value of hedging in the firm value equation. AsCampello, Lin, Ma, and Zou (2011) and Dionne and Triki (2013), we use the governmentrules on corporate taxes that we capture using a measure of tax convexity. This mea-sure will then serve as an instrument in the hedging equation and it is measured as thevariation in expected tax savings from a 5% reduction in the volatility of taxable income(Graham and Smith, 1999). The key argument is that tax convexity provides incentives toincrease hedging but there is no reason to expect it to directly affect the value of the firm.Under this premise, tax convexity is an adequate instrument for hedging in the firm valueequation.
18

Second, the governance variables change annually while our hedge ratio variable ismeasured quarterly. More importantly, in the two-stage regression analysis, we use ourgovernance indexes to represent a weighted average of potential explanatory variables.We also apply principal component analysis (PCA) to construct two principal factors ac-counting for most of the total variance in our set of governance variable candidates for theboard and audit committee. By means of orthogonal transformation, PCA converts our setof observations of possibly correlated variable candidates into a set of linearly uncorrelatedvariables represented by the principal component. As documented in the recent economet-ric literature, such principal components can be considered instrumental variables (Baiand Ng, 2010).
Next, we model hedging activity and firm performance simultaneously using three-stage simultaneous systems of equations. Specifically, the system is based on Zellner’sseemingly unrelated regression estimation (SURE) combined with a two-stage least squaresestimation for each equation. We also include our two governance indexes as explanatoryvariables along with the tax savings variable. Finally, we use the PCA governance factors,which can also be considered instrumental variables. The results remain similar to thoseof the two-stage regression analysis.
4 Empirical results
4.1 Corporate governance effect on risk management
We report the results of the first stage of the Heckman two-stage model in Appendix E,Table E-1. Consistent with previous findings in the literature (Adam and Fernando, 2006),the decision to hedge is related to the size of the firm, the market-to-book ratio, and thedividend policy. Larger firms are more likely to hedge, which is consistent with the viewthat small firms may lack the financial resources or capacity required to undertake hedg-ing activities. Similarly, we find that firms distributing dividends are more likely to hedge,while firms with important growth prospects are less likely to hedge. This result is actuallyconsistent with the positive effect of size, since small firms have more growth opportuni-ties and distribute fewer dividends. Note that the negative relation between the decisionto hedge and the market-to-book is consistent with the evidence of Mian (1996), Adamand Fernando (2006), and Adam, Fernando, and Salas (2012). The results in Table E-1also suggest that the decision to hedge is unaffected by the liquidity of assets, the level ofleverage, the country of origin, and the magnitude of tax savings from hedging (convex-ity). Throughout all regressions of the paper, we include 10 control variables widely usedin the literature to explain risk management intensity (e.g., Tufano, 1996; Graham, andRogers, 2002; Adam, 2009; Campello, Lin, and Zou, 2011). Five out of 10 variables are
19

always statistically significant, with the predicted sign. Specifically, the leverage has apositive and significant sign, suggesting that highly leveraged firms hedge more to reducetheir expected default costs (Stulz, 1996). The tax advantage measured by the convexity ofthe tax function also has a positive and significant sign, as predicted (see also Campello,Lin, and Zou, 2011; Dionne and Triki, 2013). Firms hedge ex ante to reduce their expectedtax payments. The percentage of institutional holdings (%_inst) reduces the propensity ofhedging. Intuitively, these large institutions are well diversified and less prone to hedge.They can also reduce the information asymmetry between the CEO and shareholders. Fi-nally, we also find that CEO share holdings increase the firm’s hedging activity, whereasCEO option holdings decrease it. The argument is that risk-averse CEOs with higher shareholdings tend to protect their capital by hedging more. Those with high option holdings willtend to hedge less to increase the value of their options (Stulz, 1996; Tufano, 1996). How-ever, the second argument does not support the dynamic behavior of risk-averse investorsshown by Carpenter (2000). We address this argument in the robustness section of thepaper.
We also find that size, market-to-book and dividend policy are not significant in thesecond stage, although they are significant in the first stage. The quick ratio and CEO ageare not significant in either stage. See for instance Table 2.
[Insert Table 2 here]
4.2 Importance of financial knowledge
We first test the effect of the financial knowledge of the members of the audit committeeusing our broad definition of financial knowledge (i.e., experience combined with educationin finance and accounting). Our sample is about 76% comprised of audit committees withat least one financially active member (who may also be educated and an accountant) and41% comprised of committees that are totally independent.14
Our first set of results (not reported here) indicates that having at least one financiallyactive member on the audit committee has an insignificant effect on the hedging behaviorof the firm, even for a totally independent committee. We further test this result using astricter definition of financial knowledge. We therefore separate the effects of directors whoi) are financially active, educated, and an accountant, ii) are financially active and educatedand not an accountant, and iii) are financially active, not educated, and not accountant.
The main conclusion of this section can be summarized as follows. The SOX and NYSErequirements of the independence of the audit committee are always significant, while theNYSE requirement of a majority of independent directors on the board is never significant.
14For conciseness, we do not report all the results here; they are available upon request.
20
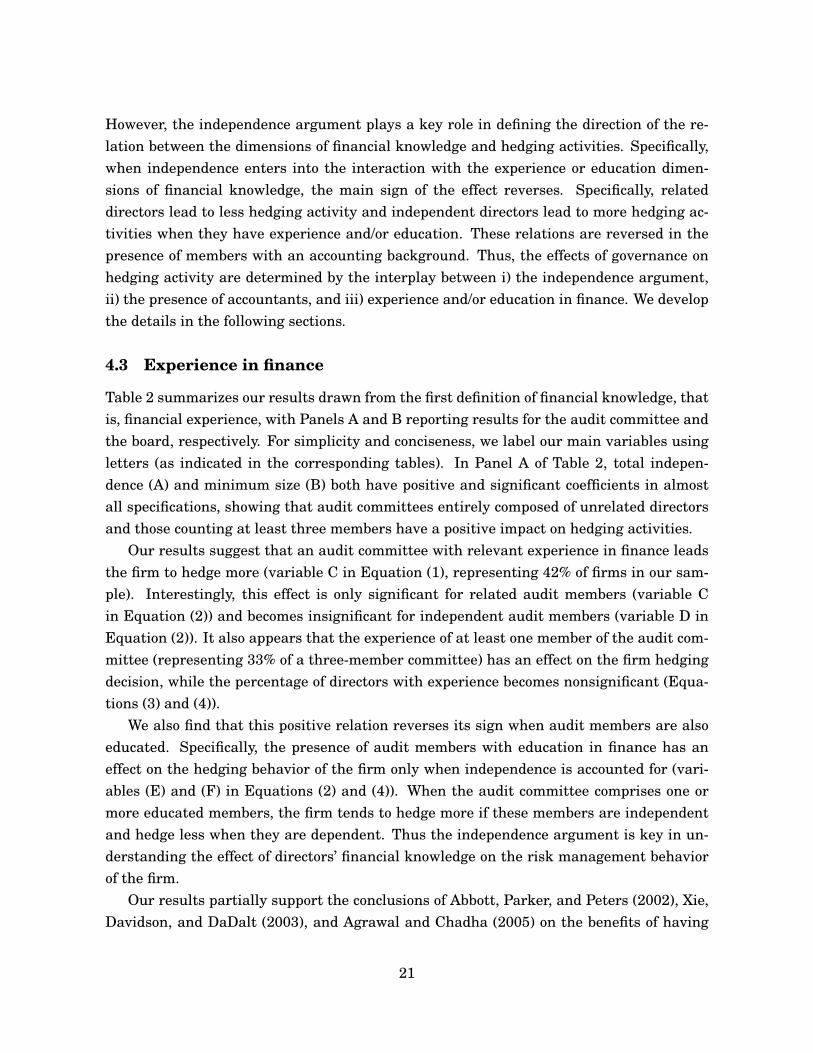
However, the independence argument plays a key role in defining the direction of the re-lation between the dimensions of financial knowledge and hedging activities. Specifically,when independence enters into the interaction with the experience or education dimen-sions of financial knowledge, the main sign of the effect reverses. Specifically, relateddirectors lead to less hedging activity and independent directors lead to more hedging ac-tivities when they have experience and/or education. These relations are reversed in thepresence of members with an accounting background. Thus, the effects of governance onhedging activity are determined by the interplay between i) the independence argument,ii) the presence of accountants, and iii) experience and/or education in finance. We developthe details in the following sections.
4.3 Experience in finance
Table 2 summarizes our results drawn from the first definition of financial knowledge, thatis, financial experience, with Panels A and B reporting results for the audit committee andthe board, respectively. For simplicity and conciseness, we label our main variables usingletters (as indicated in the corresponding tables). In Panel A of Table 2, total indepen-dence (A) and minimum size (B) both have positive and significant coefficients in almostall specifications, showing that audit committees entirely composed of unrelated directorsand those counting at least three members have a positive impact on hedging activities.
Our results suggest that an audit committee with relevant experience in finance leadsthe firm to hedge more (variable C in Equation (1), representing 42% of firms in our sam-ple). Interestingly, this effect is only significant for related audit members (variable Cin Equation (2)) and becomes insignificant for independent audit members (variable D inEquation (2)). It also appears that the experience of at least one member of the audit com-mittee (representing 33% of a three-member committee) has an effect on the firm hedgingdecision, while the percentage of directors with experience becomes nonsignificant (Equa-tions (3) and (4)).
We also find that this positive relation reverses its sign when audit members are alsoeducated. Specifically, the presence of audit members with education in finance has aneffect on the hedging behavior of the firm only when independence is accounted for (vari-ables (E) and (F) in Equations (2) and (4)). When the audit committee comprises one ormore educated members, the firm tends to hedge more if these members are independentand hedge less when they are dependent. Thus the independence argument is key in un-derstanding the effect of directors’ financial knowledge on the risk management behaviorof the firm.
Our results partially support the conclusions of Abbott, Parker, and Peters (2002), Xie,Davidson, and DaDalt (2003), and Agrawal and Chadha (2005) on the benefits of having
21

financially active directors sitting on the audit committee. However, we show that the ef-fect on hedging depends on whether the members are related to or independent of the firm.Our results also support the SOX requirement that all public companies need at least one“independent qualified financial expert” sitting on the audit committee to help the firm usesophisticated financial instruments for hedging. Panel B of Table 2 summarizes the resultsfor board members. The NYSE regulation requires that listed companies have a majorityof independent directors. In our sample, about 74% of the firms have a board with a major-ity of unrelated directors. Our results indicate that the main effect of this requirement onhedging is not significant. In unreported analysis, we consider the percentage of indepen-dent directors instead of the majority and find a positive and significant effect on hedging(results available from the authors). This suggests that a certain number of independentdirectors on the board positively affect the firm’s hedging behavior. However, when theirnumber constitutes a majority, the marginal benefit from adding more independent direc-tors to the board decreases and even becomes insignificant.
Overall, the main conclusions remain stable for directors on the board. Specifically,having board members with experience and without certified education in finance affectsthe firm’s risk management behavior. When these members are insiders, the firm tendsto hedge more and, when they are outsiders, the firm tends to hedge less (variables (C)and (D) in Equations (1) and (2), Panel B of Table 2). As shown for the audit committee,education reverses the sign of this relation. When directors are also educated, firms tendto hedge more when they are independent and less when they are dependent (variables (E)and (F) in Equations (1) and (2), Panel B). In addition to the previous results, the presenceof directors with an accounting background tends to have the same effect as for directorswith experience (variables (G) and (H) in Equations (1) and (2), Panel B).
Throughout the paper, the Inverse Mills ratio has an insignificant coefficient in all spec-ifications, suggesting that our sample does not suffer from serious selection bias. Thus, wecan combine positive and zero hedge ratios in the same regression in subsequent analyses.
4.4 Education in finance and an accounting background
In Table 3, we report the results obtained with our second and third definitions of financialknowledge, that is, financial education and an accounting background, since accountantsare always educated, according to our definition (see also Appendix E-2 for more details).To account for education in finance including an accounting background, we consider thosedirectors who are i) active, educated, and an accountant, ii) active, educated, and not anaccountant, iii) not active but educated and an accountant, and iv) not active but educatedand not accountant. Overall, about 90% of the audit committees in our sample contain atleast one financially educated director, with each of the four education subgroups repre-
22
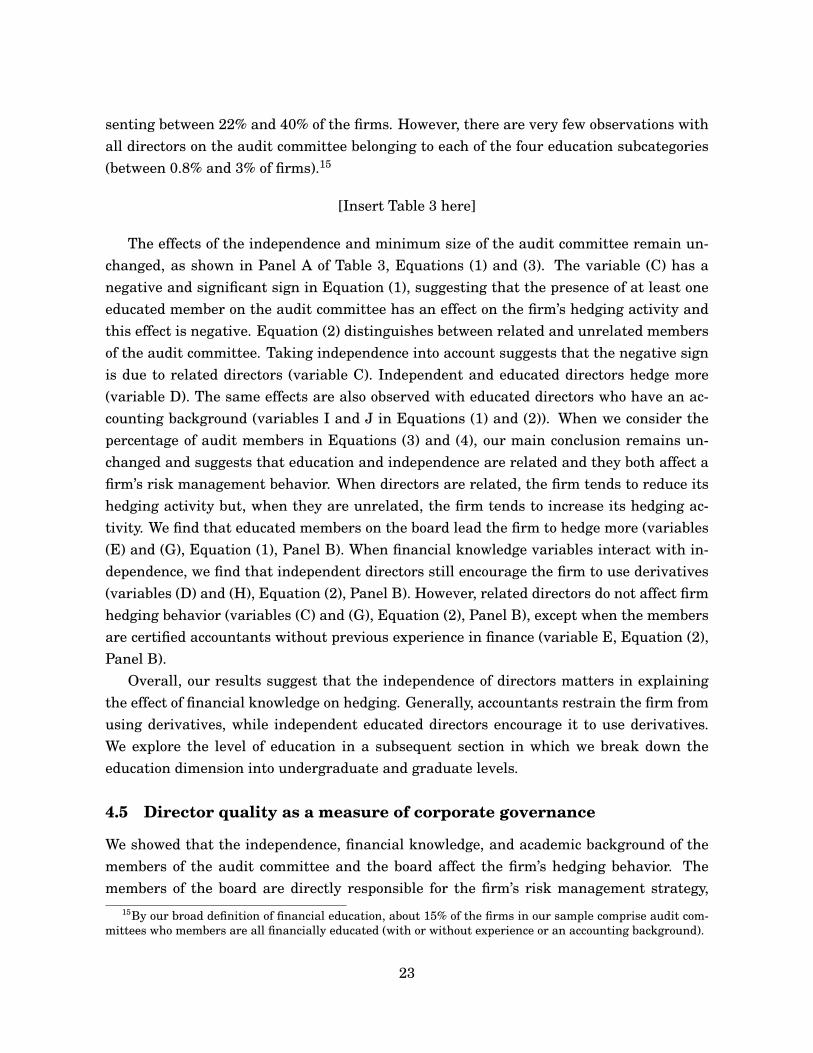
senting between 22% and 40% of the firms. However, there are very few observations withall directors on the audit committee belonging to each of the four education subcategories(between 0.8% and 3% of firms).15
[Insert Table 3 here]
The effects of the independence and minimum size of the audit committee remain un-changed, as shown in Panel A of Table 3, Equations (1) and (3). The variable (C) has anegative and significant sign in Equation (1), suggesting that the presence of at least oneeducated member on the audit committee has an effect on the firm’s hedging activity andthis effect is negative. Equation (2) distinguishes between related and unrelated membersof the audit committee. Taking independence into account suggests that the negative signis due to related directors (variable C). Independent and educated directors hedge more(variable D). The same effects are also observed with educated directors who have an ac-counting background (variables I and J in Equations (1) and (2)). When we consider thepercentage of audit members in Equations (3) and (4), our main conclusion remains un-changed and suggests that education and independence are related and they both affect afirm’s risk management behavior. When directors are related, the firm tends to reduce itshedging activity but, when they are unrelated, the firm tends to increase its hedging ac-tivity. We find that educated members on the board lead the firm to hedge more (variables(E) and (G), Equation (1), Panel B). When financial knowledge variables interact with in-dependence, we find that independent directors still encourage the firm to use derivatives(variables (D) and (H), Equation (2), Panel B). However, related directors do not affect firmhedging behavior (variables (C) and (G), Equation (2), Panel B), except when the membersare certified accountants without previous experience in finance (variable E, Equation (2),Panel B).
Overall, our results suggest that the independence of directors matters in explainingthe effect of financial knowledge on hedging. Generally, accountants restrain the firm fromusing derivatives, while independent educated directors encourage it to use derivatives.We explore the level of education in a subsequent section in which we break down theeducation dimension into undergraduate and graduate levels.
4.5 Director quality as a measure of corporate governance
We showed that the independence, financial knowledge, and academic background of themembers of the audit committee and the board affect the firm’s hedging behavior. Themembers of the board are directly responsible for the firm’s risk management strategy,
15By our broad definition of financial education, about 15% of the firms in our sample comprise audit com-mittees who members are all financially educated (with or without experience or an accounting background).
23

whereas the audit committee members monitor and control board decisions that can affecthedging decisions. Our results in Tables 2 and 3 suggest that independence is very im-portant for the audit committee and less important for members of the board. However,independence plays a key role in defining the sign of the effect of financial knowledge di-mensions on the firm’s hedging behavior for both the audit committee and the board. Thus,the three dimensions of financial knowledge should affect corporate governance, along withindependence and CEO–board relation.
We therefore construct two governance indexes to account for all of these features andtest the effect of our governance measure on the firm’s risk management behavior. Specif-ically, we use a scoring system to assess the quality of the audit committee and the board.The score is built such that it increases with each dimension of financial knowledge. It alsoincreases with compliance with the SOX and NYSE requirements of independence andtheir definition of financial knowledge. However, the score decreases with the CEO level ofentrenchment and with directors’ tenure. Tenured directors who served the same companyfor at least 10 years should have acquired relevant experience and learned from the dif-ferent challenges across various economic regimes. However, derivative instruments arerelatively new during our sample period and we are thus inclined to discount the presenceof high numbers of tenured directors simply because they may not have developed enoughknowledge and experience with these new instruments. We document the constructionof both indexes—one for the audit committee and one for the board (GovIndexAud andGovIndexBor, respectively)—in Appendix F. In the robustness section, we reconstruct thetwo governance indexes using PCA and we discuss the issue of potential endogeneity.
In Table 4, we test the effect of our governance indexes on the firm’s risk managementbehavior, using multivariate regressions in Panel A and the Heckman two-stage model inPanel B (variables are reported in Appendix E-3). Since the inverse Mills ratio was neversignificant throughout the paper, we use the multivariate regression as a robustness checkto observe the hedging behavior of all firms, as opposed to firms that hedge. Equations (1)to (3) of both panels refer to the effects of adding the governance index of the audit, theboard, or both, respectively. In all cases, we find that the quality of the audit committeeand board significantly affects the observed hedging behavior of the firms in our sample.The higher the governance index, the higher the firm’s hedging activity. These results arerobust to the model specification. Our control variables, available upon request, remainstable.
Thus, consistent with our previous conclusions, a firm with sound corporate governanceis actively hedging its gold position using the derivatives market. Therefore, financialknowledge and independence are important indicators of corporate governance in buildingour indexes. It would be interesting to verify whether sound corporate governance basedon our financial knowledge dimensions also increases shareholder value through the risk
24

management channel. We address this point in the next section.
[Insert Table 4 about here]
4.6 Hedging behavior and firm performance
Several studies address the question of whether hedging increases the shareholder value.For instance, Jin and Jorion (2006) find support for Modigliani and Miller’s theory in whichrisk management should not affect firm value. Specifically, empirical tests show that hedg-ing against fluctuations of the price of energy does not increase the value of oil and gasfirms. Another strand of the literature finds support for firm value maximization theory.Under this theory, markets are imperfect and risk management adds value to sharehold-ers. For instance, taxes, the costs of financial distress, and investment external financingprovide positive rationales for risk management (for a review, see Stulz, 1996).
In support of this literature, Allayannis and Weston (2001) find that the use of foreigncurrency derivatives increases firm value by 4.8%. Carter, Rogers, and Simkins (2006) findthat hedging against fluctuations in the price of fuel increases the value of US airlinesby approximately 12–16%. Graham and Rogers (2002) report a hedging premium of 1.1%.However, Guay and Kothari (2003) question the evidence in support of value maximizationtheory and attribute the increase in firm value to other value-enhancing risk managementactivities and not to hedging.
Using the same sample as in our study, Adam and Fernando (2006) support value maxi-mization theory. They show that gold producers typically lock in a profit of about 3%, usingfutures contracts.
In line with the literature, we question whether our governance indexes accountingfor the quality of directors in terms of financial expertise and independence increase firmvalue through the risk management channel. Table 5 reports the results for our tests.
[Insert Table 5 about here]
We do not find evidence of feedback effects between observed hedging and firm perfor-mance. As shown in Panel A of Table 5, firm performance does not seem to affect hedginglevels. Hedging activities in firms with qualified boards and audit committees increaseboth the firms’ accounting and market performance (Panel B). This result supports theviews suggesting that risk management is beneficial to firms and their shareholders, whilerisk management is not endogenously affected by firm performance.
Our measures of the governance indexes are always positive and significant, suggestingthat the financial expertise of directors affects hedging behavior and leads firms to hedgemore. We find that firm accounting performance is negatively related to the leverage ra-tio, suggesting that highly levered firms suffer from a heavier debt burden, but limits firm
25

investment choices and leads to lower accounting performance. However, leverage is posi-tively related to market performance, in line with another strand of the literature, suggest-ing that highly levered firms have better market performance. According to agency theory,the monitoring provided by debt financing reduces management’s incentive to squanderfree cash flows and should consequently lead to better firm performance. The positive re-lation between the price of gold and firm performance is intuitive, since firms make moreprofits when the gold market is bullish because they can close up their positions and sellthe gold at a higher price in the spot market. Our instruments in the hedge equationare positive and significant, suggesting that our model does not suffer from endogeneityissues. Since firm performance is not significant in the hedging equation, the potentialendogeneity effect of firm performance does not really matter.
For robustness, we re-estimate the model in Table 5 using a different methodology.Specifically, we estimate the model in two stages. In the first stage, we estimate the hedgeratio equation using the same specification as in the previous simultaneous system. Thisfirst stage yields the predicted level of risk management (the hedge ratio predicted). In thisstage, our control variable for the endogeneity effect is also Tax_save. In the second stage,we evaluate the effect of the predicted risk management on firm accounting and marketperformance. Since we obtain the same results, we report them in Appendix E, Table E-4.1.In sum, all the coefficients have the same signs as in the simultaneous equation system.The predicted level of hedging has a positive and significant effect on firm performance.Our evidence also confirms that the presence of financially qualified directors on the boardand audit committee has a positive impact on hedging equation. Our instrument in thehedging equation has also the same sign as reported in the model with simultaneous equa-tions. As an additional check, we run the second stage of the Heckman model using thespecification reported in Appendix E-4. Our conclusions remain unchanged and are robustto the method utilized. Thus, for conciseness, we do not report all the results but they areavailable upon request. We present additional results in the robustness section.
4.7 Importance of the high education of directors
An important takeaway from repeating our tests with different specifications is that thelevel of the financial education of directors reshapes the firm’s hedging behavior. Specif-ically, we argue that when directors have the skills required to understand the differentoperations involved in risk management policy, they will make better risk managementdecisions. Thus, we are wondering whether our results translate into the necessity of re-quiring a minimum level of education in finance for both the board and audit committee toensure more efficient corporate decision making. Of course, we are not saying that direc-tors without a university degree are not capable of making sound management decisions.
26
Instead, we argue that board decisions on whether to hedge should develop from a betterunderstanding of financial instruments such as derivatives and overseeing the financialimpacts of gold price changes on the firm. The clearest impact is that of revenue fluctua-tions. Other impacts could be from deferring M&A deals, securitizing future sales (a formof hedging), holding off or opening new mines, management compensation, and so forth.A board with strong skills in financial and management reporting, financial planning andanalysis, cash management and treasury, risk analysis, benchmarking, banking relation-ships, and so on, would certainly make better decisions. Note that the best decision maynot be to hedge. Strong financial professionals very often recognize uncertainties with fi-nancial markets. The best policy for a mining firm may not be to simply lock in supposedlyhigh prices (which involves a good forecast of inflation, interest rates, etc.) but, rather, tocover capital investment and expenses. A well-developed board with strong financial skillsis capable of making better decisions. Thus, we argue that high levels of financial educa-tion should be important, at least for members of the board who are directly responsiblefor the firm’s risk management.
To test the importance of education, we consider separately the effect of directors hav-ing a bachelor’s and higher degrees (master’s or PhD) in finance on firm hedging activities.We consider two new variables: i) the percentage of directors holding a bachelor’s degreein finance (%Bachelor) and the percentage of directors holding a higher degree in finance(%HighEdu). We also consider the interaction between these two variables and the num-ber of educated directors. For the audit, we consider the variable of having at least onedirector (OneNotActEduNotAcc) or the percentage (%NotActEduNotAcc) of directors edu-cated (since we do not have an audit committee with all educated directors). For the board,we consider the variable for the percentage of directors educated (since we do not have aboard with a majority of directors educated in finance). We also include the interactionbetween the education of directors and their accounting background along with two othernew hand-collected variables to account for the education of the CEO. Our results are re-ported in Table 6 (with more details in Appendix E-5) and can be summarized as follows.
In the audit committee, educated directors holding a bachelor’s or higher degree in fi-nance have a positive impact on firm hedging activity (Panel A of Table 6). Specifically, theeffect on hedging of having at least one or even a percentage of educated directors withoutprevious experience in the financial market is negative. However, this effect becomes pos-itive when we add interaction with the percentage of directors with a bachelor’s or higherdegree in finance. When the board comprises more directors with a bachelor’s degree orhigher in finance, the firm is more engaged in hedging against fluctuations in gold price.Our results reported in Panel B show that both a strong accounting-based board and aCEO with at least a master’s degree in finance increase hedging. However, a CEO holdinga bachelor degree does not necessarily affect the firm’s propensity to hedge.
27

[Insert Table 6 here]
Firms that are engaged more in risk management could lean toward attracting edu-cated directors, which brings up a potential endogeneity issue. A similar situation is docu-mented by Minton et al. (2010) in the banking industry. To account for endogeneity issues,we simultaneously estimate the equation of the hedge ratio and that of high education (di-rectors with a master’s degree in finance or a PhD), using the three-stage least squaresmethod of Zellner and Theil (1962) for each equation. The control variables for the hedgeratio equation include variables of the first stage of the Heckman estimation, CEO age,CEO holdings in shares and options, and the percentage of institutional holdings from thesecond stage. We also add the governance score, accounting for the financial background ofdirectors sitting on the board or the audit committee and the price of gold, which accountsfor market movements. In the high education equation, the control variables include firmsize, the market-to-book, and the percentage of institutional holdings. Additional indepen-dent variables include the cash fee paid for each meeting to outside directors, the annualfixed fee in the United States, the CEO’s number of years of tenure, the average tenure onthe board, the average age of the directors, and the number of options held by all directors.
Our results show that a high level of education is important for directors sitting on theboard and is insignificant for the audit committee (Table 7). The two governance indexesare always positive and significant, suggesting that the high quality of the board and ofthe audit committee increases the level of risk management. Most of the control variablesare significant and have the predicted sign. We also find that firms with high hedge ratiosattract highly educated directors on both the audit committee and the board.
[Insert Table 7 here]
Thus, our results can be summarized as follows: i) Financial education is importantfor the directors sitting on the board, ii) financial education is important for the directorssitting on the audit committee when they lack financial sector experience, and iii) a boardwith more directors holding a higher degree in finance is more active in hedging. Ourfindings provide the first empirical evidence concerning the importance of a universityeducation for the directors sitting on the board and for the CEO. Our conclusions pertainingto board/audit committee independence and other determinants of hedging policy remainunchanged.
4.8 Policy implications
We now focus on the policy implications of our testable hypotheses. Even though the in-dependence and accounting knowledge of directors are accounted for in the current reg-ulation of nonfinancial institutions, it is not clear that these rules are achieving the goal
28
of the regulation. Regulators have left the notion of financial literacy open to firm inter-pretation and the concept is rather vague without an explicit regulatory requirement forthe financial knowledge of board members. Under some circumstances, the concept is de-fined endogenously by the board members themselves. During the 2007 financial crisis, itbecame clear that board members were missing the necessary knowledge to understandthe complexity of the financial markets and necessary amendments to current regulationsare still needed in the nonfinancial sector. Although the NYSE requires that at least onemember of the audit committee have an accounting background, this requirement does notseem to have been very effective.
We test the effect of the SOX and NYSE regulations on risk management activities inTable 8. As explanatory variables in the hedging equation, we add the variables measuringeach of the corresponding rules. We also construct six compliance indexes: two for SOXrules, two for NYSE rules, and two indexes for both rules. For each set of rules, we addthe variables measuring each of these rules or we multiply them to account for interactioneffects. Details on the construction of these indexes are reported in Appendix F.
Our results show that the SOX compliance index always has an effect on risk man-agement activities; however, the NYSE compliance index is not significant in most cases.When we test the model using the index constructed for both the SOX and NYSE regula-tions, we find a significant effect of regulation on risk management activities that is mainlydue to SOX.
[Insert Table 8 here]
To test the effect of the regulations on firm performance, we use a three-stage system ofsimultaneous equations, thus addressing endogeneity issues. Results are reported in Table9. We find that SOX regulation remains positively significant in the hedging. However,this positive effect on hedging is not transmitted to shareholders, since we do not findany significant effect of risk management on firm performance. The results for the NYSEregulation remain consistent with a lack of significant effect on hedging. As a robustnesscheck, we estimate the hedging equation using our instrumental variables and we estimatethe firm performance equation using the predicted level of hedging. We find similar resultsfor the effect of the regulation on risk management activities. Interestingly, SOX regulationseems to affect firm market performance at the 10% level of confidence through the riskmanagement channel. For conciseness, we report these additional results in AppendixE-4.2.
[Insert Table 9 here]
29

5 Robustness analysis
5.1 Educated hedging against shocks to gold prices
The main goal of risk management in the gold mining industry is to hedge gold productionagainst unpredictable changes in the price of gold. The question is whether firms withfinancially educated directors make better hedging decisions than the average of the in-dustry. To analyze this question, we measure educated hedging as the difference betweeni) the average hedge ratio of firms with educated directors and ii) the average hedge ratioof all firms (industry average). Our test focuses on examining the first movers when theprice of gold starts downshifting. To model shifts in gold price, we use the regime shiftdetection technique of Maalaoui Chun, Dionne, and François (2014) to detect in real timesignificant shifts in the price of gold. Detected shifts are significant if the change in theprice of gold is higher than two standard deviations of the price of gold. We choose to usethis detection method because it enables us to detect shifts out of sample as opposed to in-sample detection using a Markov switching regime technique. Another advantage of thisdetection technique is being parameter free and not requiring initial hypotheses. It alsoseparates shifts in level from shifts in volatility. We use daily gold prices observed duringthe period of analysis and confirm that a shift has occurred if the confidence level is 95%or higher. The most significant shift is detected in the first quarter of 1997. We use thisshift to examine the behavior of educated hedging following unexpected shifts in gold pricerelative to the industry average. We also test the interaction between educated hedgingand gold price regime shifts.
Our results show that, following a regime shift in the gold price, the marginal effectof educated hedging is significantly positive (a regression coefficient of 0.812, significantat the 1% confidence level in Table 10). This means that firms with educated directorsare the first movers in hedging against gold prices More interestingly, during low goldprice regimes, the coefficient of educated hedging is even higher (a regression coefficientof 2.090 = (0.812+1.278), significant at 1%). These results seems to confirm that firmswith educated directors hedge more, especially when prices slope downward. The fact thateducated hedging is higher during low gold price regimes seems to further suggest thateducated hedging is based on earlier predictions of the movement of the gold price, sincefirms plan hedge activity before the gold price shift occurs.
[Insert Table 10 about here]
5.2 PCA
Governance quality, not observed directly, has a number of aspects that cannot be cap-tured by a single measure. Because direct measures of governance are unavailable, most
30

previous empirical studies use different proxies or create indexes to measure governancequality. In this section, we extend the analysis of Section 4.6 by constructing two alterna-tive governance indexes by applying PCA to our governance variables for the board and theaudit committee (variable definitions in Appendix F). Specifically, each governance indexrepresents the principal factor that accounts for most of the variation across the differentgovernance variables. This factor is simply defined as a linear combination of governancevariables, where the loadings are determined by the PCA (see Appendix G-1). Since ourgovernance variables are dichotomous (zero/one), our PCA is based on the tetrachoric corre-lation matrix adapted for such variables (e.g., the SAS package for the principal componentprocedure).
Tetrachoric correlations assume a latent bivariate normal distribution for each pair ofdiscrete variables. The means and variances of the latent variables are not identified, buttheir correlations can be estimated and are called tetrachoric correlations (Edwards andEdwards, 1984). One can compute pairwise estimates of the tetrachoric correlations usingthe maximum likelihood estimator obtained from bivariate probit estimations without ex-planatory variables. The pairwise correlations matrix can then be used to perform a PCAof the binary variables. Tetrachoric correlations permit an intuitive understanding of thesize of correlations and this intuition is based on correlations that range from -1 to +1.
In each case, we retain the first principal component, which explains most (47%) of thetotal variation for governance variables related to the audit committe and (37%) of thetotal variation for governance variables related to the board. We use these factors as ex-planatory variables in the simultaneous system of regressions testing the effect of hedgingon firm value. We also re-estimate the two equations using the two-stage methodology.The results are very similar to those reported with our governance index constructed us-ing a simple linear combination of the eight variables. Both factors always have positiveand very significant coefficients in the hedging equation as reported in Table 11. All vari-ables loadings are reported in Appendix G-1 and complete regression results are reportedin Appendix G-2. The hedge ratio has also a positive and very significant effect on firmvalue. Notice that the two principal factors can be interpreted as instrumental variablesin addition to the documented Tax_save variable (untabulated results are available uponrequest).
[Insert Table 11 about here]
5.3 Effect of option holdings on risk management
The goal of incentive compensation is to motivate managers to make business decisionsthat increase shareholder value. To test the achievement of this goal, a large literature
31

studies the relation between executive compensation and companies’ economic and finan-cial decisions, with recent surveys by Core, Guay, and Larcker (2003), Aggarwal (2008),Edmans and Gabaix (2009) among others. Unfortunately, there are no strong results inthe literature yet that permit conclusions on the incentive effects of such compensationschemes.
Related to our study, many authors have estimated the relation between managerialincentives and corporate hedging. The results suggest that stronger equity incentives areassociated with less risk taking to protect officers’ capital value, while convexity in execu-tives’ portfolios due to options is correlated with less hedging (Tufano, 1996; Guay, 1999;Coles, Daniel, and Naveen, 2006).
We obtain two important results in relation with this literature on hedging. We firstconfirm that CEOs (or all executives) with call options on the firm’s shares hedge less (effecton hedging is always significantly negative), while those with shares hedge more (effect onhedging always significantly positive). Second, we find that less hedging reduces the valueof the firm. This suggests that when hedging decisions are motivated by the officers’ in-terests instead of those of shareholders, they result in a negative effect on the firm. Theseresults are obtained with different econometric specifications and are stable with the ob-served hedging behavior in this industry. Our results extend the results of Tufano (1996).Without an explicit empirical test, Tufano argues that hedging less to increase the volatil-ity of share prices and the value of personal option holdings may have no consequences onfirm value when hedging is costless. Our empirical results suggest that less hedging basedon personal motives reduces the value of the firm and thus becomes costly to shareholders.
Carpenter (2000) shows that, theoretically, in a dynamic model of hedging where arisk-averse CEO is constrained not to trade his or her options, more compensation withoptions increases the risk of the CEO’s portfolio providing an incentive for the CEO toincrease hedging activities to control the volatility of his or her own portfolio. In otherwords, at equilibrium, giving the manager more options should make the manager hedgemore. This hedging incentive is reinforced for a CEO who also holds shares because morehedging also increases the value of these shares. Interestingly, in the gold mining industry,the empirical evidence does not fully support this theory, since the sample firms in whichCEOs and officers hold more options tend to hedge less.
We did verify different facts in our data that may provide some directions to answerthis puzzle. We first estimate a simultaneous system of equations where, in the first equa-tion, we continue to explain the hedge ratio of the firm and, in the second equation, weexplain the value of option holdings either of the CEO or of all officers, including the CEO.In our specifications, we first consider the benchmark system of equations without any gov-ernance or compliance variables. Then, we add the two compliance indexes for SOX andthe NYSE. In all cases, we obtain the same results; thus we only report the last estimation
32

in Table 12. The untabulated results are available from the authors. Specifically, the valueof option holdings remains negative and significant in the hedge ratio equation, while thevariable for officers’ option holdings is never affected by the hedge ratio. The officers do notadjust their option holdings in function of the firm’s hedge ratio, which is consistent withthe assumption of Carpenter (2000). Therefore, the conjecture that they use firm hedgingto adjust the risk of their portfolios is reinforced. According to Carpenter, this behavior canbe rational for officers with deeply out-of-the-money portfolio option holdings or with lessimportant share holdings.
[Insert Table 12 about here]
We collect strike prices from firms’ proxy statements and corresponding share prices inthe quarter the option is granted. We then compute the option’s value and document itsmoneyness as reported in Table 13. Among all options granted to officers, 66% are deeplyout of the money, 26% are in the money, and about 8% are at the money. These statisticssupport our conjecture that officers with more option holdings hedge less, to increase theiroption holding value. They are also consistent with the conjecture of Carpenter (2000), whosuggests that officers may have increased incentives to hedge less if their option holdingsare out of the money.
[Insert Table 13 about here]
6 Conclusion
The goal of this paper is to emphasize the importance of directors’ knowledge and educa-tion in finance and/or accounting for the firm and shareholders. Our motivation stems fromthe recent financial crisis revealing the failure of the board in its task to oversee risk man-agement, mainly because of its limited knowledge and understanding of the risks involvedwhen using complex financial assets. Few papers in the literature address the financialknowledge dimension of corporate governance, mainly because it is very costly to collectdetailed data on directors’ financial knowledge, since such information does not fall withinany explicit regulatory requirement or disclosure obligation. For our purposes, we collectedthese data for directors in the gold mining industry during a period for which we also havedetailed information on firms’ observed hedging transactions. These data together createa unique laboratory for analyzing the relation between firms’ hedging behavior and di-rectors’ financial knowledge and independence. An additional feature of our data is thatthe sample period ends before the era of major corporate governance scandals, followed byregulatory changes and preparatory work for the 2002 SOX and NYSE regulations. Thus
33

the observed structure of boards and audit committees in our sample firms does not reflectchanges made to comply with these regulations.
Another contribution of our study is our level of detail on directors’ financial knowl-edge. The current definition in the 2002 NYSE regulation is rather vague. We considerthree dimensions of financial knowledge and we test how each dimension could affect firmperformance. To achieve our goal, we start from the basics that director quality, includingindependence and expertise with the financial market and financial instruments, enhancesthe governance of risk management. When the governance of risk management is effec-tive, it should increase firm performance—hence its value. Thus, a firm’s observed hedgingbehavior is our channel to test how effective our corporate governance measures based onfinancial knowledge are on firm performance.
The main conclusion of our paper is that financial knowledge improves the governanceof risk management activities and increases firm performance. Interestingly, our resultsbecome even stronger when we interact the independence variable with measures of finan-cial knowledge. Another important result is the interplay between experience and educa-tion. Both dimensions affect a firm’s risk management behavior in a certain way and botheffects are strengthened in the presence of independence. We also construct governanceindexes with variables we believe should assess the effectiveness of a firm’s governancesystem. We find that these governance indexes are always associated with higher levels ofhedging and, through this channel, increase firm performance after controlling for poten-tial endogeneity issues.
An additional step in our analysis is the exploration of the effects of different educa-tion levels on risk management activities. We find that higher education levels (PhD andmaster’s degrees in finance) have more significant effects on hedging than lower educationlevels (bachelor’s degree in finance).
Our study has important policy implications. Since the 2007 financial crisis, regulatorshave been concerned with the origins of the governance failure with respect to risk manage-ment. The follow-up studies of regulators point to the limited knowledge of financial risksby key directors responsible for monitoring and governing major risk management deci-sions at all firm levels. Indeed, financial markets are dynamic and change continuouslyby integrating new instruments and various financial products. The boards of directorswere not necessarily aware of the rapid evolution of risk management in the beginningof the 2000s and may have misunderstood the functioning of certain instruments, lead-ing to a mis-assessment of firms’ real risk exposure. As a matter of fact, many regulatorychanges occurred recently for financial institutions, including banks and insurance compa-nies. These regulations mandate the creation of risk committees at the board level, whereeach member must be independent and must also have sufficient financial knowledge inrisk management. When appropriate, the committee should include individuals with tech-
34
nical knowledge in the risk discipline!One important aspect recently mentioned by Stulz (2014) is the fact that the audit of
risk management differs from the audit of accounting statements. Audits of financial state-ment mainly have a compliance role. Audits of risk management have a compliance rolebut the risk committee must also evaluate whether the current risk management policy,although compliant, maximizes the value of the firm. This distinction justifies the creationof two distinct committees in large financial institutions and in nonfinancial institutionswith high risk exposure. It also justifies the need for having independent members on therisk committee that have sufficient financial knowledge to accomplish the dual role of theiraudit.
35
References
[1] Abbott, L., Parker, S., and Peters, G. (2002), “Audit committee characteristics andfinancial misstatement: A study of the efficacy of certain blue ribbon committee rec-ommendations,” working paper, University of Memphis, Santa Clara University andUniversity of Georgia.
[2] Adam, T. R., 2009. “Capital expenditures, financial constraints, and the use of options,” Journal of Financial Economics, 92, 238–251.
[3] Adam, T. R., Fernando, C. S., 2006. “Hedging, speculation, and shareholder value, ”Journal of Financial Economics, 81, 283–309
[4] Adam, T. R., Fernando, C. S., and Salas, J. M., 2012. “Why do firms engage in selectivehedging? ” SFB 649 Discussion Paper 2012–2019.
[5] Adams, R. B., Hermalin, B. E., and Weisbach, M. S., 2010. “The role of boards ofdirectors in corporate governance: A conceptual framework and survey, ” Journal ofEconomic Literature, 48, 58–107.
[6] Agrawal, A., and Chadha, S. (2005), “Corporate governance and accounting scandals,”Journal of Law and Economics, 48, 371–406.
[7] Aggarwal, R. K. (2008), “Executive compensation and incentives,” in Handbook ofCorporate Finance: Empirical Corporate Finance, B. E. Eckbo (ed.), Elsevier/North-Holland, Amsterdam, pp. 497–538.
[8] Allayannis, G., Weston J. (2001), “The use of foreign currency derivatives and firmmarket value,” Review of Financial Studies, 14, 1, 243–276.
[9] Armstrong, C., Core, J., Guay, W. (2014), “Do independent directors cause improve-ments in firm transparency? ” Journal of Financial Economics, forthcoming.
[10] Arets, K., Bartram, S. M. (2010), “Corporate hedging and shareholder value,” Journalof Financial Research, 33, 4, 317–371.
[11] Bai, J., Ng, S. (2010), “Instrumental variable estimation in a data rich environment”Econometric Theory, 26, 1577–1606.
[12] Beasley, M. (1996), “An empirical analysis of the relation between the board of directorcomposition and financial statement fraud,” The Accounting Review, 71, 4, 443–465.
[13] Bhagat, S., Black, B. (2002), “The non-correlation between board independence andlong term firm performance,” Journal of Corporation Law, 27, 2, 231–273.
[14] Booth, J., Deli, D. (1999), “On executives of financial institutions as outside directors,”Journal of Corporate Finance, 5, 3, 227–250.
[15] Borokhovich, K., Brunarski, K., Crutchley, C., Simkins, B. (2004), “Board compositionand corporate use of interest rate derivatives,” Journal of Financial Research, 27, 2,199–216.
36
[16] Breeden, D., Viswanathan, S. (1998), “Why do firms hedge? An asymmetric informa-tion model,” working Paper, Duke University.
[17] Campello, M., Lin, C., Ma, Y., Zou, H. (2011), “The real and financial implications ofcorporate hedging, ” Journal of Finance, 66, 1615–1647.
[18] Carcello, J., Neal, T. (2000), “Audit committee composition and auditor reporting,” TheAccounting Review, 75, 4, 453–467.
[19] Carter, D., Rogers, D., Simkins, B. (2003), “Does fuel hedging make economic sense?The case of the US airline industry,” working paper, Oklahoma State University andPortland State University.
[20] Coles, J. L., Daniel, N. D., Naveen, L. (2006), “Managerial incentives and risk-taking,” Journal of Financial Economics, 79, 2, 431–468.
[21] Core, J. E., Guay, W. R., Larcker, D. F. (2003), “Executive equity compensation andincentives: A survey,”Federal Reserve Bank of New York Economic Policy Review, 9,1, 27–50.
[22] Cotter, J., Shivdasani, A., Zenner, M. (1997), “Do independent directors enhance targetshareholder wealth during tender Offers? ” Journal of Financial Economics, 43, 2,195–218.
[23] Davidson III, W., Xie, B., Xu, W. (2004), “Market reaction to voluntary announce-ments of audit committee appointments: The effect of financial expertise,” Journal ofAccounting and Public Policy, 23, 4, 279–293.
[24] Dechow, P., Sloan, R., Sweeney, A. (1996), “Causes and consequences of earnings ma-nipulation: An analysis of firms subject to enforcement actions by the SEC,” Contem-porary Accounting Research, 13, 1, 1–36.
[25] DeFond, M., Hann, R., Hu, X. (2005), “Does the market value financial expertise onaudit committees of boards of directors,” Journal of Accounting Research, 43, 2, 154–194.
[26] DeMarzo, P., Duffie, D. (1991),” Corporate financial hedging with proprietary informa-tion,” Journal of Economic Theory, 53, 2, 261–286.
[27] DeMarzo, P., Duffie, D. (1995), “Corporate incentives for hedging and hedge account-ing,” Review of Financial Studies, 8, 3, 743–771.
[28] Dhaliwal, D., Naiker, V., Navissi, F. (2010), "The association between accruals qualityand the characteristics of accounting experts and mix of expertise on audit commit-tees." Contemporary Accounting Research, 27, 787–827.
[29] Dionne, G., Triki, T. (2013), “On risk management determinants: What really mat-ters?” European Journal of Finance, 19, 2, 145–164.
[30] Edmans, A., Gabaix, X. (2010), “The effect of risk on the CEO market-”working paper,New York University.
37

[31] Edwards, J. H., Edwards, A. W. F. (1984), “Approximating the tetrachoric correlationcoefficient, ” Biometrics, 40, 563.
[32] Falato, A., Kadyrzhanova, D., and Lel, U. (2014), “Distracted directors: Does boardbusyness hurt shareholder value?” Journal of Financial Economics, 113, 3, 404–426.
[33] Fama, E. (1980), “Agency problems and the theory of the firm,” Journal of PoliticalEconomy, 88, 2, 288–307.
[34] Fama, E., Jensen, M. (1983), “Separation of ownership and control,” Journal of Lawand Economics, 26, 2, 301–325.
[35] Fields, A., Keys, P. (2003), “The emergence of corporate governance from Wall St. toMain St: Outside directors, board diversity, earnings management and managerialincentives to bear risk,” Financial Review, 2003, 38, 1, 1–24.
[36] Fosberg, R. (1989), “Outside directors and managerial monitoring,” Akron Businessand Economic Review, 20, 2, 24–32.
[37] Froot, K., Scharfstein, D., Stein, J. (1993), “Risk management: Coordinating corporateinvestment and financing policies,” Journal of Finance, 48, 5, 1629–1658.
[38] Fryman, C., Jenter, D. (2010), “CEO Compensation” Annual Review of Financial Eco-nomics, 2, 1, 75–102.
[39] Graham, J., Rogers, D. (2002), “Do firms hedge in response to tax incentives?” Journalof Finance, 57, 2, 815–839.
[40] Graham, J., Smith, C. (1999), “Tax incentives to hedge,” Journal of Finance, 54, 6,2241–2262.
[41] Greene, W. (2004), “The behaviour of the maximum likelihood estimator of limiteddependent variable models in the presence of fixed effects,” Econometrics Journal, 7,1, 98–119.
[42] Guay W. R. (1999), “The sensitivity of CEO wealth to equity risk: An analysis of themagnitude and determinants,” Journal of Financial Economics, 53, 1, 43–71
[43] Guner, B., Malmendier, U., Tate, G. (2005), “The impact of boards with financial ex-pertise on corporate policies,” working paper, National Bureau of Economic Research.
[44] Harford, J. (2003), “Takeover bids and target director’s incentives: Retention, exper-tise and settling-up,” Journal of Financial Economics, 69, 1, 51–83.
[45] Haushalter, D. (2000), “Financing policy, basis risk, and corporate hedging: Evidencefrom oil and gas producers, ” Journal of Finance 55, 107–152.
[46] Hayes, R., Mehran, H., Schaefer, S. (2004a), “Board committee structures, ownershipand firm performance,” working paper, University of Chicago and Northwestern Uni-versity.
38

[47] Heckman, J. J. (1979), “Sample selection as a specification error, ” Econometrica, 47,153–161.
[48] Hermalin, B., Weisbach, M. (1991), “The effects of board composition and direct incen-tives on firm performance,” Financial Management, 20, 4, 101–112.
[49] Jin, Y., Jorion, P. (2006), “Firm value and hedging: Evidence from U.S. oil and gasproducers,” Journal of Finance, 66, 893–919.
[50] Kirkpatrick, G. (2009), “The corporate governance lessons from the financial crisis,”OECD Journal: Financial Market Trends, 2009, 1, 61–87.
[51] Klein, A. (1998), “Firm performance and board committee structure,” Journal of Lawand Economics, 41, 1, 275–302.
[52] Klein, A. (2002), “Audit committee, board of director characteristics, and earningsmanagement,” Journal of Accounting and Economics, 33, 3, 375–400.
[53] Kose, J., Senbet, L. (1998), “Corporate governance and board effectiveness,” Journalof Banking and Finance, 22, 4, 371–403.
[54] Lee, Y. S., Rosenstein, S., Wyatt, J. (1999), “The value of financial outside directors oncorporate boards,” International Review of Economics and Finance, 8, 4, 421–431.
[55] Maalaoui C., O., Dionne, G., François, P. "Detecting regime shifts in credit spreads,"Journal of Financial and Quantitative Analysis, Forthcoming.
[56] MacAvoy, P., Millstein, I. (1999), “The active board of directors and its effect on theperformance of the large publicly traded corporation,” Journal of Applied CorporateFinance, 11, 4, 8–20.
[57] Mardsen, A., Prevost, A. (2005), “Derivatives use, corporate governance, and legisla-tive change: An empirical analysis of New Zealand listed companies,” Journal of Busi-ness Finance and Accounting, 32, 1, 255–295.
[58] Mian, S. L. (1996), “Evidence on corporate hedging policy, ” Journal of Financial andQuantitative Analysis, 31, 419–439.
[59] Minton, B. A., Taillard, J. P. A., and Williamson, R., "Financial expertise of the board,risk taking, and performance: Evidence from bank holding companies," Journal ofFinancial and Quantitative Analysis, Forthcoming.
[60] Morellec, E., Smith, Jr., C. (2002), “Investment policy, financial policies, and the con-trol of the agency conflicts,” Working Paper No. FR 02-16, Bradley Policy ResearchCenter.
[61] Petersen, M., Thiagarajan, R. (2000), “Risk measurement and hedging: With andwithout derivatives,” Financial Management, 29, 4, 5–30.
[62] Rosen, R. (2003), “Risk management and corporate governance: The case of Enron,”Connecticut Law Review, 35, 1157–1184.
39

[63] Rosenstein, S., Wyatt, J. (1990), “Outside directors, board independence and share-holders wealth,” Journal of Financial Economics, 26, 2, 175–191.
[64] Sarbanes–Oxley Act, available at www.findlaw.com.
[65] Smith, C., Stulz, R. (1985), “The determinants of firms’ hedging policies,” Journal ofFinancial and Quantitative Analysis, 20, 4, 391–405.
[66] Stulz, R. (1984), “Optimal hedging policies,” Journal of Financial and QuantitativeAnalysis, 19, 2, 127–140.
[67] Stulz, R. (1990), “Managerial discretion and optimal financing policies,” Journal ofFinancial Economics, 26, 1, 3–28.
[68] Stulz, R. (2014), “Governance, risk management, and risk-taking in banks, ” workingpaper, National Bureau of Economic Research 20274.
[69] Tirole, J. (2006), The Theory of Corporate Finance, Princeton University Press.
[70] The final NYSE corporate governance rules, available at www.NYSE.com.
[71] Tufano, P. (1996), “Who manages risk? An empirical examination of risk managementpractices in the gold mining industry,” Journal of Finance, 51, 4, 1097–1137.
[72] Tufano, P. (1998), “The determinants of stock price exposure: Financial engineeringand the gold mining industry, ” Journal of Finance, 53, 1051–1052.
[73] Weisbach, M. (1988), “Outside directors and CEO turnover,” Journal of Financial Eco-nomics, 20, 1–2, 431–460.
[74] Whidbee, D., Wohar, M. (1999), “Derivative activities and managerial incentives inthe banking industry,” Journal of Corporate Finance, 5, 3, 251–276.
[75] Xie, B., Davidson III, W., DaDalt, P. (2003), “Earnings management and corporategovernance: The role of the board and the audit committee,” Journal of CorporateFinance, 9, 3, 295–316.
[76] Zellner, A., and Theil, H. (1962), ""Three-stage least squares: Simultaneous estima-tion of simultaneous equations," Econometrica, 30, 1, 54–78.
40

Table 1: Descriptive statistics.
This table reports summary statistics (number of observations, mean, median, standard deviation, minimum,and maximum) of all the variables in our analysis. The variable definitions are reported in Appendix A. Forthe hedge ratio, we report i) the continuous hedge ratio variable for all firms, ii) a dummy variable equal toone if the firm hedges and zero otherwise, and iii) a positive hedge ratio variable for firms that hedge.
Variables N Mean Median Std Dev. Min Max
Panel A: Dependent variables
Hedge_Ratio (all firms) 348 0.25 0.14 0.30 0.00 1.26Hedge_Ratio (a dummy ) 348 0.84 1.00 0.36 0.00 1.00Hedge_Ratio (firms that hedge) 294 0.30 0.17 0.30 0.00a 1.26
Panel B: General characteristics of the firms
Ln(size) 344 6.50 6.43 1.49 3.00 9.37Market_to_Book 344 1.76 1.64 0.92 0.42 6.00Leverage 343 0.49 0.30 0.57 0.00 3.64Quick_Ratio 348 3.03 2.08 2.63 0.01 13.50Dividend_Policy 348 0.76 1.00 0.43 0.00 1.00Tax_Save 348 0.14 0.05 0.26 0.00 2.18%_Inst 348 0.08 0.06 0.09 0.00 0.40%_Blockholders 348 0.18 0.11 0.26 0.00 0.91Exploration (×102) 348 0.36 0.24 0.99 0.00 17.39Cash_Cost 348 246.07 234.00 64.70 116.00 491.00Gold_Pr ice 348 335.75 333.65 42.25 280.45 394.90US_dummy 348 0.45 0.00 0.49 0.00 1.00
Panel C: Characteristics of directors and CEOs
CEO_Age 348 53.95 54.00 7.54 40.00 75.00CEO_Tenure 348 6.31 5.00 4.78 0.00 17.00CEO_COB 348 0.68 1.00 0.47 0.00 1.00CEO_Change 348 0.11 0.00 0.32 0.00 1.00CEO_CS 348 1.18 0.06 3.18 0.00 18.01V alCEO_Op 348 1.70 0.00 6.72 0.00 43.81V alAll_Op 344 1.38 0.58 2.17 0.00 9.26Cash_Fee_Outsiders 348 0.63 0.72 0.36 0.00 1.10Annual_Fixed_Fee 348 11.69 8.00 11.45 0.00 50.00CEO_Bachelor 348 0.15 0.00 0.35 0.00 1.00CEO_High_Edu 348 0.07 0.00 0.25 0.00 1.00
a Specifically, the minimum value for positive hedge ratios is 0.008.
41

Table 1 (continued)
Variables N Mean Median Std. Dev. Min Max
Panel D: Characteristics and financial background of directors on the audit committee
Min_size 348 0.91 1.00 0.29 0.00 1.00Tot_indep 348 0.53 1.00 0.50 0.00 1.00One_Acc 345 0.42 0.00 0.49 0.00 1.00One_Fin_know 348 0.89 1.00 0.30 0.00 1.00One_Act_Edu_Acc 348 0.32 0.00 0.47 0.00 1.00One_Act_Edu_NotAcc 348 0.24 0.00 0.43 0.00 1.00One_Act_NotEdu_NotAcc 348 0.42 0.00 0.49 0.00 1.00One_NotAct_Edu_Acc 348 0.22 0.00 0.41 0.00 1.00One_NotAct_Edu_NotAcc 348 0.39 0.00 0.49 0.00 1.00%_Act_Edu_Acc 345 0.12 0.00 0.19 0.00 0.67%_Act_Edu_NotAcc 345 0.11 0.00 0.23 0.00 1.00%_Act_NotEdu_NotAcc 345 0.14 0.00 0.18 0.00 0.50%_NotAct_Edu_Acc 345 0.07 0.00 0.14 0.00 0.50%_NotAct_Edu_NotAcc 345 0.14 0.00 0.21 0.00 1.00%_Bachelor 325 0.62 0.67 0.28 0.00 1.00%_High_Edu 345 0.16 0.00 0.24 0.00 1.00%_Acc 348 0.19 0.00 0.25 0.00 1.00All_Fin_know 348 0.29 0.00 0.45 0.00 1.00Num_High_Edu 348 0.50 0.00 0.73 0.00 3.00
Panel E: Characteristics and financial background of Directors on the board
Maj_Indep_Bor 348 0.75 1.00 0.44 0.00 1.00%_Indep 348 0.61 0.60 0.19 0.14 1.00%_Act 348 0.26 0.24 0.15 0.00 0.71%_Act_Edu_Acc 345 0.12 0.00 0.19 0.00 0.67%_Act_Edu_NotAcc 345 0.11 0.00 0.23 0.00 1.00%_Act_NotEdu_NotAcc 345 0.07 0.00 0.14 0.00 0.50%_NotAct_Edu_Acc 345 0.14 0.00 0.21 0.00 1.00%_NotAct_Edu_NotAcc 348 0.11 0.09 0.12 0.00 0.44%_Bachelor 325 0.61 0.60 0.17 0.29 1.00%_High_Edu 348 0.13 0.08 0.16 0.00 0.71One_Acc 348 0.71 1.00 0.45 0.00 1.00%_Acc 348 0.13 0.13 0.11 0.00 0.43Num_High_Edu 348 1.19 1.00 1.39 0.00 6.00
42
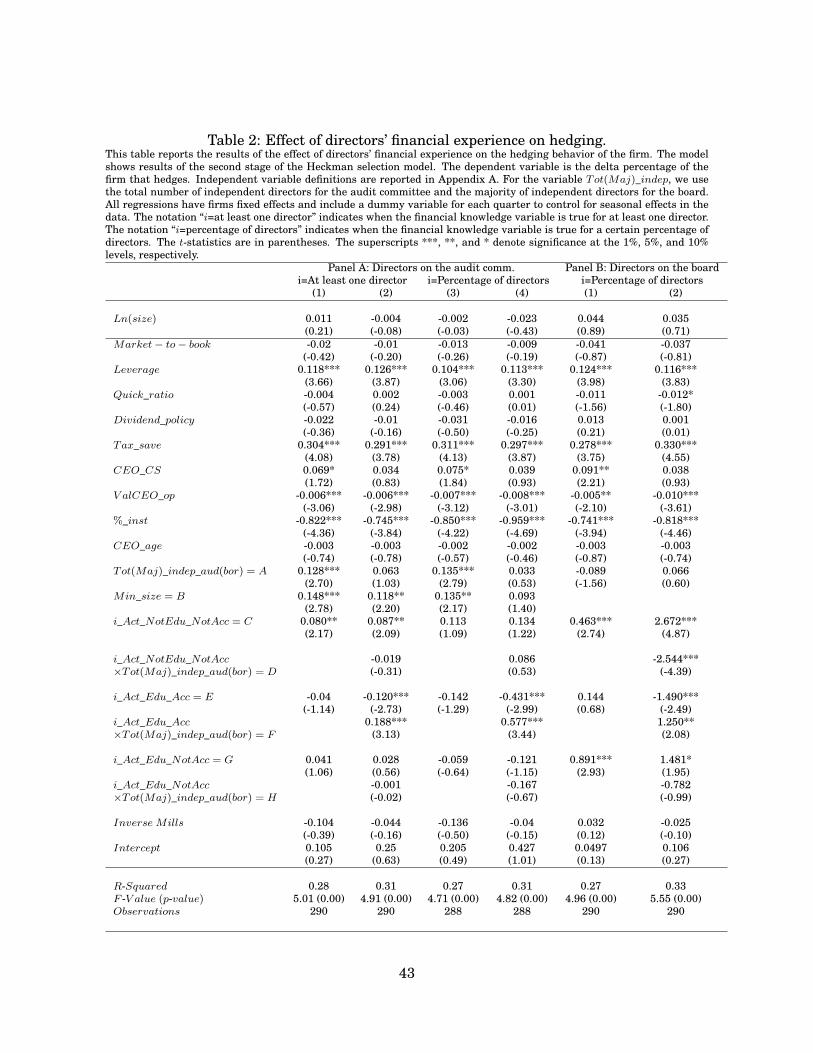
Table 2: Effect of directors’ financial experience on hedging.This table reports the results of the effect of directors’ financial experience on the hedging behavior of the firm. The modelshows results of the second stage of the Heckman selection model. The dependent variable is the delta percentage of thefirm that hedges. Independent variable definitions are reported in Appendix A. For the variable Tot(Maj)_indep, we usethe total number of independent directors for the audit committee and the majority of independent directors for the board.All regressions have firms fixed effects and include a dummy variable for each quarter to control for seasonal effects in thedata. The notation “i=at least one director” indicates when the financial knowledge variable is true for at least one director.The notation “i=percentage of directors” indicates when the financial knowledge variable is true for a certain percentage ofdirectors. The t-statistics are in parentheses. The superscripts ***, **, and * denote significance at the 1%, 5%, and 10%levels, respectively.
Panel A: Directors on the audit comm. Panel B: Directors on the boardi=At least one director i=Percentage of directors i=Percentage of directors
(1) (2) (3) (4) (1) (2)
Ln(size) 0.011 -0.004 -0.002 -0.023 0.044 0.035(0.21) (-0.08) (-0.03) (-0.43) (0.89) (0.71)
Market− to− book -0.02 -0.01 -0.013 -0.009 -0.041 -0.037(-0.42) (-0.20) (-0.26) (-0.19) (-0.87) (-0.81)
Leverage 0.118*** 0.126*** 0.104*** 0.113*** 0.124*** 0.116***(3.66) (3.87) (3.06) (3.30) (3.98) (3.83)
Quick_ratio -0.004 0.002 -0.003 0.001 -0.011 -0.012*(-0.57) (0.24) (-0.46) (0.01) (-1.56) (-1.80)
Dividend_policy -0.022 -0.01 -0.031 -0.016 0.013 0.001(-0.36) (-0.16) (-0.50) (-0.25) (0.21) (0.01)
Tax_save 0.304*** 0.291*** 0.311*** 0.297*** 0.278*** 0.330***(4.08) (3.78) (4.13) (3.87) (3.75) (4.55)
CEO_CS 0.069* 0.034 0.075* 0.039 0.091** 0.038(1.72) (0.83) (1.84) (0.93) (2.21) (0.93)
V alCEO_op -0.006*** -0.006*** -0.007*** -0.008*** -0.005** -0.010***(-3.06) (-2.98) (-3.12) (-3.01) (-2.10) (-3.61)
%_inst -0.822*** -0.745*** -0.850*** -0.959*** -0.741*** -0.818***(-4.36) (-3.84) (-4.22) (-4.69) (-3.94) (-4.46)
CEO_age -0.003 -0.003 -0.002 -0.002 -0.003 -0.003(-0.74) (-0.78) (-0.57) (-0.46) (-0.87) (-0.74)
Tot(Maj)_indep_aud(bor) = A 0.128*** 0.063 0.135*** 0.033 -0.089 0.066(2.70) (1.03) (2.79) (0.53) (-1.56) (0.60)
Min_size = B 0.148*** 0.118** 0.135** 0.093(2.78) (2.20) (2.17) (1.40)
i_Act_NotEdu_NotAcc = C 0.080** 0.087** 0.113 0.134 0.463*** 2.672***(2.17) (2.09) (1.09) (1.22) (2.74) (4.87)
i_Act_NotEdu_NotAcc -0.019 0.086 -2.544***×Tot(Maj)_indep_aud(bor) = D (-0.31) (0.53) (-4.39)
i_Act_Edu_Acc = E -0.04 -0.120*** -0.142 -0.431*** 0.144 -1.490***(-1.14) (-2.73) (-1.29) (-2.99) (0.68) (-2.49)
i_Act_Edu_Acc 0.188*** 0.577*** 1.250**×Tot(Maj)_indep_aud(bor) = F (3.13) (3.44) (2.08)
i_Act_Edu_NotAcc = G 0.041 0.028 -0.059 -0.121 0.891*** 1.481*(1.06) (0.56) (-0.64) (-1.15) (2.93) (1.95)
i_Act_Edu_NotAcc -0.001 -0.167 -0.782×Tot(Maj)_indep_aud(bor) = H (-0.02) (-0.67) (-0.99)
Inverse Mills -0.104 -0.044 -0.136 -0.04 0.032 -0.025(-0.39) (-0.16) (-0.50) (-0.15) (0.12) (-0.10)
Intercept 0.105 0.25 0.205 0.427 0.0497 0.106(0.27) (0.63) (0.49) (1.01) (0.13) (0.27)
R-Squared 0.28 0.31 0.27 0.31 0.27 0.33F -V alue (p-value) 5.01 (0.00) 4.91 (0.00) 4.71 (0.00) 4.82 (0.00) 4.96 (0.00) 5.55 (0.00)Observations 290 290 288 288 290 290
43

Table 3: Effect of directors’ educational background on hedging.This table reports the results of the effect of directors’ educational background on the hedging behavior of the firm. Themodel shows partial results of the second stage of the Heckman selection model (the complete results of the first and secondstages are reported in Appendix E). The dependent variable is the delta percentage of the firm that hedges. Independentvariable definitions are reported in Appendix A. For the variable Tot(Maj)_indep, we use the total number of independentdirectors for the audit committee and the majority of independent directors for the board. All regressions have firm fixedeffects and include a dummy variable for each quarter to control for seasonal effects in the data. The notation “i=at leastone director” indicates when the financial knowledge variable is true for at least one director. The notation “i=percentage ofdirectors” indicates when the financial knowledge variable is true for a certain percentage of directors. The t-statistics arein parentheses. The superscripts ***, **, and * denote significance at the 1%, 5%, and 10% levels, respectively.
Panel A : Directors on the audit committee Panel B : Directors on the boardi=At least one director i=Percentage of directors i=Percentage of directors
(1) (2) (3) (4) (1) (2)
Tot(Maj)_indep = A 0.120*** -0.048 0.139*** 0.018 -0.005 -0.189(2.56) (-0.84) (2.87) (0.28) (-0.10) (-1.53)
Min_size = B 0.185*** 0.134*** 0.170*** 0.178***(3.47) (2.53) (2.54) (2.46)
i_NotAct_Edu_NotAcc = C -0.134*** -0.255*** -0.201* -0.526*** 0.119 -0.659(-3.41) (-4.92) (-1.73) (-3.59) (0.52) (-1.37)
i_NotAct_Edu_NotAcc 0.217*** 0.254 1.004**×Tot(Maj)_indep = D (3.14) (1.13) (2.09)
i_NotAct_Edu_Acc = E -0.029 -0.063 -0.059 -0.442*** 0.525** 1.511***(-0.85) (-1.54) (-0.57) (-3.02) (2.08) (2.49)
i_NotAct_Edu_Acc 0.075 0.542*** -0.730×Tot(Maj)_indep = F (1.18) (2.47) (-1.10)
i_Act_Edu_NotAcc = G -0.006 0.011 -0.055 0.018 1.049*** 0.300(-0.17) (0.26) (-0.61) (0.16) (2.73) (0.39)
i_Act_Edu_NotAcc -0.013 -0.413 1.227*×Tot(Maj)_indep = H (-0.17) (-1.49) (1.67)
i_Act_Edu_Acc = I -0.078** -0.130*** -0.222** -0.611*** <0.000 0.537(-2.26) (-3.09) (-2.01) (-3.99) (0.00) (1.05)
i_Act_Edu_Acc = J 0.182*** 0.598*** -0.739×Tot(Maj)_indep (3.14) (3.60) (-1.40)
Inverse Mills -0.068 -0.043 -0.110 -0.086 0.008 0.028(-0.25) (-0.16) (-0.40) (-0.32) (0.11) (0.34)
Controls & Intercept Yes Yes Yes Yes Yes Yes
R-Squared 0.31 0.37 0.28 0.35 0.26 0.30F -value (p-value) 5.30 (0.00) 5.77 (0.00) 4.59 (0.00) 5.18 (0.00) 4.48 (0.00) 4.46 (0.00)Observations 290 290 288 288 290 290
44

Table 4: Effect of governance indexes on hedging activities.
We report the results of the effect of director quality on firm hedging behavior. Director quality is measured bytwo indexes: gov_index_board (for the board) and gov_index_audit (for the audit committee). The constructionof both indexes is detailed in Appendix F. The table reports the partial results of the multivariate regressions(Panel A), along with the partial results of the second stage of the Heckman selection model (Panel B). Thecomplete results of all the models are reported in Appendix E-3. The dependent variable is the delta percentageof the firm that hedges in Panel A. In Panel B, we report the results of the second stage of a Heckman two-stage model in which the dependent variable is the intensity of the hedge. Independent variable definitionsare reported in Appendix A. All the regressions have firm fixed effects and include a dummy variable for eachquarter to control for seasonal effects in the data. The t-statistics are in parentheses. The superscripts ***, **,and * denote significance at the 1%, 5%, and 10% levels, respectively.
Panel A: Multivariate regression Panel B: Heckman second-stage regression
(1) (2) (3) (1) (2) (3)
Gov_index_audit 0.043*** 0.041*** 0.053*** 0.051***(2.95) (2.83) (3.31) (3.21)
Gov_index_board 0.023** 0.021* 0.025*** 0.023**(2.11) (1.94) (2.40) (2.27)
Inverse Mills -0.285 -0.098 -0.259(-1.06) (-0.37) (-0.97)
Controls & Intercept Yes Yes Yes Yes Yes Yes
R− Squared 0.22 0.21 0.23 0.26 0.24 0.27F -Value (p-value) 5.78 (0.00) 5.40 (0.00) 5.70 (0.00) 5.59 (0.00) 5.15 (0.00) 5.66 (0.00)Observations 342 342 342 290 290 290
45

Table 5: Simultaneous estimation of hedging and firm performance.
This table reports the results of the effect of having qualified directors sitting on the board and the auditcommittee on the hedging behavior and performance of the firm. We consider the simultaneous estimation ofhedging and firm performance to account for endogeneity between the two variables. The system is based onZellner’s SURE combined with a two-stage least squares estimation for each equation. The return on equity(ROE) and return on assets (ROA) measure the firm’s accounting performance. Tobin’s Q (Tobin’s Q) and themarket-to-book (MB) measure firm market performance. Panel A reports estimates of the hedge ratio equationand Panel B reports estimates of the firm performance equation. Independent variable definitions are reportedin Appendix A. All the regressions have firm fixed effects and include a dummy variable for each quarter tocontrol for seasonal effects in the data. The t-statistics are in parentheses. The superscripts ***, **, and *denote significance at the 1%, 5%, and 10% levels, respectively.
ROE ROA Tobin’s Q MB
Panel A: The hedge ratio is the dependent variable
Firm_performance 0.183 0.181 -0.015 -0.009(1.01) (0.45) (-0.33) (-0.20)
Ln(size) 0.121*** 0.122*** 0.105*** 0.102***(3.09) (2.90) (2.44) (2.36)
Market_to_book -0.035* -0.038**(-1.76) (-1.97)
Leverage 0.102*** 0.099*** 0.081*** 0.080***(3.18) (2.46) (2.92) (2.89)
Quick_ratio -0.003 -0.005 -0.004 -0.004(-0.62) (-1.00) (-0.86) (-0.86)
Dividend_policy -0.001 -0.004 -0.008 -0.007(-0.02) (-0.15) (-0.30) (-0.29)
Tax_save 0.172*** 0.186*** 0.173*** 0.173***(3.85) (4.18) (4.01) (4.04)
CEO_CS 0.089*** 0.101*** 0.114*** 0.112***(2.48) (2.87) (2.96) (2.96)
V alCEO_op -0.006*** -0.006*** -0.008*** -0.008***(-3.02) (-2.93) (-3.540 (-3.58)
%_inst -0.556*** -0.603*** -0.591*** -0.588***(-3.71) (-4.11) (-4.04) (-4.03)
CEO_age 0.002 0.001 0.001 0.001(0.74) (0.68) (0.54) (0.54)
US_dummy 1.965*** -0.414 -0.307 -0.289(2.90) (-1.51) (-0.98) (-0.93)
Gov_index_audit 0.041*** 0.043*** 0.050*** 0.050***(3.24) (3.39) (3.76) (3.88)
Gov_index_board 0.018* 0.020** 0.019* 0.019*(1.77) (2.14) (1.87) (1.89)
Gold_price -0.001* -0.001* -0.001 -0.00071(-1.74) (-1.67) (-1.40) (-1.52)
Intercept -2.340*** -0.502 -0.425 -0.406(-3.29) (-1.60) (-1.21) (-1.16)
Chi-2 (p-value) 1293.52 (0.00) 2514.96 (0.00) 2544.04 (0.00) 2551.75 (0.00)Observations 339 341 341 342
46

Table 5 (Continued)
ROE ROA Tobin’s Q MB
Panel B: Firm performance is the dependent variable
Hedge_ratio 0.625*** 0.259*** 0.848** 0.822**(2.40) (2.73) (2.03) (2.00)
Ln(size) -0.083 -0.070*** 0.370*** 0.384***(-1.08) (-2.51) (3.26) (3.44)
Market_to_book -0.024 <0.001(-0.62) (0.01)
Leverage -0.130*** -0.094*** 0.132 0.140*(-2.37) (-4.74) (1.60) (1.72)
Quick_ratio -0.008 0.001 -0.007 -0.008(-0.82) (0.17) (-0.45) (-0.57)
Dividend_policy -0.029 -0.002 0.118 0.088(-0.61) (-0.12) (1.64) (1.26)
Exploration 1.312 -1.578*** 0.407 0.050(1.00) (-3.20) (0.19) (0.02)
Cash_ cos t <0.001 <0.001 -0.002*** -0.002***(-1.32) (-1.07) (-3.73) (-3.31)
%_inst -0.138 0.118 -1.631*** -1.624***(-0.42) (0.99) (-3.24) (-3.28)
%_blockholders 0.490 0.129 3.332*** 3.415***(1.58) (1.20) (6.84) (7.13)
Maj_indep_bor -0.058 0.001 -0.174* -0.197*(-0.87) (0.04) (-1.65) (-1.92)
CEO_age -0.007 -0.001 -0.006 -0.006(-1.33) (-0.54) (-0.79) (-0.75)
CEO_change 0.022 0.032 -0.151 -0.148(0.30) (1.25) (-1.32) (-1.32)
CEO_COB 0.010 0.001 0.022* 0.019(1.16) (0.41) (1.69) (1.44)
CEO_tenure -0.029 0.004 -0.203** -0.215**(-0.49) (0.19) (-2.12) (-2.31)
US_dummy -1.546*** 0.223 0.204 0.833(-3.61) (1.16) (0.31) (1.28)
Gold_price 0.002*** <0.001 0.010*** 0.010***(2.35) (1.07) (11.26) (11.13)
Intercept 1.862*** 0.260 -3.954*** -4.618***(3.24) (1.38) (-4.62) (-5.48)
Chi-2 (p-value) 152.49 (0.00) 123.32 (0.00) 1780.99 (0.00) 1737.57 (0.00)Observations 339 341 341 342
47
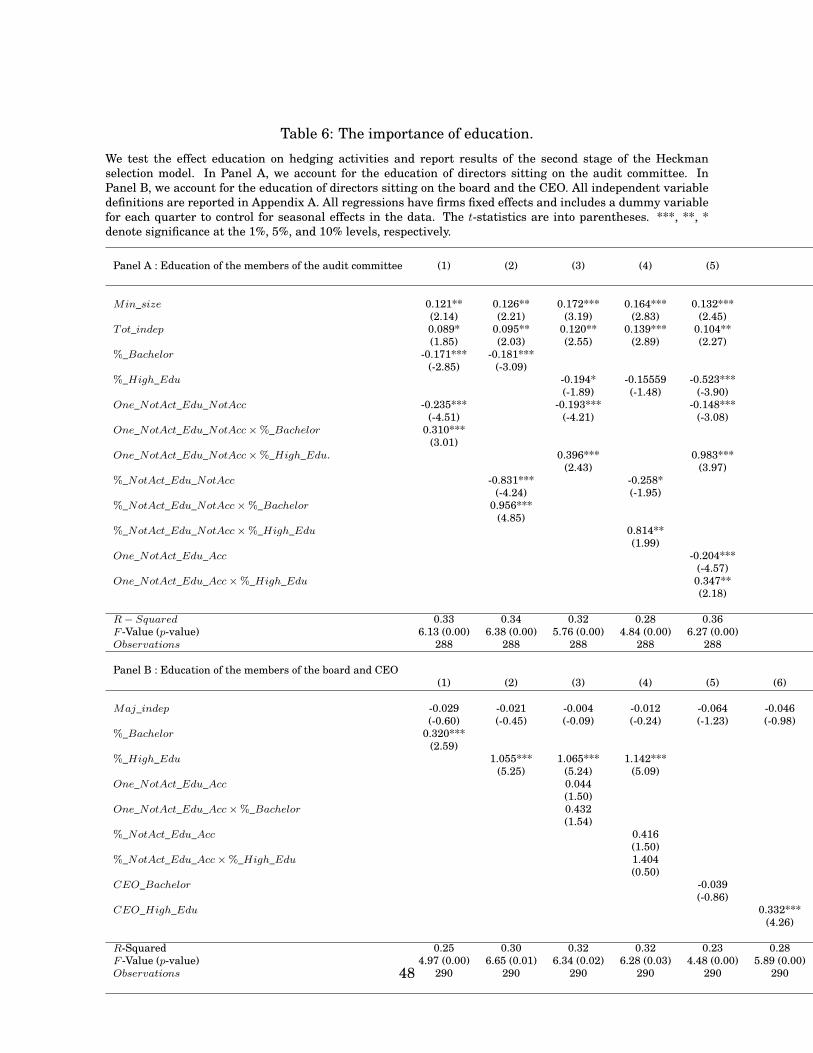
Table 6: The importance of education.
We test the effect education on hedging activities and report results of the second stage of the Heckmanselection model. In Panel A, we account for the education of directors sitting on the audit committee. InPanel B, we account for the education of directors sitting on the board and the CEO. All independent variabledefinitions are reported in Appendix A. All regressions have firms fixed effects and includes a dummy variablefor each quarter to control for seasonal effects in the data. The t-statistics are into parentheses. ***, **, *denote significance at the 1%, 5%, and 10% levels, respectively.
Panel A : Education of the members of the audit committee (1) (2) (3) (4) (5)
Min_size 0.121** 0.126** 0.172*** 0.164*** 0.132***(2.14) (2.21) (3.19) (2.83) (2.45)
Tot_indep 0.089* 0.095** 0.120** 0.139*** 0.104**(1.85) (2.03) (2.55) (2.89) (2.27)
%_Bachelor -0.171*** -0.181***(-2.85) (-3.09)
%_High_Edu -0.194* -0.15559 -0.523***(-1.89) (-1.48) (-3.90)
One_NotAct_Edu_NotAcc -0.235*** -0.193*** -0.148***(-4.51) (-4.21) (-3.08)
One_NotAct_Edu_NotAcc×%_Bachelor 0.310***(3.01)
One_NotAct_Edu_NotAcc×%_High_Edu. 0.396*** 0.983***(2.43) (3.97)
%_NotAct_Edu_NotAcc -0.831*** -0.258*(-4.24) (-1.95)
%_NotAct_Edu_NotAcc×%_Bachelor 0.956***(4.85)
%_NotAct_Edu_NotAcc×%_High_Edu 0.814**(1.99)
One_NotAct_Edu_Acc -0.204***(-4.57)
One_NotAct_Edu_Acc×%_High_Edu 0.347**(2.18)
R− Squared 0.33 0.34 0.32 0.28 0.36F -Value (p-value) 6.13 (0.00) 6.38 (0.00) 5.76 (0.00) 4.84 (0.00) 6.27 (0.00)Observations 288 288 288 288 288
Panel B : Education of the members of the board and CEO(1) (2) (3) (4) (5) (6)
Maj_indep -0.029 -0.021 -0.004 -0.012 -0.064 -0.046(-0.60) (-0.45) (-0.09) (-0.24) (-1.23) (-0.98)
%_Bachelor 0.320***(2.59)
%_High_Edu 1.055*** 1.065*** 1.142***(5.25) (5.24) (5.09)
One_NotAct_Edu_Acc 0.044(1.50)
One_NotAct_Edu_Acc×%_Bachelor 0.432(1.54)
%_NotAct_Edu_Acc 0.416(1.50)
%_NotAct_Edu_Acc×%_High_Edu 1.404(0.50)
CEO_Bachelor -0.039(-0.86)
CEO_High_Edu 0.332***(4.26)
R-Squared 0.25 0.30 0.32 0.32 0.23 0.28F -Value (p-value) 4.97 (0.00) 6.65 (0.01) 6.34 (0.02) 6.28 (0.03) 4.48 (0.00) 5.89 (0.00)Observations 290 290 290 290 290 29048

Table 7: Simultaneous effects between hedging and high levels of education.
This table reports the results of the simultaneous estimation of hedging and directors’ high levels of educationto account for the endogeneity between the two variables. The system is based on Zellner’s seemingly unrelatedregression estimation (SURE) combined with a two-stage least squares estimation for each equation. PanelA reports estimates of the hedge ratio equation and Panel B reports estimates of the equation for directors’high levels of education. Independent variable definitions are reported in Appendix A. All regressions havefirm fixed effects and include a dummy variable for each quarter to control for seasonal effects in the data.The t-statistics are in parentheses. The superscripts ***, **, and * denote significance at the 1%, 5%, and 10%levels, respectively.
Panel A: The hedge ratio is the dependent variable Panel B: The high level of education is the dependent variable
Audit Board Audit Board
High_Edu -0.039 0.186*** Hedge_ratio 1.114*** 1.639***(-0.39) (2.62) (3.93) (3.98)
ln(size) 0.110*** 0.156*** ln(size) -0.448*** -0.362***(2.62) (3.72) (-4.95) (-2.47)
Market_to_book -0.048*** -0.025 Market_to_book 0.263*** -0.064(-2.36) (-0.91) (4.83) (-0.73)
Leverage 0.105*** 0.084*** %_inst -0.118 0.208(3.27) (3.13) (-0.31) (0.32)
Quick_ratio -0.004 -0.007* Cash_fee_outsiders <0.001 -0.001**(-0.86) (-1.37) (-1.45) (-2.32)
Dividend_policy -0.018 -0.005 Annual_fixed_fee 0.001*** 0.001*(-0.73) (-0.23) (3.49) (1.72)
Taxe_save 0.157*** 0.212*** CEO_tenure -0.020*** 0.005(3.75) (4.25) (-2.50) (0.43)
CEO_CS 0.105*** 0.082 Average_tenure -0.020 0.031(2.42) (1.53) (-1.23) (0.50)
V alCEO_op -0.006*** -0.005*** Average_age 0.002 0.004(-3.07) (-2.68) (0.19) (0.10)
%_inst -0.571*** -0.515*** V alAll_opt 0.001 -0.001(-3.72) (-2.35) (1.10) (-1.24)
CEO_age <0.001 <0.001 Intercept 0.275 2.68*(-0.08) (-0.03) (0.24) (1.74)
US_dummy -0.868*** 0.403(2.78) (0.89)
Gov_index_aud 0.072***(3.50)
Gov_index_bor 0.023**(2.08)
Gold_price <-0.001 <-0.001(-0.07) (-0.07)
Intercept 0.126 -1.213(0.290) (-2.12)
Chi-2 (p-value) 1266.97 (0.00) 1154.23 (0.00) 1583.15 (0.00) 3540.68 (0.00)Observations 336 321 336 321
49

Table 8: Effect of the SOX and NYSE regulations on hedging.This table reports the results of the second stage of the Heckman two-stage selection model. The dependent variable isthe intensity of hedging (positive hedge ratios). Independent variables include four compliance indexes to SOX and NYSEregulations, explained in Appendix F. Other variable definitions are reported in Appendix A. All the regressions have firmfixed effects and include a dummy variable for each quarter to control for seasonal effects in the data. The t-statistics are inparentheses. The superscripts ***, **, and * denote significance at the 1%, 5%, and 10% levels, respectively.
Compliance with SOX Compliance with NYSE Compliance with SOX and NYSE
(1) (2) (3) (4) (5) (6) (7) (8) (9)
Ln(size) 0.016 0.015 0.003 0.042 0.041 0.049 0.009 0.047 0.026(0.31) (0.29) (0.06) (0.85) (0.80) (0.95) (0.17) (0.92) (0.51)
Market_to_Book -0.019 -0.020 -0.019 -0.038 -0.042 -0.030 -0.017 -0.035 -0.026(-0.40) (-0.42) (-0.41) (-0.80) (-0.88) (-0.64) (-0.36) (-0.73) (-0.55)
Leverage 0.092*** 0.092*** 0.088*** 0.118*** 0.098*** 0.106*** 0.102*** 0.109*** 0.114***(2.96) (2.96) (2.91) (3.69) (3.21) (3.51) (3.15) (3.67) (3.86)
Quick_Ratio -0.001 -0.002 -0.001 -0.007 -0.006 -0.005 -0.002 -0.006 -0.002(-0.21) (-0.24) (-0.09) (-1.05) (-0.92) (-0.70) (-0.26) (-0.81) (-0.35)
Dividend_Policy -0.024 -0.024 -0.017 -0.007 -0.008 -0.017 -0.016 -0.018 -0.032(-0.39) (-0.38) (-0.28) (-0.11) (-0.13) (-0.27) (-0.25) (-0.28) (-0.52)
Tax_Save 0.281*** 0.280*** 0.281*** 0.279*** 0.272*** 0.275*** 0.291*** 0.276*** 0.281***(3.74) (3.74) (3.78) (3.71) (3.60) (3.64) (3.92) (3.64) (3.74)
CEO_CS 0.079** 0.079** 0.077* 0.092** 0.089** 0.084** 0.083** 0.088** 0.084**(1.99) (2.00) (1.95) (2.31) (2.24) (2.10) (2.11) (2.20) (2.11)
V alCEO_Op -0.007*** -0.007*** -0.007*** -0.006*** -0.006*** -0.007*** -0.006*** -0.007*** -0.007***(-3.20) (-3.20) (-3.18) (-2.57) (-3.06) (-3.22) (-2.40) (-3.14) (-3.22)
%_Inst -0.641*** -0.638*** -0.654*** -0.750*** -0.689*** -0.623*** -0.791*** -0.642*** -0.522***(-3.51) (-3.50) (-3.62) (-4.02) (-3.69) (-3.40) (-4.27) (-3.44) (-2.76)
CEO_Age -0.001 -0.001 -0.002 -0.001 -0.001 0.000 -0.003 -0.001 -0.001(-0.41) (-0.43) (-0.49) (-0.20) (-0.34) (-0.12) (-0.75) (-0.13) (-0.12)
Tot_Indep_Aud 0.092** 0.138***(2.00) (2.88)
One_Fin_Exp_Aud 0.054 0.007(0.42) (0.05)
Compliance_SOX1 0.088**(2.01)
Compliance_SOX2 0.153***(2.95)
Maj_Indep_Bor -0.046 -0.060(-0.95) (-1.19)
Min_ Si ze_Aud 0.090* 0.142***(1.72) (2.59)
All_Fin_Exp_Aud -0.042 -0.040(-1.26) (-1.20)
One_Acc_Aud -0.084* -0.076*(-1.80) (-1.65)
Compliance_NY SE1 -0.037*(-1.68)
Compliance_NY SE2 -0.036(-0.68)
Compliance_SOX_NY SE1 -0.013(-0.62)
Compliance_SOX_NY SE2 0.086*(1.93)
Inverse Mills -0.119 -0.116 -0.082 -0.032 -0.040 -0.093 -0.067 -0.092 -0.167(-0.44) (-0.43) (-0.31) (-0.12) (-0.15) (-0.34) (-0.25) (-0.34) (-0.62)
Intercept 0.138 0.120 0.250 -0.002 0.144 -0.032 0.203 0.031 0.116(0.35) (0.31) (0.65) (-0.01) (0.37) (-0.08) (0.50) (0.08) (0.30)
Adj R-Squared 0.23 0.23 0.25 0.25 0.23 0.22 0.28 0.22 0.23F -Value (p-value) 4.68 (0.00) 5.00 (0.00) 5.40 (0.00) 4.57 (0.00) 4.90 (0.00) 4.69 (0.00) 4.64 (0.00) 4.69 (0.00) 4.97 (0.00)Observations 290 290 290 290 290 290 290 290 290
50

Table 9: Simultaneous estimation of hedging and firm performance under SOX and NYSEregulations.
This table reports the results of the simultaneous estimation of hedging and firm performance to accountfor the endogeneity between the two variables. The system is based on Zellner’s SURE combined with atwo-stage least squares estimation for each equation. The return on equity (ROE) and the return on assets(ROA) measure firm accounting performance. The Tobin’s Q (Tobin’s Q) and the market-to-book (MB) measurethe firm’s market performance. Panel A reports estimates of the hedge ratio equation and Panel B reportsestimates of the firm performance equation. Independent variable definitions are reported in Appendix A.All regressions have firm fixed effects and include a dummy variable for each quarter to control for seasonaleffects in the data. The t-statistics are in parentheses. The superscripts ***, **, and * denote significance atthe 1%, 5%, and 10% levels, respectively.
ROE ROA Tobin’s Q MB
Panel A: The hedge ratio is the dependent variable
Firm_performance -0.165 -0.346 -0.059 -0.054(-0.79) (-0.74) (-1.30) (-1.22)
Ln(size) 0.091** 0.082* 0.107*** 0.105***(2.17) (1.91) (2.36) (2.33)
Market_to_book -0.043** -0.040**(-2.07) (-2.08)
Leverage 0.065* 0.056 0.082*** 0.082***(1.92) (1.31) (2.91) (2.91)
Quick_ratio -0.007 -0.006 -0.004 -0.004(-1.09) (-1.05) (-0.83) (-0.82)
Dividend_policy -0.009 -0.003 0.002 0.000(-0.29) (-0.12) (0.06) (0.00)
Tax_save 0.200*** 0.209*** 0.185*** 0.185***(4.04) (4.27) (4.12) (4.18)
CEO_CS 0.089** 0.092** 0.095*** 0.094***(2.16) (2.29) (2.34) (2.35)
V alCEO_op -0.007*** -0.006*** -0.007*** -0.007***(-3.05) (-2.98) (-3.14) (-3.19)
%_inst -0.765*** -0.726*** -0.735*** -0.736***(-4.85) (-4.92) (-4.95) (-4.99)
CEO_age <-0.000 <-0.000 <-0.000 <-0.000(-0.18) (-0.05) (-0.08) (-0.10)
US_dummy -1.007** -0.403 2.051*** 2.093***(-2.39) (-1.14) (2.64) (2.72)
Compliance_SOX1 0.092** 0.093** 0.101*** 0.106***(2.03) (2.22) (2.43) (2.57)
Compliance_NY SE1 -0.029 -0.024 -0.024 -0.025(-1.50) (-1.35) (-1.37) (-1.41)
Gold_price 0.000 -0.000 0.000 0.000(0.20) (-0.29) (0.22) (0.17)
Intercept 0.526 -0.154 -2.376*** -2.374***(0.94) (-0.32) (-2.81) (-2.83)
Chi-2 (p-value) 1164.44 (0.00) 2527.50 (0.00) 1285.65 (0.00) 1306.33 (0.00)Observations 339 341 341 342
51

Table 9 (Continued)
ROE ROA Tobin’s Q MB
Panel B: The firm performance is the dependent variable
Hedge_ratio 0.219 0.057 0.567 0.563(0.77) (0.63) (1.40) (1.42)
Ln(size) -0.034 -0.030 0.346*** 0.363***(-0.44) (-1.33) (3.63) (3.88)
Market_to_book -0.036 -0.006(-0.95) (-0.48)
Leverage -0.100* -0.068*** 0.108 0.120*(-1.84) (-4.21) (1.56) (1.76)
Quick_ratio -0.009 -0.000 -0.007 -0.009(-1.04) (-0.08) (-0.53) (-0.65)
Dividend_policy -0.021 0.000 0.121* 0.091(-0.47) (0.02) (1.73) (1.34)
Exploration 1.630 -1.644*** 0.536 0.201(1.17) (-3.39) (0.25) (0.09)
Cash_ cos t -0.001 -0.000 -0.002*** -0.002***(-1.42) (-0.83) (-3.65) (-3.26)
%_inst -0.325 -0.005 -1.597*** -1.616***(-0.98) (-0.04) (-3.44) (-3.54)
%_bockholders 0.419 0.072 3.261*** 3.367***(1.29) (0.65) (6.86) (7.21)
Tot_indep_aud -0.041 0.003 -0.106 -0.127(-0.59) (0.13) (-1.05) (-1.30)
CEO_age -0.007 -0.002 -0.003 -0.003(-1.31) (-1.10) (-0.42) (-0.41)
CEO_COB 0.015 0.017 -0.139 -0.143(0.20) (0.69) (-1.23) (-1.29)
CEO_tenure 0.013 0.003 0.022* 0.019(1.48) (1.04) (1.69) (1.49)
CEO_change 0.017 0.002 -0.141 -0.158*(0.27) (0.10) (-1.55) (-1.78)
US_dummy -0.365 -0.023 -2.677*** -2.824***(-1.12) (-0.22) (-5.81) (-6.24)
Gold_price 0.001** 0.001 0.010*** 0.010***(2.17) (0.89) (11.06) (10.99)
Intercept 0.424 0.275* -3.300*** -3.277***(0.85) (1.80) (-5.15) (-5.21)
Chi-2 (p-value) 155.50 (0.00) 110.43 (0.00) 1881.04 (0.00) 1838.72 (0.00)Observations 339 341 341 342
52

Table 10: Educated hedging following shocks to the gold price.This table reports the results on the relation between educated hedging and shocks to the gold price. We model gold priceshocks using the regime shift detection of significant changes (two standard deviations) in gold prices. Educated hedgingis measured as the difference between the average hedge ratio of educated directors minus the average hedge ratio of alldirectors in the industry. The regression includes firm fixed effects and a dummy variable for each quarter to control forseasonal effects in the data. The superscripts ***, **, and * denote significance at the 1%, 5%, and 10% levels, respectively.
Variables Coef.
Ln(size) -0.078***(-2.38)
CEO_CS 0.089*(1.66)
V alCEO_op 0.049***(8.48)
%_inst 0.579***(3.98)
CEO_age -0.002(-0.85)
Maj_unr_bor -0.02(-0.46)
%NotAct_Edu_bor 0.812***(3.62)
Regime_goldp -0.119***(-3.81)
%_NotAct_Edu_bor ×Regime_goldp 1.278***(3.62)
Inv_Mills -0.134**(-1.95)
Intercept 0.31(1.23)
Adj R-Squared 0.379F -Value (p-value) 12.97 (0.00)Observations 324
53

Table 11: PCA.This table reports the partial results of the simultaneous regression between firm performance and the hedge ratio in thepresence of governance indicators. The governance indicators are measured with the principal component of governancevariables for directors on the board (PC_gov_board) and directors on the audit committee (PC_gov_audit). Detailed resultsand control variables are reported in Appendix G. We include a dummy variable for each quarter to control for seasonaleffects in the data. The superscripts ***, **, and * denote significance at the 1%, 5%, and 10% levels, respectively.
ROE ROA Tobin’s Q MB
Panel A: The dependent variable is the hedge ratio
firm_performance -0.108 -0.340 -0.058 -0.050(-0.49) (-0.77) (-1.28) (-1.13)
PC_gov_audit 0.033* 0.038*** 0.041*** 0.044***(1.93) (2.43) (2.64) (2.85)
PC_gov_board 0.045*** 0.042*** 0.042** 0.041***(2.82) (3.62) (3.60) (3.59)
Controls & Intercept Yes Yes Yes Yes
Chi2 (p-value) 1234.97 (0.00) 2606.28 (0.00) 2532.84 (0.00) 2563.08 (0.00)Observations 339 341 341 342
Panel B: The dependent variable is firm performance
Hedge_ratio 0.647*** 0.219** 0.877** 0.824**(2.39) (2.28) (2.04) (1.96)
Controls & Intercept Yes Yes Yes Yes
Chi2 (p-value) 159.07 (0.00) 103.07 (0.00) 1759.06 (0.00) 9070.12 (0.00)Observations 339 341 341 342
54

Table 12: Simultaneous effect between hedging and officers’ option holdings.This table reports the results on the relation between the option holdings of officers including the CEO and those of theCEO on firm risk management activities, using simultaneous system of equations. The system is based on Zellner’s SUREcombined with a two-stage least squares estimation for each equation. In Panel A the dependent variable is the hedgeratio and in Panel B the dependent variable is the option holdings of officers including the CEO and those of the CEO($Val(CEO)\_op$). All regressions have firm fixed effects and include a dummy variable for each quarter to control forseasonal effects in the data. The t-statistics are in parentheses. The superscripts ***, **, and * denote significance at the1%, 5%, and 10% levels, respectively.
Panel A: The hedge ratio is the dependent variable Panel B: Option holdings are the dependent variable
CEO All officers CEO All officers
V al(CEO)_op -0.007*** -0.006*** Hedge_ratio 0.331 0.204(-3.44) (-3.22) (1.23) (0.85)
Ln(size) 0.121*** 0.121*** Ln(size) -0.154** -0.054(3.25) (3.23) (-2.15) (-0.85)
Market_to_book -0.038** -0.039** Market_to_book -0.007 -0.068**(-2.03) (-2.07) (-0.21) (-2.07)
Leverage 0.087*** 0.086*** Leverage -0.122** -0.091**(3.21) (3.16) (-2.42) (-2.01)
Quick_ratio -0.005 -0.005 Quick_ratio 0.031*** 0.036***(-1.12) (-1.08) (3.58) (4.61)
Dividend_policy -0.002 -0.003 Dividend_policy -0.023 -0.028(-0.09) (-0.13) (-0.54) (-0.72)
Tax_save 0.214*** 0.213*** Exploration 0.186 0.522(4.90) (4.86) (0.14) (0.43)
CEO_CS 0.082** 0.096** Cash_cost -0.001 -0.001(2.16) (2.49) (-0.27) (-0.93)
%_inst -0.604*** -0.615*** %_blockholders 0.183 0.290(-4.13) (-4.2) (0.56) (0.98)
CEO_age 0.001 0.001 %_inst -0.741** -0.742***(0.56) (0.57) (-2.34) (-2.6)
US_dummy -0.393 -0.377 CEO_age -0.001 0.010**(-1.48) (-1.42) (-0.16) (2.35)
Gov_index_audit 0.043*** 0.043*** CEO_tenure 0.008 0.007(3.19) (3.2) (1.18) (1.12)
Gov_index_board 0.021** 0.021** CEO_change 0.086* 0.311***(2.11) (2.1) (1.66) (6.64)
Gold_price -0.001 -0.001 US_dummy -0.871** -0.915***(-1.16) (-1.28) (-2.16) (-2.53)
Intercept -0.173 -0.008 Gov_index_audit -0.097*** -0.062***(-0.75) (-0.40) (-3.51) (-2.49)
Gov_index_board -0.051*** -0.047***(-2.82) (-2.95)
Gold_price 0.006*** 0.006***(10.9) (12.56)
Intercept 0.111 1.089***(0.35) (3.32)
Chi-2 (p-value) 2575.18 (0.00) 2575.35 (0.00) 1234.71 (0.00) 1599.26 (0.00)Observations 342 342 342 342
55

Table 13: Officers’ option moneyness.This table reports the number of options granted to officers and statistics on their moneyness. Here, ITM stands for in themoney, ATM for at the money, and OTM for out of the money. Columns 2 to 4 report the percentage of options relative to theuniverse of options granted to officers, the sample mean, and the sample standard deviation.
Number Percentage Sample Mean Sample S. Dev.
Observations with option holdings 114 100 -1.78 3.95
ITM options 30 26.32 1.63 2.20ATM options 9 7.89 0.00 0.00OTM options 75 65.79 -3.37 3.77
56

Figure 1: Sample constitution procedure.
Figure 2: Observed hedge ratio.
57
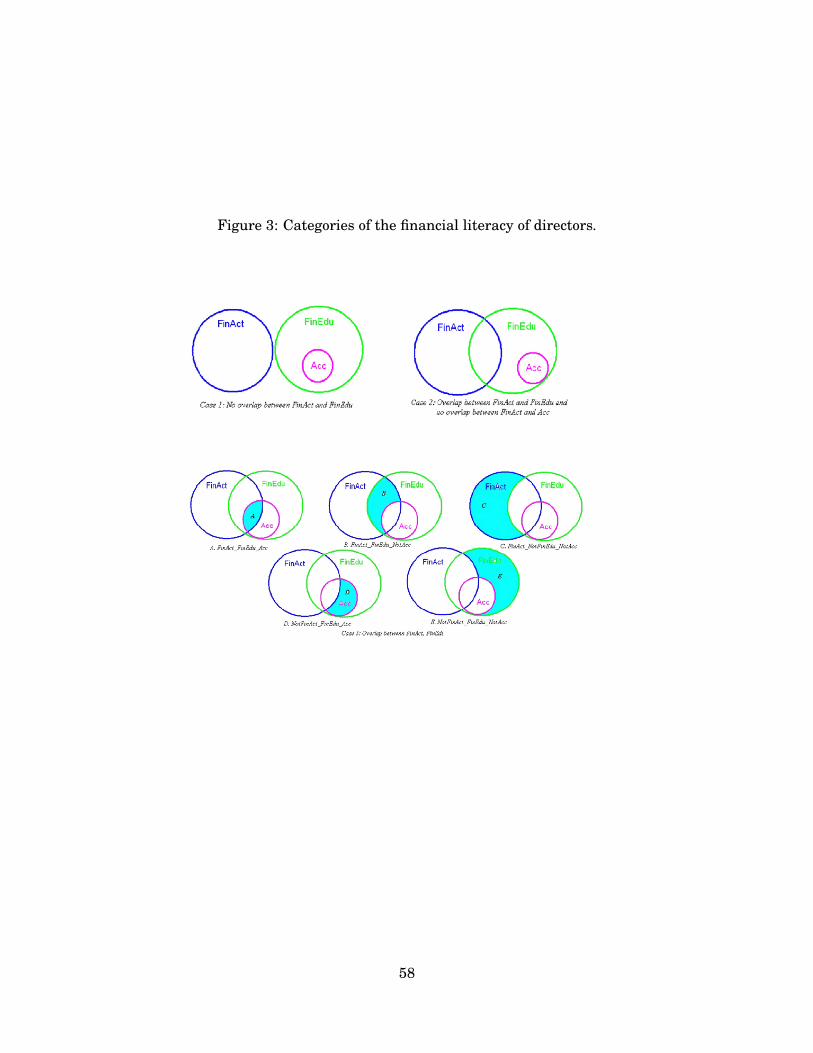
Figure 3: Categories of the financial literacy of directors.
58
On-line Appendix forThe Governance of Risk Management: The importance of
Directors Independence and Financial KnowledgeFor on-line publication
Georges DionneOlfa Maalaoui Chun
Thouraya Triki1
March, 2015
1Georges Dionne and Thouraya Triki are from HEC Montreal, Olfa Maalaoui Chun is from KAIST Grad-uate School of Finance. We are very grateful to Narjess Boubakri, David Cummins, Bernard Fortin andWilliam Greene for their helpful comments. We also thank seminar participants at the Northern FinanceAssociation (NFA) meeting, the Australasian Banking and Finance Conference, and the Financial Manage-ment Association European meeting. Thouraya Triki acknowledges financial support from the Fonds Québé-cois de la Recherche sur la Société et la Culture (FQRSC). Send correpsondence to Olfa Maalaoui Chun:[email protected].
1

Appendix A: Variable definition
Variable name Variable definition
Panel A : General characteristics of the firm and the market
Hedge_ratio is the delta of the risk management portfolio held by the firm divided by its expected produc-tion. The variable is measured at the quarter end.
Ln(size) is the market value of assets defined as (the number of common shares outstanding multi-plied by the end-of-year price per share) plus the book value of assets minus the book valueof equity. We use the logarithm of the firm size.
Market_to_book is the market value of total assets divided by the book value of assets.Leverage is the total debt divided by the total of common equity plus preferred stocks.Quick_ratio is the value of the cash on hand, short term investments and clients’ accounts divided by the
short term liabilities.Dividend_policy is a dummy variable equal to one if a firm pays cash dividends, and zero otherwise.Tax_save is the expected percentage savings in tax arising from a 5% drop in the volatility of taxable
income (more details in Appendix B). The computation is based on annual data. To obtainquarterly data, we assume the same value of tax advantages during the four quarters of theyear.
US_dummy is a dummy variable equal to one if the firm is a US firm, and zero otherwise.%_inst is the percentage of shares held by institutions.%_blockholders is the percentage of shares held by blockholders (i.e. a non managerial shareholder holding
more than 10% of the firm’s shares, Tufano (1996)).Exploration is the firm exploration expenditures scaled the firm market value.Cash_ cos t is the operating cost of producing one ounce of gold, excluding all non-cash items such as
depreciation, amortization and other financial costs.Gold_price is the price of one ounce of gold in the spot market.
Panel B : General characteristics of directors and CEOs
CEO_age is the age of the CEO (years).CEO_tenure is a dummy variable equal to one if the CEO is tenure as CEO, and zero otherwise.CEO_COB is a dummy variable equal to one if the CEO is the chairman of the board, and zero otherwise.CEO_change is a dummy variable equal to one if the CEO changed during the year, and zero otherwise.CEO_CS is the net value of the common shares of the firm held by the CEO (millions, USD).V alCEO_op is the value of exercisable options held by the CEO (millions, USD).V alAll_op is the value of exercisable options held by all directors (millions, USD).Cash_fee_outsiders is the cash fee paid for each meeting to outside directors (thousands, USD).Annual_fixed_fee is the annual fixed fee paid for each meeting to outside directors (thousands, USD).CEO_Bachelor is a dummy variable equal to one if the CEO has a bachelor degree in finance and zero
otherwise.CEO_High_Edu is a dummy variable equal to one if the CEO has a Master degree or a PhD in finance and
zero otherwise.
2

Appendix A (Continued)
Variable name Variable definition
Panel C : Characteristics and financial background of directors
Min_size is a dummy variable equal to one if there is a minimum of three directors sitting on the auditcommittee, and zero otherwise.
Tot_indep is a dummy variable equal to one if all directors sitting on the audit committee are unrelateddirectors, and zero otherwise.
Maj_indep is a dummy variable equal to one if the majority of directors sitting on the board are unre-lated, and zero otherwise.
%_indep is the proportion of unrelated directors sitting on the board. We divide the number of unre-lated directors by the size of the board.
i_Fin_know is a dummy variable equal to one if at least one (i=One) or all (i=All) director sitting on theaudit committee are financially literate, and zero otherwise.
i_Act_Edu_Acc is a dummy variable equal to one if i director(s) sitting on the audit committee or the boardare financially active, educated, and have an accounting background, and zero otherwise.
i_Act_Edu_NotAcc is a dummy variable equal to one if i director(s) sitting on the audit committee or the boardare financially active, educated, and do not have an accounting background, and zero other-wise.
i_Act_NotEdu_NotAcc is a dummy variable equal to one if i director(s) sitting on the audit committee or the boardare financially active, but are not financially educated, and do not have an accounting back-ground, and zero otherwise.
i_NotAct_Edu_Acc is a dummy variable equal to one if i director(s) sitting on the audit committee or the boardare not financially active, but are educated, and have an accounting background, and zerootherwise.
i_NotAct_Edu_NotAcc is a dummy variable equal to one if i director(s) sitting on the audit committee or the boardare educated, but are not financially active, and do not have an accounting background, andzero otherwise.
%_Bachelor is the percentage of directors sitting on the board or the audit committee with a Bachelordegree.
%_High_Edu is the percentage of directors sitting on the board or the audit committee with a Master or aPhD degree. The percentage is relative to the size of the committee.
Num_High_Edu is the number of directors sitting on the board or the audit committee with a Master or aPhD degree.
i_Acc is a dummy variable equal to one if i director(s) sitting on the board or the audit committeehave an accounting background, and zero otherwise.
∗i=One, when we consider at least one director and i=%, when we consider the percentage of directors.
3

Appendix B. Details on the construction of Tax_save variable
To construct the variable measuring the tax advantage, we use the simulation approachintroduced by Graham and Smith (1999).1 However, we consider the legislation and thetax code of the country origin when calculating the level of the tax liability for each firmrather than applying the American law to all firms as in Graham and Smith (1999).
By hedging, a firm locks on the value of taxable earnings, thus reducing the volatil-ity of the pre-tax value of assets. This in turn increases the after-tax value of assets andgenerates tax savings. The benefits of hedging increase with the convexity of the tax func-tion. Following Graham and Smith (1999), we calculate the tax savings resulting from areduction of 5% in the volatility of taxable earnings. More specifically, the expected valueof taxable earnings (Πt+1) follows a random walk process:
Πt+1 = µt + Πt + εit. (1)
where εit is the tax innovation for firm i and is normally distributed. We calculatehistorical taxable earnings using annual data from Compustat. During our sample period,the American legislation allows firms to carry back net operating losses for 3 years andforward for 15 years while the Canadian legislation allows firms to carry back net operatinglosses for 3 years and forward for only 7 years. Following the procedure in Graham andSmith (1999), and with respect to the country tax plan, we calculate the tax save variable(tax_save) as the difference between the tax liability before and after a reduction of 5%in the volatility of taxable earnings. We perform this procedure 1000 times for each firmin each year. We then scale the tax variable by the value of sales during the year as inGraham and Rogers (2002).
Appendix C: Data sources
We hand collect the information on directors education and background using varioussources that we may classify into two categories:
C.1 Publications• The international who’s who,
• The Canadian who’s who,
• Who’s who in America,
• The S&P register of corporations, directors and executives,
1We are grateful to John Graham for his helpful comments and suggestions in the construction of thisvariable.
4

• Who’s who in Canada,
• Who’s who in America,
• Who’s who in Canadian business,
• Who’s who in finance,
• The Northern Miner,
• Who’s who in finance and industry,
• The Financial Post directory of directors,
• Who’s who in Canadian finance,
• The blue book of Canadian businesses,
• Who’s who in Ontario,
• Encyclopedia of British Columbia,
• Who’s who in British Columbia,
• Who’s who in Australia,
• Who’s who in the West,
• Who’s who in the South and Southwest.
C.2 Electronic sources• Firms websites available in the internet and google search engine,
• Proquest ABI/Inform,
• Factiva provided by Reuters,
• EDGAR online,
• Lexis-Nexis,
• EUREKA.CC.
• A.CC.
Appendix D. Summary statistics: directors background
We defined three main categories of the financial background of directors sitting on theboard or on the audit committee. Specifically, we count directors who are i) financially ac-tive, ii) financially educated, and/or iii) accountant. Because there may be an overlap in thedefinition of each category, we construct additional sub-categories which we summarize inTable D-1. Specifically, we count the number of directors who are i) financially active, andfinancially educated, and accountant, or ii) financially active, and financially educated, andnot accountant, or iii) financially active, and not financially educated, and not accountant,or iv) not financially active, and financially educated, and accountant, or ii) not financiallyactive, and financially educated, and not accountant. Table D-2 reports the distribution ofthe above variables.
5

Table D-1 : Statistics about variables in the sub-categories of the definition of financialliteracy of directors.
We present summary statistics for the five sub-categories defining the financial literacy of the direc-tors. The variable FinAct_Edu_Acc counts the number of directors who are financially active, and finan-cially educated, and accountants; FinAct_Edu_NotAcc counts the number of directors who are financiallyactive, and financially educated, but not accountants; FinAct_NotEdu_NotAcc counts the number of di-rectors who are financially active, but not financially educated, and not accountants; NotF inAct_Edu_Acccounts the number of directors who are not financially active, but are financially educated, and accountants;NotF inAct_Edu_NotAcc counts the number of directors who are not financially active, and are financiallyeducated, but not accountants.
Variables Number Mean Median Std. Dev. Min Max
Panel A: Directors sitting on the audit committee
Act_Edu_Acc 348 0.39 0 0.62 0 2Act_Edu_NotAcc 348 0.31 0 0.59 0 2Act_NotEdu_NotAcc 348 0.47 0 0.60 0 2NotAct_Edu_Acc 348 0.21 0 0.41 0 1NotAct_Edu_NotAcc 348 0.50 0 0.70 0 3
Panel B: Directors sitting on the board
Act_Edu_Acc 348 0.76 1 0.79 0 3Act_Edu_NotAcc 348 0.70 1 0.78 0 3Act_NotEdu_NotAcc 348 1.03 1 1.03 0 4NotAct_Edu_Acc 348 0.49 0 0.61 0 2NotAct_Edu_NotAcc 348 1.09 1 1.17 0 5
Table D-2 : Distribution of variables in the sub-categories of the of financial literacy ofdirectors.
We count the number of directors sitting on the board and the audit committee by sub-category of finan-cial background. The variable FinAct_Edu_Acc counts the number of directors who are financially active, andfinancially educated, and accountants; FinAct_Edu_NotAcc counts the number of directors who are finan-cially active, and financially educated, but not accountants; FinAct_NotEdu_NotAcc counts the number ofdirectors who are financially active, but not financially educated, and not accountants; NotF inAct_Edu_Acccounts the number of directors who are not financially active, but are financially educated, and accountants;NotF inAct_Edu_NotAcc counts the number of directors who are not financially active, and are financiallyeducated, but not accountants.
6
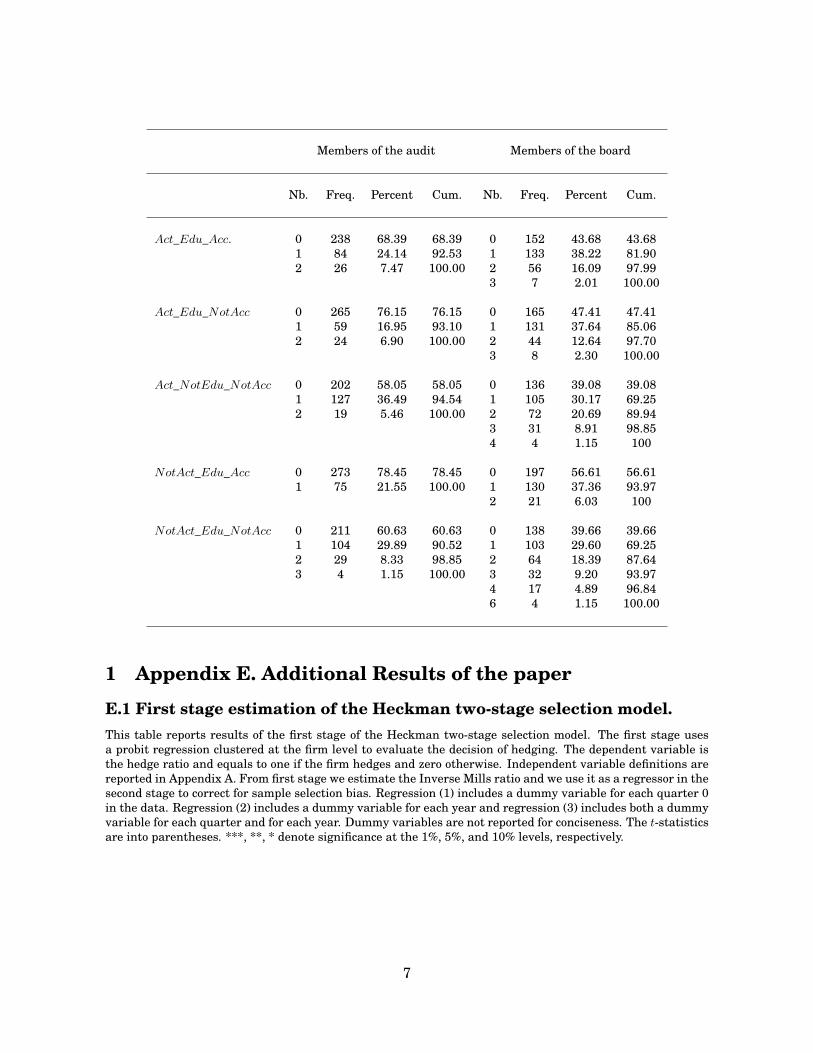
Members of the audit Members of the board
Nb. Freq. Percent Cum. Nb. Freq. Percent Cum.
Act_Edu_Acc. 0 238 68.39 68.39 0 152 43.68 43.681 84 24.14 92.53 1 133 38.22 81.902 26 7.47 100.00 2 56 16.09 97.99
3 7 2.01 100.00
Act_Edu_NotAcc 0 265 76.15 76.15 0 165 47.41 47.411 59 16.95 93.10 1 131 37.64 85.062 24 6.90 100.00 2 44 12.64 97.70
3 8 2.30 100.00
Act_NotEdu_NotAcc 0 202 58.05 58.05 0 136 39.08 39.081 127 36.49 94.54 1 105 30.17 69.252 19 5.46 100.00 2 72 20.69 89.94
3 31 8.91 98.854 4 1.15 100
NotAct_Edu_Acc 0 273 78.45 78.45 0 197 56.61 56.611 75 21.55 100.00 1 130 37.36 93.97
2 21 6.03 100
NotAct_Edu_NotAcc 0 211 60.63 60.63 0 138 39.66 39.661 104 29.89 90.52 1 103 29.60 69.252 29 8.33 98.85 2 64 18.39 87.643 4 1.15 100.00 3 32 9.20 93.97
4 17 4.89 96.846 4 1.15 100.00
1 Appendix E. Additional Results of the paper
E.1 First stage estimation of the Heckman two-stage selection model.This table reports results of the first stage of the Heckman two-stage selection model. The first stage usesa probit regression clustered at the firm level to evaluate the decision of hedging. The dependent variable isthe hedge ratio and equals to one if the firm hedges and zero otherwise. Independent variable definitions arereported in Appendix A. From first stage we estimate the Inverse Mills ratio and we use it as a regressor in thesecond stage to correct for sample selection bias. Regression (1) includes a dummy variable for each quarter 0in the data. Regression (2) includes a dummy variable for each year and regression (3) includes both a dummyvariable for each quarter and for each year. Dummy variables are not reported for conciseness. The t-statisticsare into parentheses. ***, **, * denote significance at the 1%, 5%, and 10% levels, respectively.
7

Wald test for the(1) (2) (3) significance of the coef in (3)
Chi2 (p-value)
Ln(size) 0.351*** 0.318** 0.321** 4.49** (0.03)(2.34) (2.13) (2.12)
Market_to_book -0.463** -0.439** -0.438** 4.85** (0.02)(-2.18) (-2.21) (-2.20)
Leverage -0.156 -0.128 -0.155 0.47 (0.49)(-0.73) (-0.59) (-0.68)
Quick_ratio -0.050 -0.048 -0.049 0.76 (0.38)(-0.91) (-0.86) (-0.87)
Dividend_policy 0.694* 0.600* 0.634* 2.89* (0.08)(1.81) (1.78) (1.70)
Tax_save -0.370 -0.491 -0.496 1.15 (0.28)(-0.79) (-1.07) (-1.07)
US_dummy 0.251 0.302 0.335 0.71 (0.39)(0.66) (0.77) (0.84)
Intercept -0.877 -1.042 -1.389(-0.8) (-0.81) (-0.93)
Dummy_quarter Yes No YesDummy_year No Yes YesR− squared 0.12 0.15 0.15Wald Chi2 22.27 40.86 45.94Pr > Chi2 0.01 0.00 0.00Observations 325 325 325
E.2 Effect of directors education background on hedging.We report results of the effect of directors’ financial education on the hedging behavior of the firm. The model represents thesecond stage of the Heckman two-stage selection model (results of the first stage are reported in Table E.1). The dependentvariable is the intensity of hedging using derivatives. Independent variable definitions are reported in Appendix A. Allregressions have firms fixed effects and include a dummy variable for each quarter to control for seasonal effects in the data.The t-statistics are into parentheses. ***, **, * denote significance at the 1%, 5%, and 10% levels, respectively.
8
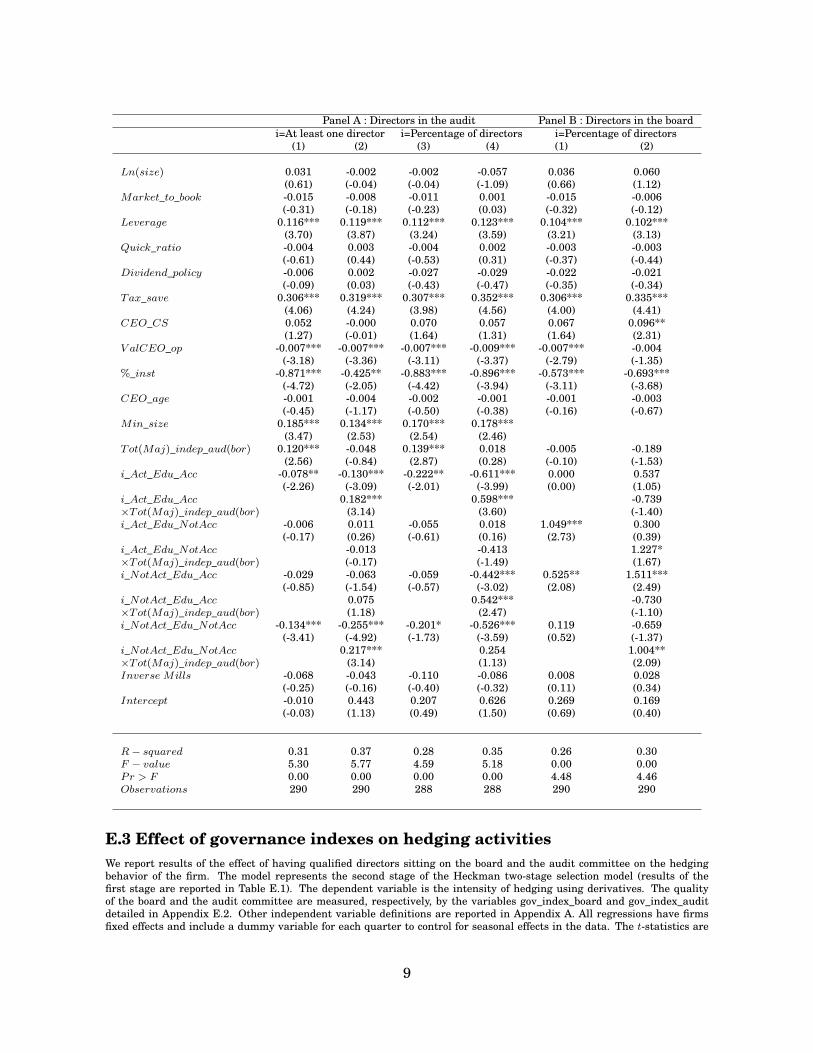
Panel A : Directors in the audit Panel B : Directors in the boardi=At least one director i=Percentage of directors i=Percentage of directors
(1) (2) (3) (4) (1) (2)
Ln(size) 0.031 -0.002 -0.002 -0.057 0.036 0.060(0.61) (-0.04) (-0.04) (-1.09) (0.66) (1.12)
Market_to_book -0.015 -0.008 -0.011 0.001 -0.015 -0.006(-0.31) (-0.18) (-0.23) (0.03) (-0.32) (-0.12)
Leverage 0.116*** 0.119*** 0.112*** 0.123*** 0.104*** 0.102***(3.70) (3.87) (3.24) (3.59) (3.21) (3.13)
Quick_ratio -0.004 0.003 -0.004 0.002 -0.003 -0.003(-0.61) (0.44) (-0.53) (0.31) (-0.37) (-0.44)
Dividend_policy -0.006 0.002 -0.027 -0.029 -0.022 -0.021(-0.09) (0.03) (-0.43) (-0.47) (-0.35) (-0.34)
Tax_save 0.306*** 0.319*** 0.307*** 0.352*** 0.306*** 0.335***(4.06) (4.24) (3.98) (4.56) (4.00) (4.41)
CEO_CS 0.052 -0.000 0.070 0.057 0.067 0.096**(1.27) (-0.01) (1.64) (1.31) (1.64) (2.31)
V alCEO_op -0.007*** -0.007*** -0.007*** -0.009*** -0.007*** -0.004(-3.18) (-3.36) (-3.11) (-3.37) (-2.79) (-1.35)
%_inst -0.871*** -0.425** -0.883*** -0.896*** -0.573*** -0.693***(-4.72) (-2.05) (-4.42) (-3.94) (-3.11) (-3.68)
CEO_age -0.001 -0.004 -0.002 -0.001 -0.001 -0.003(-0.45) (-1.17) (-0.50) (-0.38) (-0.16) (-0.67)
Min_size 0.185*** 0.134*** 0.170*** 0.178***(3.47) (2.53) (2.54) (2.46)
Tot(Maj)_indep_aud(bor) 0.120*** -0.048 0.139*** 0.018 -0.005 -0.189(2.56) (-0.84) (2.87) (0.28) (-0.10) (-1.53)
i_Act_Edu_Acc -0.078** -0.130*** -0.222** -0.611*** 0.000 0.537(-2.26) (-3.09) (-2.01) (-3.99) (0.00) (1.05)
i_Act_Edu_Acc 0.182*** 0.598*** -0.739×Tot(Maj)_indep_aud(bor) (3.14) (3.60) (-1.40)i_Act_Edu_NotAcc -0.006 0.011 -0.055 0.018 1.049*** 0.300
(-0.17) (0.26) (-0.61) (0.16) (2.73) (0.39)i_Act_Edu_NotAcc -0.013 -0.413 1.227*×Tot(Maj)_indep_aud(bor) (-0.17) (-1.49) (1.67)i_NotAct_Edu_Acc -0.029 -0.063 -0.059 -0.442*** 0.525** 1.511***
(-0.85) (-1.54) (-0.57) (-3.02) (2.08) (2.49)i_NotAct_Edu_Acc 0.075 0.542*** -0.730×Tot(Maj)_indep_aud(bor) (1.18) (2.47) (-1.10)i_NotAct_Edu_NotAcc -0.134*** -0.255*** -0.201* -0.526*** 0.119 -0.659
(-3.41) (-4.92) (-1.73) (-3.59) (0.52) (-1.37)i_NotAct_Edu_NotAcc 0.217*** 0.254 1.004**×Tot(Maj)_indep_aud(bor) (3.14) (1.13) (2.09)Inverse Mills -0.068 -0.043 -0.110 -0.086 0.008 0.028
(-0.25) (-0.16) (-0.40) (-0.32) (0.11) (0.34)Intercept -0.010 0.443 0.207 0.626 0.269 0.169
(-0.03) (1.13) (0.49) (1.50) (0.69) (0.40)
R− squared 0.31 0.37 0.28 0.35 0.26 0.30F − value 5.30 5.77 4.59 5.18 0.00 0.00Pr > F 0.00 0.00 0.00 0.00 4.48 4.46Observations 290 290 288 288 290 290
E.3 Effect of governance indexes on hedging activitiesWe report results of the effect of having qualified directors sitting on the board and the audit committee on the hedgingbehavior of the firm. The model represents the second stage of the Heckman two-stage selection model (results of thefirst stage are reported in Table E.1). The dependent variable is the intensity of hedging using derivatives. The qualityof the board and the audit committee are measured, respectively, by the variables gov_index_board and gov_index_auditdetailed in Appendix E.2. Other independent variable definitions are reported in Appendix A. All regressions have firmsfixed effects and include a dummy variable for each quarter to control for seasonal effects in the data. The t-statistics are
9

into parentheses. ***, **, * denote significance at the 1%, 5%, and 10% levels, respectively.
Panel A: Multivariate regression Panel B: Heckman second stage regression
(1) (2) (3) (1) (2) (3)
Ln(size) 0.122*** 0.134*** 0.123*** 0.009 0.043 0.010(2.99) (3.30) (3.05) (0.17) (0.86) (0.19)
Market− to− book -0.052*** -0.051*** -0.051*** -0.002 -0.030 -0.004(-2.79) (-2.70) (-2.75) (-0.05) (-0.64) (-0.08)
Leverage 0.100*** 0.110*** 0.101*** 0.112*** 0.112*** 0.113***(3.68) (4.04) (3.72) (3.86) (3.81) (3.91)
Quick_ratio -0.005 -0.008 -0.006 0.001 -0.005 <0.000(-0.97) (-1.47) (-1.00) (0.09) (-0.78) (-0.02)
Dividend_policy 0.004 -0.003 0.000 -0.053 -0.023 -0.052(0.16) (-0.10) (0.02) (-0.85) (-0.37) (-0.85)
Tax_save 0.178*** 0.198*** 0.190*** 0.322*** 0.291*** 0.333***(3.74) (4.10) (3.97) (4.29) (3.88) (4.46)
CEO_CS 0.089** 0.099*** 0.098*** 0.086** 0.096*** 0.096**(2.15) (2.35) (2.36) (2.20) (2.43) (2.46)
V alCEO_op -0.007*** -0.008*** -0.008*** -0.007*** -0.008*** -0.008***(-3.15) (-3.49) (-3.54) (-3.41) (-3.74) (-3.89)
%_inst -0.590*** -0.678*** -0.597*** -0.525*** -0.634*** -0.541***(-3.69) (-4.29) (-3.75) (-2.89) (-3.50) (-3.00)
CEO_age <0.000 0.002 0.002 -0.001 0.001 0.000(0.18) (0.80) (0.64) (-0.17) (0.18) (0.09)
Gov_index_audit 0.043*** 0.041*** 0.053*** 0.051***(2.95) (2.83) (3.31) (3.21)
Gov_index_board 0.023** 0.021* 0.025*** 0.023**(2.11) (1.94) (2.40) (2.27)
Inverse Mills -0.285 -0.098 -0.259(-1.06) (-0.37) (-0.97)
Intercept -0.725*** -0.786*** -0.834*** 0.065 -0.110 -0.037(-2.54) (-2.69) (-2.88) (0.17) (-0.29) (-0.10)
R− squared 0.22 0.21 0.23 0.26 0.24 0.27F − value 5.78 5.40 5.70 5.59 5.15 5.66Pr > F 0.00 0.00 0.00 0.00 0.00 0.00Observations 342 342 342 290 290 290
10

E.4 Firm performance and the predicted level of risk management
E-4.1 Effect of the quality of directorsWe report results on the relation between the predicted hedging behavior and the firm performance. The firststage, in Panel A, uses the hedge ratio equation to estimate the predicted level of hedging. Panel B reportssummary statistics of this predicted value. The second stage, in Panel C, evaluates the effect of the predictedlevel of hedging on the firm accounting performance as measured by the Return On Equity (ROE), and theReturn On Assets (ROA); and the firm market performance as measure by the Tobin’s Q (Tobin’s Q) and theMarket-to-Book (MB). Independent variable definitions are reported in Appendix A. All regressions have firmfixed effects and include a dummy variable for each quarter to control for seasonal effects in the data. Thet-statistics are into parentheses. ***, **, * denote significance at the 1%, 5%, and 10% levels, respectively.
Panel A: First stage: the dependent Panel C: Second stage: the dependent variable is the firm performancevariable is the hedge ratio
ROE ROA Tobin’s Q MB
Ln(size) 0.097*** Hedge_ratio_predicted 0.573** 0.184** 0.945*** 0.907***(2.45) (2.02) (2.01) (2.38) (2.34)
Leverage 0.081*** Ln(size) -0.064 -0.039* 0.316*** 0.336***(2.72) (-0.82) (-1.66) (3.21) (3.49)
Quick_ratio -0.005 Market_to_book -0.051 -0.011(-0.93) (-1.25) (-0.81)
Dividend_policy -0.010 Leverage -0.123** -0.074*** 0.089 0.102(-0.36) (-2.16) (-4.35) (1.23) (1.45)
Tax_save 0.196*** Quick_ratio -0.008 0.000 -0.006 -0.007(4.08) (-0.82) (0.07) (-0.40) (-0.53)
CEO_CS 0.097*** Dividend_policy -0.024 0.000 0.117 0.089(2.32) (-0.50) (-0.03) (1.61) (1.26)
V alCEO_op -0.007*** Exploration 1.613 -1.676*** 0.386 0.063(-3.01) (1.05) (-3.25) (0.17) (0.03)
%_inst -0.603*** Cash_ cos t -0.001 -0.001 -0.002*** -0.002***(-3.78) (-1.49) (-1.10) (-3.75) (-3.38)
CEO_age 0.001 %_inst -0.211 0.028 -1.437*** -1.466***(0.52) (-0.59) (0.25) (-2.94) (-3.07)
Gov_index_audit 0.045*** %_bockholders 0.544 0.116 3.309*** 3.404***(3.06) (1.52) (0.97) (6.80) (7.16)
Gov_index_board 0.017 Maj_unr -0.048 -0.002 -0.137 -0.160(1.57) (-0.66) (-0.08) (-1.31) (-1.57)
US_dummy 2.064*** CEO_age -0.007 -0.002 -0.004 -0.003(2.62) (-1.33) (-1.11) (-0.46) (-0.45)
Gold_price -0.001*** CEO_COB 0.013 0.016 -0.128 -0.131(-2.39) (0.16) (0.62) (-1.10) (-1.15)
Intercept -2.303*** CEO_tenure 0.013 0.003 0.020 0.017(-2.85) (1.34) (0.93) (1.45) (1.26)
CEO_change -0.020 -0.005 -0.169* -0.181*(-0.29) (-0.25) (-1.78) (-1.95)
Chi-2 (p-value) 1126.53 (0.00) US_dummy -0.471 -0.055 -2.736*** -2.877***Observations 342 (-1.31) (-0.48) (-5.71) (-6.14)
Gold_price 0.002*** <0.000 0.010*** 0.010***(2.45) (1.42) (11.38) (11.33)
Panel B: Summary statistics Intercept 0.525 0.281* -3.221*** -3.206***for the predicted hedge ratio (0.99) (1.74) (-4.82) (-4.91)
Mean 0.26Median 0.16 Chi-2 (p-value) 136.48 (0.00) 101.79 (0.00) 1745.59 (0.00) 1725.17 (0.00)Standard deviation 0.27 Observations 339 341 341 342Observations 342
E-4.2 Effects of SOX and NYSE regulationsWe report results on the relation between the predicted hedging behavior and the firm performance. The firststage, in Panel A, uses the hedge ratio equation to estimate the predicted level of hedging. Panel B reportssummary statistics of this predicted value. The second stage, in Panel C, evaluates the effect of the predictedlevel of hedging on the firm accounting performances as measured by the Return On Equity (ROE), and theReturn On Assets (ROA); and the firm market performance as measure by the Tobin’s Q (Tobin’s Q) and theMarket-to-Book (MB). Independent variable definitions are reported in Appendix A. All regressions have firmfixed effects and include a dummy variable for each quarter to control for seasonal effects in the data. Thet-statistics are into parentheses. ***, **, * denote significance at the 1%, 5%, and 10% levels, respectively.
11

Panel A: First stage: the dependent Panel C: Second stage: the dependent variable is the firm performancevariable is the hedge ratio
ROE ROA Tobin’s Q MB
Ln(size) 0.074*(1.80) Hedge_ratio_predicted 0.279 0.088 0.738* 0.732*
Leverage 0.075*** (0.89) (0.90) (1.74) (1.77)(2.50) Ln(size) -0.035 -0.032 0.334*** 0.351***
Quick_ratio -0.005 (-0.44) (-1.34) (3.36) (3.62)(-0.85) Market_to_book -0.044 -0.009
Dividend_policy -0.007 (-1.09) (-0.63)(-0.26) Leverage -0.105* -0.070*** 0.097 0.109
Tax_save 0.196*** (-1.78) (-4.04) (1.32) (1.52)(4.07) Quick_ratio -0.009 0.000 -0.006 -0.008
CEO_CS 0.076* (-0.92) (-0.02) (-0.42) (-0.54)(1.79) Dividend_policy -0.022 0.000 0.119 0.090
V alCEO_op -0.007*** (-0.45) (0.01) (1.64) (1.27)(-2.85) Exploration 1.741 -1.640*** 0.540 0.207
%_inst -0.734*** (1.12) (-3.17) (0.24) (0.09)(-4.57) Cash_ cos t 0.000 0.000 -0.002*** -0.002***
CEO_age 0.000 (-1.23) (-0.83) (-3.62) (-3.26)(-0.10) %_Inst -0.300 0.006 -1.486*** -1.506***
US_Dummy 1.640** (-0.82) (0.05) (-3.01) (-3.12)(2.06) %_Bockholders 0.426 0.077 3.199*** 3.303***
Compliance_SOX1 0.103** (1.20) (0.65) (6.61) (6.99)(2.31) Maj_Indep_Bor -0.031 0.005 -0.088 -0.111
Compliance_NY SE1 -0.025 (-0.40) (0.21) (-0.83) (-1.07)(-1.35) CEO_Age -0.008 -0.002 -0.003 -0.003
Gold_Pr ice <0.001 (-1.33) (-1.05) (-0.40) (-0.39)(-0.99) CEO_COB 0.007 0.016 -0.144 -0.147
Intercept -1.752** (0.08) (0.59) (-1.22) (-1.27)(-2.17) CEO_Tenure 0.014 0.003 0.022 0.019
(1.46) (1.00) (1.60) (1.41)CEO_Change -0.011 -0.001 -0.154 -0.167*
Adj R-squared 0.21 (-0.16) (-0.05) (-1.62) (-1.80)Chi-2 (p-value) 1105.14 (0.00) US_Dummy -0.368 -0.028 -2.645*** -2.792***Observations 342 (-1.03) (-0.24) (-5.52) (-5.97)
Gold_Pr ice 0.001** 0.001 0.010*** 0.010***(2.04) (0.99) (10.98) (10.97)
Panel B: Summary statistics Intercept 0.440 0.270* -3.293*** -3.275***for the predicted hedge ratio (0.82) (1.66) (-4.91) (-5.00)
Median 0.15 Chi-2 (p-value) 131.73 97.47 1727.55 1709.41Standard deviation 0.27 Observations 339 341 341 342Observations 342Observations 342
E.5 The importance of educationWe report results of the regression of the hedge ratio on the level of education of directors. In Panel A, weaccount for the education of directors sitting on the audit committee. In Panel B and Panel C, we account re-spectively for the education of directors sitting on the board and the CEO. All independent variable definitionsare reported in Appendix A (Table A-1). All regressions have firms fixed effects and includes a dummy variablefor each quarter (not reported for conciseness) to control for seasonal effects in the data. The t− statistics areinto parentheses. ***, **, * denote significance at the 1%, 5%, and 10% levels, respectively.
12

Panel A : Education of members of the audit (1) (2) (3) (4) (5)
Ln(size) 0.042 0.045 0.016 -0.014 0.038(0.82) (0.89) (0.31) (-0.26) (0.77)
Market_to_book -0.024 -0.019 -0.011 -0.005 -0.031(-0.52) (-0.41) (-0.25) (-0.10) (-0.68)
Leverage 0.109*** 0.107*** 0.106*** 0.098*** 0.095***(3.59) (3.45) (3.38) (2.93) (3.11)
Quick_ratio -0.008 -0.009 -0.004 -0.001 -0.010(-1.20) (-1.31) (-0.52) (-0.21) (-1.51)
Dividend_policy 0.007 0.001 -0.003 -0.024 0.003(0.12) (0.01) (-0.05) (-0.40) (0.05)
Tax_save 0.300*** 0.309*** 0.307*** 0.308*** 0.325***(4.18) (4.33) (4.21) (4.10) (4.44)
CEO_CS 0.078** 0.080** 0.076* 0.082** 0.052(2.02) (2.08) (1.94) (2.09) (1.29)
V alCEO_op -0.008*** -0.008*** -0.008*** -0.008*** -0.010***(-3.93) (-4.03) (-3.81) (-3.52) (-4.50)
%_inst -0.930*** -0.960*** -0.895*** -0.825*** -1.183***(-4.87) (-5.05) (-4.91) (-4.34) (-6.17)
CEO_age -0.003 -0.003 -0.005 -0.003 -0.004(-1.10) (-0.93) (-1.43) (-0.99) (-1.25)
Min_size 0.121** 0.126** 0.172*** 0.164*** 0.132***(2.14) (2.21) (3.19) (2.83) (2.45)
Tot_indep 0.089* 0.095** 0.120*** 0.139*** 0.104**(1.85) (2.03) (2.55) (2.89) (2.27)
%_Bachelor -0.171*** -0.181***(-2.85) (-3.09)
%_High_Edu -0.194* -0.15559 -0.523***(-1.89) (-1.48) (-3.90)
One_NotAct_Edu_NotAcc -0.235*** -0.193*** -0.148***(-4.51) (-4.21) (-3.08)
One_NotAct_Edu_NotAcc×%_bachelor 0.310***(3.01)
One_NotAct_Edu_NotAcc×%_High_Edu. 0.396*** 0.983***(2.43) (3.97)
%_NotAct_Edu_NotAcc -0.831*** -0.258*(-4.24) (-1.95)
%_NotAct_Edu_NotAcc×%_bachelor 0.956***(4.85)
%_NotAct_Edu_NotAcc×%_High_Edu 0.814**(1.99)
One_NotAct_Edu_Acc -0.204***(-4.57)
One_NotAct_Edu_Acc×%_High_Edu 0.347**(2.18)
Inverse Mills 0.002 0.001 -0.055 -0.110 -0.001(0.01) (0.00) (-0.21) (-0.41) (-0.00)
Intercept 0.093 0.044 0.234 0.318 0.252(0.24) (0.11) (0.60) (0.79) (0.66)
R− squared 0.33 0.34 0.32 0.28 0.36F − value 6.13 6.38 5.76 4.84 6.27Pr > F 0.00 0.01 0.02 0.03 0.04Observations 288 288 288 288 288
13

Table E-5 (Continued)
(1) (2) (3) (4) (1) (2)
Panel B: Education of members of the board Panel C : Education of the CEO
Ln(size) 0.055 0.056 0.042 0.039 0.048 0.040(1.09) (1.16) (0.86) (0.80) (0.94) (0.81)
Market_to_book -0.020 -0.039 -0.026 -0.030 -0.032 -0.022(-0.42) (-0.87) (-0.59) (-0.66) (-0.68) (-0.49)
Leverage 0.118*** 0.102*** 0.104*** 0.086*** 0.116*** 0.124***(4.01) (3.60) (3.57) (2.94) (3.87) (4.30)
Quick_ratio -0.001 -0.005 -0.003 -0.003 -0.004 -0.007(-0.16) (-0.70) (-0.48) (-0.39) (-0.65) (-1.01)
Dividend_policy -0.040 0.001 -0.009 -0.010 -0.024 -0.032(-0.64) (0.02) (-0.15) (-0.17) (-0.37) (-0.53)
Tax_save 0.315*** 0.344*** 0.373*** 0.379*** 0.276*** 0.335***(4.15) (4.73) (5.07) (5.11) (3.63) (4.51)
CEO_CS 0.086** 0.083** 0.084** 0.083** 0.097*** 0.092***(2.16) (2.16) (2.21) (2.17) (2.37) (2.36)
V alCEO_op -0.007*** -0.007*** -0.008*** -0.007*** -0.005** -0.006***(-2.85) (-2.97) (-3.32) (-2.93) (-2.22) (-2.44)
%_inst -0.557*** -0.535*** -0.554*** -0.517*** -0.615*** -0.651***(-3.03) (-3.05) (-3.18) (-2.96) (-3.32) (-3.66)
CEO_age -0.002 -0.001 -0.001 -0.001 -0.003 -0.001(-0.55) (-0.03) (-0.24) (-0.17) (-0.69) (-0.30)
Maj_indep_aud -0.029 -0.021 -0.004 -0.012 -0.064 -0.046(-0.60) (-0.45) (-0.09) (-0.24) (-1.23) (-0.98)
%_Bachelor 0.320***(2.59)
%_High_Edu 1.055*** 1.065*** 1.142***(5.25) (5.24) (5.09)
One_NotAct_Edu_Acc 0.044(1.50)
One_NotAct_Edu_Acc×%_Bachelor 0.432(1.54)
%_NotAct_Edu_Acc 0.416(1.50)
%_NotAct_Edu_Acc×%_High_Edu 1.404(0.50)
CEO_Bachelor -0.039(-0.86)
CEO_High_Edu 0.332***(4.26)
Inverse Mills -0.200 -0.045 -0.083 -0.093 -0.122 -0.177(-0.75) (-0.18) (-0.32) (-0.36) (-0.45) (-0.68)
Intercept -0.075 -0.244 -0.188 -0.152 0.123 0.071(-0.19) (-0.64) (-0.49) (-0.39) (0.31) (0.19)
R− squared 0.25 0.30 0.32 0.32 0.23 0.28F − value 4.97 6.65 6.34 6.28 4.48 5.89Pr > F 0.00 0.01 0.02 0.03 0 0Observations 290 290 290 290 290 290
14

Appendix F. Details on the construction of the governance in-dexes
F.1 Measuring governance standards
For the audit committee, we construct the following dummy variables
- A1=1 if the audit committee is entirely composed of independent directors and 0 oth-erwise.
- A2=1 if the audit committee contains at least three members and 0 otherwise.
- A3=1 if the average tenure in the audit committee for directors is superior to 10 yearsand 0 otherwise.
- A4=1 if at least 25% of the audit committee hold a Master degree or a PhD in financeand 0 otherwise.
- A5=1 if each member of the audit committee is financially literate.
- A6=1 if the majority of the audit committee is comprised of financially active directorsand 0 otherwise.
- A7=1 if the majority of the audit committee is comprised of financially educated di-rectors and 0 otherwise.
- A8=1 if the majority of the audit committee is comprised of directors with accountingbackground and 0 otherwise.
- A9=1 if at least one director in the audit committee is considered as financially knowl-edgeable and 0 otherwise.
- A10=1 if at least one director in the audit committee has an accounting backgroundand 0 otherwise.
For the board, we construct the following variables
- B1=1 if the majority of directors in the board is independent and 0 otherwise.
- B2=1 if the CEO is the COB and 0 otherwise.
- B3=1 if the average tenure of directors in the board is superior to 10 years and 0otherwise.
- B4=1 if at least 25% of directors in the board hold a Master or a PhD in finance and0 otherwise.
- B5=1 if the majority of directors in the board are considered as financially knowledge-able and 0 otherwise.
- B6=1 if at least 25% of directors in the board are financially active and 0 otherwise.
15

- B7=1 if at least 25% of directors in the board are financially educated and 0 otherwise.
- B8=1 if at least 25% of directors in the board have an accounting background and 0otherwise.
Many of the variables listed above are constructed to capture the different requirementsof SOX and NYSE. Note that we refer to financial literacy of directors as either i) educationin finance ii) accounting background, iii) experience in finance, or iv) a combination ofthese. Thus, we construct dummy variables (for instance, A5 and A9) to measure financialknowledge in the sense of SOX and NYSE. For our two indexes that we define below, wemake a difference between different levels and types of financial literacy. Table E-1 reportssummary statistics of the above dummy variables.
16

Table F-1: Table of frequenciesPanel A: Audit committee
Value A1 A2 A3 A4 A5 A6 A7 A8 A9 A10
0 46.84 9.20 93.68 74.14 71.26 39.66 25.00 90.23 10.34 57.761 53.16 90.80 6.32 25.86 28.74 60.34 75.00 9.77 89.65 42.24
Panel B: BoardValue B1 B2 B3 B4 B5 B6 B7 B8
0 25.29 32.47 95.4 83.62 59.20 53.45 39.37 79.601 74.71 67.53 4.60 16.38 40.80 46.55 60.63 20.40
F-1.1 SOX standards
We construct two compliance indexes to measure the SOX standards.
Compliance_SOX1 = A1 +A9, (2)Compliance_SOX2 = A1×A9. (3)
F-1.2 NYSE standards
We also construct two compliance indexes to measure the NYSE standards as follows
Compliance_NY SE1 = B1 +A2 +A5 +A10, (4)Compliance_NY SE2 = B1×A2×A5×A10. (5)
F-1.3 SOX and NYSE standards
To obtain the compliance index to both SOX and NYSE standards, we construct the follow-ing two variables
Compliance_SOX1_NY SE1 = A1 +A9 +B1 +A2 +A5 +A10, (6)Compliance_SOX2_NY SE2 = A1×A9×B1×A2×A5×A10. (7)
Note that the indexesCompliance_SOX1, Compliance_NY SE1, andCompliance_SOX1_NY SE1measure the degree of firms compliance to SOX, NYSE requirements, or both, respectively.However, the indexesCompliance_SOX2, Compliance_NY SE2, andCompliance_SOX2_NY SE2are dummy variables, which take on the value of one if the firm meets all the specified re-quirements at the same time.
F2. Measuring the quality of the board and audit members
We extend the requirement of SOX and NYSE to construct a measure that captures thequality of the board and the audit committee. Specifically, we construct two additionalindexes.
17
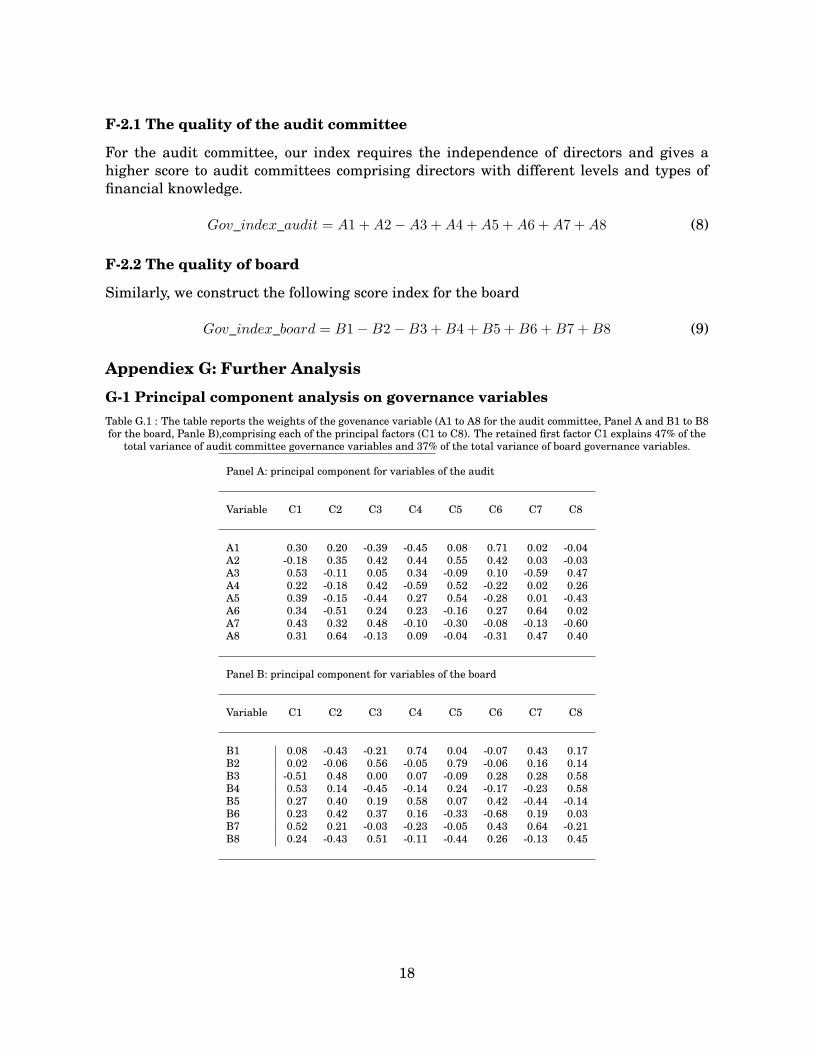
F-2.1 The quality of the audit committee
For the audit committee, our index requires the independence of directors and gives ahigher score to audit committees comprising directors with different levels and types offinancial knowledge.
Gov_index_audit = A1 +A2−A3 +A4 +A5 +A6 +A7 +A8 (8)
F-2.2 The quality of board
Similarly, we construct the following score index for the board
Gov_index_board = B1−B2−B3 +B4 +B5 +B6 +B7 +B8 (9)
Appendiex G: Further Analysis
G-1 Principal component analysis on governance variablesTable G.1 : The table reports the weights of the govenance variable (A1 to A8 for the audit committee, Panel A and B1 to B8for the board, Panle B),comprising each of the principal factors (C1 to C8). The retained first factor C1 explains 47% of the
total variance of audit committee governance variables and 37% of the total variance of board governance variables.
Panel A: principal component for variables of the audit
Variable C1 C2 C3 C4 C5 C6 C7 C8
A1 0.30 0.20 -0.39 -0.45 0.08 0.71 0.02 -0.04A2 -0.18 0.35 0.42 0.44 0.55 0.42 0.03 -0.03A3 0.53 -0.11 0.05 0.34 -0.09 0.10 -0.59 0.47A4 0.22 -0.18 0.42 -0.59 0.52 -0.22 0.02 0.26A5 0.39 -0.15 -0.44 0.27 0.54 -0.28 0.01 -0.43A6 0.34 -0.51 0.24 0.23 -0.16 0.27 0.64 0.02A7 0.43 0.32 0.48 -0.10 -0.30 -0.08 -0.13 -0.60A8 0.31 0.64 -0.13 0.09 -0.04 -0.31 0.47 0.40
Panel B: principal component for variables of the board
Variable C1 C2 C3 C4 C5 C6 C7 C8
B1 0.08 -0.43 -0.21 0.74 0.04 -0.07 0.43 0.17B2 0.02 -0.06 0.56 -0.05 0.79 -0.06 0.16 0.14B3 -0.51 0.48 0.00 0.07 -0.09 0.28 0.28 0.58B4 0.53 0.14 -0.45 -0.14 0.24 -0.17 -0.23 0.58B5 0.27 0.40 0.19 0.58 0.07 0.42 -0.44 -0.14B6 0.23 0.42 0.37 0.16 -0.33 -0.68 0.19 0.03B7 0.52 0.21 -0.03 -0.23 -0.05 0.43 0.64 -0.21B8 0.24 -0.43 0.51 -0.11 -0.44 0.26 -0.13 0.45
18
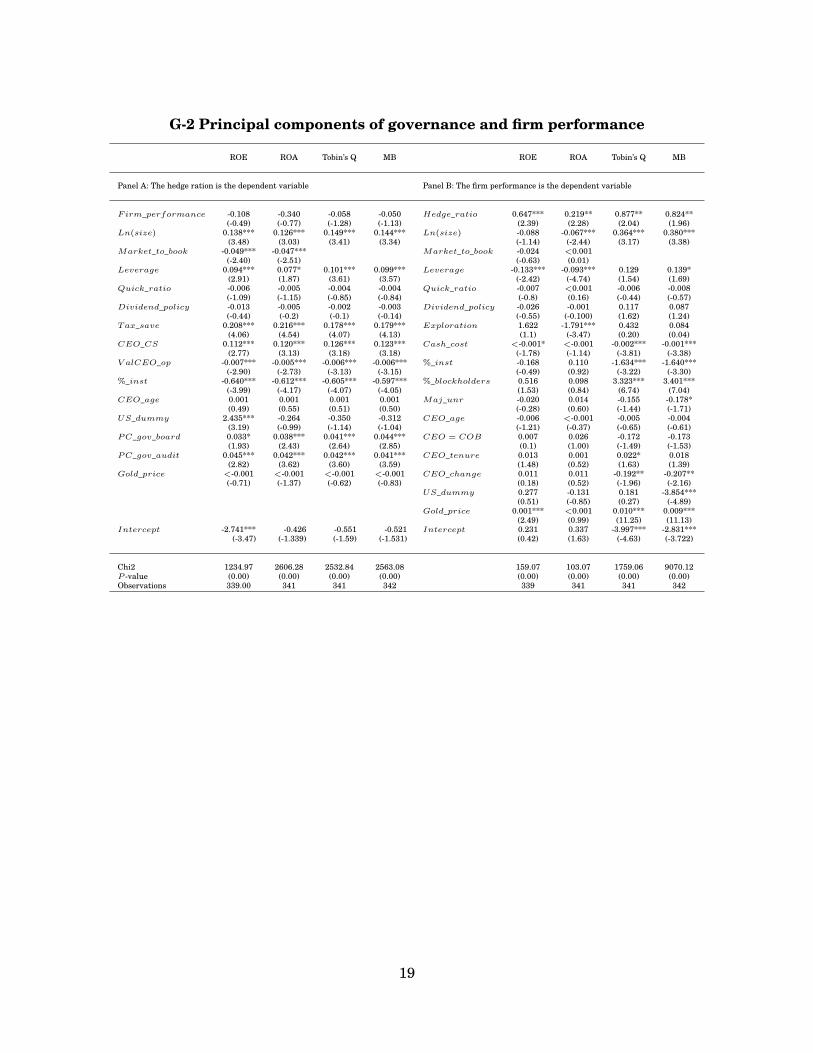
G-2 Principal components of governance and firm performance
ROE ROA Tobin’s Q MB ROE ROA Tobin’s Q MB
Panel A: The hedge ration is the dependent variable Panel B: The firm performance is the dependent variable
Firm_performance -0.108 -0.340 -0.058 -0.050 Hedge_ratio 0.647*** 0.219** 0.877** 0.824**(-0.49) (-0.77) (-1.28) (-1.13) (2.39) (2.28) (2.04) (1.96)
Ln(size) 0.138*** 0.126*** 0.149*** 0.144*** Ln(size) -0.088 -0.067*** 0.364*** 0.380***(3.48) (3.03) (3.41) (3.34) (-1.14) (-2.44) (3.17) (3.38)
Market_to_book -0.049*** -0.047*** Market_to_book -0.024 <0.001(-2.40) (-2.51) (-0.63) (0.01)
Leverage 0.094*** 0.077* 0.101*** 0.099*** Leverage -0.133*** -0.093*** 0.129 0.139*(2.91) (1.87) (3.61) (3.57) (-2.42) (-4.74) (1.54) (1.69)
Quick_ratio -0.006 -0.005 -0.004 -0.004 Quick_ratio -0.007 <0.001 -0.006 -0.008(-1.09) (-1.15) (-0.85) (-0.84) (-0.8) (0.16) (-0.44) (-0.57)
Dividend_policy -0.013 -0.005 -0.002 -0.003 Dividend_policy -0.026 -0.001 0.117 0.087(-0.44) (-0.2) (-0.1) (-0.14) (-0.55) (-0.100) (1.62) (1.24)
Tax_save 0.208*** 0.216*** 0.178*** 0.179*** Exploration 1.622 -1.791*** 0.432 0.084(4.06) (4.54) (4.07) (4.13) (1.1) (-3.47) (0.20) (0.04)
CEO_CS 0.112*** 0.120*** 0.126*** 0.123*** Cash_cost <-0.001* <-0.001 -0.002*** -0.001***(2.77) (3.13) (3.18) (3.18) (-1.78) (-1.14) (-3.81) (-3.38)
V alCEO_op -0.007*** -0.005*** -0.006*** -0.006*** %_inst -0.168 0.110 -1.634*** -1.640***(-2.90) (-2.73) (-3.13) (-3.15) (-0.49) (0.92) (-3.22) (-3.30)
%_inst -0.640*** -0.612*** -0.605*** -0.597*** %_blockholders 0.516 0.098 3.323*** 3.401***(-3.99) (-4.17) (-4.07) (-4.05) (1.53) (0.84) (6.74) (7.04)
CEO_age 0.001 0.001 0.001 0.001 Maj_unr -0.020 0.014 -0.155 -0.178*(0.49) (0.55) (0.51) (0.50) (-0.28) (0.60) (-1.44) (-1.71)
US_dummy 2.435*** -0.264 -0.350 -0.312 CEO_age -0.006 <-0.001 -0.005 -0.004(3.19) (-0.99) (-1.14) (-1.04) (-1.21) (-0.37) (-0.65) (-0.61)
PC_gov_board 0.033* 0.038*** 0.041*** 0.044*** CEO = COB 0.007 0.026 -0.172 -0.173(1.93) (2.43) (2.64) (2.85) (0.1) (1.00) (-1.49) (-1.53)
PC_gov_audit 0.045*** 0.042*** 0.042*** 0.041*** CEO_tenure 0.013 0.001 0.022* 0.018(2.82) (3.62) (3.60) (3.59) (1.48) (0.52) (1.63) (1.39)
Gold_price <-0.001 <-0.001 <-0.001 <-0.001 CEO_change 0.011 0.011 -0.192** -0.207**(-0.71) (-1.37) (-0.62) (-0.83) (0.18) (0.52) (-1.96) (-2.16)
US_dummy 0.277 -0.131 0.181 -3.854***(0.51) (-0.85) (0.27) (-4.89)
Gold_price 0.001*** <0.001 0.010*** 0.009***(2.49) (0.99) (11.25) (11.13)
Intercept -2.741*** -0.426 -0.551 -0.521 Intercept 0.231 0.337 -3.997*** -2.831***(-3.47) (-1.339) (-1.59) (-1.531) (0.42) (1.63) (-4.63) (-3.722)
Chi2 1234.97 2606.28 2532.84 2563.08 159.07 103.07 1759.06 9070.12P -value (0.00) (0.00) (0.00) (0.00) (0.00) (0.00) (0.00) (0.00)Observations 339.00 341 341 342 339 341 341 342
19