Embed Size (px)
Citation preview
THE GOOD TEACHER TRAINING
GUIDE 2008
Alan Smithers and Pamela Robinson
Centre for Education and Employment Research University of Buckingham
1. Introduction 1.1 The Good Teacher Training Guide is produced with a new title and in a new format
this year, but with the same purpose as its forerunners of providing a summary of the current state of teacher training. Each year since 1998 the Training and Development Agency for Schools, and its predecessor body the Teacher Training Agency, has produced a very extensive dataset covering the entry characteristics, Ofsted ratings and trainees’ take up of teaching posts of all the training providers. This is, however, so detailed that it can be hard to find your way round. The present report digests those data into some summarizing statistics. These are produced independently of the TDA and the methods are not endorsed by it, but the report has come to be a regular feature of the education calendar. It is widely used including in The Sunday Times Good University Guide, and potential trainees consult it as a preliminary to more detailed searches of the TDA website. Reports for previous years are available on the CEER website under the title of Teacher Training Profiles.
1.2 The methods by which the summary tables are produced are described in full in the appendix. But briefly they take three aspects of the teacher training providers - the inspection ratings given by Ofsted, the qualifications of the entrants and the percentage of the trainees in teaching in the January following completion of the training - and turn them into scores out of 200. These are standardised to a mean of 500 and a standard deviation of 100 and then summed across primary and secondary to give an overall provider score. All the PGCE providers including the universities and the school-based schemes are ranked on the same scale though for convenience the results of the universities and SCITTS are presented separately. In reading the tables it is important to remember that the TDA profiles are compiled nearly two years in arrears (to allow for the collection of the employment data) so the 2008 Profiles refer to the training year 2006-07. Although intakes to Key Stage 2/Key Stage 3 courses and to employment-based training are included in the national pictures presented these routes do not appear in the league tables because there is not the full information across entry, quality and employment. Some other providers are omitted for the same reason.
1.3 The report is organised in three sections. First the training providers are compared. Secondly, the comparisons are set in the context of the national picture and trends in teacher training since the first profiles were published and, thirdly, recruitment by subject.
2. Training Providers Compared Higher Education Institutions
2.1 Chart 1 shows the 73 universities (we use this term to cover all the university and college providers) ranked on teacher training. For each institution an overall score obtained by summing scores for entry qualifications, Ofsted ratings and employment in schools on scales with the means set to 500 and a standard deviation of 100 and combining for primary and secondary. The top positions are all occupied by the same universities that tend to head comparative tables generally. Since universities emerging from the former polytechnics and colleges of education specialise in teacher training this is something of a surprise.
2
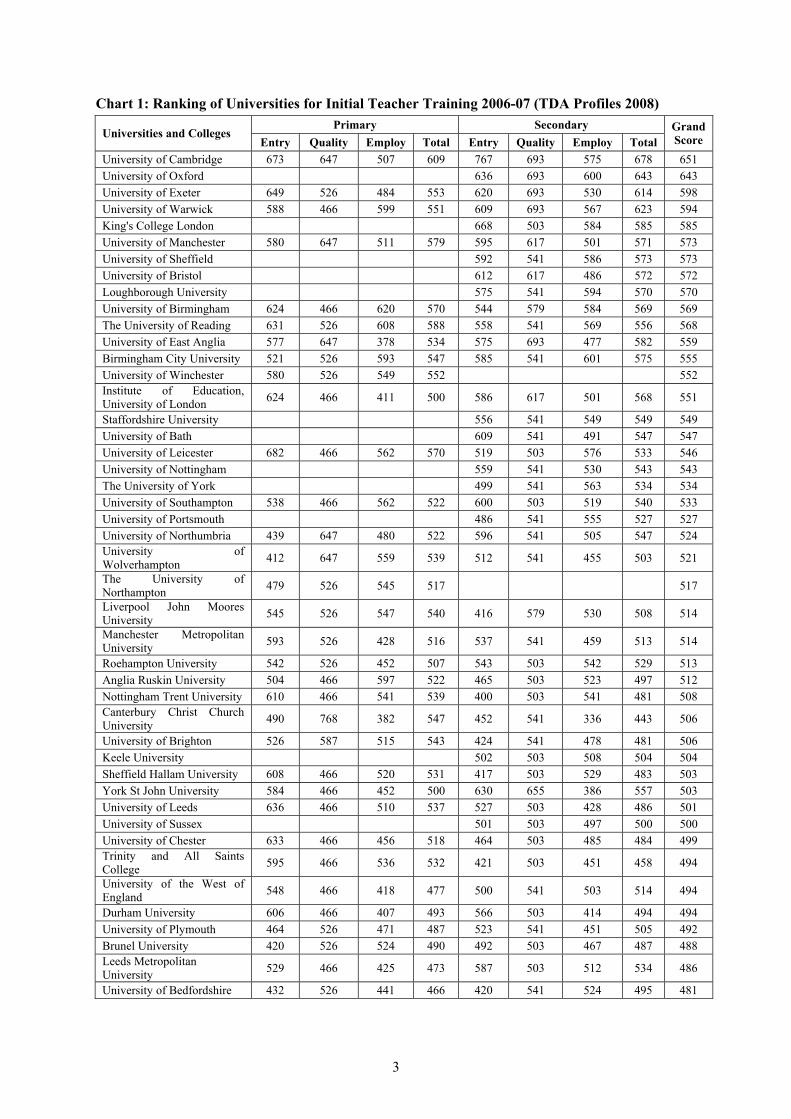
Chart 1: Ranking of Universities for Initial Teacher Training 2006-07 (TDA Profiles 2008) Primary Secondary
Universities and Colleges Entry Quality Employ Total Entry Quality Employ Total
Grand Score
University of Cambridge 673 647 507 609 767 693 575 678 651 University of Oxford 636 693 600 643 643 University of Exeter 649 526 484 553 620 693 530 614 598 University of Warwick 588 466 599 551 609 693 567 623 594 King's College London 668 503 584 585 585 University of Manchester 580 647 511 579 595 617 501 571 573 University of Sheffield 592 541 586 573 573 University of Bristol 612 617 486 572 572 Loughborough University 575 541 594 570 570 University of Birmingham 624 466 620 570 544 579 584 569 569 The University of Reading 631 526 608 588 558 541 569 556 568 University of East Anglia 577 647 378 534 575 693 477 582 559 Birmingham City University 521 526 593 547 585 541 601 575 555 University of Winchester 580 526 549 552 552 Institute of Education, University of London 624 466 411 500 586 617 501 568 551
Staffordshire University 556 541 549 549 549 University of Bath 609 541 491 547 547 University of Leicester 682 466 562 570 519 503 576 533 546 University of Nottingham 559 541 530 543 543 The University of York 499 541 563 534 534 University of Southampton 538 466 562 522 600 503 519 540 533 University of Portsmouth 486 541 555 527 527 University of Northumbria 439 647 480 522 596 541 505 547 524 University of Wolverhampton 412 647 559 539 512 541 455 503 521
The University of Northampton 479 526 545 517 517
Liverpool John Moores University 545 526 547 540 416 579 530 508 514
Manchester Metropolitan University 593 526 428 516 537 541 459 513 514
Roehampton University 542 526 452 507 543 503 542 529 513 Anglia Ruskin University 504 466 597 522 465 503 523 497 512 Nottingham Trent University 610 466 541 539 400 503 541 481 508 Canterbury Christ Church University 490 768 382 547 452 541 336 443 506
University of Brighton 526 587 515 543 424 541 478 481 506 Keele University 502 503 508 504 504 Sheffield Hallam University 608 466 520 531 417 503 529 483 503 York St John University 584 466 452 500 630 655 386 557 503 University of Leeds 636 466 510 537 527 503 428 486 501 University of Sussex 501 503 497 500 500 University of Chester 633 466 456 518 464 503 485 484 499 Trinity and All Saints College 595 466 536 532 421 503 451 458 494
University of the West of England 548 466 418 477 500 541 503 514 494
Durham University 606 466 407 493 566 503 414 494 494 University of Plymouth 464 526 471 487 523 541 451 505 492 Brunel University 420 526 524 490 492 503 467 487 488 Leeds Metropolitan University 529 466 425 473 587 503 512 534 486
University of Bedfordshire 432 526 441 466 420 541 524 495 481
3
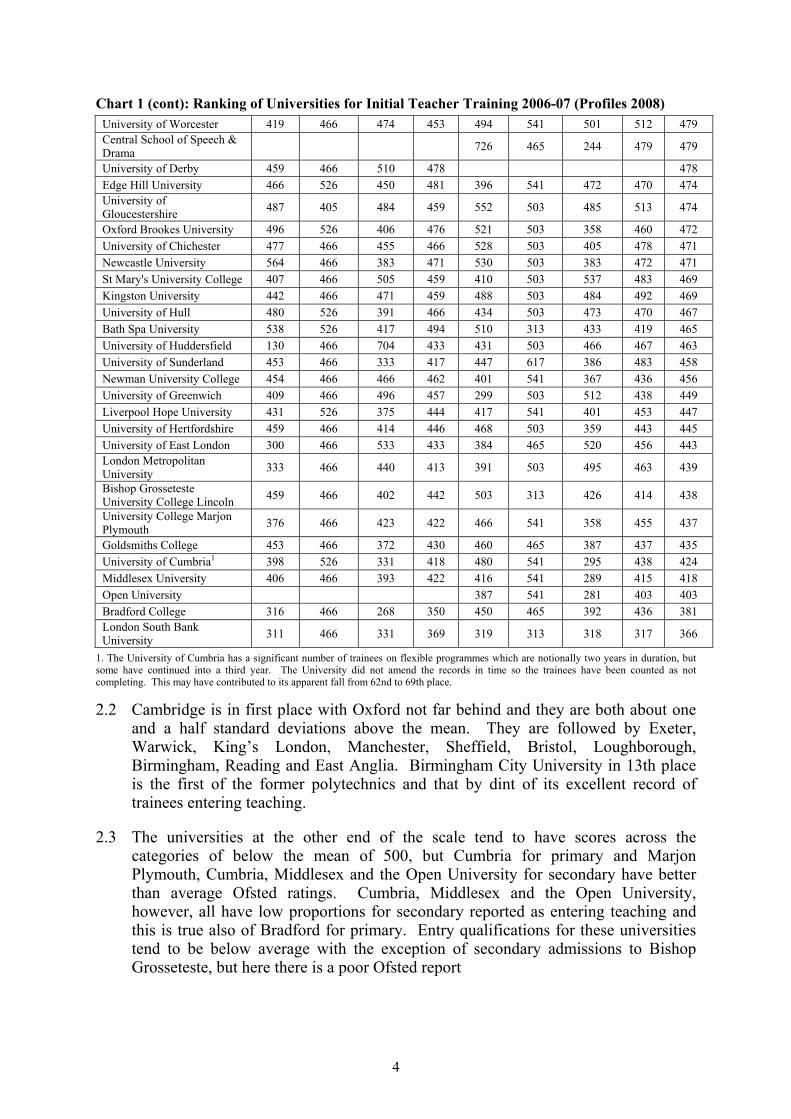
Chart 1 (cont): Ranking of Universities for Initial Teacher Training 2006-07 (Profiles 2008) University of Worcester 419 466 474 453 494 541 501 512 479 Central School of Speech & Drama 726 465 244 479 479
University of Derby 459 466 510 478 478 Edge Hill University 466 526 450 481 396 541 472 470 474 University of Gloucestershire 487 405 484 459 552 503 485 513 474
Oxford Brookes University 496 526 406 476 521 503 358 460 472 University of Chichester 477 466 455 466 528 503 405 478 471 Newcastle University 564 466 383 471 530 503 383 472 471 St Mary's University College 407 466 505 459 410 503 537 483 469 Kingston University 442 466 471 459 488 503 484 492 469 University of Hull 480 526 391 466 434 503 473 470 467 Bath Spa University 538 526 417 494 510 313 433 419 465 University of Huddersfield 130 466 704 433 431 503 466 467 463 University of Sunderland 453 466 333 417 447 617 386 483 458 Newman University College 454 466 466 462 401 541 367 436 456 University of Greenwich 409 466 496 457 299 503 512 438 449 Liverpool Hope University 431 526 375 444 417 541 401 453 447 University of Hertfordshire 459 466 414 446 468 503 359 443 445 University of East London 300 466 533 433 384 465 520 456 443 London Metropolitan University 333 466 440 413 391 503 495 463 439
Bishop Grosseteste University College Lincoln 459 466 402 442 503 313 426 414 438
University College Marjon Plymouth 376 466 423 422 466 541 358 455 437
Goldsmiths College 453 466 372 430 460 465 387 437 435 University of Cumbria1 398 526 331 418 480 541 295 438 424 Middlesex University 406 466 393 422 416 541 289 415 418 Open University 387 541 281 403 403 Bradford College 316 466 268 350 450 465 392 436 381 London South Bank University 311 466 331 369 319 313 318 317 366
1. The University of Cumbria has a significant number of trainees on flexible programmes which are notionally two years in duration, but some have continued into a third year. The University did not amend the records in time so the trainees have been counted as not completing. This may have contributed to its apparent fall from 62nd to 69th place.
2.2 Cambridge is in first place with Oxford not far behind and they are both about one and a half standard deviations above the mean. They are followed by Exeter, Warwick, King’s London, Manchester, Sheffield, Bristol, Loughborough, Birmingham, Reading and East Anglia. Birmingham City University in 13th place is the first of the former polytechnics and that by dint of its excellent record of trainees entering teaching.
2.3 The universities at the other end of the scale tend to have scores across the categories of below the mean of 500, but Cumbria for primary and Marjon Plymouth, Cumbria, Middlesex and the Open University for secondary have better than average Ofsted ratings. Cumbria, Middlesex and the Open University, however, all have low proportions for secondary reported as entering teaching and this is true also of Bradford for primary. Entry qualifications for these universities tend to be below average with the exception of secondary admissions to Bishop Grosseteste, but here there is a poor Ofsted report
4
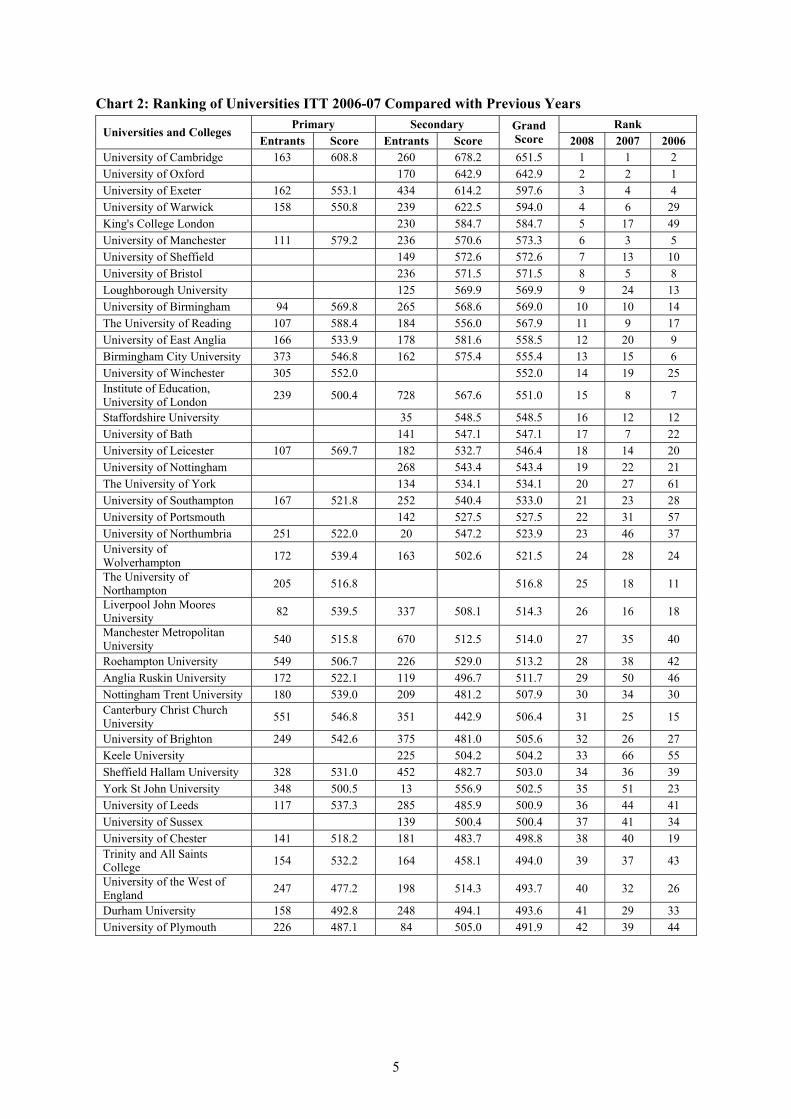
Chart 2: Ranking of Universities ITT 2006-07 Compared with Previous Years Primary Secondary Rank
Universities and Colleges Entrants Score Entrants Score
Grand Score 2008 2007 2006
University of Cambridge 163 608.8 260 678.2 651.5 1 1 2 University of Oxford 170 642.9 642.9 2 2 1 University of Exeter 162 553.1 434 614.2 597.6 3 4 4 University of Warwick 158 550.8 239 622.5 594.0 4 6 29 King's College London 230 584.7 584.7 5 17 49 University of Manchester 111 579.2 236 570.6 573.3 6 3 5 University of Sheffield 149 572.6 572.6 7 13 10 University of Bristol 236 571.5 571.5 8 5 8 Loughborough University 125 569.9 569.9 9 24 13 University of Birmingham 94 569.8 265 568.6 569.0 10 10 14 The University of Reading 107 588.4 184 556.0 567.9 11 9 17 University of East Anglia 166 533.9 178 581.6 558.5 12 20 9 Birmingham City University 373 546.8 162 575.4 555.4 13 15 6 University of Winchester 305 552.0 552.0 14 19 25 Institute of Education, University of London 239 500.4 728 567.6 551.0 15 8 7
Staffordshire University 35 548.5 548.5 16 12 12 University of Bath 141 547.1 547.1 17 7 22 University of Leicester 107 569.7 182 532.7 546.4 18 14 20 University of Nottingham 268 543.4 543.4 19 22 21 The University of York 134 534.1 534.1 20 27 61 University of Southampton 167 521.8 252 540.4 533.0 21 23 28 University of Portsmouth 142 527.5 527.5 22 31 57 University of Northumbria 251 522.0 20 547.2 523.9 23 46 37 University of Wolverhampton 172 539.4 163 502.6 521.5 24 28 24
The University of Northampton 205 516.8 516.8 25 18 11
Liverpool John Moores University 82 539.5 337 508.1 514.3 26 16 18
Manchester Metropolitan University 540 515.8 670 512.5 514.0 27 35 40
Roehampton University 549 506.7 226 529.0 513.2 28 38 42 Anglia Ruskin University 172 522.1 119 496.7 511.7 29 50 46 Nottingham Trent University 180 539.0 209 481.2 507.9 30 34 30 Canterbury Christ Church University 551 546.8 351 442.9 506.4 31 25 15
University of Brighton 249 542.6 375 481.0 505.6 32 26 27 Keele University 225 504.2 504.2 33 66 55 Sheffield Hallam University 328 531.0 452 482.7 503.0 34 36 39 York St John University 348 500.5 13 556.9 502.5 35 51 23 University of Leeds 117 537.3 285 485.9 500.9 36 44 41 University of Sussex 139 500.4 500.4 37 41 34 University of Chester 141 518.2 181 483.7 498.8 38 40 19 Trinity and All Saints College 154 532.2 164 458.1 494.0 39 37 43
University of the West of England 247 477.2 198 514.3 493.7 40 32 26
Durham University 158 492.8 248 494.1 493.6 41 29 33 University of Plymouth 226 487.1 84 505.0 491.9 42 39 44
5
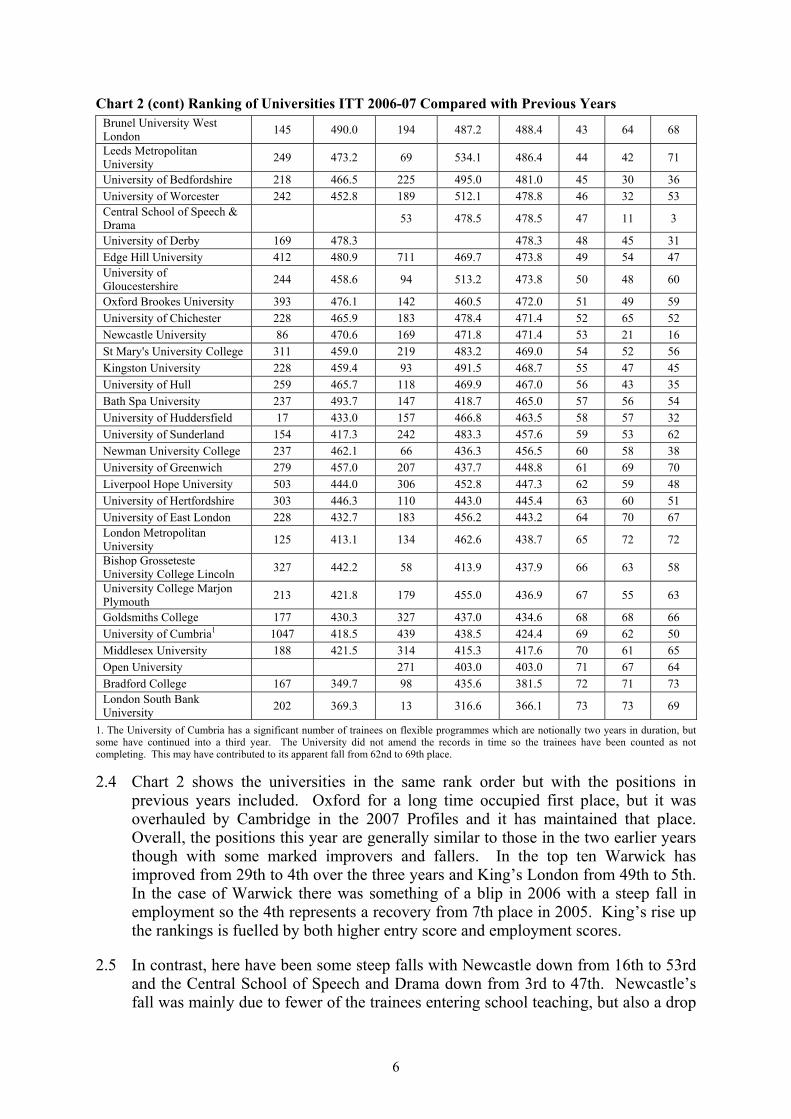
Chart 2 (cont) Ranking of Universities ITT 2006-07 Compared with Previous Years Brunel University West London 145 490.0 194 487.2 488.4 43 64 68
Leeds Metropolitan University 249 473.2 69 534.1 486.4 44 42 71
University of Bedfordshire 218 466.5 225 495.0 481.0 45 30 36 University of Worcester 242 452.8 189 512.1 478.8 46 32 53 Central School of Speech & Drama 53 478.5 478.5 47 11 3
University of Derby 169 478.3 478.3 48 45 31 Edge Hill University 412 480.9 711 469.7 473.8 49 54 47 University of Gloucestershire 244 458.6 94 513.2 473.8 50 48 60
Oxford Brookes University 393 476.1 142 460.5 472.0 51 49 59 University of Chichester 228 465.9 183 478.4 471.4 52 65 52 Newcastle University 86 470.6 169 471.8 471.4 53 21 16 St Mary's University College 311 459.0 219 483.2 469.0 54 52 56 Kingston University 228 459.4 93 491.5 468.7 55 47 45 University of Hull 259 465.7 118 469.9 467.0 56 43 35 Bath Spa University 237 493.7 147 418.7 465.0 57 56 54 University of Huddersfield 17 433.0 157 466.8 463.5 58 57 32 University of Sunderland 154 417.3 242 483.3 457.6 59 53 62 Newman University College 237 462.1 66 436.3 456.5 60 58 38 University of Greenwich 279 457.0 207 437.7 448.8 61 69 70 Liverpool Hope University 503 444.0 306 452.8 447.3 62 59 48 University of Hertfordshire 303 446.3 110 443.0 445.4 63 60 51 University of East London 228 432.7 183 456.2 443.2 64 70 67 London Metropolitan University 125 413.1 134 462.6 438.7 65 72 72
Bishop Grosseteste University College Lincoln 327 442.2 58 413.9 437.9 66 63 58
University College Marjon Plymouth 213 421.8 179 455.0 436.9 67 55 63
Goldsmiths College 177 430.3 327 437.0 434.6 68 68 66 University of Cumbria1 1047 418.5 439 438.5 424.4 69 62 50 Middlesex University 188 421.5 314 415.3 417.6 70 61 65 Open University 271 403.0 403.0 71 67 64 Bradford College 167 349.7 98 435.6 381.5 72 71 73 London South Bank University 202 369.3 13 316.6 366.1 73 73 69
1. The University of Cumbria has a significant number of trainees on flexible programmes which are notionally two years in duration, but some have continued into a third year. The University did not amend the records in time so the trainees have been counted as not completing. This may have contributed to its apparent fall from 62nd to 69th place.
2.4 Chart 2 shows the universities in the same rank order but with the positions in previous years included. Oxford for a long time occupied first place, but it was overhauled by Cambridge in the 2007 Profiles and it has maintained that place. Overall, the positions this year are generally similar to those in the two earlier years though with some marked improvers and fallers. In the top ten Warwick has improved from 29th to 4th over the three years and King’s London from 49th to 5th. In the case of Warwick there was something of a blip in 2006 with a steep fall in employment so the 4th represents a recovery from 7th place in 2005. King’s rise up the rankings is fuelled by both higher entry score and employment scores.
2.5 In contrast, here have been some steep falls with Newcastle down from 16th to 53rd and the Central School of Speech and Drama down from 3rd to 47th. Newcastle’s fall was mainly due to fewer of the trainees entering school teaching, but also a drop
6
in entry qualifications to secondary. The position of the Central School tends to fluctuate because it is small, but in the 2008 Profiles it had the lowest proportion of all the providers for teachers entering teaching.
2.6 Chart 2 also shows the numbers of trainees by institution. The new universities tend to the largest providers. In 2006-07, Cumbria had an intake of 1,486, Manchester Metropolitan, 1,210, Edge Hill, 1,123, Canterbury Christ Church, 902, and Roehampton, 775. Nevertheless, with the exception of Canterbury Christ Church which has the highest Ofsted rating for primary, it is the older established universities with the smaller courses that tend to lead the rankings.
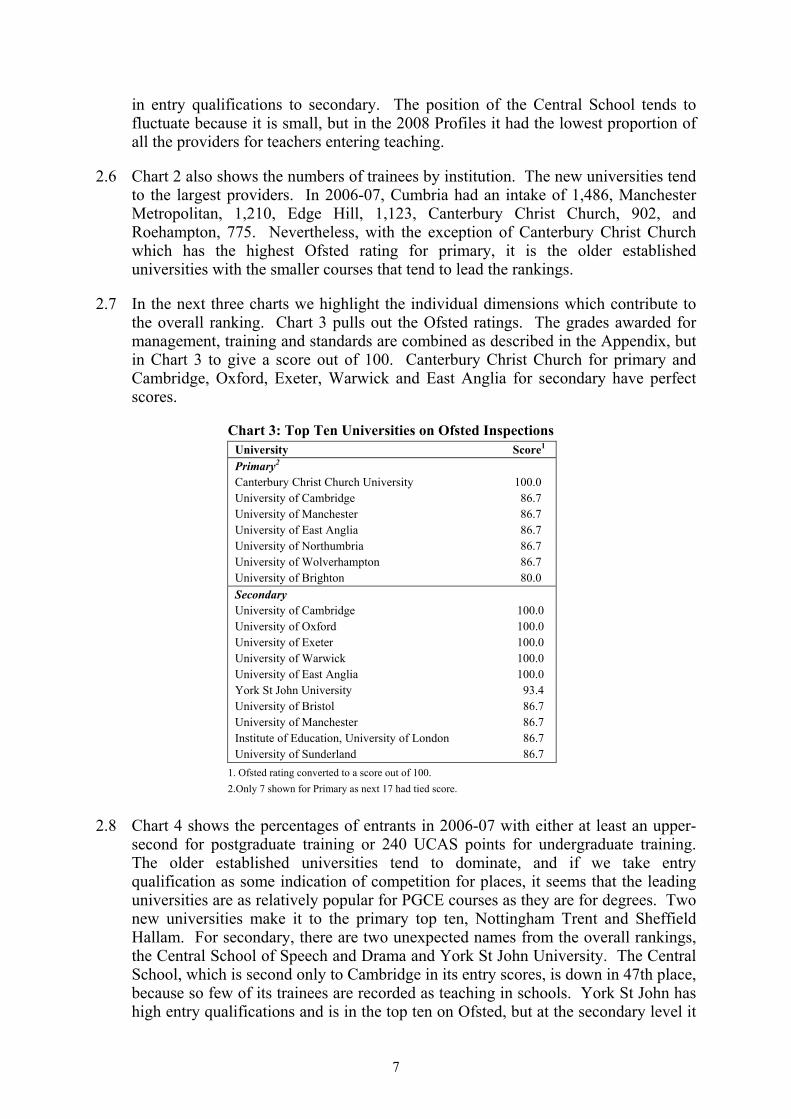
2.7 In the next three charts we highlight the individual dimensions which contribute to the overall ranking. Chart 3 pulls out the Ofsted ratings. The grades awarded for management, training and standards are combined as described in the Appendix, but in Chart 3 to give a score out of 100. Canterbury Christ Church for primary and Cambridge, Oxford, Exeter, Warwick and East Anglia for secondary have perfect scores.
Chart 3: Top Ten Universities on Ofsted Inspections University Score1 Primary2 Canterbury Christ Church University 100.0 University of Cambridge 86.7 University of Manchester 86.7 University of East Anglia 86.7 University of Northumbria 86.7 University of Wolverhampton 86.7 University of Brighton 80.0 Secondary University of Cambridge 100.0 University of Oxford 100.0 University of Exeter 100.0 University of Warwick 100.0 University of East Anglia 100.0 York St John University 93.4 University of Bristol 86.7 University of Manchester 86.7 Institute of Education, University of London 86.7 University of Sunderland 86.7
1. Ofsted rating converted to a score out of 100. 2.Only 7 shown for Primary as next 17 had tied score.
2.8 Chart 4 shows the percentages of entrants in 2006-07 with either at least an upper-second for postgraduate training or 240 UCAS points for undergraduate training. The older established universities tend to dominate, and if we take entry qualification as some indication of competition for places, it seems that the leading universities are as relatively popular for PGCE courses as they are for degrees. Two new universities make it to the primary top ten, Nottingham Trent and Sheffield Hallam. For secondary, there are two unexpected names from the overall rankings, the Central School of Speech and Drama and York St John University. The Central School, which is second only to Cambridge in its entry scores, is down in 47th place, because so few of its trainees are recorded as teaching in schools. York St John has high entry qualifications and is in the top ten on Ofsted, but at the secondary level it
7
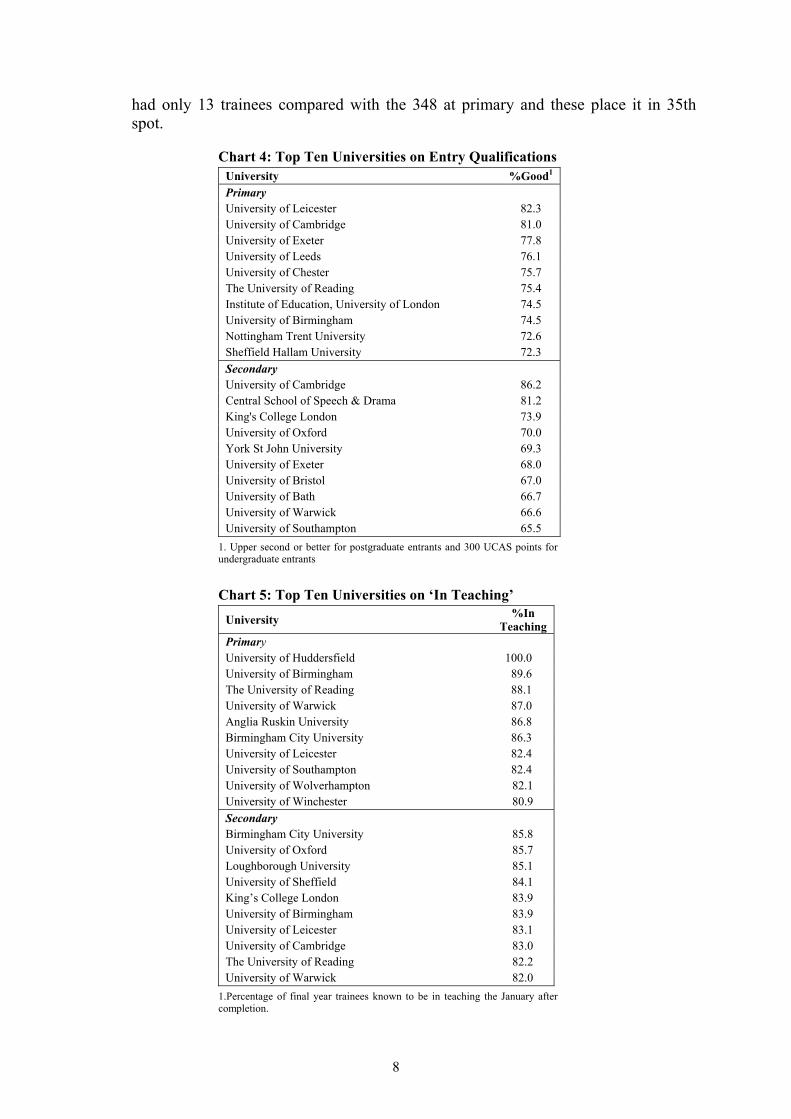
had only 13 trainees compared with the 348 at primary and these place it in 35th spot.
Chart 4: Top Ten Universities on Entry Qualifications University %Good1 Primary University of Leicester 82.3 University of Cambridge 81.0 University of Exeter 77.8 University of Leeds 76.1 University of Chester 75.7 The University of Reading 75.4 Institute of Education, University of London 74.5 University of Birmingham 74.5 Nottingham Trent University 72.6 Sheffield Hallam University 72.3 Secondary University of Cambridge 86.2 Central School of Speech & Drama 81.2 King's College London 73.9 University of Oxford 70.0 York St John University 69.3 University of Exeter 68.0 University of Bristol 67.0 University of Bath 66.7 University of Warwick 66.6 University of Southampton 65.5
1. Upper second or better for postgraduate entrants and 300 UCAS points for undergraduate entrants
Chart 5: Top Ten Universities on ‘In Teaching’
University %In Teaching
Primary University of Huddersfield 100.0 University of Birmingham 89.6 The University of Reading 88.1 University of Warwick 87.0 Anglia Ruskin University 86.8 Birmingham City University 86.3 University of Leicester 82.4 University of Southampton 82.4 University of Wolverhampton 82.1 University of Winchester 80.9 Secondary Birmingham City University 85.8 University of Oxford 85.7 Loughborough University 85.1 University of Sheffield 84.1 King’s College London 83.9 University of Birmingham 83.9 University of Leicester 83.1 University of Cambridge 83.0 The University of Reading 82.2 University of Warwick 82.0
1.Percentage of final year trainees known to be in teaching the January after completion.
8
2.9 Chart 5 completes the trinity of dimensions, focusing on the proportion of the final year trainees in teaching in the January following completion. Many of the same universities that ranked high on Ofsted ratings and entry qualifications appear again, but some others come through particularly in the primary phase. Birmingham City University has relative to other institutions high proportions of both its primary and secondary trainees taking posts in schools. But particularly notable is Huddersfield since on its small primary course not only do all the trainees successfully complete but they also have been tracked into schools.
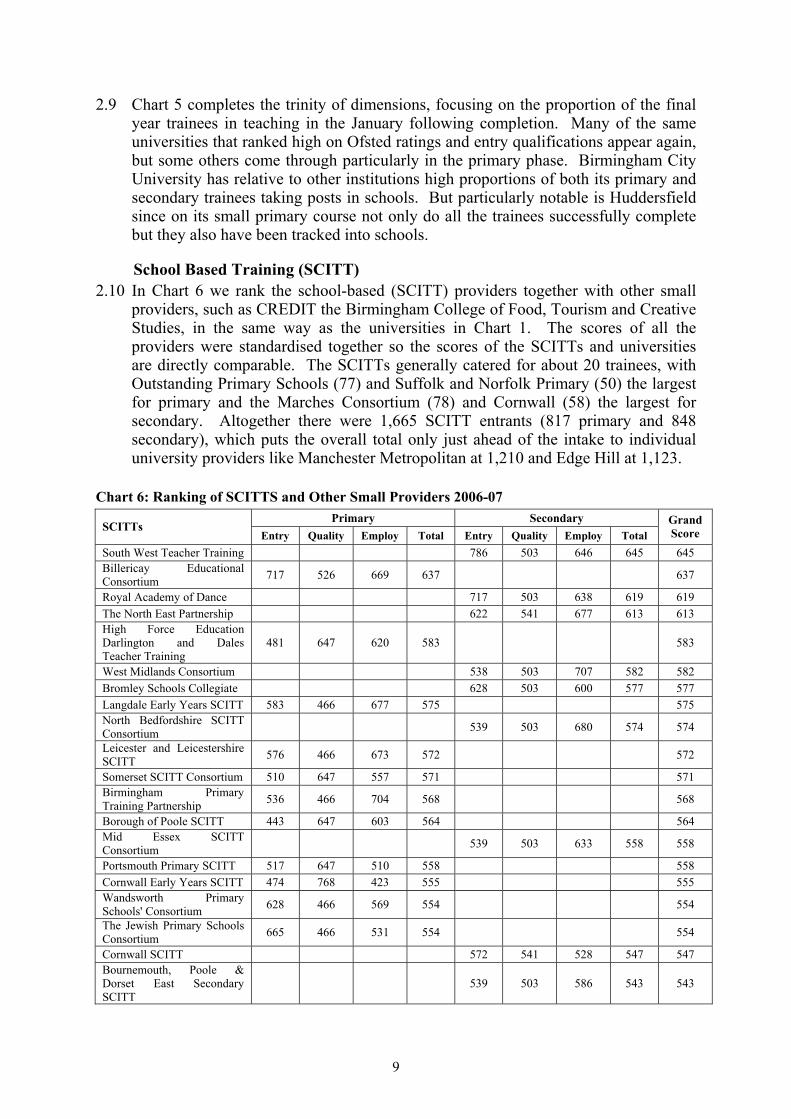
School Based Training (SCITT) 2.10 In Chart 6 we rank the school-based (SCITT) providers together with other small
providers, such as CREDIT the Birmingham College of Food, Tourism and Creative Studies, in the same way as the universities in Chart 1. The scores of all the providers were standardised together so the scores of the SCITTs and universities are directly comparable. The SCITTs generally catered for about 20 trainees, with Outstanding Primary Schools (77) and Suffolk and Norfolk Primary (50) the largest for primary and the Marches Consortium (78) and Cornwall (58) the largest for secondary. Altogether there were 1,665 SCITT entrants (817 primary and 848 secondary), which puts the overall total only just ahead of the intake to individual university providers like Manchester Metropolitan at 1,210 and Edge Hill at 1,123.
Chart 6: Ranking of SCITTS and Other Small Providers 2006-07 Primary Secondary
SCITTs Entry Quality Employ Total Entry Quality Employ Total
GrandScore
South West Teacher Training 786 503 646 645 645 Billericay Educational Consortium 717 526 669 637 637
Royal Academy of Dance 717 503 638 619 619 The North East Partnership 622 541 677 613 613 High Force Education Darlington and Dales Teacher Training
481 647 620 583 583
West Midlands Consortium 538 503 707 582 582 Bromley Schools Collegiate 628 503 600 577 577 Langdale Early Years SCITT 583 466 677 575 575 North Bedfordshire SCITT Consortium 539 503 680 574 574
Leicester and Leicestershire SCITT 576 466 673 572 572
Somerset SCITT Consortium 510 647 557 571 571 Birmingham Primary Training Partnership 536 466 704 568 568
Borough of Poole SCITT 443 647 603 564 564 Mid Essex SCITT Consortium 539 503 633 558 558
Portsmouth Primary SCITT 517 647 510 558 558 Cornwall Early Years SCITT 474 768 423 555 555 Wandsworth Primary Schools' Consortium 628 466 569 554 554
The Jewish Primary Schools Consortium 665 466 531 554 554
Cornwall SCITT 572 541 528 547 547 Bournemouth, Poole & Dorset East Secondary SCITT
539 503 586 543 543
9
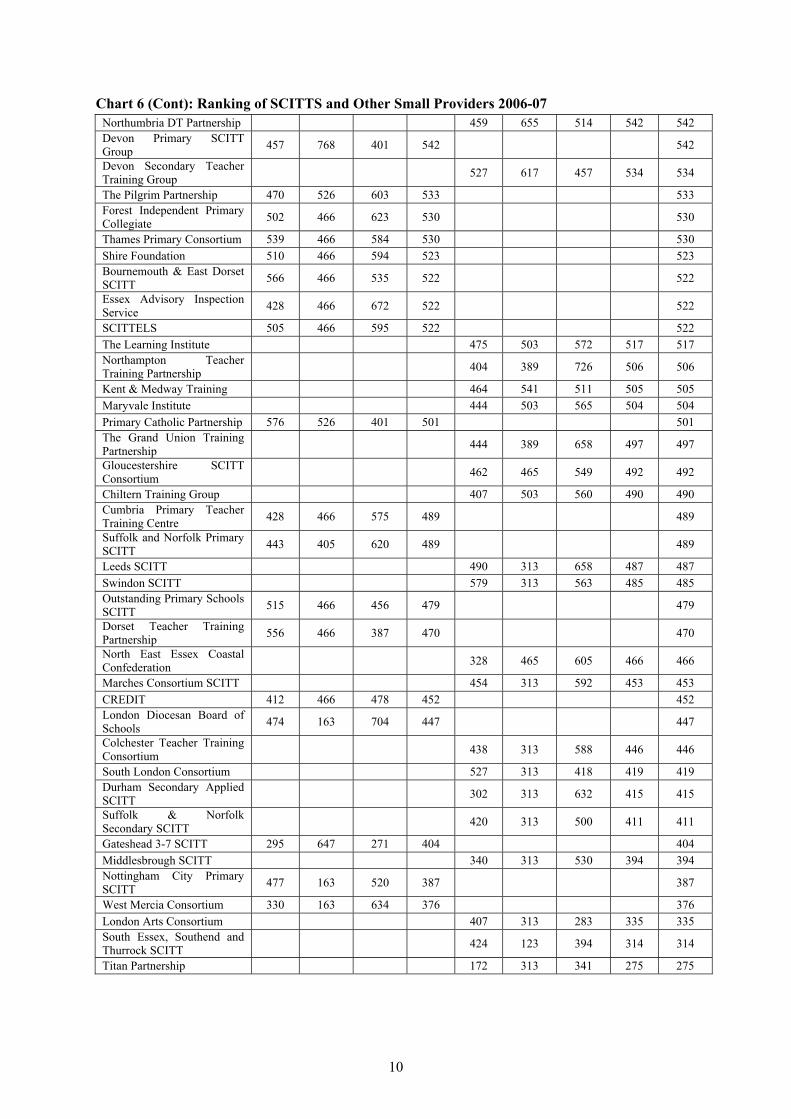
Chart 6 (Cont): Ranking of SCITTS and Other Small Providers 2006-07 Northumbria DT Partnership 459 655 514 542 542 Devon Primary SCITT Group 457 768 401 542 542
Devon Secondary Teacher Training Group 527 617 457 534 534
The Pilgrim Partnership 470 526 603 533 533 Forest Independent Primary Collegiate 502 466 623 530 530
Thames Primary Consortium 539 466 584 530 530 Shire Foundation 510 466 594 523 523 Bournemouth & East Dorset SCITT 566 466 535 522 522
Essex Advisory Inspection Service 428 466 672 522 522
SCITTELS 505 466 595 522 522 The Learning Institute 475 503 572 517 517 Northampton Teacher Training Partnership 404 389 726 506 506
Kent & Medway Training 464 541 511 505 505 Maryvale Institute 444 503 565 504 504 Primary Catholic Partnership 576 526 401 501 501 The Grand Union Training Partnership 444 389 658 497 497
Gloucestershire SCITT Consortium 462 465 549 492 492
Chiltern Training Group 407 503 560 490 490 Cumbria Primary Teacher Training Centre 428 466 575 489 489
Suffolk and Norfolk Primary SCITT 443 405 620 489 489
Leeds SCITT 490 313 658 487 487 Swindon SCITT 579 313 563 485 485 Outstanding Primary Schools SCITT 515 466 456 479 479
Dorset Teacher Training Partnership 556 466 387 470 470
North East Essex Coastal Confederation 328 465 605 466 466
Marches Consortium SCITT 454 313 592 453 453 CREDIT 412 466 478 452 452 London Diocesan Board of Schools 474 163 704 447 447
Colchester Teacher Training Consortium 438 313 588 446 446
South London Consortium 527 313 418 419 419 Durham Secondary Applied SCITT 302 313 632 415 415
Suffolk & Norfolk Secondary SCITT 420 313 500 411 411
Gateshead 3-7 SCITT 295 647 271 404 404 Middlesbrough SCITT 340 313 530 394 394 Nottingham City Primary SCITT 477 163 520 387 387
West Mercia Consortium 330 163 634 376 376 London Arts Consortium 407 313 283 335 335
424 123 394 314 314
Titan Partnership 172 313 341 275 275
South Essex, Southend and Thurrock SCITT
10
2.11 Although small the better performing SCITTS rank along with Cambridge and Oxford in the overall quality of their provision. The Billericay Educational consortium obtained the highest of all primary scores at 637 ahead even of Cambridge. For secondary South West Teacher Training at 645 was below Cambridge but just above Oxford. In the secondary phase also the Royal Academy of Dance and the North East Partnership also achieved at more than one standard deviation above the mean rivalling Warwick and Exeter Universities. The top performing SCITTS tended to score higher than the universities on entry qualifications and transition to teaching, but get somewhat lower rating from Ofsted. At the other end of the scale, four secondary SCITTs (Middlesborough, London Arts Consortium, South Essex, Southend and Thurrock, and Titan Partnership) scored at below one standard deviation from the mean compared with just one university (London South Bank). Two of the primary SCITTs (Nottingham City Primary and West Mercia) scored below 400 (-1SD) along with two higher education institutions (Bradford College and London South Bank).
3. National Picture and Trends 3.1 So far we have been comparing the individual providers. In this section we draw the
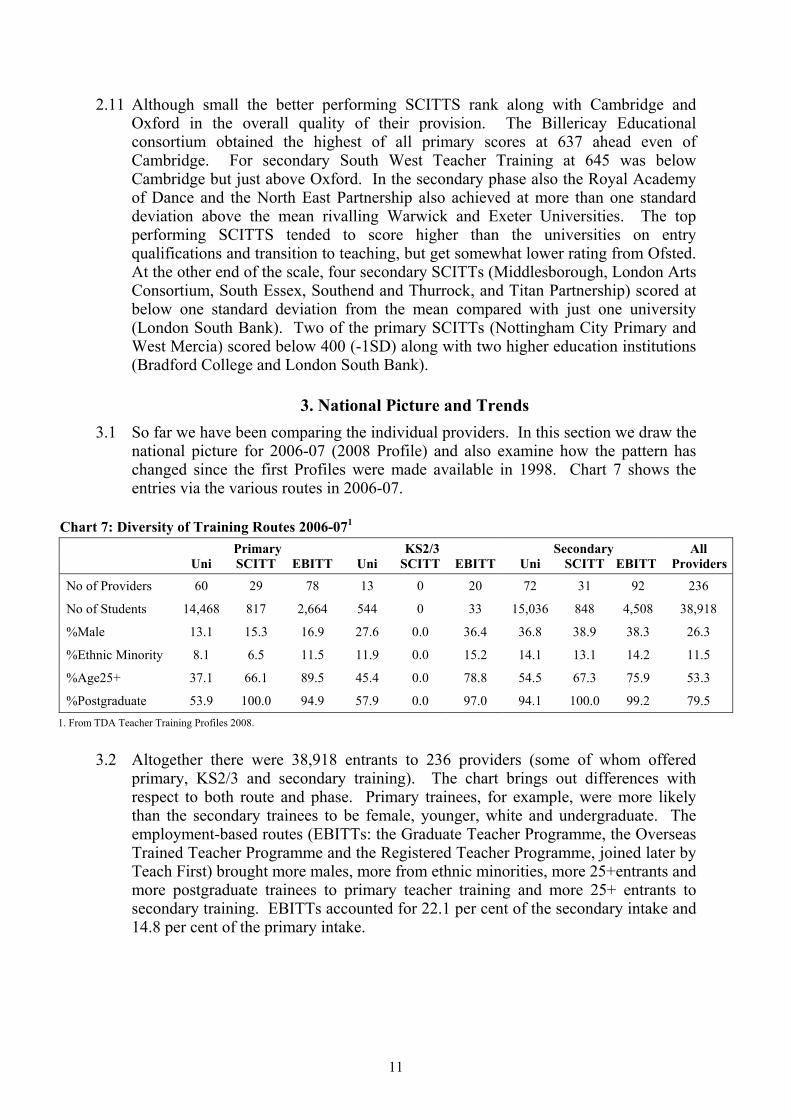
national picture for 2006-07 (2008 Profile) and also examine how the pattern has changed since the first Profiles were made available in 1998. Chart 7 shows the entries via the various routes in 2006-07.
Chart 7: Diversity of Training Routes 2006-071 Primary KS2/3 Secondary All Uni SCITT EBITT Uni SCITT EBITT Uni SCITT EBITT Providers
No of Providers 60 29 78 13 0 20 72 31 92 236
No of Students 14,468 817 2,664 544 0 33 15,036 848 4,508 38,918
%Male 13.1 15.3 16.9 27.6 0.0 36.4 36.8 38.9 38.3 26.3
%Ethnic Minority 8.1 6.5 11.5 11.9 0.0 15.2 14.1 13.1 14.2 11.5
%Age25+ 37.1 66.1 89.5 45.4 0.0 78.8 54.5 67.3 75.9 53.3
%Postgraduate 53.9 100.0 94.9 57.9 0.0 97.0 94.1 100.0 99.2 79.5 1. From TDA Teacher Training Profiles 2008.
3.2 Altogether there were 38,918 entrants to 236 providers (some of whom offered primary, KS2/3 and secondary training). The chart brings out differences with respect to both route and phase. Primary trainees, for example, were more likely than the secondary trainees to be female, younger, white and undergraduate. The employment-based routes (EBITTs: the Graduate Teacher Programme, the Overseas Trained Teacher Programme and the Registered Teacher Programme, joined later by Teach First) brought more males, more from ethnic minorities, more 25+entrants and more postgraduate trainees to primary teacher training and more 25+ entrants to secondary training. EBITTs accounted for 22.1 per cent of the secondary intake and 14.8 per cent of the primary intake.
11
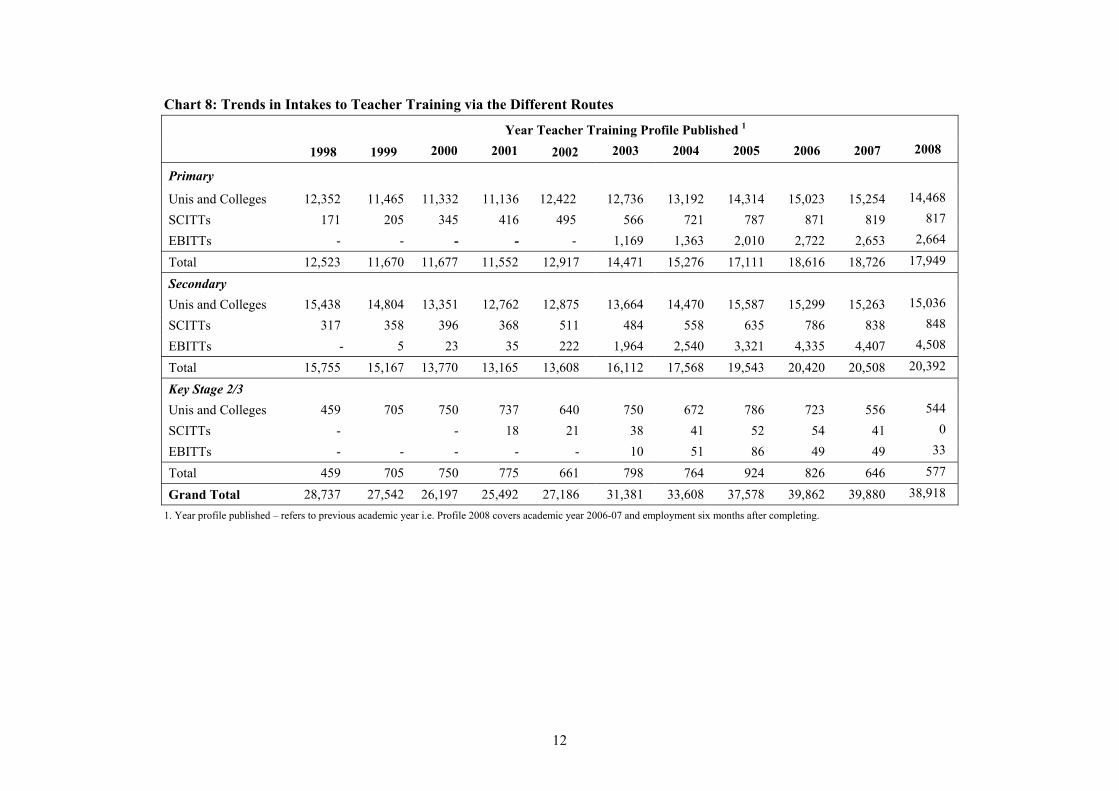
Chart 8: Trends in Intakes to Teacher Training via the Different Routes
Year Teacher Training Profile Published 1 1998 1999 2000 2001 2002 2003 2004 2005 2006 2007 2008
Primary
Unis and Colleges 12,352 11,465 11,332 11,136 12,422 12,736 13,192 14,314 15,023 15,254 14,468
SCITTs 171 205 345 416 495 566 721 787 871 819 817
EBITTs - - - - - 1,169 1,363 2,010 2,722 2,653 2,664
Total 12,523 11,670 11,677 11,552 12,917 14,471 15,276 17,111 18,616 18,726 17,949
Secondary Unis and Colleges 15,438 14,804 13,351 12,762 12,875 13,664 14,470 15,587 15,299 15,263 15,036
SCITTs 317 358 396 368 511 484 558 635 786 838 848
EBITTs - 5 23 35 222 1,964 2,540 3,321 4,335 4,407 4,508
Total 15,755 15,167 13,770 13,165 13,608 16,112 17,568 19,543 20,420 20,508 20,392
Key Stage 2/3 Unis and Colleges 459 705 750 737 640 750 672 786 723 556 544
SCITTs - - 18 21 38 41 52 54 41 0
EBITTs - - - - - 10 51 86 49 49 33
Total 459 705 750 775 661 798 764 924 826 646 577
Grand Total 28,737 27,542 26,197 25,492 27,186 31,381 33,608 37,578 39,862 39,880 38,918 1. Year profile published – refers to previous academic year i.e. Profile 2008 covers academic year 2006-07 and employment six months after completing.
12
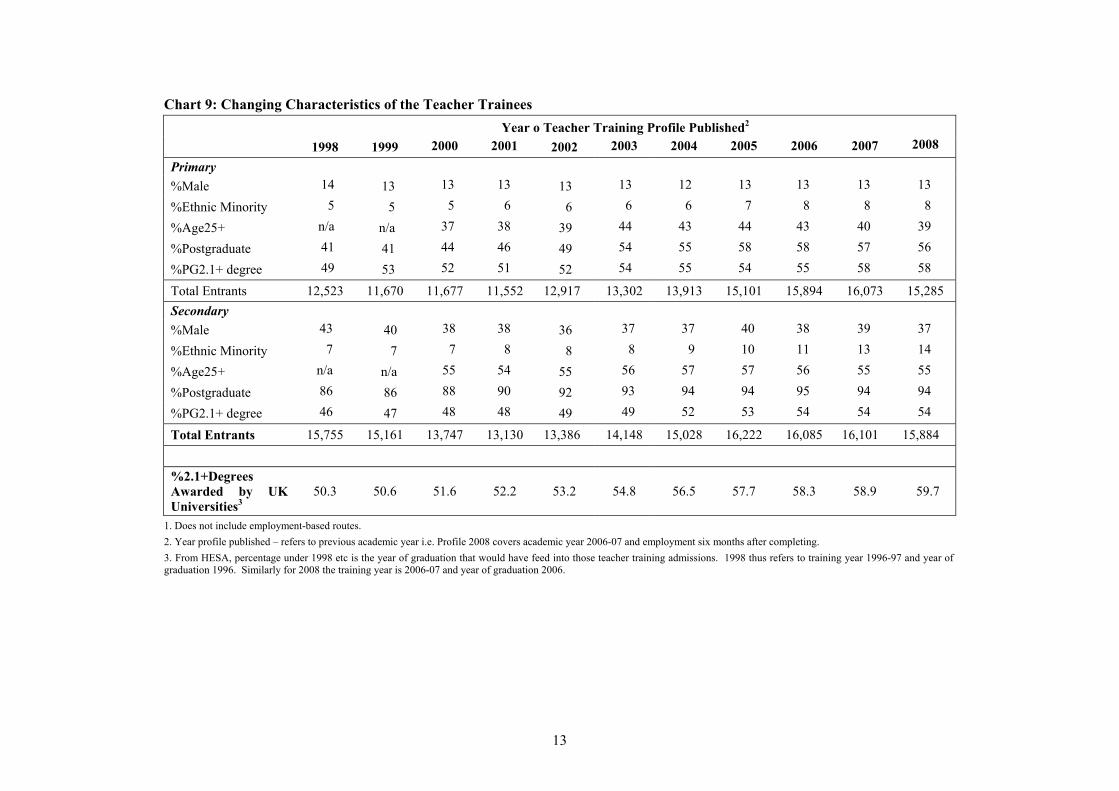
Chart 9: Changing Characteristics of the Teacher Trainees Year o Teacher Training Profile Published2
1998 1999 2000 2001 2002 2003 2004 2005 2006 2007 2008
Primary %Male 14 13 13 13 13 13 12 13 13 13 13
%Ethnic Minority 5 5 5 6 6 6 6 7 8 8 8
%Age25+ n/a n/a 37 38 39 44 43 44 43 40 39
%Postgraduate 41 41 44 46 49 54 55 58 58 57 56
%PG2.1+ degree 49 53 52 51 52 54 55 54 55 58 58
Total Entrants 12,523 11,670 11,677 11,552 12,917 13,302 13,913 15,101 15,894 16,073 15,285Secondary %Male 43 40 38 38 36 37 37 40 38 39 37
%Ethnic Minority 7 7 7 8 8 8 9 10 11 13 14
%Age25+ n/a n/a 55 54 55 56 57 57 56 55 55
%Postgraduate 86 86 88 90 92 93 94 94 95 94 94
%PG2.1+ degree 46 47 48 48 49 49 52 53 54 54 54
Total Entrants 15,755 15,161 13,747 13,130 13,386 14,148 15,028 16,222 16,085 16,101 15,884
%2.1+Degrees Awarded by UK Universities3
50.3 50.6 51.6 52.2 53.2 54.8 56.5 57.7 58.3 58.9 59.7
1. Does not include employment-based routes. 2. Year profile published – refers to previous academic year i.e. Profile 2008 covers academic year 2006-07 and employment six months after completing. 3. From HESA, percentage under 1998 etc is the year of graduation that would have feed into those teacher training admissions. 1998 thus refers to training year 1996-97 and year of graduation 1996. Similarly for 2008 the training year is 2006-07 and year of graduation 2006.
13
3.3 In Chart 8 we compare the intake in 2006-07 (2008 Profile) with those of previous years. Over the 11 years for which the Profiles have been published the intake has grown from 28,737 to 38,918 (35.4 per cent). In the secondary phase this has occurred outside the universities through the development of employment-based routes. There was a rapid expansion of EBITT intake between 2002 and 2006, but for the last three years entries have grown only slowly. The same is true for the primary phase where EBITT entries have plateaued, but since 1998 there has also been some increase in the university entry. This difference between primary and secondary probably reflects differences in demand. It has never been difficult to meet primary training targets and the universities have pressed to expand, but recruitment to university secondary teacher training is frequently below target particularly in subjects like maths, languages and the physical sciences.
3.4 Chart 9 shows the trends in the characteristics of the PGCE trainees (does not include EBITTs) over the 11 years, 1996-7 (Profile 1998) to 2006-07 (Profile 2008). Some characteristics remained remarkably similar. The percentage of males recruited to primary PGCE courses (universities and SCITTs) remained at about 13 per cent and the proportion of older trainees (25+) remained around 55 per cent for secondary. The male intake to secondary training fell somewhat. On the other hand the ethnic minority intake to secondary training doubled from seven to 14 per cent and increased in primary from five to eight per cent. The respective proportions of undergraduate and postgraduate trainees reflect government policy to switch to the latter.
3.5 But the most noticeable and most publicised changing characteristic is the proportion of entrants to PGCE courses with good degrees (first and upper-second). Chart 9 shows that on our calculation it rose from 49 to 58 per cent in primary and 46 to 54 per cent in secondary. However we need to bear in mind as chart 9 also makes clear the proportion of good degrees awarded has risen from 50 to 60 per cent over that period. Thus teaching has held its relative position compared with other graduate occupations, but not significantly improved it.
3.6 It is possible to calculate the percentage of trainees with good degrees in another way which presents a somewhat more favourable picture. Some of the trainees do not hold UK degrees either because they have been admitted on an equivalent qualification or one obtained at an overseas university. In 2006-07 this applied to 5.8% of the primary entrants and 6.4% of the secondary entrants. If these are omitted the overall percentage of UK graduates on PGCE courses with good degrees becomes 58.7 per cent just below the 59.7 per cent awarded in the relevant year (see footnote 3 to Chart 9). Incidentally, 37.7 per cent of the EBITT intake which includes the Overseas Trained Teachers programme does not hold UK degrees, but this does not affect Chart 9 which describes PGCE course only (EBITTs lead to qualified teacher status but not the award of a PGCE). It is easy to get lost in the statistics but the important point is that the apparent improvement in the degree classes of trainee teachers is a reflection of the increase in the top degree classes awarded.
3.7 About one in twelve of the trainees assessed themselves to have a disability in one of ten categories from dyslexia, partially sighted, hearing impairment, wheelchair user,
14
personal care support, mental health difficulties, an unseen disability, multiple disabilities, a disability not listed above to autistic spectrum disorder. This applied to 7.2 per cent of primary PGCE trainees and 8.5 per cent of secondary PGCE trainees. There was a wide range between the institutions with some providing for 20 per cent or more and others without any.
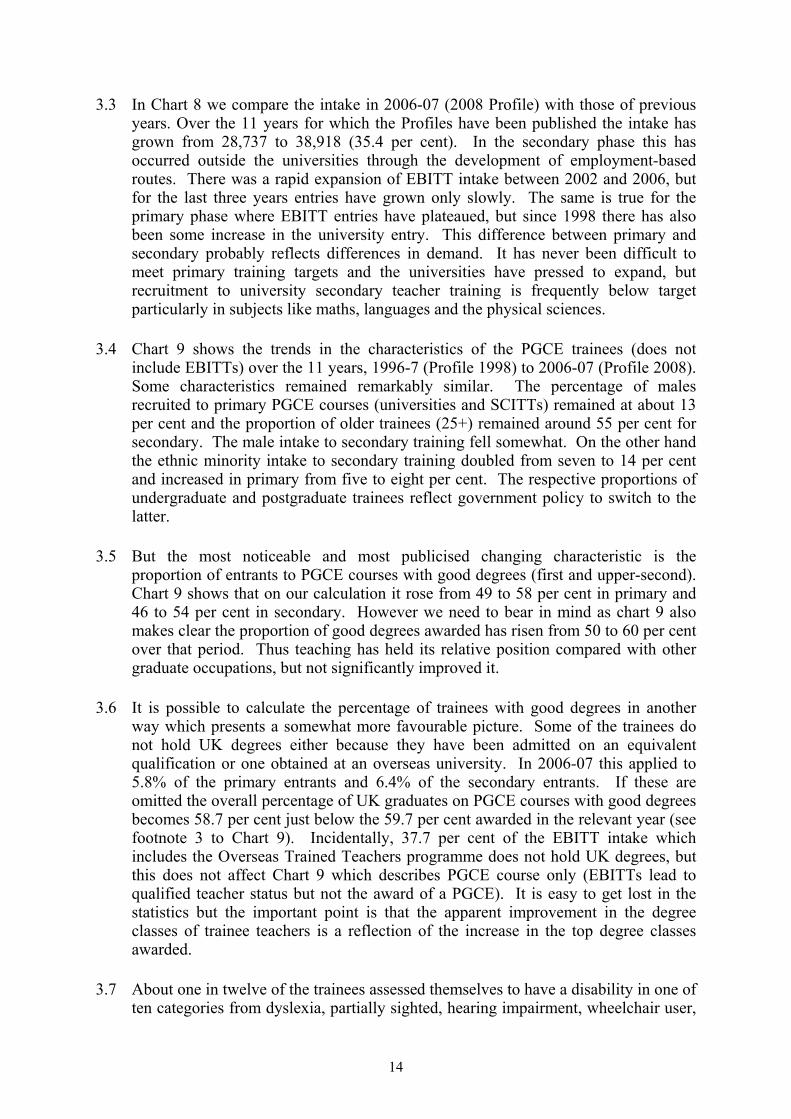
4. Subjects 4.1 The entry qualifications to the different secondary subjects varied widely. Charts 9
and 10 illustrate the range. Chart 10 shows the proportion of the trainees (HEI, SCITT and EBITT) with a good degree. At one end of the spectrum in classics, social studies, history and English two-thirds or more of the trainees have a good degree (91 per cent in the case of classics). At the other vocational courses, mathematics, ICT and languages are barely above 40 per cent (in the case of vocational subjects, 39.2 per cent).
0
10
20
30
40
50
60
70
80
90
100
Per C
ent 2
.1+
Classic
s
SocSci/
Stu
History
English
Drama/D
ance
Other(EBITT)
Citizen
ship
Art&Des
ign
Geograp
hyMusic RE
Science PE
D&T
Busines
s St
MFL ICT
Mathem
atics
Vocatio
nal
Chart 10: Per Cent of Postgraduate Intake1 with Good Degrees
1. Includes all providers (HEIs, SCITTs, EBITTs) of secondary teacher training.
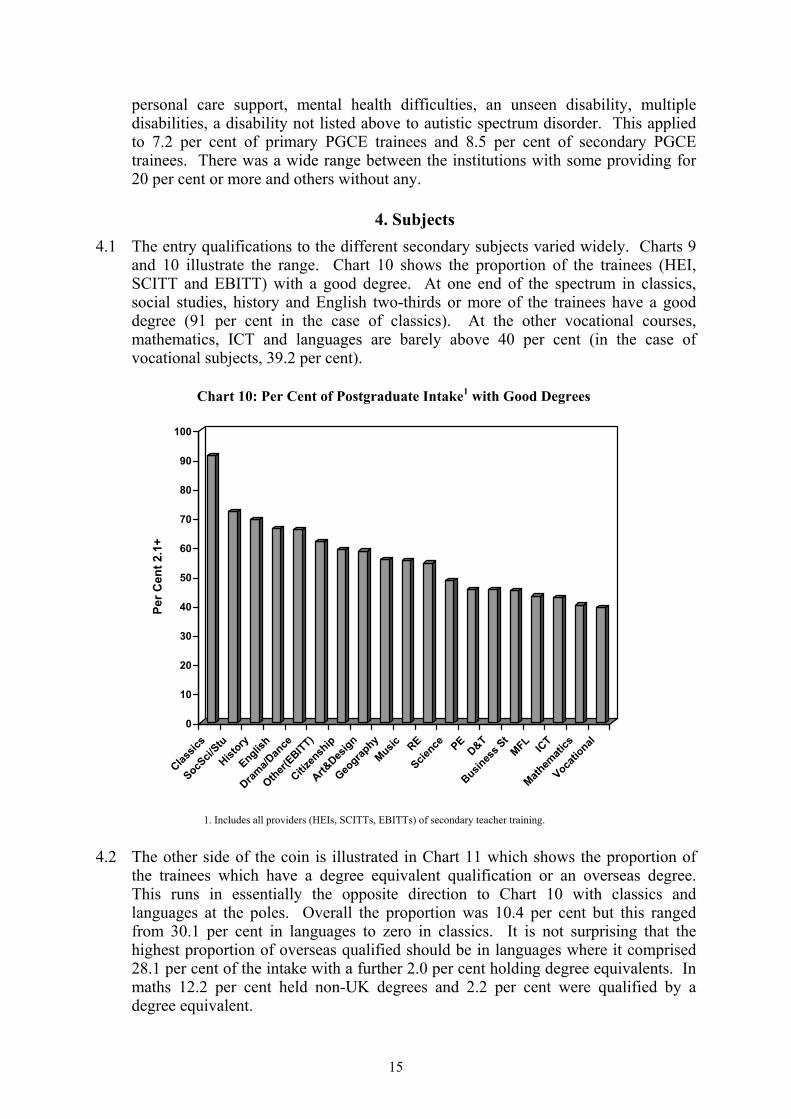
4.2 The other side of the coin is illustrated in Chart 11 which shows the proportion of the trainees which have a degree equivalent qualification or an overseas degree. This runs in essentially the opposite direction to Chart 10 with classics and languages at the poles. Overall the proportion was 10.4 per cent but this ranged from 30.1 per cent in languages to zero in classics. It is not surprising that the highest proportion of overseas qualified should be in languages where it comprised 28.1 per cent of the intake with a further 2.0 per cent holding degree equivalents. In maths 12.2 per cent held non-UK degrees and 2.2 per cent were qualified by a degree equivalent.
15
0
5
10
15
20
25
30
35Pe
r Cen
t Deg
ree
Equi
v +
Non
-UK
Deg
ree
MFL
Mathem
atics
Other (E
BITT)
Busines
s St
Music
Science
English RE
D&TIC
T
Vocatio
nal
History PE
Geograp
hy
Drama/d
ance
Art&Des
ign
Citizen
ship
SocSci/
Stud
Classic
s
Chart 11: Per Cent Entry with Degree Equivalent or Non-UK Degree
4.3 Similar spectra have been described in our previous reports in this series so the pattern seems to be relatively stable. It probably reflects the ease of recruitment. Classics and history attract plentiful recruits and teaching is one of the main occupations for those graduates. In contrast maths, ICT, languages, the physical sciences and vocational subjects struggle because of the range of opportunities open to those graduate and the fact that working with children does not necessarily appeal so much to graduates drawn to the study of the impersonal and the abstract.
4.4 The ease of recruitment hypothesis is supported by the ranking of subjects on recruitment to teaching rather than teacher training shown in Chart 12. The proportion of the final year trainees in a teaching post ranges from 93.1 per cent in classics to 63 per cent in languages. Overall 15 per cent of the trainees dropped-out or did not successfully complete during their final year of training. But again there was a range from 6.9 per cent in classics and 8.9 per cent in geography to 17.6 per cent in languages, 18.5 per cent in maths, 18.7 per cent in religious education, and 20 per cent in citizenship. When added to the drop-out between completing and taking a teaching post, the overall rate of drop-out becomes 28 per cent. The order of the subjects is close to the degree qualifications illustrated in charts 10 and 11, excepting for PE where few of the entrants have good degrees year there is a high rate of conversion to teaching posts (second only to classics). Again this appears to be a subject where teaching is a major career opportunity. But the general picture is that difficulty of filling the teacher training places in a subject is reflected in the poorer entry qualifications of and a higher rate of drop-out of those admitted. One
16
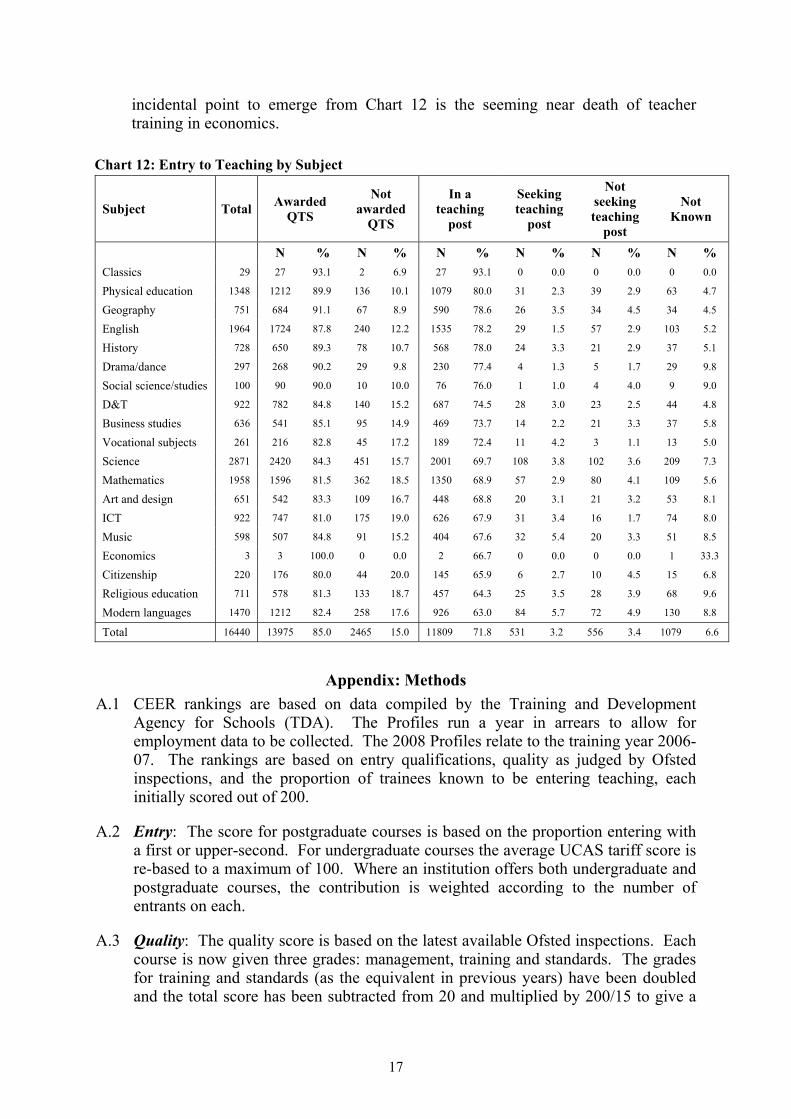
incidental point to emerge from Chart 12 is the seeming near death of teacher training in economics.
Chart 12: Entry to Teaching by Subject
Subject Total Awarded QTS
Not awarded
QTS
In a teaching
post
Seeking teaching
post
Not seeking teaching
post
Not Known
N % N % N % N % N % N % Classics 29 27 93.1 2 6.9 27 93.1 0 0.0 0 0.0 0 0.0
Physical education 1348 1212 89.9 136 10.1 1079 80.0 31 2.3 39 2.9 63 4.7
Geography 751 684 91.1 67 8.9 590 78.6 26 3.5 34 4.5 34 4.5
English 1964 1724 87.8 240 12.2 1535 78.2 29 1.5 57 2.9 103 5.2
History 728 650 89.3 78 10.7 568 78.0 24 3.3 21 2.9 37 5.1
Drama/dance 297 268 90.2 29 9.8 230 77.4 4 1.3 5 1.7 29 9.8
Social science/studies 100 90 90.0 10 10.0 76 76.0 1 1.0 4 4.0 9 9.0
D&T 922 782 84.8 140 15.2 687 74.5 28 3.0 23 2.5 44 4.8
Business studies 636 541 85.1 95 14.9 469 73.7 14 2.2 21 3.3 37 5.8
Vocational subjects 261 216 82.8 45 17.2 189 72.4 11 4.2 3 1.1 13 5.0
Science 2871 2420 84.3 451 15.7 2001 69.7 108 3.8 102 3.6 209 7.3
Mathematics 1958 1596 81.5 362 18.5 1350 68.9 57 2.9 80 4.1 109 5.6
Art and design 651 542 83.3 109 16.7 448 68.8 20 3.1 21 3.2 53 8.1
ICT 922 747 81.0 175 19.0 626 67.9 31 3.4 16 1.7 74 8.0
Music 598 507 84.8 91 15.2 404 67.6 32 5.4 20 3.3 51 8.5
Economics 3 3 100.0 0 0.0 2 66.7 0 0.0 0 0.0 1 33.3
Citizenship 220 176 80.0 44 20.0 145 65.9 6 2.7 10 4.5 15 6.8
Religious education 711 578 81.3 133 18.7 457 64.3 25 3.5 28 3.9 68 9.6
Modern languages 1470 1212 82.4 258 17.6 926 63.0 84 5.7 72 4.9 130 8.8
Total 16440 13975 85.0 2465 15.0 11809 71.8 531 3.2 556 3.4 1079 6.6
Appendix: Methods A.1 CEER rankings are based on data compiled by the Training and Development
Agency for Schools (TDA). The Profiles run a year in arrears to allow for employment data to be collected. The 2008 Profiles relate to the training year 2006-07. The rankings are based on entry qualifications, quality as judged by Ofsted inspections, and the proportion of trainees known to be entering teaching, each initially scored out of 200.
A.2 Entry: The score for postgraduate courses is based on the proportion entering with a first or upper-second. For undergraduate courses the average UCAS tariff score is re-based to a maximum of 100. Where an institution offers both undergraduate and postgraduate courses, the contribution is weighted according to the number of entrants on each.
A.3 Quality: The quality score is based on the latest available Ofsted inspections. Each course is now given three grades: management, training and standards. The grades for training and standards (as the equivalent in previous years) have been doubled and the total score has been subtracted from 20 and multiplied by 200/15 to give a
17

18
maximum score of 200. An overall rating was obtained for secondary provision by combining the grades for each of the courses in proportion to the number of trainees.
A.4 Employment: The percentage of the final-year students recorded as being in a teaching post six months after completing is summed across courses and multiplied by 2 to give a maximum score of 200. All final-year students are included whether they are undergraduate or postgraduate.
A.5 Tables: The raw scores for the entry qualifications, inspection ratings and employment record are standardised to a mean of 500 and a standard deviation of 100. The standard scores are averaged to provide a score for primary training and a score for secondary training. Where a provider offers both primary and secondary the overall score is the average weighted according to the respective course sizes. Where only one is offered this is taken as the final score.
A.6 Coverage: The tables include all teaching training providers in 2006-07 for whom full information was available on intake qualifications, inspection grades and entry to teaching. KS2/3 courses do not form part of the league tables because there are no separate inspection information for them, but their intakes are included in the contextual analysis. No employment data is collected for employment-based routes so they do not appear in the league tables either.