Embed Size (px)
Citation preview
Dr. Tom Vanden Borre Ius Commune ConferenceSenior Research Fellow KUL Maastricht, 29 November 2013(Institute for Energy and Environmental Law)
The global gas revolution vslocal policy response
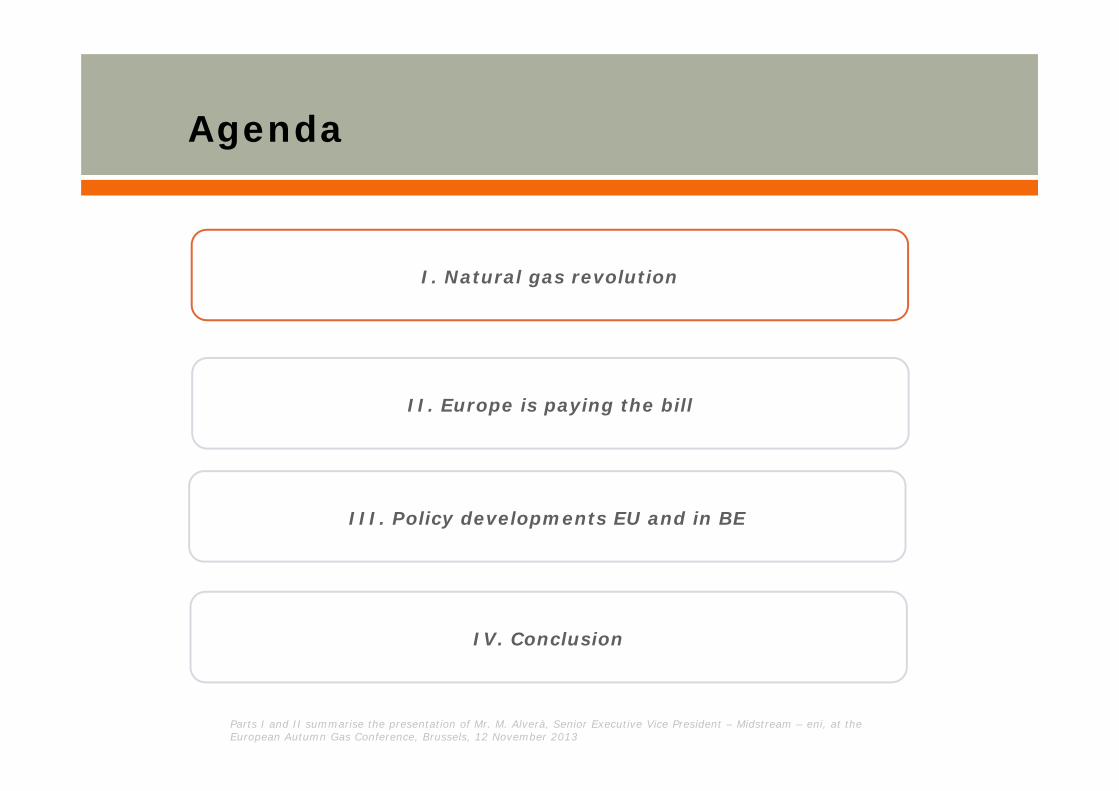
Agenda
I. Natural gas revolution
III. Policy developments EU and in BE
IV. Conclusion
II. Europe is paying the bill
Parts I and II summarise the presentation of Mr. M. Alverà, Senior Executive Vice President – Midstream – eni, at the European Autumn Gas Conference, Brussels, 12 November 2013
Tanzania
Mozambique
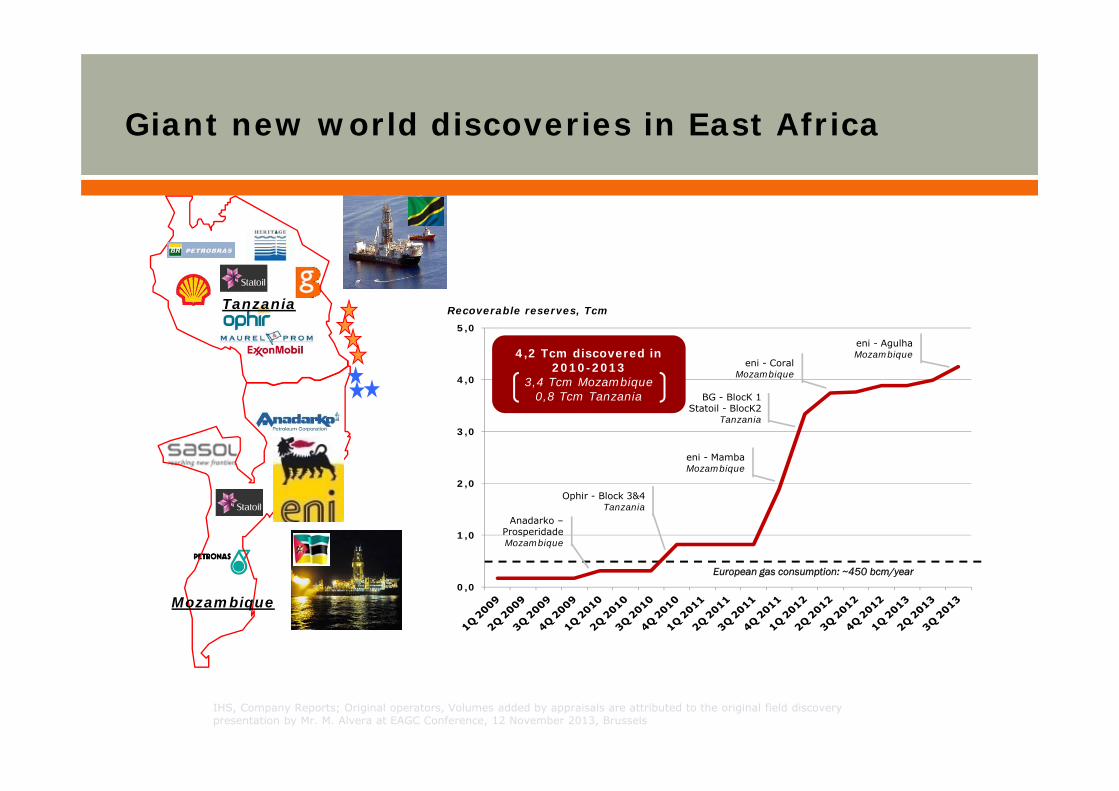
Giant new world discoveries in East Africa
IHS, Company Reports; Original operators, Volumes added by appraisals are attributed to the original field discoverypresentation by Mr. M. Alvera at EAGC Conference, 12 November 2013, Brussels
European gas consumption: ~450 bcm/year0,0
1,0
2,0
3,0
4,0
5,0
Anadarko –ProsperidadeMozambique
Ophir - Block 3&4Tanzania
eni - MambaMozambique
BG - BlocK 1Statoil - BlocK2
Tanzania
eni - CoralMozambique
eni - AgulhaMozambique
Recoverable reserves, Tcm
4,2 Tcm discovered in 2010-2013
3,4 Tcm Mozambique0,8 Tcm Tanzania
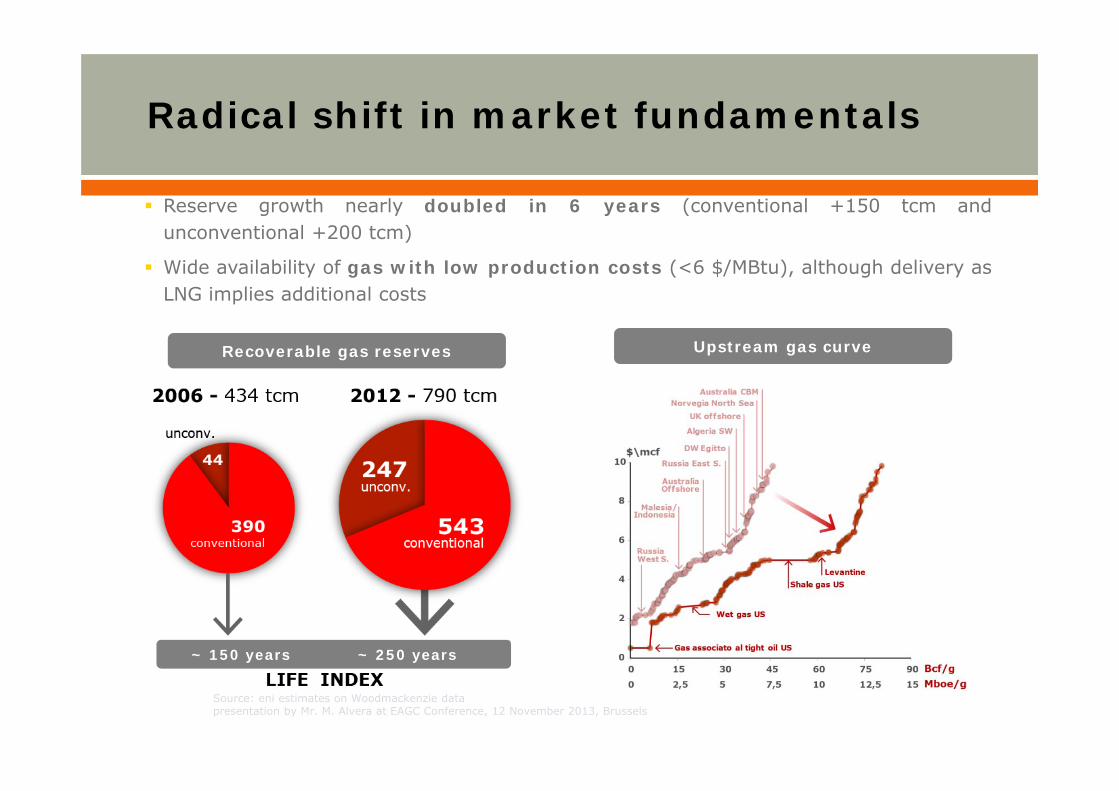
Reserve growth nearly doubled in 6 years (conventional +150 tcm andunconventional +200 tcm)
Wide availability of gas with low production costs (<6 $/MBtu), although delivery asLNG implies additional costs
Recoverable gas reserves Upstream gas curve
~ 150 years ~ 250 years
Source: eni estimates on Woodmackenzie datapresentation by Mr. M. Alvera at EAGC Conference, 12 November 2013, Brussels
Radical shift in market fundamentals
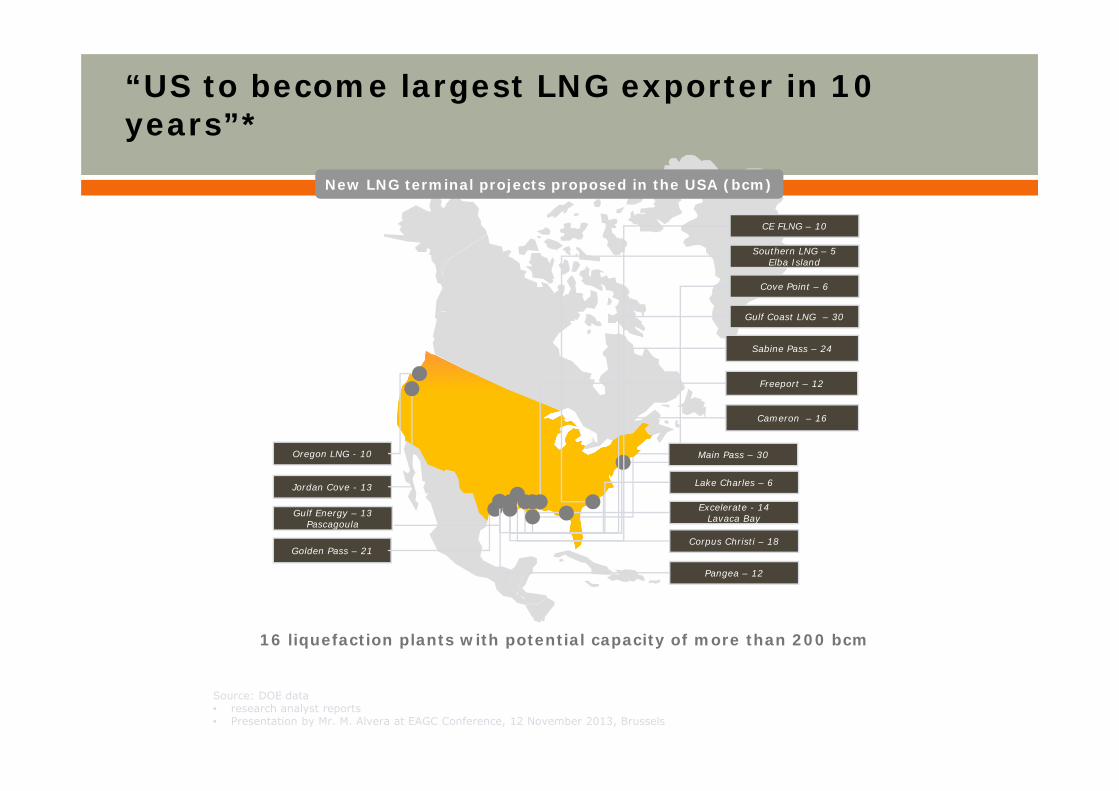
Corpus Christi – 18
Cove Point – 6
Freeport – 12
Cameron – 16
Excelerate - 14Lavaca Bay
Lake Charles – 6
Sabine Pass – 24
Golden Pass – 21
Southern LNG – 5Elba Island
Gulf Energy – 13Pascagoula
Oregon LNG - 10
Jordan Cove - 13
CE FLNG – 10
Gulf Coast LNG – 30
Pangea – 12
Main Pass – 30
New LNG terminal projects proposed in the USA (bcm)
“US to become largest LNG exporter in 10 years”*
16 liquefaction plants with potential capacity of more than 200 bcm
Source: DOE data • research analyst reports• Presentation by Mr. M. Alvera at EAGC Conference, 12 November 2013, Brussels
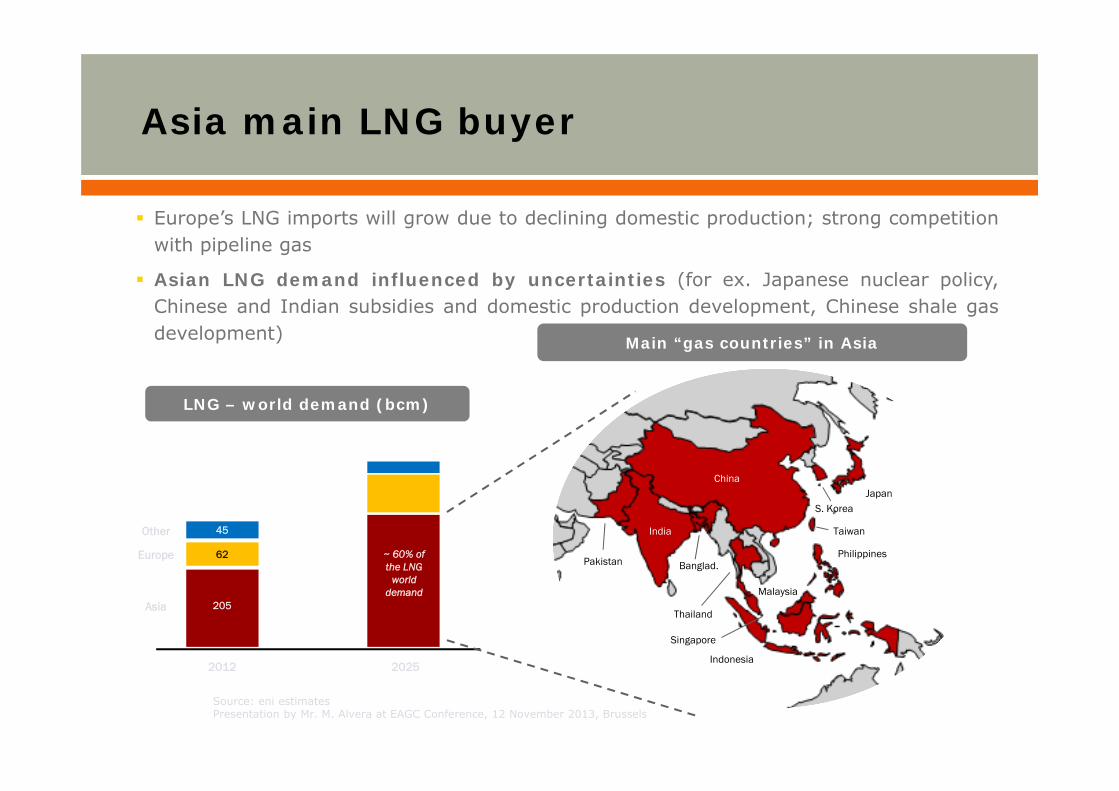
Europe’s LNG imports will grow due to declining domestic production; strong competitionwith pipeline gas
Asian LNG demand influenced by uncertainties (for ex. Japanese nuclear policy,Chinese and Indian subsidies and domestic production development, Chinese shale gasdevelopment)
LNG – world demand (bcm)
Asia main LNG buyer
Asia 205
62
45
Europe
Other
2012 2025
~ 60% of the LNG
world demand
China
India
Philippines
Malaysia
Indonesia
Thailand
JapanS. Korea
Banglad.Pakistan
Singapore
Taiwan
Main “gas countries” in Asia
Source: eni estimatesPresentation by Mr. M. Alvera at EAGC Conference, 12 November 2013, Brussels
Agenda
I. Natural gas revolution
III. Policy developments EU and in BE
IV. Conclusion
II. Europe is paying the bill
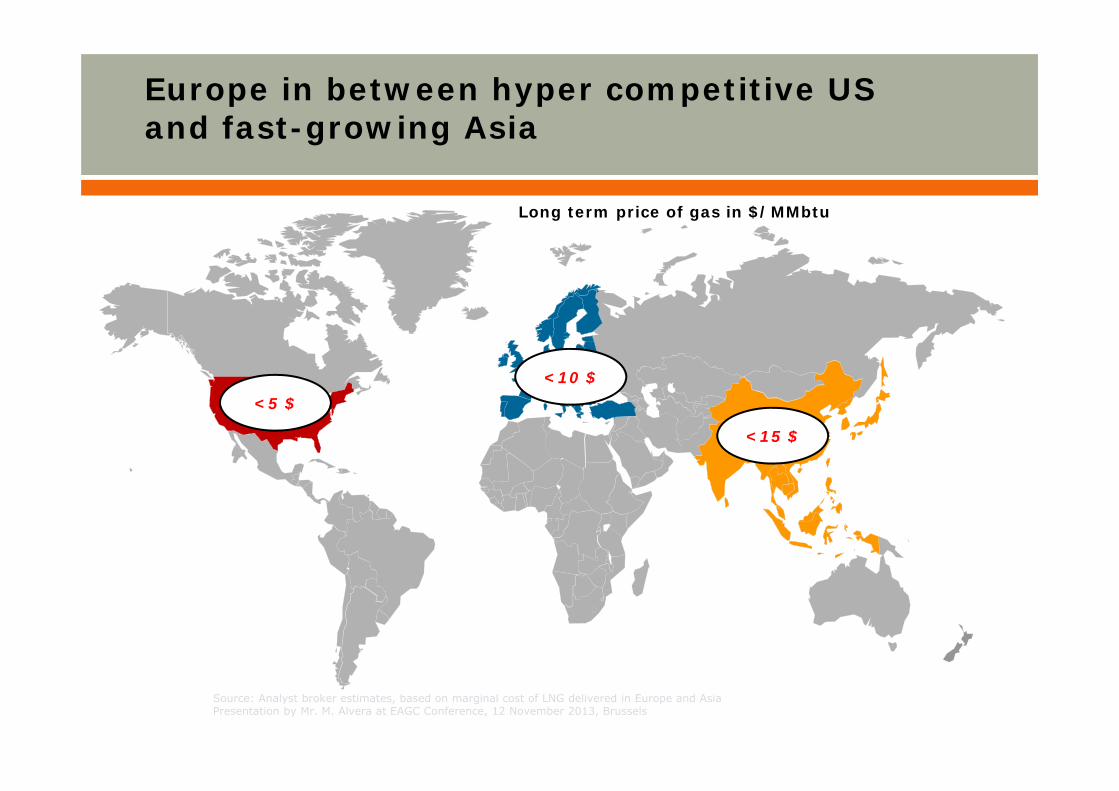
Long term price of gas in $/MMbtu
Source: Analyst broker estimates, based on marginal cost of LNG delivered in Europe and AsiaPresentation by Mr. M. Alvera at EAGC Conference, 12 November 2013, Brussels
<5 $<10 $
<15 $
Europe in between hyper competitive US and fast-growing Asia
Source: Analyst broker estimates, analyst reportsPresentation by Mr. M. Alvera at EAGC Conference, 12 November 2013, Brussels
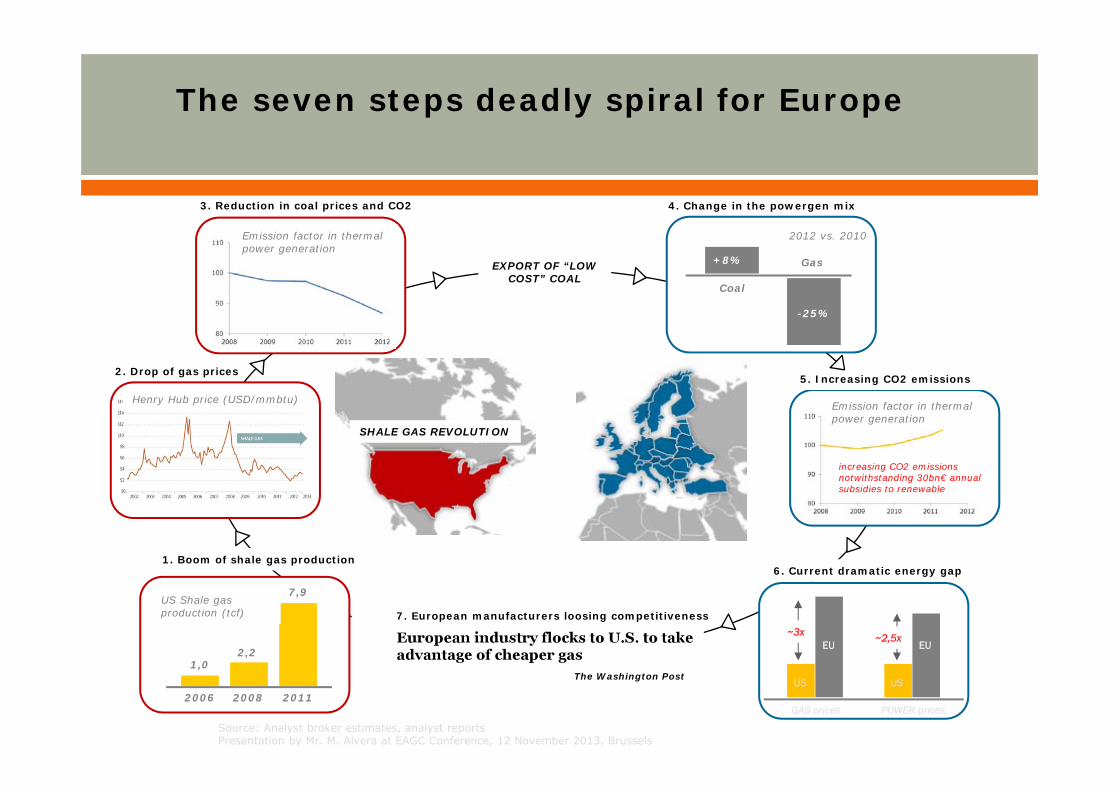
SHALE GAS REVOLUTION
2006 2008 2011
1,02,2
7,9US Shale gas production (tcf)
1. Boom of shale gas production
Henry Hub price (USD/mmbtu)
2. Drop of gas prices
Emission factor in thermal power generation
3. Reduction in coal prices and CO2
5. Increasing CO2 emissions
Emission factor in thermal power generation
increasing CO2 emissionsnotwithstanding 30bn€ annual subsidies to renewable
EXPORT OF “LOW COST” COAL
The Washington Post
POWER pricesGAS prices
US US
~3x ~2,5xEU EU
6. Current dramatic energy gap
4. Change in the powergen mix
+8%
Coal
Gas
-25%
2012 vs. 2010
7. European manufacturers loosing competitiveness
The seven steps deadly spiral for Europe
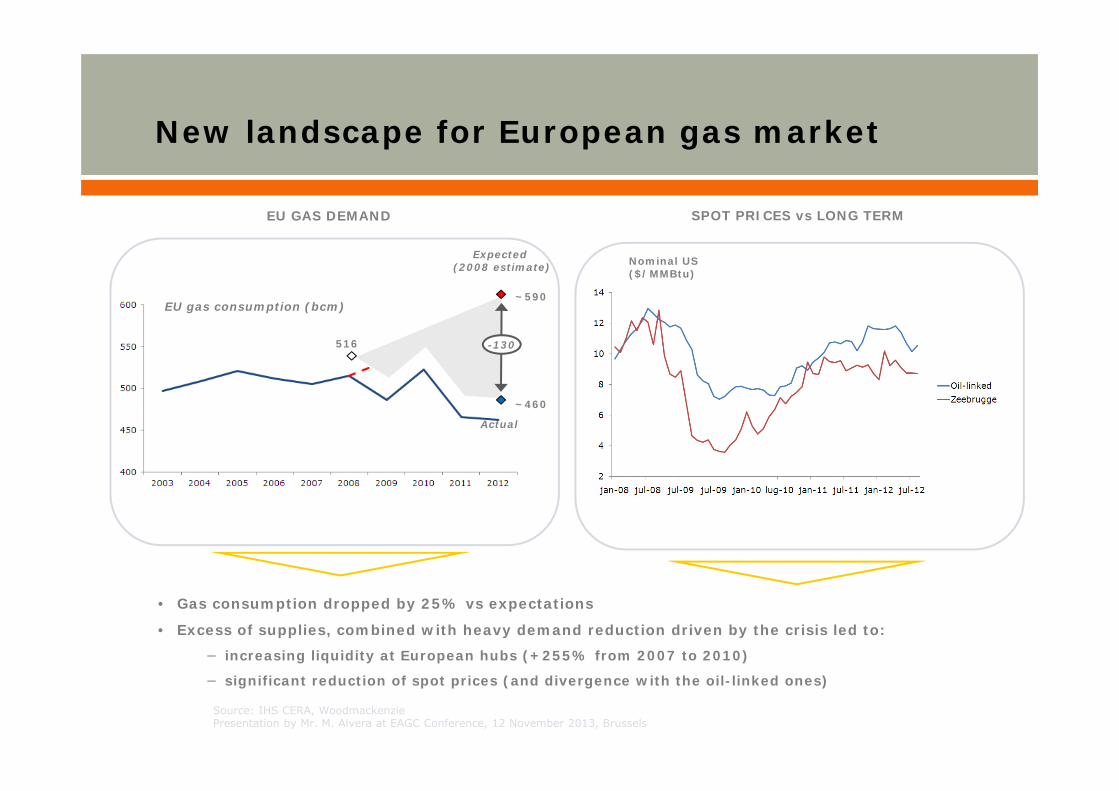
New landscape for European gas market
Nominal US ($/MMBtu)
EU GAS DEMAND SPOT PRICES vs LONG TERM
• Gas consumption dropped by 25% vs expectations
• Excess of supplies, combined with heavy demand reduction driven by the crisis led to:
− increasing liquidity at European hubs (+255% from 2007 to 2010)
− significant reduction of spot prices (and divergence with the oil-linked ones)
Source: IHS CERA, WoodmackenziePresentation by Mr. M. Alvera at EAGC Conference, 12 November 2013, Brussels
~590
~460
516 -130
Expected (2008 estimate)
Actual
EU gas consumption (bcm)
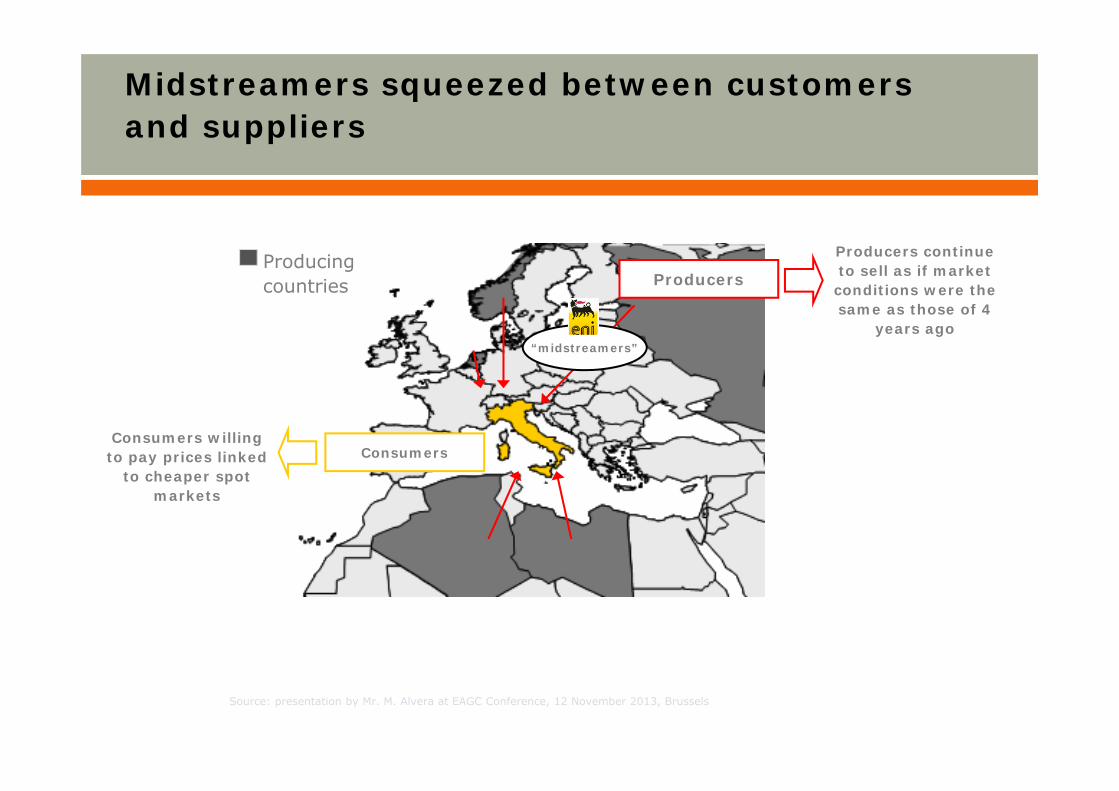
Midstreamers squeezed between customersand suppliers
Producers
Consumers
“midstreamers”
Consumers willing to pay prices linked
to cheaper spot markets
Producers continue to sell as if market conditions were the same as those of 4
years ago
Producing countries
Source: presentation by Mr. M. Alvera at EAGC Conference, 12 November 2013, Brussels
Agenda
I. Natural gas revolution
III. Policy developments EU and in BE
IV. Conclusion
II. Europe is paying the bill
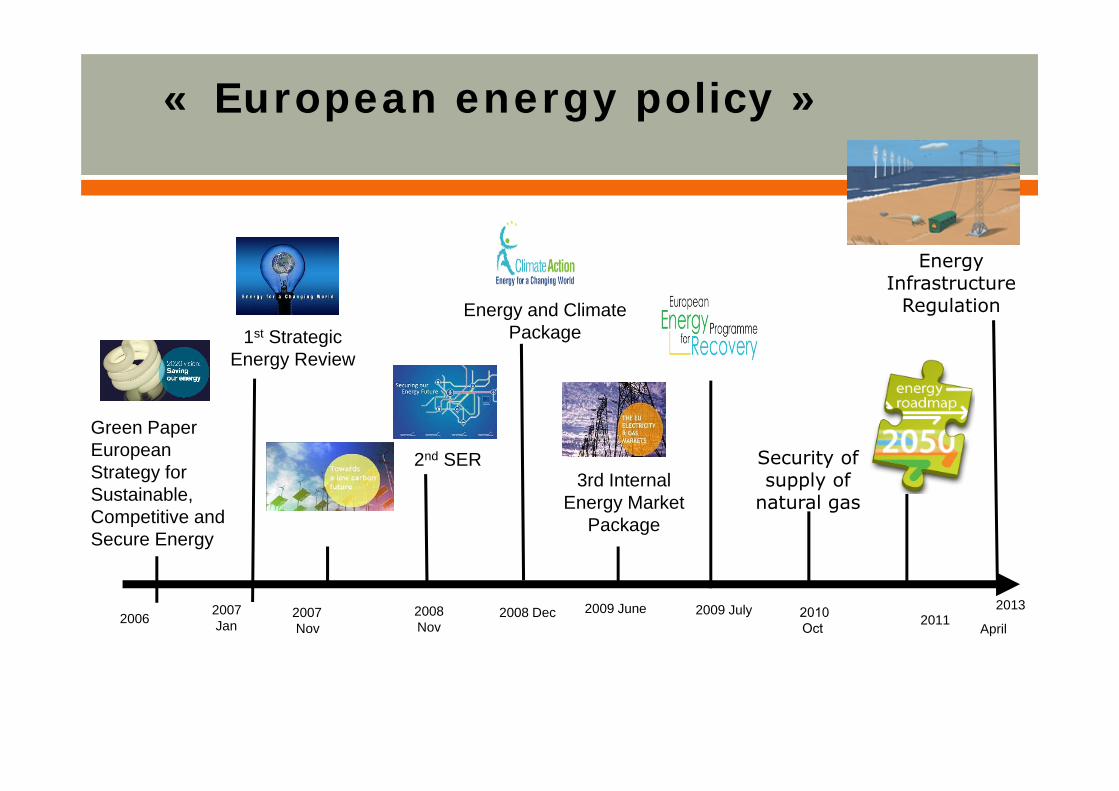
2007Jan
2008Nov 2011
2009 June
3rd Internal Energy Market
Package
Energy and Climate Package
2nd SER
2008 Dec2006
1st Strategic Energy Review
Green Paper European Strategy for Sustainable, Competitive and Secure Energy
2009 July
« European energy policy »
2007Nov
2010Oct
Security of supply of
natural gas
2013
April
Energy Infrastructure
Regulation
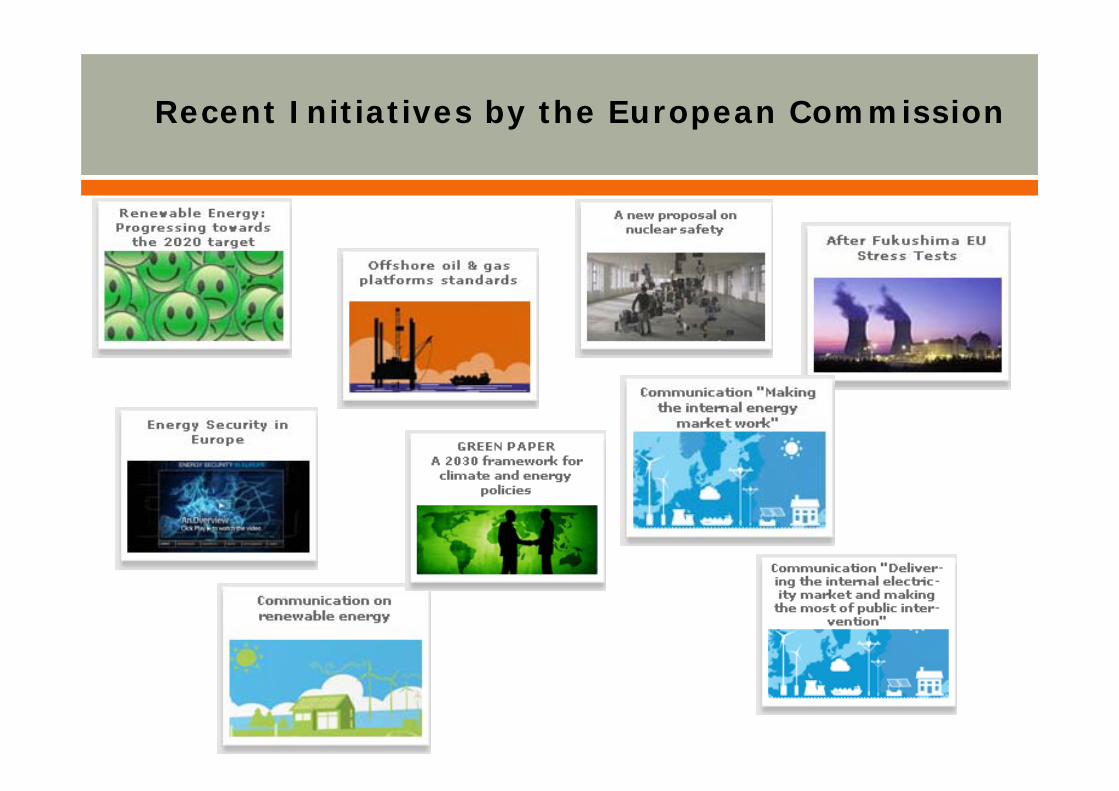
Recent Initiatives by the European Commission
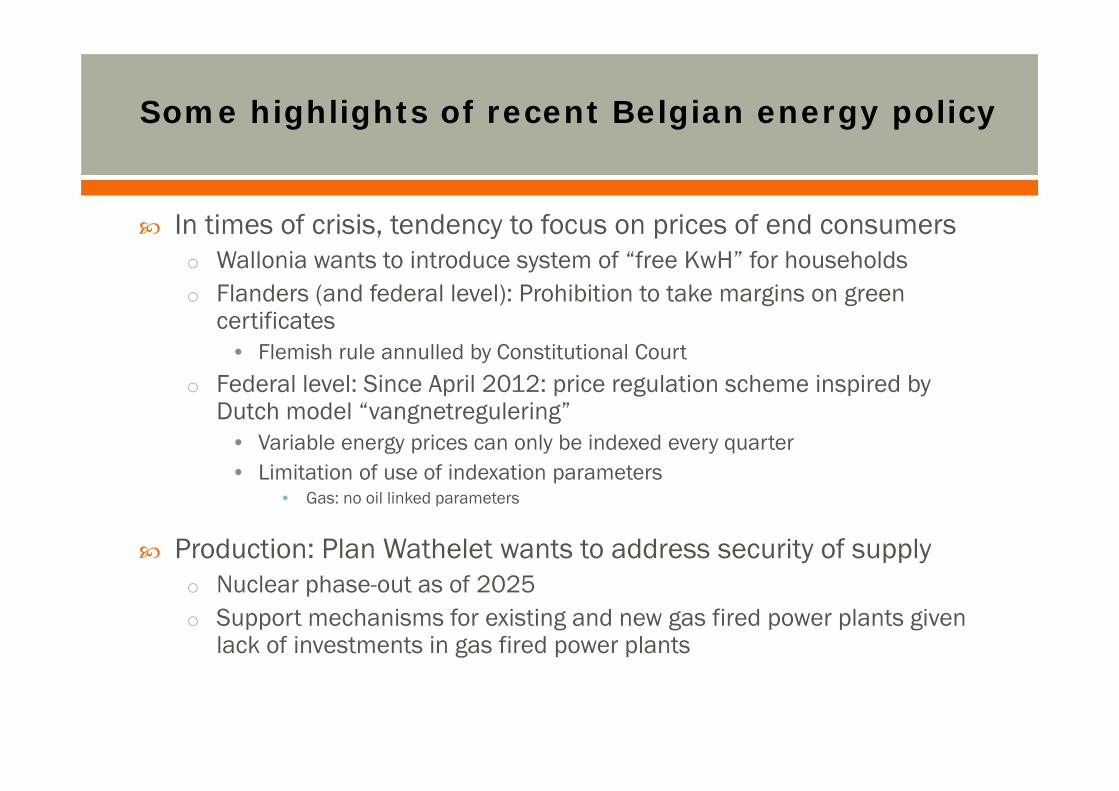
In times of crisis, tendency to focus on prices of end consumerso Wallonia wants to introduce system of “free KwH” for householdso Flanders (and federal level): Prohibition to take margins on green
certificates• Flemish rule annulled by Constitutional Court
o Federal level: Since April 2012: price regulation scheme inspired by Dutch model “vangnetregulering”
• Variable energy prices can only be indexed every quarter• Limitation of use of indexation parameters
• Gas: no oil linked parameters
Production: Plan Wathelet wants to address security of supplyo Nuclear phase-out as of 2025o Support mechanisms for existing and new gas fired power plants given
lack of investments in gas fired power plants
Some highlights of recent Belgian energy policy
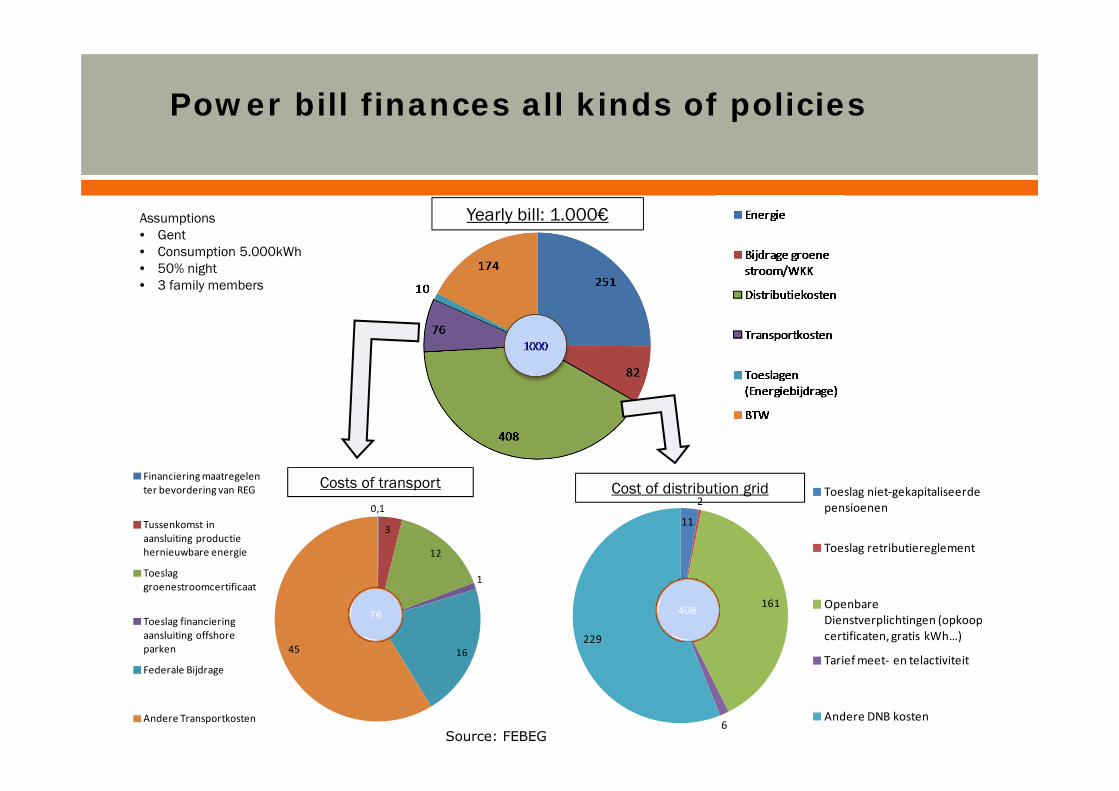
0,1
3
12
1
1645
11
2
161
6
229
408
Cost of distribution gridCosts of transportFinanciering maatregelen ter bevordering van REG
Tussenkomst in aansluiting productie hernieuwbare energie
Toeslag groenestroomcertificaat
Toeslag financiering aansluiting offshore parken
Federale Bijdrage
Andere Transportkosten
76
Yearly bill: 1.000€
Toeslag niet‐gekapitaliseerde pensioenen
Toeslag retributiereglement
Openbare Dienstverplichtingen (opkoop certificaten, gratis kWh…)
Tarief meet‐ en telactiviteit
Andere DNB kosten
Assumptions• Gent• Consumption 5.000kWh• 50% night• 3 family members
Power bill finances all kinds of policies
Source: FEBEG
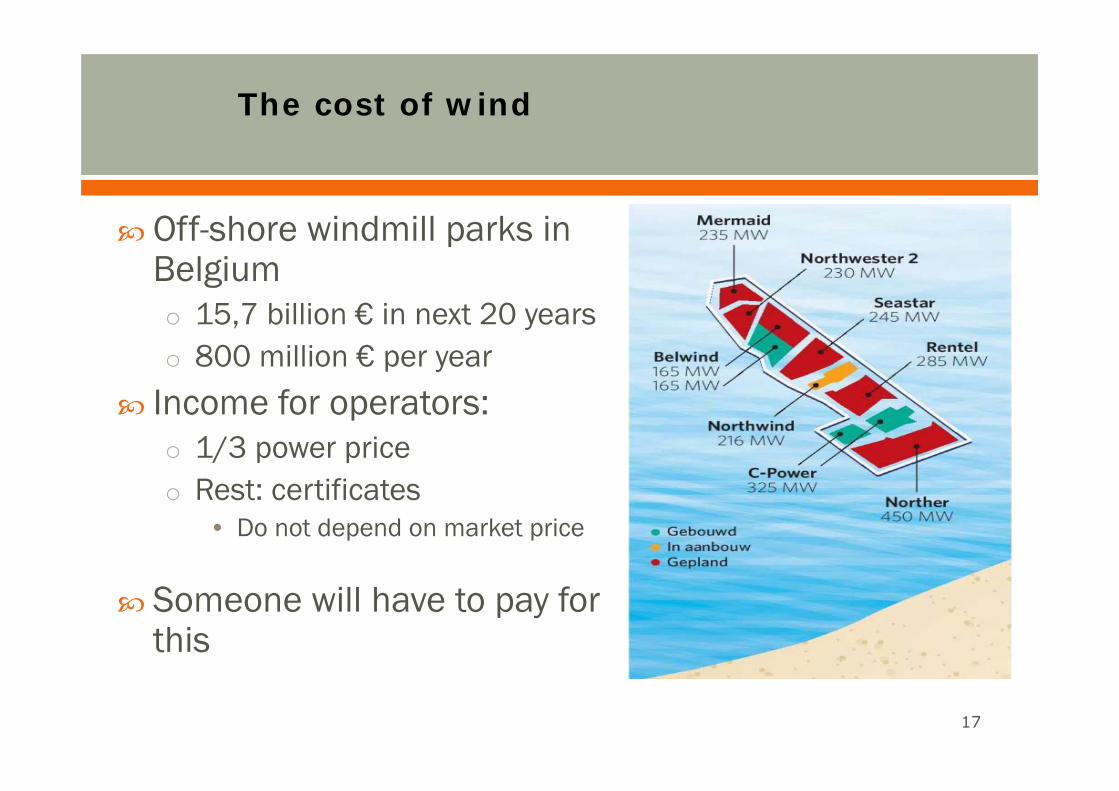
Off-shore windmill parks in Belgiumo 15,7 billion € in next 20 yearso 800 million € per year
Income for operators: o 1/3 power priceo Rest: certificates
• Do not depend on market price
Someone will have to pay forthis
17
The cost of wind
Agenda
I. Natural gas revolution
III. Policy developments EU and in BE
IV. Conclusion
II. Europe is paying the bill
19
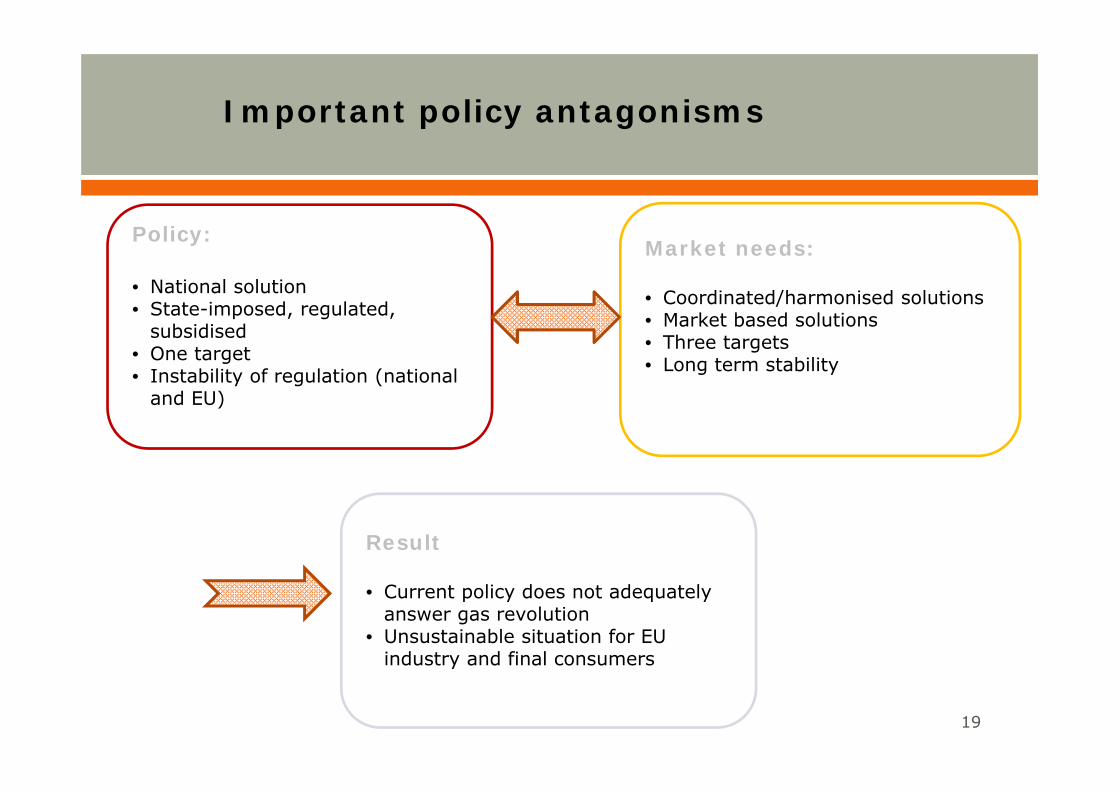
Policy:
• National solution• State-imposed, regulated,
subsidised• One target• Instability of regulation (national
and EU)
Market needs:
• Coordinated/harmonised solutions• Market based solutions• Three targets• Long term stability
Result
• Current policy does not adequatelyanswer gas revolution
• Unsustainable situation for EU industry and final consumers
Important policy antagonisms
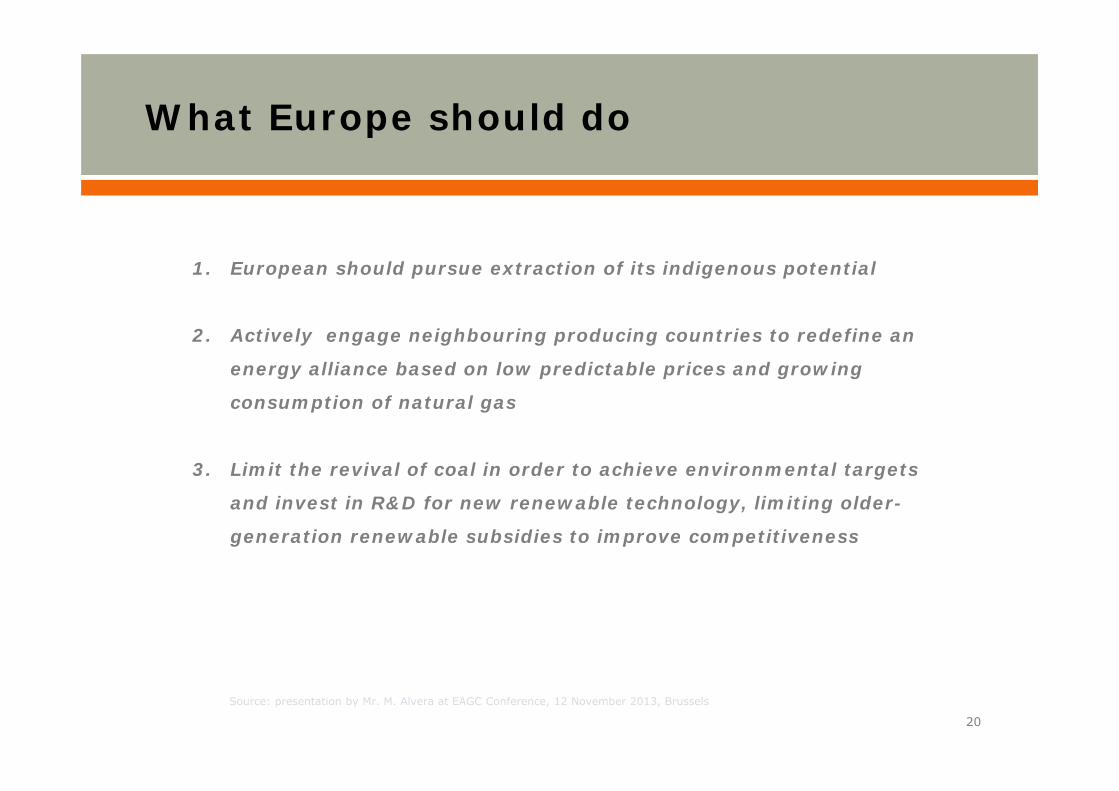
What Europe should do
1. European should pursue extraction of its indigenous potential
2. Actively engage neighbouring producing countries to redefine an
energy alliance based on low predictable prices and growing
consumption of natural gas
3. Limit the revival of coal in order to achieve environmental targets
and invest in R&D for new renewable technology, limiting older-
generation renewable subsidies to improve competitiveness
20
Source: presentation by Mr. M. Alvera at EAGC Conference, 12 November 2013, Brussels
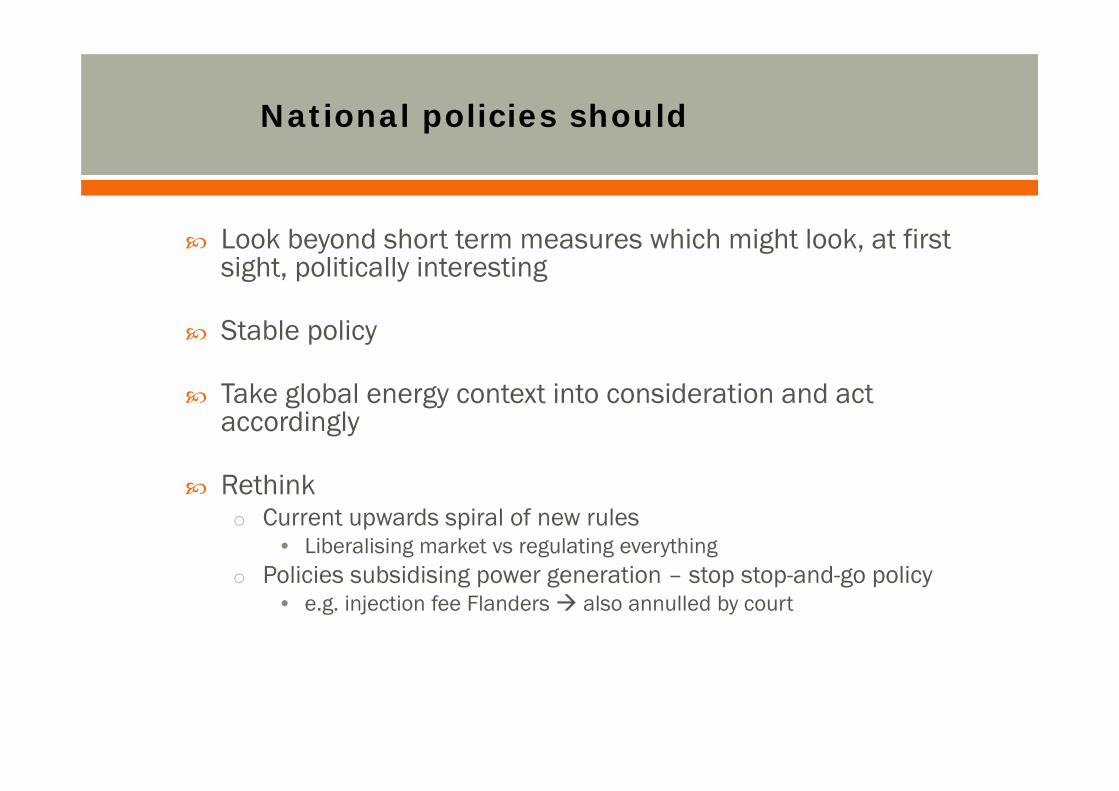
Look beyond short term measures which might look, at first sight, politically interesting
Stable policy
Take global energy context into consideration and act accordingly
Rethink o Current upwards spiral of new rules
• Liberalising market vs regulating everythingo Policies subsidising power generation – stop stop-and-go policy
• e.g. injection fee Flanders also annulled by court
National policies should