Embed Size (px)
Citation preview

The Global Atmospheric Circulation in Moist Isentropic Coordinates
OLIVIER PAULUIS
Courant Institute of Mathematical Sciences, New York University, New York, New York
ARNAUD CZAJA
Department of Physics, Imperial College, London, United Kingdom
ROBERT KORTY
Department of Atmospheric Sciences, Texas A&M University, College Station, Texas
(Manuscript received 14 August 2008, in final form 3 November 2009)
ABSTRACT
Differential heating of the earth’s atmosphere drives a global circulation that transports energy from the
tropical regions to higher latitudes. Because of the turbulent nature of the flow, any description of a ‘‘mean
circulation’’ or ‘‘mean parcel trajectories’’ is tied to the specific averaging method and coordinate system. In
this paper, the NCEP–NCAR reanalysis data spanning 1970–2004 are used to compare the mean circulation
obtained by averaging the flow on surfaces of constant liquid water potential temperature, or dry isentropes,
and on surfaces of constant equivalent potential temperature, or moist isentropes. While the two circulations
are qualitatively similar, they differ in intensity. In the tropics, the total mass transport on dry isentropes is
larger than the circulation on moist isentropes. In contrast, in midlatitudes, the total mass transport on moist
isentropes is between 1.5 and 3 times larger than the mass transport on dry isentropes.
It is shown here that the differences between the two circulations can be explained by the atmospheric
transport of water vapor. In particular, the enhanced mass transport on moist isentropes corresponds to
a poleward flow of warm moist air near the earth’s surface in midlatitudes. This low-level poleward flow does
not appear in the zonally averaged circulation on dry isentropes, as it is hidden by the presence of a larger
equatorward flow of drier air at same potential temperature. However, as the equivalent potential temper-
ature in this low-level poleward flow is close to the potential temperature of the air near the tropopause, it is
included in the total circulation on moist isentropes. In the tropics, the situation is reversed: the Hadley
circulation transports warm moist air toward the equator, and in the opposite direction to the flow at upper
levels, and the circulation on dry isentropes is larger than that on moist isentropes.
The relationship between circulation and entropy transport is also analyzed. A gross stratification is defined
as the ratio of the entropy transport to the net transport on isentropic surfaces. It is found that in midlatitudes
the gross stability for moist entropy is approximately the same as that for dry entropy. The gross stratification
in the midlatitude circulation differs from what one would expect for either an overturning circulation or
horizontal mixing; rather, it confirms that warm moist subtropical air ascends into the upper troposphere
within the storm tracks.
1. Introduction
The global atmospheric circulation redistributes energy
and entropy from equatorial regions to higher latitudes.
This is accomplished by a combination of a poleward flow
of high energy and high entropy air parcels and an
equatorward return flow of parcels with lower energy
and entropy content. Because of the turbulent nature of
the atmosphere, individual parcel trajectories vary widely,
and the circulation can only be described in an averaged
sense. A key issue arises from the fact that different av-
eraging methods can produce different outcomes.
The Eulerian-mean circulation is one of the better
known descriptions of the circulation, and is obtained by
averaging the flow at constant pressure or geopotential
Corresponding author address: Olivier Pauluis, Courant Institute
of Mathematical Sciences, New York University, Warren Weaver
Hall, 251 Mercer St., New York, NY 10012-1185.
E-mail: [email protected]
1 JUNE 2010 P A U L U I S E T A L . 3077
DOI: 10.1175/2009JCLI2789.1
� 2010 American Meteorological Society
height. Eulerian-mean circulations exhibit a classic three-
cell structure: a direct Hadley circulation in the tropics, an
indirect Ferrel cell in midlatitudes, and a weak direct
polar cell at high latitudes (see Peixoto and Oort 1992,
among others). The circulation in Ferrel cells is toward
the equator in the upper troposphere and toward the pole
near the surface; it is associated with a net energy trans-
port toward the equator. In the midlatitudes, however,
the atmospheric energy transport remains toward the
poles, owing to a large poleward transport by the eddies.
Alternatives to the Eulerian-mean circulation have
been developed in an attempt to capture the contribution
of midlatitudes eddies. The transformed Eulerian-mean
circulation (Andrews and McIntyre 1976; Dunkerton 1978;
Edmon et al. 1980; Iwasaki 1989; Juckes 2001) obtains
a residual circulation by including a correction term that
accounts for the mass transport by eddies, an approach
similar to the Stoke drift (Stokes 1847) in shallow-water
waves. This residual circulation differs markedly from the
Eulerian-mean circulation in that it exhibits a single cell
with air rising in the equatorial regions and subsiding
over the poles, although there is also some evidence
of secondary ascent in the midlatitudes (Edmon et al.
1980). The use of entropy as a vertical coordinate offers
another—perhaps more direct—way to assess parcels’ tra-
jectories. In the atmosphere, various authors (Townsend
and Johnson 1985; Johnson 1989; Juckes et al. 1994; Held
and Schneider 1999; Schneider 2004; Schneider et al. 2006)
have analyzed the circulation using either entropy or po-
tential temperature as the vertical coordinates instead of
pressure. McIntosh and McDougall (1996) follow a similar
approach for the ocean based on potential density. At-
mospheric and oceanic eddies are associated with large
fluctuations of pressure and geopotential height. How-
ever, as long as the eddies are almost adiabatic, fluctua-
tions in the parcels’ entropy, potential temperature, or
potential density are comparatively smaller. Averag-
ing the circulation on isentropic surfaces provides a
more direct description of the Lagrangian circulation,
although some differences persist (Bowman and Carrie
2002). As for the transformed Eulerian-mean circula-
tion, the circulation on isentropic surfaces exhibits a
single global overturning cell from the equator to polar
regions.
There is, however, an important problem with such
analysis of the circulation on isentropic coordinates: isen-
tropic surfaces in a moist atmosphere are not uniquely
defined. This property is a consequence of the fact that the
entropy of water vapor can only be defined up to an ad-
ditive constant. This particular thermodynamic property
of moist air is discussed in greater detail in the appendixes.
In this paper, we compare the atmospheric circulation on
two different sets of isentropic surfaces: surfaces of constant
liquid water potential temperature and surfaces of con-
stant equivalent potential temperature. We will refer
loosely to the former as ‘‘dry’’ isentropes and to the latter
as ‘‘moist’’ isentropes. Pauluis et al. (2008) showed that the
circulations on dry and moist isentropes differ markedly,
with the mass transport on moist isentropes being ap-
proximately twice as large in the midlatitudes as the mass
transport on dry isentropes. They also explained this dif-
ference by the presence in the midlatitudes of a large
poleward flow of warm moist air at low level. The present
paper further investigates these differences and shows how
a joint analysis of the dry and moist circulation can provide
new insights on the atmospheric circulation.
Daily National Centers for Environmental Prediction–
National Center for Atmospheric Research (NCEP–
NCAR) reanalysis data (Kalnay et al. 1996) from 1970 to
2004 are used to obtain the zonal-mean circulation using
liquid water potential temperature and equivalent poten-
tial temperature as vertical coordinates. These results are
discussed in section 2. Both analyses show a global over-
turning circulation with high potential temperature air
flowing from the equatorial regions to the poles aloft and
a return flow at lower potential temperature. They differ
significantly, however, in the magnitude of the circulation.
In the tropics, the total mass transport on dry isentropes is
larger by approximately 20%–30% than the mass trans-
port on moist isentropes. In contrast, in the midlatitudes,
the total mass transport on moist isentropes is between 2
and 3 times larger than the transport on dry isentropes.
In section 3, we analyze the poleward mass transport
in terms of the joint distribution of liquid water potential
temperature and equivalent potential temperature. This
approach allows us to better identify the properties of
the moving air masses. In the tropics, it is found that,
while the air parcels in the equatorward and poleward
flow have similar values of equivalent potential tem-
perature, their liquid water potential temperatures dif-
fer markedly. This situation is consistent with a direct
overturning Hadley circulation and explains why the
circulation on dry isentropes is larger than on moist
isentropes. In midlatitudes, however, the additional mass
flux on moist isentropes is due to the presence of a low-
level poleward mass transport of warm moist air near the
surface. The liquid water potential temperature in this
poleward flow is characteristic of the lower troposphere,
but its equivalent potential temperature is closer to the
tropopause value. We argue that this low-level flow as-
cends into the upper troposphere in the storm tracks,
resulting in enhanced precipitation there.
Section 4 discusses the entropy transport and the gross
stratification in the circulation. The larger mass transport
on equivalent potential temperature surfaces corresponds
to enhanced moist entropy transport associated with the
3078 J O U R N A L O F C L I M A T E VOLUME 23
poleward water vapor transport in midlatitudes. Surpris-
ingly, it is also found that, in midlatitudes, the gross
stratification for dry entropy and that for moist entropy
are comparable. This situation stands in stark contrast to
the tropics where the dry stratification is significantly
larger than the gross moist stratification.
2. The global overturning circulation in isentropiccoordinates
Thermodynamic entropy is a state variable that is used
in Clausius formulation of the second law of thermody-
namics. However, this thermodynamic entropy as used in
atmospheric is not uniquely, an issue that is discussed in
greater detail in appendices A and B. There are, arguably,
two ‘‘sensible’’ choices for the entropy of moist air par-
cels: the moist entropy Sm and dry entropy Sl. These two
entropies differ by a value proportional to the total water
content. In most of this paper, we will follow the tradition
of the atmospheric sciences and use potential tempera-
ture instead of entropy to define isentropic coordinates.
The moist entropy Sm is related to the equivalent poten-
tial temperature ue by Sm 5 Cp ln(ue/T0). Similarly, the
dry entropy Sl is related to the liquid water potential
temperature ul by Sl 5 Cp ln(ul/T0); Cp is the heat capacity
of air, and T0 is an arbitrary reference temperature. Sur-
faces of constant liquid water potential temperature and
surfaces of constant equivalent potential temperature
define two independent sets of isentropic surfaces and are
referred to here as dry and moist isentropes.
The liquid water potential temperature ul and equiv-
alent potential temperature ue are two distinct state var-
iables. In a moist atmosphere, the state of an air parcel
can be characterized uniquely by a combination of these
two potential temperatures and a third state variable,
for example the total pressure p; any state variable
(such as temperature) can be expressed as a function of
ue, ul, and p: T 5 T(ue, ul, p). The two potential tem-
peratures are conserved for reversible adiabatic pro-
cesses, including reversible phase transitions. The key
difference between these lies in how they change when
water is either added or removed. The equivalent po-
tential temperature is only slightly affected by the ad-
dition or removal of condensed water, but it increases
greatly when water vapor is added to a parcel (for ex-
ample from evaporation at the earth’s surface). In con-
trast, the addition or removal of water vapor does not
change ul significantly, but the removal of condensed
water by precipitation greatly increases it.
The zonal-mean circulation on both dry and moist
isentropes is computed from the NCEP–NCAR re-
analysis daily data for the period between January 1970
and December 2004. Starting from the gridded data on
pressure surfaces, we compute ue and ul at each level.
For the latter, as the NCEP–NCAR reanalysis does not
provide the concentration of condensed water, we use
the potential temperature. The data are then interpo-
lated on 100 equally spaced pressure levels. The me-
ridional mass flux ydp is then boxed to obtain the mass
transport M(ue, ul, f) due dul in terms of the dual dis-
tribution of ue and ul:
M(ue,0
, ul,0
, f) due,0
dul,0
51
P
ðP
0
ð2p
0
ðpsfc
0
[yd(ue� u
e,0)d(u
l� u
l,0)a cosf]
dp
gdl dt, (1)
where P is the time period over which the data are av-
eraged, a is the earth’s radius, f is the latitude, g is the
gravitational acceleration, and psfc is the surface pres-
sure. When computing the mass flux numerically, the
delta functions in (1) are replaced by summing the mass
transport over boxes of finite width in ue and ul. The joint
distribution for the monthly mean mass flux is computed
based on a 35-year sample from the NCEP–NCAR data
from 1970 to 2004. The streamfunctions on isentropic
surfaces are obtained through the integrals:
Cu
e(u
e, f) 5
ðue
�‘
ð‘
�‘
M(u9e, u9
l, f) du9
l
� �du9
e, (2a)
Cu
l(u
l, f) 5
ðul
�‘
ð‘
�‘
M(u9e, u9
l, f) du9
e
� �du9
l. (2b)
Figure 1 shows the streamfunction on dry isentropes Cul
(Figs. 1a,c,e) and moist isentropes Cue
(Figs. 1b,d,f). In
isentropic coordinates, the global circulation exhibits a
single cell in each hemisphere. The circulation is direct
with poleward flow of high entropy air and a return flow of
low entropy air, and is associated with an equator-to-pole
energy and entropy transports. Near the solstices, the
center for the circulation is displaced into the summer
hemisphere, and the intensity of the cross-equatorial cell
increases significantly, while the cell confined within the
summer hemisphere weakens.
The circulation on dry isentropes is, not surprisingly,
similar to the analysis of the circulation using potential
temperature obtained by Held and Schneider (1999).
It shows a very strong overturning circulation from the
equatorial regions all the way to the pole. This circulation
1 JUNE 2010 P A U L U I S E T A L . 3079
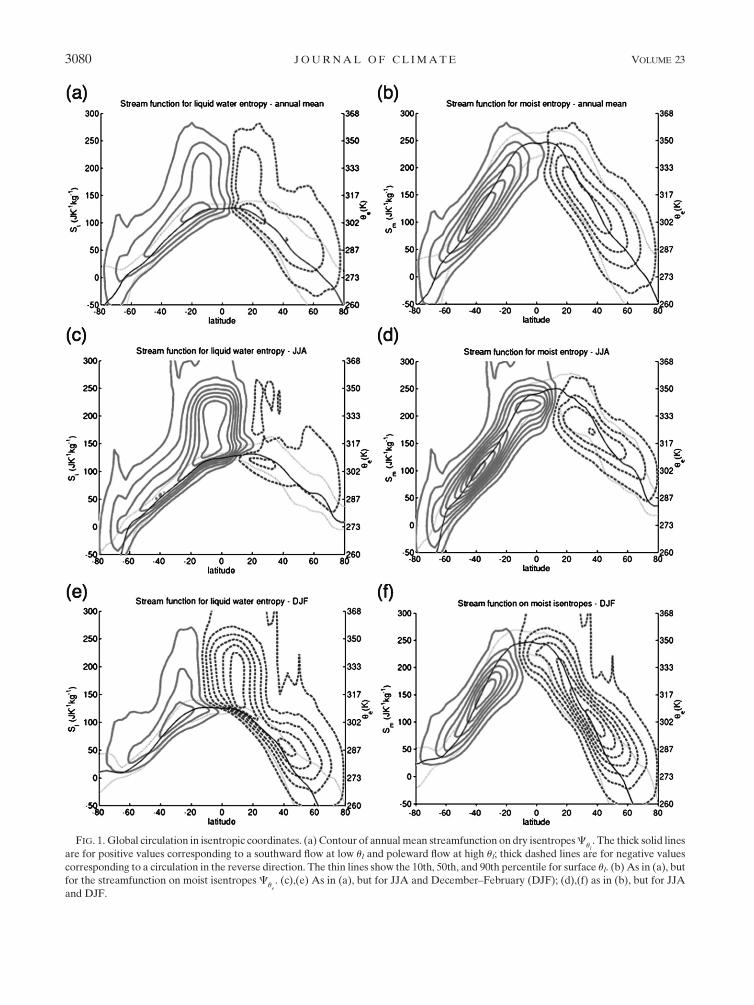
FIG. 1. Global circulation in isentropic coordinates. (a) Contour of annual mean streamfunction on dry isentropes Cul
. The thick solid lines
are for positive values corresponding to a southward flow at low ul and poleward flow at high ul; thick dashed lines are for negative values
corresponding to a circulation in the reverse direction. The thin lines show the 10th, 50th, and 90th percentile for surface ul. (b) As in (a), but
for the streamfunction on moist isentropes Cue
. (c),(e) As in (a), but for JJA and December–February (DJF); (d),(f) as in (b), but for JJA
and DJF.
3080 J O U R N A L O F C L I M A T E VOLUME 23
is strongest in the tropics and exhibits an intense cross-
equatorial flow from the summer to the winter hemi-
sphere, but it is comparatively weak in midlatitudes. Most
notably, during June–August (JJA), the circulation al-
most disappears in Northern Hemisphere midlatitudes.
The 10th, 50th, and 90th percentiles of the surface ul are
depicted in black in Fig. 1. As noted in Juckes et al. (1994)
and Held and Schneider (1999), the equatorward flow
takes place on isentropes that intersect the surface.
Precipitation and surface sensible heat fluxes are the
primary sources of ul in the atmosphere, while radiative
cooling is its main sink. Their respective impact can be
seen in Figs. 1a,c,e. Sensible heating from the surface ap-
pears through the increase in ul as air parcels move toward
the equator. The strong ‘‘ascent’’ near the equator corre-
sponds to latent heat release in the precipitating regions
of the tropics. There is also some localized ascent in the
midlatitudes, resulting from precipitation in the storm
tracks. Radiative cooling shows up as the overall down-
ward motions in the subtropics and at high latitudes.
The circulation on moist isentropes is similar to the
analysis of the circulation based on the moist static en-
ergy performed by Czaja and Marshall (2006). The black
lines in Figs. 1b,d,f depict the 10th, 50th, and 90th per-
centiles of the surface ue and span most of the vertical
extent of the circulation. Fluctuations of ue near the
surface are comparable to vertical variations across the
troposphere. This is not surprising in the tropics where
the deep convection maintains the temperature profile
close to a moist adiabat (Xu and Emanuel 1989), but
even in midlatitudes surface values of ue are close to
their values in the upper troposphere.
Qualitatively, the circulation on moist isentropes ex-
hibits the same single global cell structure as the circulation
on dry isentropes, but there are significant quantitative
differences. The circulation on moist isentropes exhibits
a much weaker cross-equatorial flow and is generally
weaker in the tropics. In contrast, it is strongest in the
midlatitudes, with a maximum mass transport around
408 in both hemispheres. The circulation on moist isen-
tropes is weaker in the summer hemisphere, albeit less
so than for the circulation on dry isentropes. Most no-
ticeably, while the circulation on dry isentropes almost
disappears in the Northern Hemisphere during summer,
the circulation on moist isentropes remains vigorous.
Evaporation and surface sensible heat fluxes are the
main sources of ue, while radiative cooling is a sink. A
key distinction between the dry and moist circulations
lies in the different impacts that evaporation and con-
densation have on ul and ue. This results in different
patterns of ‘‘rising’’ motions (in the sense of an increase
of ul or ue) between the dry and moist circulations. The
ascent in Figs. 1b,d,f spreads across the entire subtropics
and is broader than for the dry circulation. Regions of
excess evaporation occupy a wider geographical area
than regions of heavy precipitation. Note that this cross-
isentropic ascent due to evaporation masks some of the
radiative cooling in the subtropics, which is thus less ap-
parent than in the circulation on dry isentropes. Second,
the ‘‘subsidence’’ (i.e., decrease in ue or ul) poleward of
458 is significantly larger in the moist circulation than
in the dry circulation. In the free troposphere, radiative
cooling on a dry isentrope is partially balanced by latent
heat release. In contrast, condensation and precipitation
have little impact on ue, so that the change in ue in the free
troposphere is due primarily to radiative cooling. Hence,
the weaker subsidence in the dry analysis at high latitude
must be attributed to a partial compensation between
radiative cooling and condensation. Finally, the increase
in ue in the return flow is much larger than the increase in
ul because this increase reflects the increase in both
temperature and latent heat content as air parcels move
toward the equator.
The most striking difference between the dry and moist
circulations lies in the overall mass transport. Figure 2
shows the mass transport in the overturning circulation,
defined here as the difference between the maximum and
the minimum of the streamfunction at any latitude:
DCu
l(f) 5 max
ul[C
ul(u
l, f)]�min
ul[C
ul(u
l, f)], (3a)
DCu
e(f) 5 max
ue[C
ue(u
e, f)]�min
ue[C
ue(u
e, f)]. (3b)
Both circulations are strongest in the winter hemisphere,
but the circulations in the Southern Hemisphere are
systematically more intense than those in the Northern
Hemisphere for the same season. In the tropics, the mass
transport on dry isentropes is larger by about 20%–30%
than the circulation on moist isentropes. In contrast, in
midlatitudes, the circulation on moist isentropes is larger
than that on dry isentropes. The ratio of the midlatitude
mass transport between the two analyses varies in the
Northern Hemisphere between 1.5 during winter and 3
during summer; the ratio is 2 throughout the year in the
Southern Hemisphere.
3. Mass transport in upper and lower branchesof the circulation
In this section, we analyze why the circulation on moist
isentropes is between 1.5 and 3 times larger than the
circulation on dry isentropes in midlatitudes, while the
circulation on dry isentropes is larger in the equatorial
regions. This might seem surprising at first glance be-
cause, by averaging in isentropic coordinates, one aims to
capture the mean motion of air parcels. If the isentropic
1 JUNE 2010 P A U L U I S E T A L . 3081

analysis exactly captured the Lagrangian mass transport,
the total circulation in isentropic coordinates should be
independent of any specific detail in the definition of
entropy. As this is not the case, there must be some sig-
nificant discrepancy between the mean parcel trajectory
and either or both isentropic circulations. We argue that
by averaging the circulation on dry isentropes one omits
a significant portion of the midlatitude flow, while aver-
aging on moist isentropes misses a portion of the circu-
lation in the equatorial regions.
Pauluis et al. (2008) introduce here the concept of ‘‘is-
entropic filaments’’ as lines of constant value of ul and
ue, that is, the intersection between a dry isentrope and a
moist isentrope. As shown in the appendixes, definitions
for the entropy of moist air differ from one another by a
constant multiplied by the total water content. Any arbi-
trary definition of the entropy of moist air can, however, be
expressed as a linear combination of the dry entropy and
the moist entropy and is therefore constant along isen-
tropic filaments. In contrast to the isentropic surfaces,
the isentropic filaments do not depend on the specific
choices made in the definition of the entropy. Any adia-
batic invariant is conserved for reversible adiabatic trans-
formations and is constant along isentropic filaments.
The global circulation can be described by analyzing
the distribution of the meridional mass transport on is-
entropic filaments M(ul, ue, f) due dul at each latitude.
Figure 3 shows this joint distribution at 408 latitude in
both hemispheres. As noted before, the circulation is
direct, with high ue and high ul air parcels moving
poleward and low ue and low ul returning equatorward.
The total meridional mass transport on isentropic fila-
ment can be obtained by integrating the mass flow on all
filaments with a net poleward transport:
DCtot
5
ð‘
�‘
ð‘
�‘
H[sign(f)M(ue, u
l, f)]M(u
eu
l, f)du
edu
l.
(4)
Here H(x) is the Heaviside function, with H(x) 5 1 for
x $ 0 and H(x) 5 0 otherwise. By definition, DCtot offers
an upper bound on the magnitude of the streamfunction
in any isentropic coordinate system.
When computing the streamfunctions on either dry
or moist isentropes [Eqs. (2a), (2b)], we integrate the mass
transport M(ue, ul) on a half plane delimited by either
a vertical (for Cul
) or horizontal (for Cue
) line. When
computing the circulation on moist isentropes Cue
, most
of the air parcels at a given value of ue are moving in the
same direction, that is, either poleward or equatorward.
This implies that when the circulation is computed by
integrating the mass transport M at constant ue there will
be little cancellation between equatorward and pole-
ward flows. In contrast, computing the mass transport
FIG. 2. Total mass transport on moist isentropes (solid lines) and dry isentropes (dashed lines)
for the (top) annual mean, (middle) JJA, and (bottom) DJF circulation.
3082 J O U R N A L O F C L I M A T E VOLUME 23
Cul
on liquid water isentropes requires integration at
a constant value of ul, which corresponds to a vertical
line in Fig. 3. As there is often significant mass flux in
both poleward and equatorward directions at a given
value of ul, the net mass flux on dry isentropes corre-
sponds to a small residual left after adding up the two
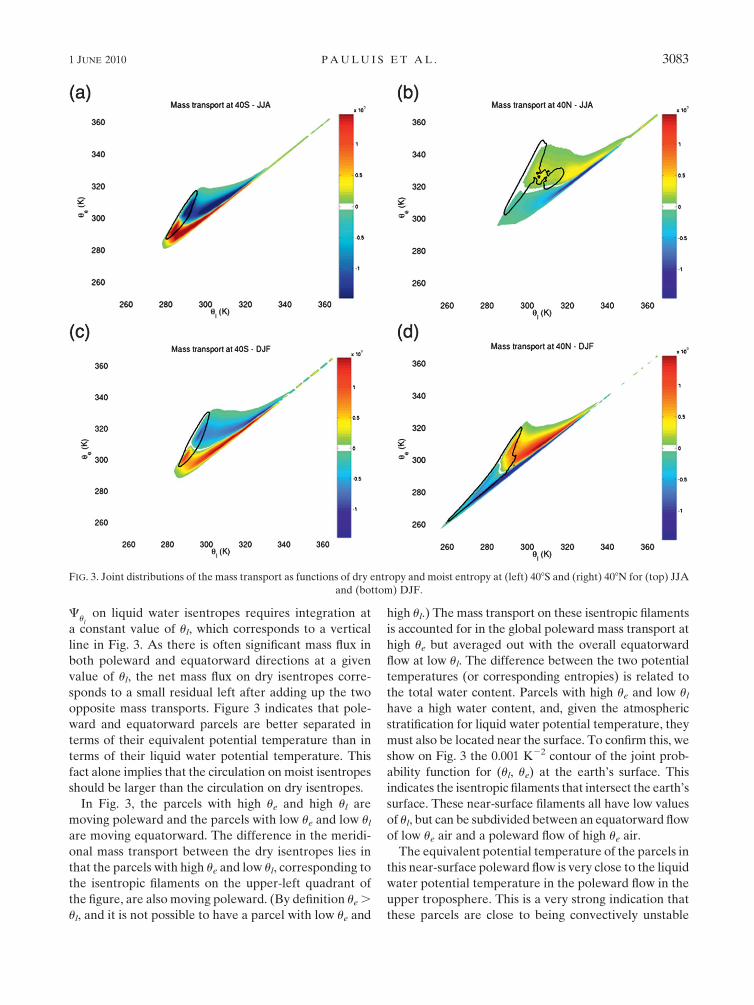
opposite mass transports. Figure 3 indicates that pole-
ward and equatorward parcels are better separated in
terms of their equivalent potential temperature than in
terms of their liquid water potential temperature. This
fact alone implies that the circulation on moist isentropes
should be larger than the circulation on dry isentropes.
In Fig. 3, the parcels with high ue and high ul are
moving poleward and the parcels with low ue and low ul
are moving equatorward. The difference in the meridi-
onal mass transport between the dry isentropes lies in
that the parcels with high ue and low ul, corresponding to
the isentropic filaments on the upper-left quadrant of
the figure, are also moving poleward. (By definition ue .
ul, and it is not possible to have a parcel with low ue and
high ul.) The mass transport on these isentropic filaments
is accounted for in the global poleward mass transport at
high ue but averaged out with the overall equatorward
flow at low ul. The difference between the two potential
temperatures (or corresponding entropies) is related to
the total water content. Parcels with high ue and low ul
have a high water content, and, given the atmospheric
stratification for liquid water potential temperature, they
must also be located near the surface. To confirm this, we
show on Fig. 3 the 0.001 K22 contour of the joint prob-
ability function for (ul, ue) at the earth’s surface. This
indicates the isentropic filaments that intersect the earth’s
surface. These near-surface filaments all have low values
of ul, but can be subdivided between an equatorward flow
of low ue air and a poleward flow of high ue air.
The equivalent potential temperature of the parcels in
this near-surface poleward flow is very close to the liquid
water potential temperature in the poleward flow in the
upper troposphere. This is a very strong indication that
these parcels are close to being convectively unstable
FIG. 3. Joint distributions of the mass transport as functions of dry entropy and moist entropy at (left) 408S and (right) 408N for (top) JJA
and (bottom) DJF.
1 JUNE 2010 P A U L U I S E T A L . 3083
and are ready to rise into the upper troposphere. These
warm moist air parcels transport water from the sub-
tropics into midlatitudes and dispose of it through pre-
cipitation as they ascend in the storm tracks. The mass
transport in this low-level flow is comparable to the upper-
tropospheric branch of the global circulation in mid-
latitudes, and one would thus expect that half of the air
parcels near the tropopause in the polar region would
have risen to this level within the midlatitude storm tracks
rather than in equatorial regions.
The situation is opposite in equatorial regions, where
total mass transport on moist isentropes DCue
is smaller
by about 30%–50% than the mass transport on liquid
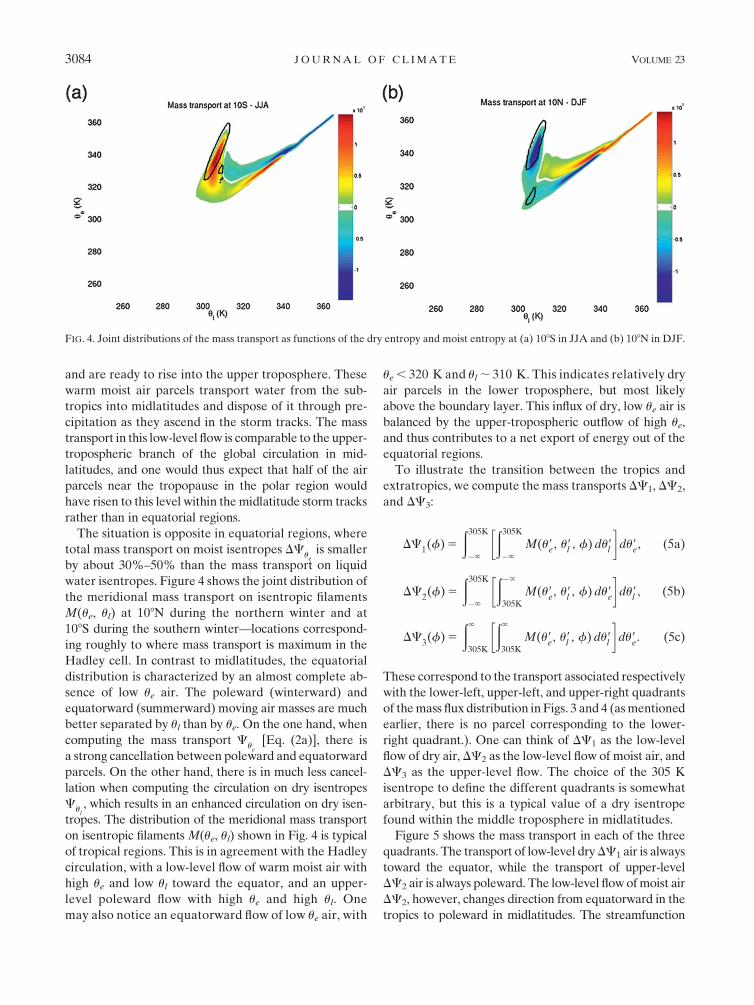
water isentropes. Figure 4 shows the joint distribution of
the meridional mass transport on isentropic filaments
M(ue, ul) at 108N during the northern winter and at
108S during the southern winter—locations correspond-
ing roughly to where mass transport is maximum in the
Hadley cell. In contrast to midlatitudes, the equatorial
distribution is characterized by an almost complete ab-
sence of low ue air. The poleward (winterward) and
equatorward (summerward) moving air masses are much
better separated by ul than by ue. On the one hand, when
computing the mass transport Cu
e[Eq. (2a)], there is
a strong cancellation between poleward and equatorward
parcels. On the other hand, there is in much less cancel-
lation when computing the circulation on dry isentropes
Cul
, which results in an enhanced circulation on dry isen-
tropes. The distribution of the meridional mass transport
on isentropic filaments M(ue, ul) shown in Fig. 4 is typical
of tropical regions. This is in agreement with the Hadley
circulation, with a low-level flow of warm moist air with
high ue and low ul toward the equator, and an upper-
level poleward flow with high ue and high ul. One
may also notice an equatorward flow of low ue air, with
ue , 320 K and ul ; 310 K. This indicates relatively dry
air parcels in the lower troposphere, but most likely
above the boundary layer. This influx of dry, low ue air is
balanced by the upper-tropospheric outflow of high ue,
and thus contributes to a net export of energy out of the
equatorial regions.
To illustrate the transition between the tropics and
extratropics, we compute the mass transports DC1, DC2,
and DC3:
DC1(f) 5
ð305K
�‘
ð305K
�‘
M(u9e, u9
l, f) du9
l
� �du9
e, (5a)
DC2(f) 5
ð305K
�‘
ð�‘
305K
M(u9e, u9
l, f) du9
e
� �du9
l, (5b)
DC3(f) 5
ð‘
305K
ð‘
305K
M(u9e, u9
l, f) du9
l
� �du9
e. (5c)
These correspond to the transport associated respectively
with the lower-left, upper-left, and upper-right quadrants
of the mass flux distribution in Figs. 3 and 4 (as mentioned
earlier, there is no parcel corresponding to the lower-
right quadrant.). One can think of DC1 as the low-level
flow of dry air, DC2 as the low-level flow of moist air, and
DC3 as the upper-level flow. The choice of the 305 K
isentrope to define the different quadrants is somewhat
arbitrary, but this is a typical value of a dry isentrope
found within the middle troposphere in midlatitudes.
Figure 5 shows the mass transport in each of the three
quadrants. The transport of low-level dry DC1 air is always
toward the equator, while the transport of upper-level
DC2 air is always poleward. The low-level flow of moist air
DC2, however, changes direction from equatorward in the
tropics to poleward in midlatitudes. The streamfunction
FIG. 4. Joint distributions of the mass transport as functions of the dry entropy and moist entropy at (a) 108S in JJA and (b) 108N in DJF.
3084 J O U R N A L O F C L I M A T E VOLUME 23
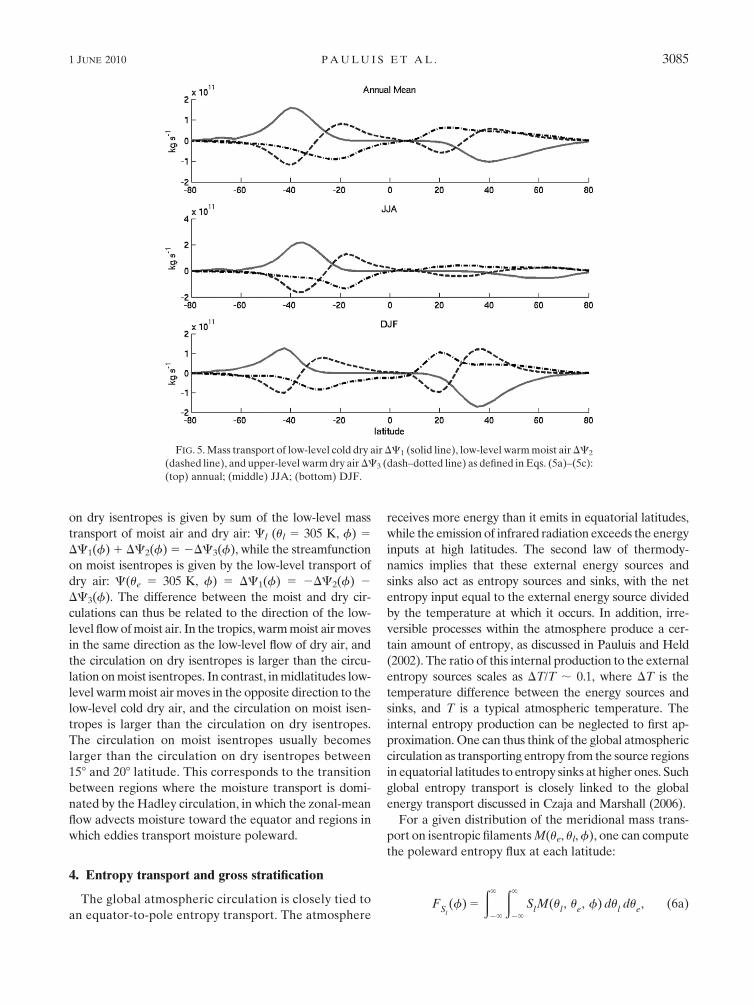
on dry isentropes is given by sum of the low-level mass
transport of moist air and dry air: Cl (ul 5 305 K, f) 5
DC1(f) 1 DC2(f) 5 2DC3(f), while the streamfunction
on moist isentropes is given by the low-level transport of
dry air: C(ue 5 305 K, f) 5 DC1(f) 5 2DC2(f) 2
DC3(f). The difference between the moist and dry cir-
culations can thus be related to the direction of the low-
level flow of moist air. In the tropics, warm moist air moves
in the same direction as the low-level flow of dry air, and
the circulation on dry isentropes is larger than the circu-
lation on moist isentropes. In contrast, in midlatitudes low-
level warm moist air moves in the opposite direction to the
low-level cold dry air, and the circulation on moist isen-
tropes is larger than the circulation on dry isentropes.
The circulation on moist isentropes usually becomes
larger than the circulation on dry isentropes between
158 and 208 latitude. This corresponds to the transition
between regions where the moisture transport is domi-
nated by the Hadley circulation, in which the zonal-mean
flow advects moisture toward the equator and regions in
which eddies transport moisture poleward.
4. Entropy transport and gross stratification
The global atmospheric circulation is closely tied to
an equator-to-pole entropy transport. The atmosphere
receives more energy than it emits in equatorial latitudes,
while the emission of infrared radiation exceeds the energy
inputs at high latitudes. The second law of thermody-
namics implies that these external energy sources and
sinks also act as entropy sources and sinks, with the net
entropy input equal to the external energy source divided
by the temperature at which it occurs. In addition, irre-
versible processes within the atmosphere produce a cer-
tain amount of entropy, as discussed in Pauluis and Held
(2002). The ratio of this internal production to the external
entropy sources scales as DT/T ; 0.1, where DT is the
temperature difference between the energy sources and
sinks, and T is a typical atmospheric temperature. The
internal entropy production can be neglected to first ap-
proximation. One can thus think of the global atmospheric
circulation as transporting entropy from the source regions
in equatorial latitudes to entropy sinks at higher ones. Such
global entropy transport is closely linked to the global
energy transport discussed in Czaja and Marshall (2006).
For a given distribution of the meridional mass trans-
port on isentropic filaments M(ue, ul, f), one can compute
the poleward entropy flux at each latitude:
FS
l(f) 5
ð‘
�‘
ð‘
�‘
SlM(u
l, u
e, f) du
ldu
e, (6a)
FIG. 5. Mass transport of low-level cold dry air DC1 (solid line), low-level warm moist air DC2
(dashed line), and upper-level warm dry air DC3 (dash–dotted line) as defined in Eqs. (5a)–(5c):
(top) annual; (middle) JJA; (bottom) DJF.
1 JUNE 2010 P A U L U I S E T A L . 3085
FS
m(f) 5
ð‘
�‘
ð‘
�‘
Sm
M(ul, u
e, f) du
ldu
e. (6b)
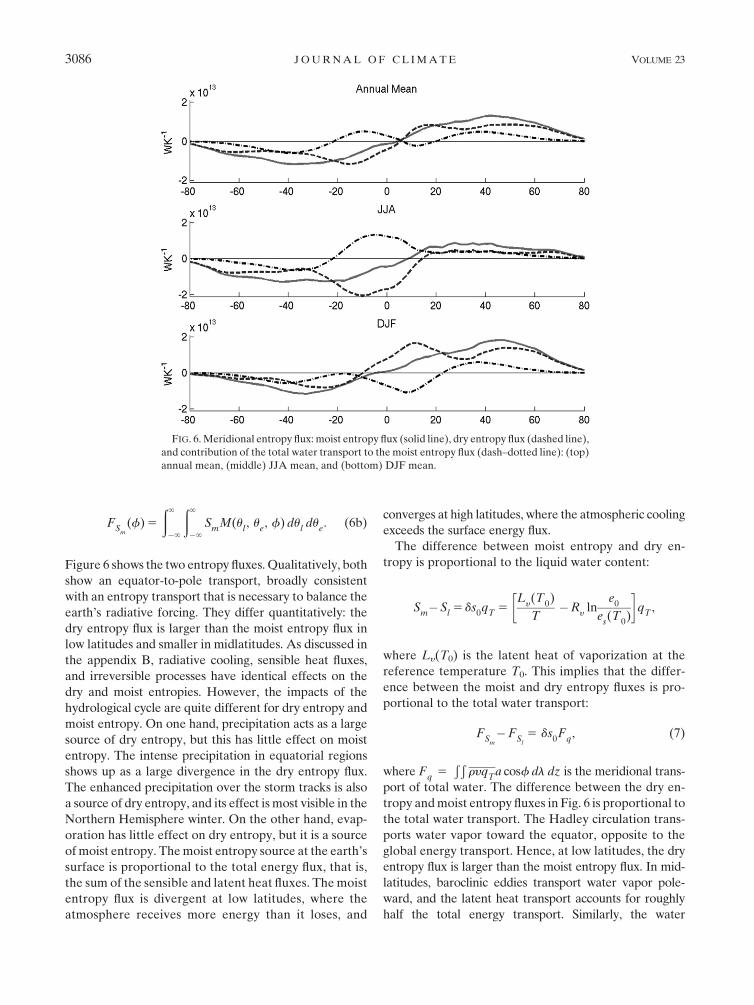
Figure 6 shows the two entropy fluxes. Qualitatively, both
show an equator-to-pole transport, broadly consistent
with an entropy transport that is necessary to balance the
earth’s radiative forcing. They differ quantitatively: the
dry entropy flux is larger than the moist entropy flux in
low latitudes and smaller in midlatitudes. As discussed in
the appendix B, radiative cooling, sensible heat fluxes,
and irreversible processes have identical effects on the
dry and moist entropies. However, the impacts of the
hydrological cycle are quite different for dry entropy and
moist entropy. On one hand, precipitation acts as a large
source of dry entropy, but this has little effect on moist
entropy. The intense precipitation in equatorial regions
shows up as a large divergence in the dry entropy flux.
The enhanced precipitation over the storm tracks is also
a source of dry entropy, and its effect is most visible in the
Northern Hemisphere winter. On the other hand, evap-
oration has little effect on dry entropy, but it is a source
of moist entropy. The moist entropy source at the earth’s
surface is proportional to the total energy flux, that is,
the sum of the sensible and latent heat fluxes. The moist
entropy flux is divergent at low latitudes, where the
atmosphere receives more energy than it loses, and
converges at high latitudes, where the atmospheric cooling
exceeds the surface energy flux.
The difference between moist entropy and dry en-
tropy is proportional to the liquid water content:
Sm�S
l5 ds
0q
T5
Ly(T
0)
T�R
yln
e0
es(T
0)
� �q
T,
where Ly(T0) is the latent heat of vaporization at the
reference temperature T0. This implies that the differ-
ence between the moist and dry entropy fluxes is pro-
portional to the total water transport:
FS
m�F
Sl5 ds
0F
q, (7)
where Fq
5Ð Ð
ryqT
a cosf dl dz is the meridional trans-
port of total water. The difference between the dry en-
tropy and moist entropy fluxes in Fig. 6 is proportional to
the total water transport. The Hadley circulation trans-
ports water vapor toward the equator, opposite to the
global energy transport. Hence, at low latitudes, the dry
entropy flux is larger than the moist entropy flux. In mid-
latitudes, baroclinic eddies transport water vapor pole-
ward, and the latent heat transport accounts for roughly
half the total energy transport. Similarly, the water
FIG. 6. Meridional entropy flux: moist entropy flux (solid line), dry entropy flux (dashed line),
and contribution of the total water transport to the moist entropy flux (dash–dotted line): (top)
annual mean, (middle) JJA mean, and (bottom) DJF mean.
3086 J O U R N A L O F C L I M A T E VOLUME 23
contribution accounts for about half the moist entropy
transport in midlatitudes.
The relationship between mass and entropy transport
can be assessed by defining an effective stratification as
the ratio of the entropy flux to the total mass transport:
DSl5
FS
l
DCu
l
, (8a)
DSm
5F
Sm
DCu
e
. (8b)
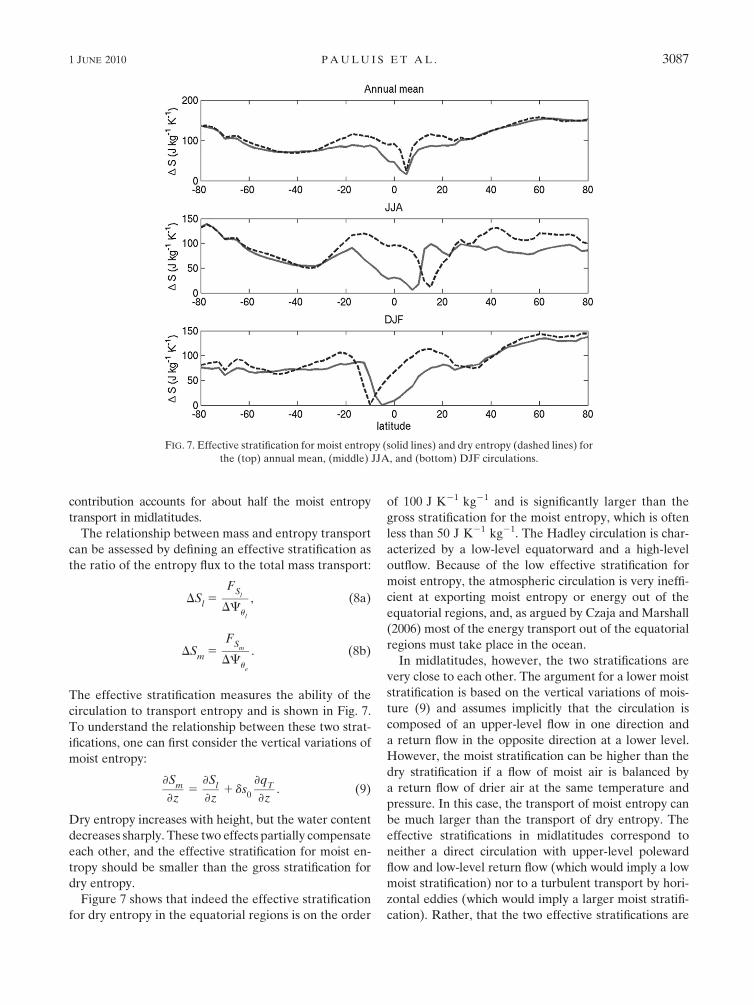
The effective stratification measures the ability of the
circulation to transport entropy and is shown in Fig. 7.
To understand the relationship between these two strat-
ifications, one can first consider the vertical variations of
moist entropy:
›Sm
›z5
›Sl
›z1 ds
0
›qT
›z. (9)
Dry entropy increases with height, but the water content
decreases sharply. These two effects partially compensate
each other, and the effective stratification for moist en-
tropy should be smaller than the gross stratification for
dry entropy.
Figure 7 shows that indeed the effective stratification
for dry entropy in the equatorial regions is on the order
of 100 J K21 kg21 and is significantly larger than the
gross stratification for the moist entropy, which is often
less than 50 J K21 kg21. The Hadley circulation is char-
acterized by a low-level equatorward and a high-level
outflow. Because of the low effective stratification for
moist entropy, the atmospheric circulation is very ineffi-
cient at exporting moist entropy or energy out of the
equatorial regions, and, as argued by Czaja and Marshall
(2006) most of the energy transport out of the equatorial
regions must take place in the ocean.
In midlatitudes, however, the two stratifications are
very close to each other. The argument for a lower moist
stratification is based on the vertical variations of mois-
ture (9) and assumes implicitly that the circulation is
composed of an upper-level flow in one direction and
a return flow in the opposite direction at a lower level.
However, the moist stratification can be higher than the
dry stratification if a flow of moist air is balanced by
a return flow of drier air at the same temperature and
pressure. In this case, the transport of moist entropy can
be much larger than the transport of dry entropy. The
effective stratifications in midlatitudes correspond to
neither a direct circulation with upper-level poleward
flow and low-level return flow (which would imply a low
moist stratification) nor to a turbulent transport by hori-
zontal eddies (which would imply a larger moist stratifi-
cation). Rather, that the two effective stratifications are
FIG. 7. Effective stratification for moist entropy (solid lines) and dry entropy (dashed lines) for
the (top) annual mean, (middle) JJA, and (bottom) DJF circulations.
1 JUNE 2010 P A U L U I S E T A L . 3087
comparable indicates that midlatitude flow is a mixture of
direct and eddy-dominated circulations.
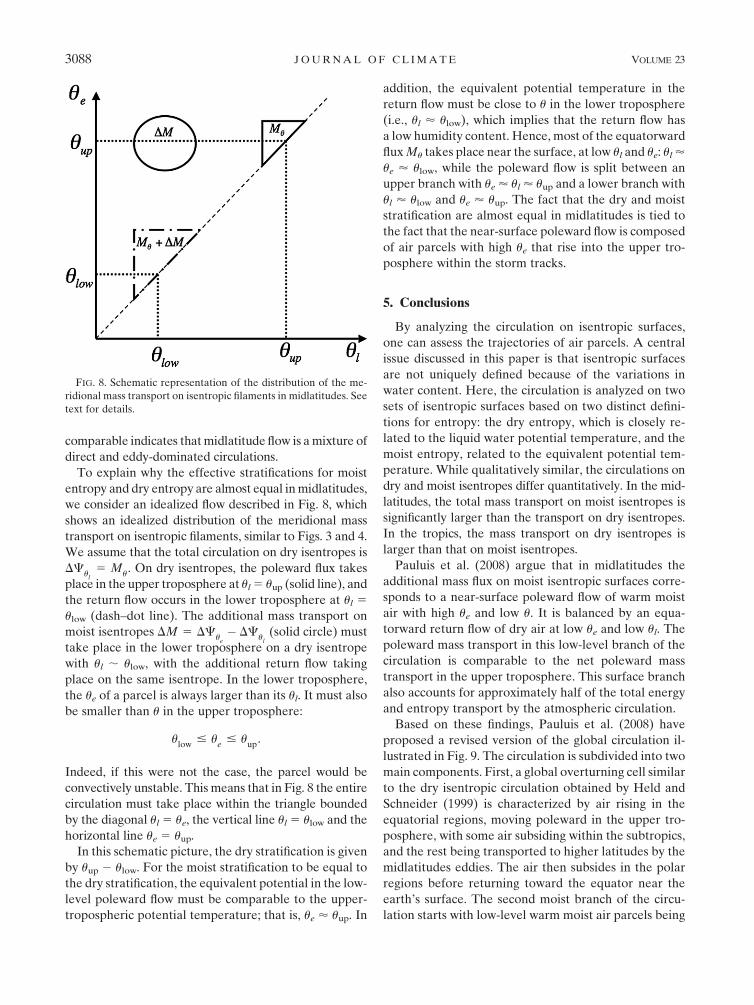
To explain why the effective stratifications for moist
entropy and dry entropy are almost equal in midlatitudes,
we consider an idealized flow described in Fig. 8, which
shows an idealized distribution of the meridional mass
transport on isentropic filaments, similar to Figs. 3 and 4.
We assume that the total circulation on dry isentropes is
DCu
l5 M
u. On dry isentropes, the poleward flux takes
place in the upper troposphere at ul 5 uup (solid line), and
the return flow occurs in the lower troposphere at ul 5
ulow (dash–dot line). The additional mass transport on
moist isentropes DM 5 DCue� DC
ul(solid circle) must
take place in the lower troposphere on a dry isentrope
with ul ; ulow, with the additional return flow taking
place on the same isentrope. In the lower troposphere,
the ue of a parcel is always larger than its ul. It must also
be smaller than u in the upper troposphere:
ulow
# ue
# uup
.
Indeed, if this were not the case, the parcel would be
convectively unstable. This means that in Fig. 8 the entire
circulation must take place within the triangle bounded
by the diagonal ul 5 ue, the vertical line ul 5 ulow and the
horizontal line ue 5 uup.
In this schematic picture, the dry stratification is given
by uup 2 ulow. For the moist stratification to be equal to
the dry stratification, the equivalent potential in the low-
level poleward flow must be comparable to the upper-
tropospheric potential temperature; that is, ue ’ uup. In
addition, the equivalent potential temperature in the
return flow must be close to u in the lower troposphere
(i.e., ul ’ ulow), which implies that the return flow has
a low humidity content. Hence, most of the equatorward
flux Mu takes place near the surface, at low ul and ue: ul ’
ue ’ ulow, while the poleward flow is split between an
upper branch with ue ’ ul ’ uup and a lower branch with
ul ’ ulow and ue ’ uup. The fact that the dry and moist
stratification are almost equal in midlatitudes is tied to
the fact that the near-surface poleward flow is composed
of air parcels with high ue that rise into the upper tro-
posphere within the storm tracks.
5. Conclusions
By analyzing the circulation on isentropic surfaces,
one can assess the trajectories of air parcels. A central
issue discussed in this paper is that isentropic surfaces
are not uniquely defined because of the variations in
water content. Here, the circulation is analyzed on two
sets of isentropic surfaces based on two distinct defini-
tions for entropy: the dry entropy, which is closely re-
lated to the liquid water potential temperature, and the
moist entropy, related to the equivalent potential tem-
perature. While qualitatively similar, the circulations on
dry and moist isentropes differ quantitatively. In the mid-
latitudes, the total mass transport on moist isentropes is
significantly larger than the transport on dry isentropes.
In the tropics, the mass transport on dry isentropes is
larger than that on moist isentropes.
Pauluis et al. (2008) argue that in midlatitudes the
additional mass flux on moist isentropic surfaces corre-
sponds to a near-surface poleward flow of warm moist
air with high ue and low u. It is balanced by an equa-
torward return flow of dry air at low ue and low ul. The
poleward mass transport in this low-level branch of the
circulation is comparable to the net poleward mass
transport in the upper troposphere. This surface branch
also accounts for approximately half of the total energy
and entropy transport by the atmospheric circulation.
Based on these findings, Pauluis et al. (2008) have
proposed a revised version of the global circulation il-
lustrated in Fig. 9. The circulation is subdivided into two
main components. First, a global overturning cell similar
to the dry isentropic circulation obtained by Held and
Schneider (1999) is characterized by air rising in the
equatorial regions, moving poleward in the upper tro-
posphere, with some air subsiding within the subtropics,
and the rest being transported to higher latitudes by the
midlatitudes eddies. The air then subsides in the polar
regions before returning toward the equator near the
earth’s surface. The second moist branch of the circu-
lation starts with low-level warm moist air parcels being
FIG. 8. Schematic representation of the distribution of the me-
ridional mass transport on isentropic filaments in midlatitudes. See
text for details.
3088 J O U R N A L O F C L I M A T E VOLUME 23
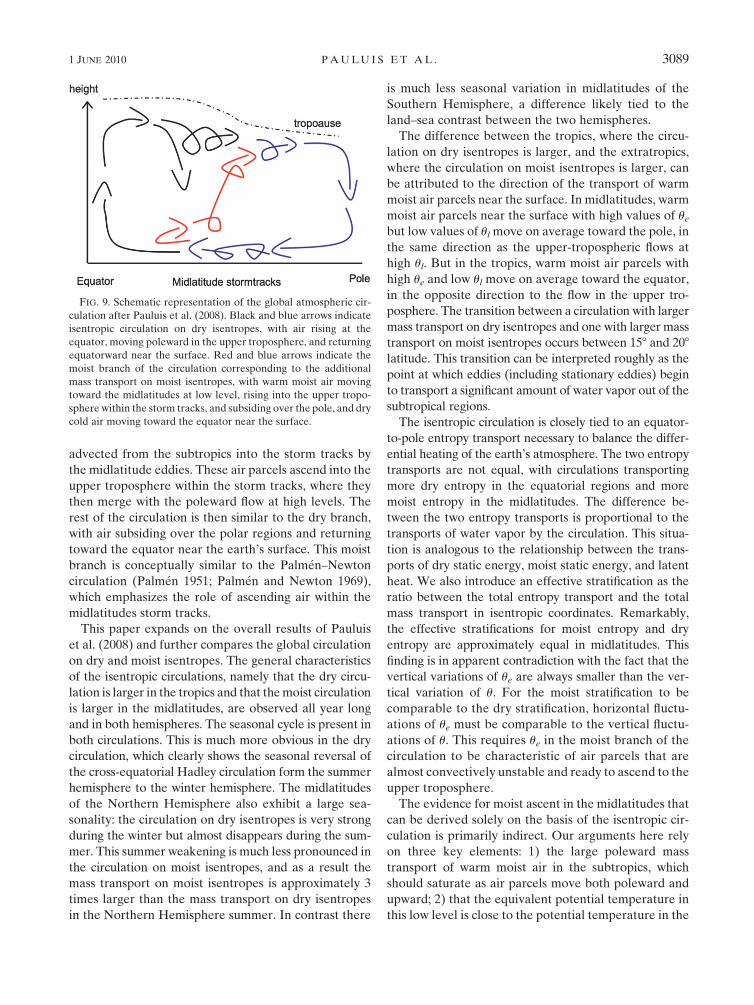
advected from the subtropics into the storm tracks by
the midlatitude eddies. These air parcels ascend into the
upper troposphere within the storm tracks, where they
then merge with the poleward flow at high levels. The
rest of the circulation is then similar to the dry branch,
with air subsiding over the polar regions and returning
toward the equator near the earth’s surface. This moist
branch is conceptually similar to the Palmen–Newton
circulation (Palmen 1951; Palmen and Newton 1969),
which emphasizes the role of ascending air within the
midlatitudes storm tracks.
This paper expands on the overall results of Pauluis
et al. (2008) and further compares the global circulation
on dry and moist isentropes. The general characteristics
of the isentropic circulations, namely that the dry circu-
lation is larger in the tropics and that the moist circulation
is larger in the midlatitudes, are observed all year long
and in both hemispheres. The seasonal cycle is present in
both circulations. This is much more obvious in the dry
circulation, which clearly shows the seasonal reversal of
the cross-equatorial Hadley circulation form the summer
hemisphere to the winter hemisphere. The midlatitudes
of the Northern Hemisphere also exhibit a large sea-
sonality: the circulation on dry isentropes is very strong
during the winter but almost disappears during the sum-
mer. This summer weakening is much less pronounced in
the circulation on moist isentropes, and as a result the
mass transport on moist isentropes is approximately 3
times larger than the mass transport on dry isentropes
in the Northern Hemisphere summer. In contrast there
is much less seasonal variation in midlatitudes of the
Southern Hemisphere, a difference likely tied to the
land–sea contrast between the two hemispheres.
The difference between the tropics, where the circu-
lation on dry isentropes is larger, and the extratropics,
where the circulation on moist isentropes is larger, can
be attributed to the direction of the transport of warm
moist air parcels near the surface. In midlatitudes, warm
moist air parcels near the surface with high values of ue
but low values of ul move on average toward the pole, in
the same direction as the upper-tropospheric flows at
high ul. But in the tropics, warm moist air parcels with
high ue and low ul move on average toward the equator,
in the opposite direction to the flow in the upper tro-
posphere. The transition between a circulation with larger
mass transport on dry isentropes and one with larger mass
transport on moist isentropes occurs between 158 and 208
latitude. This transition can be interpreted roughly as the
point at which eddies (including stationary eddies) begin
to transport a significant amount of water vapor out of the
subtropical regions.
The isentropic circulation is closely tied to an equator-
to-pole entropy transport necessary to balance the differ-
ential heating of the earth’s atmosphere. The two entropy
transports are not equal, with circulations transporting
more dry entropy in the equatorial regions and more
moist entropy in the midlatitudes. The difference be-
tween the two entropy transports is proportional to the
transports of water vapor by the circulation. This situa-
tion is analogous to the relationship between the trans-
ports of dry static energy, moist static energy, and latent
heat. We also introduce an effective stratification as the
ratio between the total entropy transport and the total
mass transport in isentropic coordinates. Remarkably,
the effective stratifications for moist entropy and dry
entropy are approximately equal in midlatitudes. This
finding is in apparent contradiction with the fact that the
vertical variations of ue are always smaller than the ver-
tical variation of u. For the moist stratification to be
comparable to the dry stratification, horizontal fluctu-
ations of ue must be comparable to the vertical fluctu-
ations of u. This requires ue in the moist branch of the
circulation to be characteristic of air parcels that are
almost convectively unstable and ready to ascend to the
upper troposphere.
The evidence for moist ascent in the midlatitudes that
can be derived solely on the basis of the isentropic cir-
culation is primarily indirect. Our arguments here rely
on three key elements: 1) the large poleward mass
transport of warm moist air in the subtropics, which
should saturate as air parcels move both poleward and
upward; 2) that the equivalent potential temperature in
this low level is close to the potential temperature in the
FIG. 9. Schematic representation of the global atmospheric cir-
culation after Pauluis et al. (2008). Black and blue arrows indicate
isentropic circulation on dry isentropes, with air rising at the
equator, moving poleward in the upper troposphere, and returning
equatorward near the surface. Red and blue arrows indicate the
moist branch of the circulation corresponding to the additional
mass transport on moist isentropes, with warm moist air moving
toward the midlatitudes at low level, rising into the upper tropo-
sphere within the storm tracks, and subsiding over the pole, and dry
cold air moving toward the equator near the surface.
1 JUNE 2010 P A U L U I S E T A L . 3089
upper troposphere, which indicates that the air parcels
are close to be convectively unstable; and 3) that this
low-level flow is associated with the poleward transport
of latent heat, which is released through condensation
and precipitation within the storm tracks. There has been
plenty of evidence of rising saturated air parcels in mid-
latitude eddies. The midlatitude ascent is consistent with
rising motion in the warm conveyor belt of extratropi-
cal cyclones (Carlson 1980; Browning 1999; Stohl 2001)
and with slantwise convective adjustment in midlatitude
storms (Emanuel 1988). This is also consistent with the
arguments proposed by Juckes (2000) and Frierson et al.
(2006) that convective adjustment plays a direct role in
establishing the midlatitude stratification (Frierson 2006,
2008). Korty and Schneider (2007) have diagnosed the
climatology of air masses with lapse rates nearly neutral
to moist convection, identifying those locations and times
where air masses are neutral to gravitational convection
or slantwise convection. They found such a state was
common during winter in the ocean storm tracks. At this
point, it is not possible to determine whether the mid-
latitude ascent occurs through rapid convective events or
slower slantwise motions in baroclinic eddies. To resolve
this issue, one would need much higher-resolution data,
which resolve at least the frontal structure and possibly
the convective scales. While more work must still be done,
our analysis unambiguously confirms that ascent of warm
moist air plays a major role in the dynamics of the mid-
latitude storm tracks.
The circulations on dry and moist isentropes differ sig-
nificantly, though neither should be viewed as better than
the other. Rather, as shown throughout this paper, new
insights can be gained by contrasting them. By compar-
ing the isentropic circulations obtained from numerical
models and observations, one should be able to assess the
model’s ability to simulate some of the key features of the
circulation. For example, differences in the dynamics of
the storm tracks could be identified based on differences
in the isentropic mass transports or stratifications. Com-
bined together, the dry and moist isentropic circulations
offer powerful diagnostic tools to analyze atmospheric
motions. Conversely, in a coupled ocean–atmosphere
model, analysis of the moist atmospheric circulation and
its oceanic counterpart can reveal differences as to which
fluid dominates the poleward energy transport (e.g., Czaja
and Marshall 2006). Overall, we anticipate that simplified
climate models can be built from this new way of looking
at atmospheric motions.
Acknowledgments. This work was supported by the
NSF Grants ATM-0545047 and PHY05-51164. Dargan
Frierson and two anonymous reviewers provided helpful
comments on this manuscript.
APPENDIX A
Entropy of Moist Air
In atmospheric sciences, cloudy air is usually treated
as a mixture of dry air, water vapor, and condensed
water (either liquid water or ice). The specific humidity
qy, the specific humidity for condensate water ql, and the
specific humidity for total water qT are, respectively, the
mass of water vapor, condensed water, and total water
per unit mass of cloudy air. The mass of dry air per unit
mass of cloudy air is thus 1 2 qT. The specific entropy of
moist air S is equal to the weighted average of the spe-
cific entropies of dry air sd, water vapor sy, and con-
densed water sl:
S 5 (1� qT
)sd
1 qys
y1 q
ls
l. (A1)
The specific entropies of the individual components are
sd
5 Cpd
lnT
T0
� Rd
lnp
d
p0
1 sd,0
, (A2a)
sy5 C
pvln
T
T0
� Ry
lne
e0
1 sy,0
, (A2b)
sl5 C
lln
T
T0
1 sl,0
. (A2c)
Here, Cpd, Cpv, and Cl are the specific heat capacities at
constant pressure of dry air, water vapor, and liquid
water; Rd and Ry are the ideal gas constants for dry air
and water vapor; T is the air temperature; and pd and e
are the partial pressure of dry air and water vapor. These
expressions are obtained by assuming that both dry air
and water vapor behave as an ideal gas and by neglecting
the specific volume of condensed water. The definitions
of the specific entropies [(A2a)–(A2c)] include several
integration constants: the reference temperature T0,
reference partial pressure for dry air p0, and water vapor
e0, and the reference entropies for dry air sd,0, water
vapor sy,0, and condensed water sl,0. The expressions for
the specific entropies here are such that they are equal
to their reference values when the component is at the
reference temperature and partial pressure. A common
practice is to choose some typical atmospheric values for
T0 and partial pressures pd,0 and e0, and to set the ref-
erence value for the specific entropies of dry air and of
either liquid water or water vapor to 0.
The integration constant for water vapor and liquid
water cannot be simultaneously set to 0 because the
entropy difference between liquid water and water va-
por at saturation must be
3090 J O U R N A L O F C L I M A T E VOLUME 23
sy� s
l5
Ly
T.
From a practical point of view, it is useful to choose ei-
ther the specific entropy of water vapor or of liquid
water to be 0 in the reference state. The former can be
achieved by setting the integration constant sc,0 to zero
(as well as sd,0). This leads to the standard definition of
the moist entropy Sm:
Sm
5 [(1� qT
)Cpd
1 qT
Cl] ln
T
T0
� (1� qT
)Rd
lnp
d
p0
1 qy
Ly
T� q
yR
yln
e
es(T
0)
. (A3)
An alternative is to set the integration constant sy,0 to
0 so that the entropy of cloudy air is given by the dry
entropy Sl:
Sl5 [(1� q
T)C
pd1 q
TC
py] ln
T
T0
� (1� qT
)Rd
lnp
d
p0
� qyR
yln
e
e0
1 ql
Ly
T� q
lR
yln
es(T)
e0
. (A4)
These expressions for the dry entropy and moist entropy
differ solely in the choice of the reference state for the
water. In particular, the difference between these two
entropies is
Sm� S
l5 q
T
Ly(T
0)
T0
� Ry
lne
0
es(T
0)
� �5 q
Tds
0. (A5)
It should be noted that the entropy used in atmo-
spheric sciences corresponds to the thermodynamic en-
tropy in classical physics. It is a state variable that can be
used in Clausius formulation of the second law. It does
not, however, correspond to the absolute entropy based
on Nernst’s theorem, which states that the entropy of
a system should go to zero as the absolute temperature
goes to zero. The expression for the entropy of an ideal
gas in classical physics S 5 Cp lnT 2 r lnp 1 S0 is fun-
damentally incompatible with Nernst theorem as it is
singular as T / 0. This results from the fact that the
classic concept of an ideal gas neglects quantum effects
that are important at low energy and temperature.1
APPENDIX B
Entropy and the Second Law of Thermodynamics
The second law of thermodynamics requires that the
entropy of an air parcel be conserved for closed, re-
versible adiabatic transformations. In addition, for closed
processes in presence of either energy exchange or irre-
versibility, the second law of thermodynamics can be
written as
rdS
dt5
Q
T1 _S
irr, (B1)
where Q is the external heating rate per unit volume,
and _Sirr is the irreversible entropy production by atmo-
spheric processes, which is always positive. Both the dry
entropy Sl or the moist entropy Sm are valid definitions
of entropy and can be used in formulating the second
law of thermodynamics.
In the atmosphere, however, many processes includ-
ing precipitation, evaporation, and diffusion involve ex-
change of water between air parcels or with the surface.
An open transformation is a process in which water in
either phase is added or removed from a parcel. If _qy
is
the rate of change of specific humidity owing to diffusion
and _ql
the rate of change of the specific humidity for
condensed water owing to precipitation, the entropy
tendency becomes
rdS
dt5
Q
T1 _S
irr1 (s
y� s
d)r _q
y1 (s
l� s
d)r _q
l. (B2)
The tendencies _qy
and _qc
do not include phase transitions
per se, as these correspond to internal transformations
and are already accounted for in (B1). Equation (B2)
applies to both the dry entropy Sl and moist entropy Sm
and differs only by the value for the entropy of condensed
water sl and water vapor sy. Because moist entropy and
dry entropy rely on different reference values for the
specific entropies of water vapor and condensed water,
they are also affected differently by evaporation and
precipitation.
In the definition of moist entropy, the reference state
is chosen such that the specific entropy of the condensed
water is small, but the entropy of water vapor is much
larger because of the term Ly/T. In the entropy tendency
equation, the term proportional to Ly/T is much larger
than any of the other ones in sy 2 sd and in sl 2 sy. Hence,
if we keep only the terms proportional to the latent heat
in the entropy tendency, we get
rdS
m
dt’
Q
T1 _S
irr1
Ly
Tr _q
y. (B3)
1 Nernst’s theorem is tied to the fact that, in quantum physics,
there is a finite energy difference between individual quantum
states. At very low temperature, thermal fluctuations are too weak
to induce any state transition. It is not clear whether Nernst’s
theorem should apply to systems in which energy levels form
a continuum as is the case for an ideal gas in classical physics.
1 JUNE 2010 P A U L U I S E T A L . 3091
Evaporation acts as a source of moist entropy that is
approximately proportional to the surface latent heat
flux. By contrast, precipitation has little effect on moist
entropy.
In the case of the dry entropy, the reference state for
water is such that the entropy of water vapor is close to
that of dry air, while that of liquid water is much smaller
owing to the latent heat contribution 2Ly/T. If we retain
only the contribution from the terms proportional to the
latent heat in sy 2 sd and sl 2 sd, we can approximate the
dry entropy tendency by
rdS
l
dt’
Q
T1 _S
irr�
Ly
Tr _q
c. (B4)
While evaporation has little effect on the dry entropy,
precipitation acts as a large source of the dry entropy.
The entropy increase is approximately proportional to
the net latent heat released by the condensation. (It
should be stressed, however, that the entropy increase
occurs when condensed water is removed, and not when
water vapor condenses.) Thus, in contrast to the moist
entropy, the dry entropy is not conserved during pre-
cipitating convection.
APPENDIX C
Alternative Choice for the Entropy and the GlobalCirculation
Any choices for the integration constants in (A2a)–
(A2c) yield a valid definition of the entropy of moist air,
say Sa, that differs from either Sm and Sl by a constant
multiplied by qT. Because of (A5), it can be expressed as
a linear combination of Sm and Sl:
Sa
5 (1� a)Sm
1 aSl,
where a is an arbitrary constant. The streamfunction on
surfaces of constant value of Sa would be different from
the streamfunctions on dry and moist isentropes. This
raises an important question: what aspects of the isen-
tropic circulation do not depend on the integration
constant?
Our answer is in that, rather than isentropic surfaces,
one should think in terms of isentropic filaments defined as
regions where both entropies Sm and Sl are constant. As Sm
and Sl are constant along such isentropic filaments, so are
all possible definitions of the entropy of moist air. If is-
entropic filaments are defined using different definitions
of entropy—for example Sa 5 (1 2 a)Sm 1 aSl and Sb 5
(1 2 b)Sm 1 bSl, with a 6¼ b—the meridional mass trans-
port on an isentropic filament defined by (Sa, Sb) is given by
Mab
(Sa, S
b, f) dS
adS
b5 M
ml(S
m, S
l, f) dS
mdS
l
!Mab
(Sa, S
b, f)
5 ja� bjMml
(Sm
, Sl, f).
Unlike streamfunction, the distribution of the meridional
mass transport on isentropic filaments does not depend
on any specific definitions for the entropy of moist air.
REFERENCES
Andrews, D. G., and M. E. McIntyre, 1976: Planetary waves in
horizontal and vertical shear: The generalized Eliassen-Palm
relation and the zonal mean acceleration. J. Atmos. Sci., 33,
2031–2048.
Bowman, K. P., and G. D. Carrie, 2002: The mean-meridional
transport circulation of the troposphere in an idealized GCM.
J. Atmos. Sci., 59, 1502–1514.
Browning, K., 1999: Mesoscale aspects of extratropical cyclones:
An observational perspective. The Life-Cycles of Extratropical
Cyclones, M. Shapiro and S. Gronas, Eds., Amer. Meteor. Soc.,
265–283.
Carlson, T., 1980: Airflow through midlatitude cyclones and the
comma pattern. Mon. Wea. Rev., 108, 1498–1509.
Czaja, A., and J. Marshall, 2006: The partitioning of poleward heat
transport between the atmosphere and ocean. J. Atmos. Sci.,
63, 1498–1511.
Dunkerton, T., 1978: On the mean meridional mass motions of
the stratosphere and mesosphere. J. Atmos. Sci., 35, 2325–
2333.
Edmon, H. J., B. J. Hoskins, and M. E. McIntyre, 1980: Eliassen-
Palm cross sections for the troposphere. J. Atmos. Sci., 37,
2600–2616.
Emanuel, K. A., 1988: Observational evidence of slantwise con-
vective adjustment. Mon. Wea. Rev., 116, 1805–1816.
Frierson, D. M. W., 2006: Robust increases in midlatitude static
stability in global warming simulations. Geophys. Res. Lett.,
33, L24816, doi:10.1029/2006GL027504.
——, 2008: Midlatitude static stability in simple and compre-
hensive general circulation models. J. Atmos. Sci., 65, 1049–
1062.
——, I. M. Held, and P. Zurita-Gotor, 2006: A gray-radiation
aquaplanet moist GCM. Part I: Static stability and eddy scale.
J. Atmos. Sci., 63, 2548–2566.
Held, I. M., and T. Schneider, 1999: The surface branch of the zonally
averaged mass transport circulation in the troposphere. J. At-
mos. Sci., 56, 1688–1697.
Iwasaki, T., 1989: A diagnostic formulation for wave–mean flow
interactions and Lagrangian-mean circulation with a hybrid
coordinate of pressure and isentropes. J. Meteor. Soc. Japan,
67, 293–311.
Johnson, D. R., 1989: The forcing and maintenance of global mon-
soonal circulations: An isentropic analysis. Advances in Geo-
physics, Vol. 31, Academic Press, 43–316.
Juckes, M. N., 2000: The static stability of the midlatitude tro-
posphere: The relevance of moisture. J. Atmos. Sci., 57, 3050–
3057.
——, 2001: A generalization of the transformed Eulerian-mean me-
ridional circulations. Quart. J. Roy. Meteor. Soc., 127, 147–160.
——, I. N. James, and M. Blacburn, 1994: The influence of Ant-
arctica on the momentum budget of the southern extratropics.
Quart. J. Roy. Meteor. Soc., 120, 1017–1044.
3092 J O U R N A L O F C L I M A T E VOLUME 23
Kalnay, E., and Coauthors, 1996: The NCEP/NCAR 40-Year Re-
analysis Project. Bull. Amer. Meteor. Soc., 77, 437–471.
Korty, R. L., and T. Schneider, 2007: A climatology of the tropo-
spheric thermal stratification using saturation potential vor-
ticity. J. Climate, 20, 5977–5991.
McIntosh, P. C., and T. J. McDougall, 1996: Isopycnal averaging and
the residual mean circulation. J. Phys. Oceanogr., 26, 1655–1660.
Palmen, E., 1951: The role of atmospheric disturbances in the
general circulation. Quart. J. Roy. Meteor. Soc., 77, 337–354.
——, and C. Newton, 1969: Atmospheric Circulation Systems: Their
Structure and Physical Interpretation. International Geophysics
Series, Vol. 13, Academic Press, 603 pp.
Pauluis, O., and I. M. Held, 2002: Entropy budget of an atmosphere
in radiative–convective equilibrium. Part I: Maximum work
and frictional dissipation. J. Atmos. Sci., 59, 125–139.
——, A. Czaja, and R. Korty, 2008: The global atmospheric circu-
lation on moist isentropes. Science, 321, 1075–1078, doi:10.1126/
science.1159649.
Peixoto, J. P., and A. H. Oort, 1992: Physics of Climate. AIP Press,
520 pp.
Schneider, T., 2004: The tropopause and the thermal stratification
in the extratropics of a dry atmosphere. J. Atmos. Sci., 61,1317–1340.
——, K. Smith, P. O’Gorman, and C. Walker, 2006: A climatology
of tropospheric zonal-mean water vapor fields and fluxes in
isentropic coordinates. J. Climate, 19, 5918–5933.
Stohl, A., 2001: A 1-year Lagrangian ‘climatology’ of airstreams in
the northern hemisphere troposphere and lowermost strato-
sphere. J. Geophys. Res., 106, 7263–7279.
Stokes, G., 1847: On the theory of oscillatory waves. Trans. Cam-
bridge Philos. Soc., 8, 441–455.
Townsend, R. D., and D. R. Johnson, 1985: A diagnostic study
of the isentropic zonally averaged mass circulation during the
first GARP global experiment. J. Atmos. Sci., 42, 1565–1579.
Xu, K.-M., and K. A. Emanuel, 1989: Is the tropical atmosphere
conditionally unstable? Mon. Wea. Rev., 117, 1471–1479.
1 JUNE 2010 P A U L U I S E T A L . 3093