Embed Size (px)
Citation preview
F.-C. CHIEN et al.February 2008 17
1. Introduction
Tropical cyclones are the most threatening weather system that affects Taiwan. There are on average three to four typhoons invading Taiwan
each year. Their strong winds and heavy precipi-tation often cause severe damage on the island. A major reason for the destructive power of a ty-phoon in Taiwan is often related to its interaction with Taiwan’s Central Mountain Range (CMR). The CMR (see Fig. 1), which has a complex ter-rain consisting of steep mountains (exceeding 3000 m), can significantly modify the wind and pressure patterns of a typhoon, resulting in en-hanced precipitation and damaging winds.
With extensive observational studies using 53
Journal of the Meteorological Society of Japan, Vol. 86, No. 1, pp. 17–41, 2008
HeavyRainfallandSouthwesterlyFlow
after theLeavingofTyphoonMindulle(2004) fromTaiwan
Fang-ChingCHIEN
Department of Earth Sciences, National Taiwan Normal University, Taipei, Taiwan
Yi-ChinLIUandCheng-ShangLEE
Department of Atmospheric Sciences, National Taiwan University, Taipei, Taiwan
(Manuscript received 22 January 2007, in final form 3 September 2007 )
Abstract
This paper presents an observational and numerical study of the southwesterly flow and heavy rainfall associated with Typhoon Mindulle (2004). When Mindulle made landfall on the east coast of Taiwan on 1 July 2004, a secondary low formed over the Taiwan Strait. The low then dissipated after Mindulle moved out over the ocean north of Taiwan. Subsequently, the accompanying strong southwesterly flow brought extremely heavy rainfall over southern and central Taiwan.
The modeling study of the 15-km and 5-km grids shows that the southwesterly flow, which resulted from a downgradient acceleration toward the low system over the Taiwan Strait, transported the convec-tively unstable air northeastward over the northern South China Sea. When low-level air convergence pro-vided enough lifting, strong mesoscale convective systems (MCS) were triggered in this region. This con-tributed to the formation of a series of mesolows and mesohighs which prevented air from accelerating farther northeastward. Only after these MCSs dissipated and the Pacific high extended westward was the moist unstable air able to accelerate into the southern Taiwan Strait, where it converged with the westerly flow of the typhoon circulation, producing convective rainbands southwest of Taiwan. When moving over land, these MCSs were enhanced, resulting in heavy rainfall. It is concluded that although the typhoon circulation was critical on the rainband development, the importance of the southwesterly flow in bring-ing the moist unstable air to converge with the typhoon circulation can not be left out. The southwesterly flow was first induced by typhoon’s low pressure system at early stage, and was enhanced as a result of the westward extension of the Pacific high at later stage. The moisture budget analysis further shows that the development of the MCSs was mainly contributed by the horizontal moisture transport in the south-westerly flow. Evaporation locally from the ocean played only a minor role.
Corresponding author: Fang-Ching Chien, Depart-ment of Earth Sciences, National Taiwan Normal University, No. 88, Section 4, Ting-Chou Rd., Taipei, 116, TAIWAN.E-mail: [email protected]©2008, Meteorological Society of Japan
Journal of the Meteorological Society of Japan Vol. 86, No. 118
typhoon cases from 1946 to 1975, Wang (1980, 1989) documented that when a typhoon impinges on Taiwan, its track may be continuous or discon-tinuous. The discontinuous track usually happens for weak typhoons. When a weak typhoon makes landfall, a secondary low can form on the lee side of the CMR and then replace the original typhoon (Brand and Blelloch 1974; Bender et al. 1985, 1987; Chang 1982). Yeh and Elsberry (1993a, b) showed that the deflection of a weaker and slow-er-moving typhoon by the CMR tends to be larger than that of a stronger one. Numerical studies by Lin et al. (1999) and Wu (2001) showed that the influence of the CMR on a westward-moving ty-phoon included deceleration and southward devia-tion in the upstream, and a quasi-stationary sec-ondary low to the west of the CMR. Lin et al. (2005), using several flow parameters, further proposed a conceptual model to explain track deflection and
continuity.Another important issue about a typhoon pass-
ing the CMR is the enhanced precipitation. Ac-cording to Lin et al. (2001), heavy orographic rainfall may occur under some common condi-tions including a conditionally or potentially un-stable airstream impinging on the barrier, a very moist low-level jet, a steep mountain, and a quasi-stationary system. Lin et al. (2002) further applied this flux model to explain the rainfall distribution associated with Supertyphoon Bilis (2000) and showed that rainfall occurring in the vicinity of topography was strongly controlled by orographic forcing, rather than the original rainbands of the typhoon. Wu and Kuo (1999) and Wu et al. (2002) studied Typhoon Herb (1996) and found that the CMR played an important role in modifying the rainfall distribution on the island.
The aforementioned papers represent, for the past two decades or so, the research direction of typhoon studies in Taiwan, which have primar-ily focused on the early or landfall stages of a typhoon. The former stage is for track forecast and the latter is for rainfall prediction. Not much attention has been given to the late stage when the storm moves away from Taiwan. Many ty-phoons like Tropical Storm Rachel, however, can induce strong southwesterly flow when they leave Taiwan, bringing heavy precipitation over south-ern and southwestern Taiwan (Chiao and Lin 2003). The rainfall is often more intense than that brought by the typhoon itself. There are usually mesoscale convective systems (MCS) forming in the warm moist airstream (often a low-level jet), which share many common features with those of a Mei-yu front (Trier et al. 1990; Chen 1992; Chen et al. 1998). Typhoon Mindulle (2004), asso-ciated with strong southwesterly monsoonal flow that brought heavy rainfall and caused serious disasters over the central and southwestern parts of Taiwan in early July 2004, is probably one of the best examples to study this phenomenon. The objective of this paper is thus to examine the mesoscale features that were responsible for the heavy rainfall associated with Mindulle. We will focus on examining the structure and evolution of the southwesterly flow, comparing the MCSs that formed over the northern South China Sea (SCS) and those over the southern Taiwan Strait, and examining the momentum and moisture budgets in the southwesterly flow.
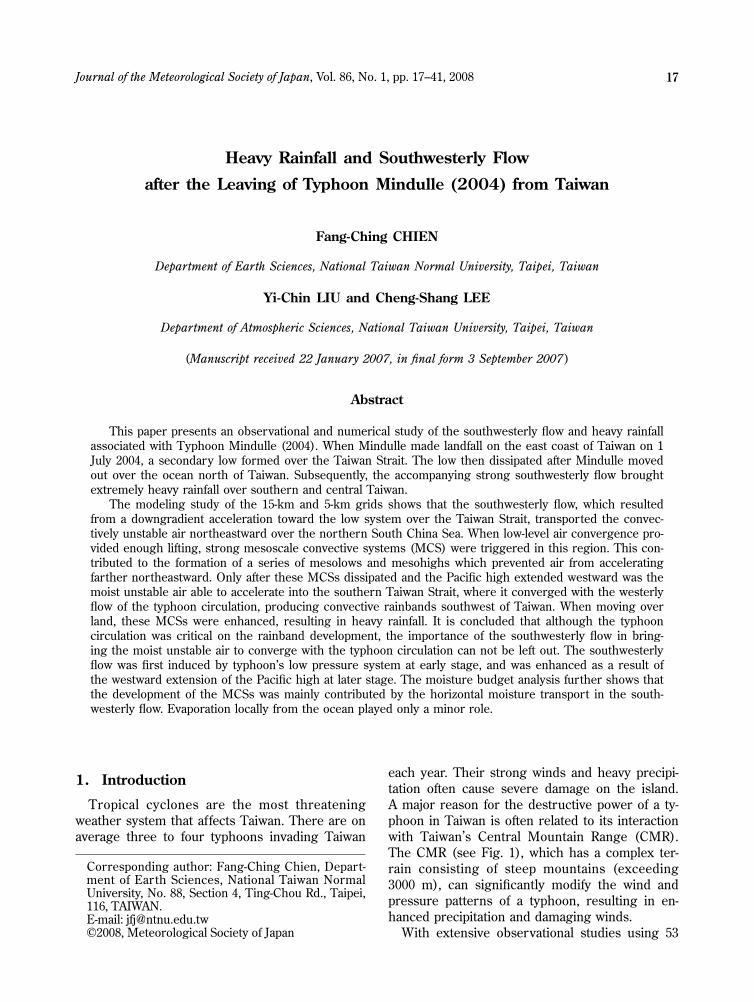
Fig. 1. The observed track of Typhoon Mindulle (2004), issued by the CWB (Central Weather Bureau), from 1200 UTC 28 June to 0000 UTC 3 July 2004 at 6-h intervals is shown in black dots. The simulated track (0–48 h) at 6-h intervals is denoted in black squares.
F.-C. CHIEN et al.February 2008 19
2. ObservationsofMindulle(2004)
The observation data from the Central Weather Bureau (CWB) of Taiwan show that Typhoon Mindulle (2004) first developed over the ocean to the northwest of Guam on 23 June 2004, and sub-sequently moved westward. By 27 June, Mindulle had shifted to the east of the Philippines and be-come a category-2 typhoon with maximum winds1 reaching 43 m s–1. After an intensity decrease near the Philippines, Mindulle started to turn to-ward the north on 30 June (Fig. 1). The typhoon center made landfall on the east coast of Taiwan at about 1440 UTC 1 July 2004, after which it be-came difficult to trace over land. At 0300 UTC 2 July, the typhoon center appeared again as it was leaving the north coast of Taiwan. Earlier, fol-lowing the landfall of Mindulle, a secondary low formed to the west of the island over the Taiwan Strait at 0000 UTC 2 July 2004. The low moved northward over the Strait along the coast, and then made landfall on the northwest coast and
disappeared after 0600 UTC 2 July. Since the low was very shallow and rather dry, its circulation could only be detected in visible satellite pictures during daytime hours of 2 July (not shown).
After leaving Taiwan, Mindulle moved toward the north-northeast over the East China Sea, and then transformed into an extratropical cyclone after 4 July 2004. Through the course of landfall-ing, the typhoon itself did not create too much damage in terms of winds and precipitation. How-ever, the strong southwesterly flow that formed af-ter Mindulle left Taiwan brought extremely heavy rainfall over the southern and central parts of the island, resulting in severe flooding and mudslides in many regions. In total, Mindulle caused 29 deaths, and 12 missing. More than 10,000 people were forced to evacuate their homes.
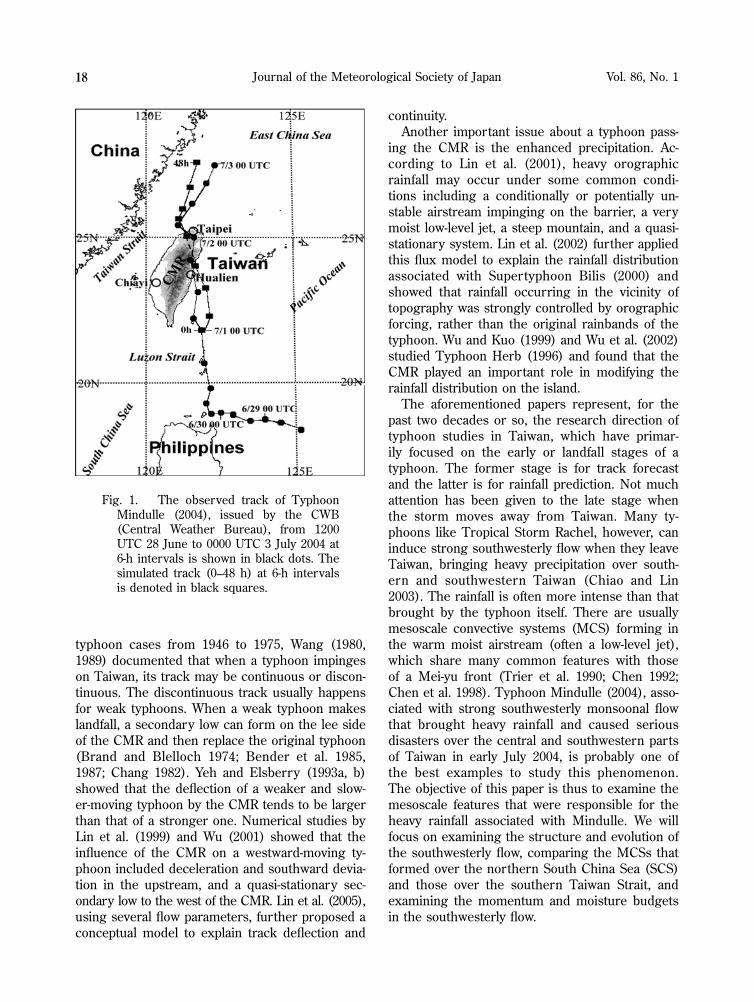
The 24-h accumulated rainfall observed at the 367 rain gauge stations in Taiwan on 1 July, when the typhoon was traveling along the east coast and over land, shows that precipitation with max-ima of 200–400 mm occurred primarily on the windward (east) side of the CMR (Fig. 2a). When Mindulle left Taiwan on the next day (2 July, Fig. 2b), heavy rainfall was observed on the western and southern parts of Taiwan, including the low-land and mountainous areas. The three regions
1 The intensity of a typhoon over ocean is estimated from satellite observations using the Dvorak tropical cyclone intensity estimation technique (Velden et al. 2006) by the CWB. When a typhoon is over land, the maximum wind is determined by 10-min average.
Fig. 2. The 24-h accumulated rainfall (mm) from the rain gauge stations in Taiwan: (a) 0000 UTC 1 July to 0000 UTC 2 July 2004, (b) 0000 UTC 2 July to 0000 UTC 3 July 2004. The maximum rainfall amounts are also shown.
Journal of the Meteorological Society of Japan Vol. 86, No. 120
of maximum rainfall (657, 787, and 715 mm, from north to south) coincided with the highest peaks of the CMR. Precipitation decreased consider-ably over the western plains on 3 July 2004 (not shown).
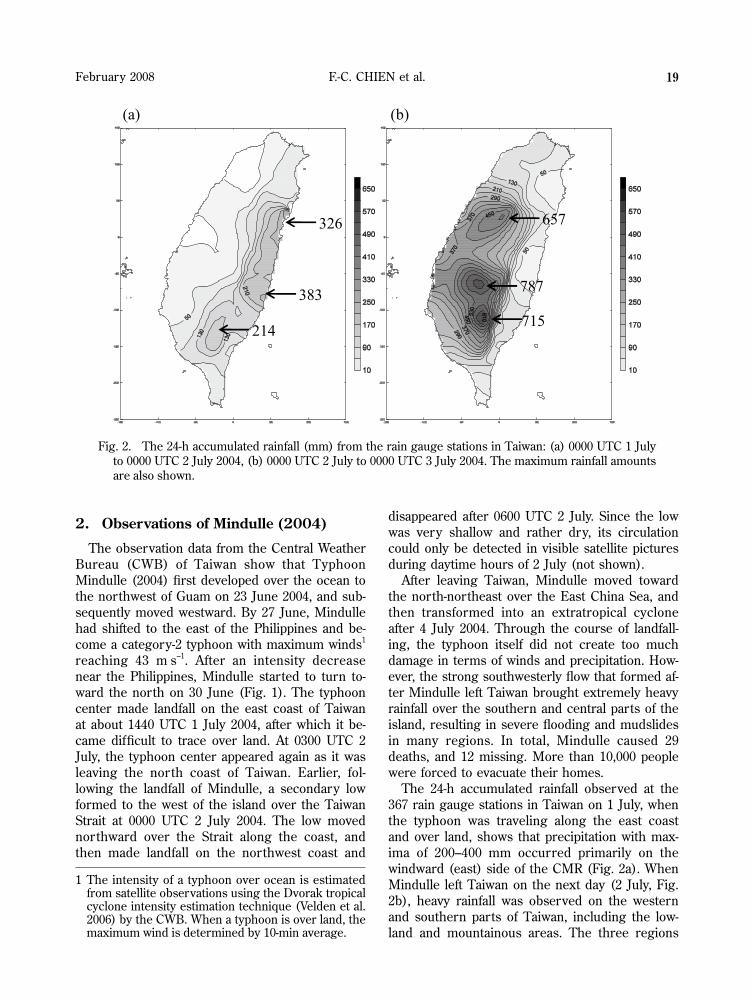
Surface analyses at 1200 UTC 1 July 2004 (Fig. 3a) show that Mindulle, with a center pressure of ~980 hPa, was located near the eastern coastline of Taiwan. To the east-northeast near 30°N, 145°E, there was another typhoon named Tingting mov-ing northeastward. One day later at 1200 UTC 2 July 2004 (Fig. 3b), Mindulle had moved to the north of Taiwan and Tingting to the east of Japan.
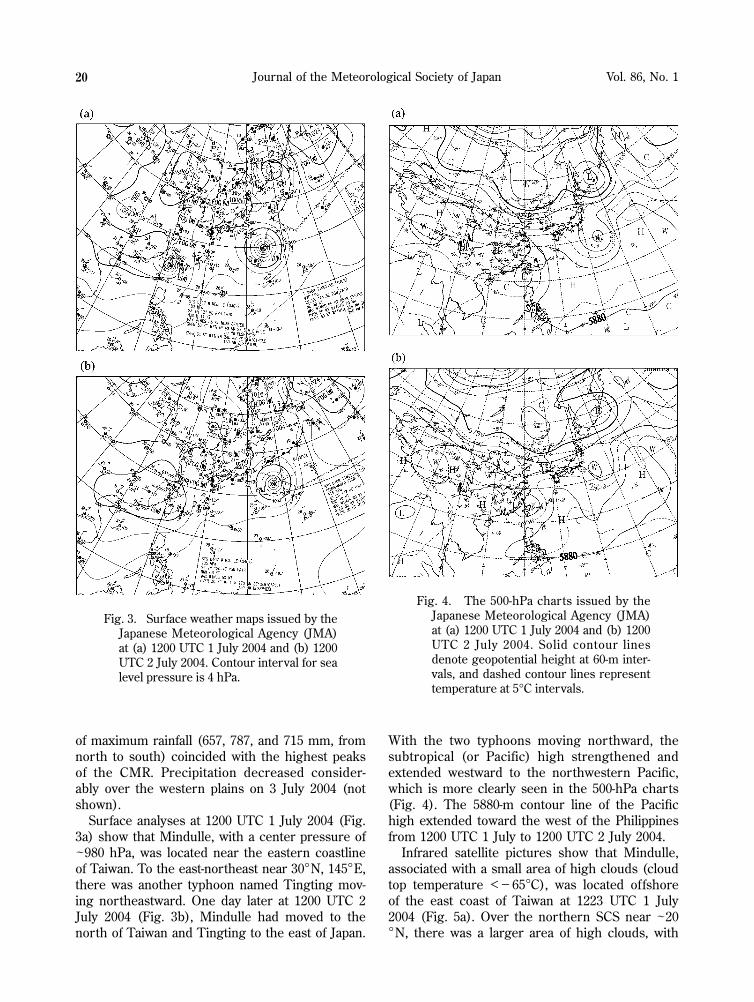
With the two typhoons moving northward, the subtropical (or Pacific) high strengthened and extended westward to the northwestern Pacific, which is more clearly seen in the 500-hPa charts (Fig. 4). The 5880-m contour line of the Pacific high extended toward the west of the Philippines from 1200 UTC 1 July to 1200 UTC 2 July 2004.
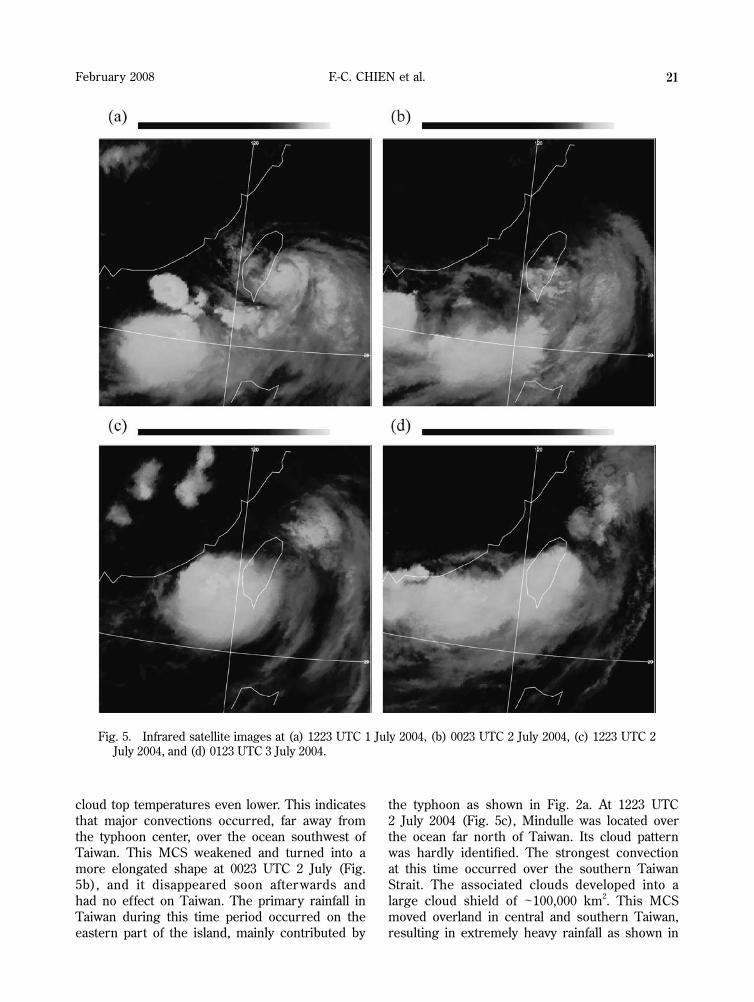
Infrared satellite pictures show that Mindulle, associated with a small area of high clouds (cloud top temperature <-65°C), was located offshore of the east coast of Taiwan at 1223 UTC 1 July 2004 (Fig. 5a). Over the northern SCS near ~20°N, there was a larger area of high clouds, with
Fig. 3. Surface weather maps issued by the Japanese Meteorological Agency (JMA) at (a) 1200 UTC 1 July 2004 and (b) 1200 UTC 2 July 2004. Contour interval for sea level pressure is 4 hPa.
Fig. 4. The 500-hPa charts issued by the Japanese Meteorological Agency (JMA) at (a) 1200 UTC 1 July 2004 and (b) 1200 UTC 2 July 2004. Solid contour lines denote geopotential height at 60-m inter-vals, and dashed contour lines represent temperature at 5°C intervals.
F.-C. CHIEN et al.February 2008 21
cloud top temperatures even lower. This indicates that major convections occurred, far away from the typhoon center, over the ocean southwest of Taiwan. This MCS weakened and turned into a more elongated shape at 0023 UTC 2 July (Fig. 5b), and it disappeared soon afterwards and had no effect on Taiwan. The primary rainfall in Taiwan during this time period occurred on the eastern part of the island, mainly contributed by
the typhoon as shown in Fig. 2a. At 1223 UTC 2 July 2004 (Fig. 5c), Mindulle was located over the ocean far north of Taiwan. Its cloud pattern was hardly identified. The strongest convection at this time occurred over the southern Taiwan Strait. The associated clouds developed into a large cloud shield of ~100,000 km2. This MCS moved overland in central and southern Taiwan, resulting in extremely heavy rainfall as shown in
Fig. 5. Infrared satellite images at (a) 1223 UTC 1 July 2004, (b) 0023 UTC 2 July 2004, (c) 1223 UTC 2 July 2004, and (d) 0123 UTC 3 July 2004.
Journal of the Meteorological Society of Japan Vol. 86, No. 122
Fig. 2b. By 0123 UTC 3 July, the MCS had spread over an elongated region and entered its dissipa-tion stage (Fig. 5d).
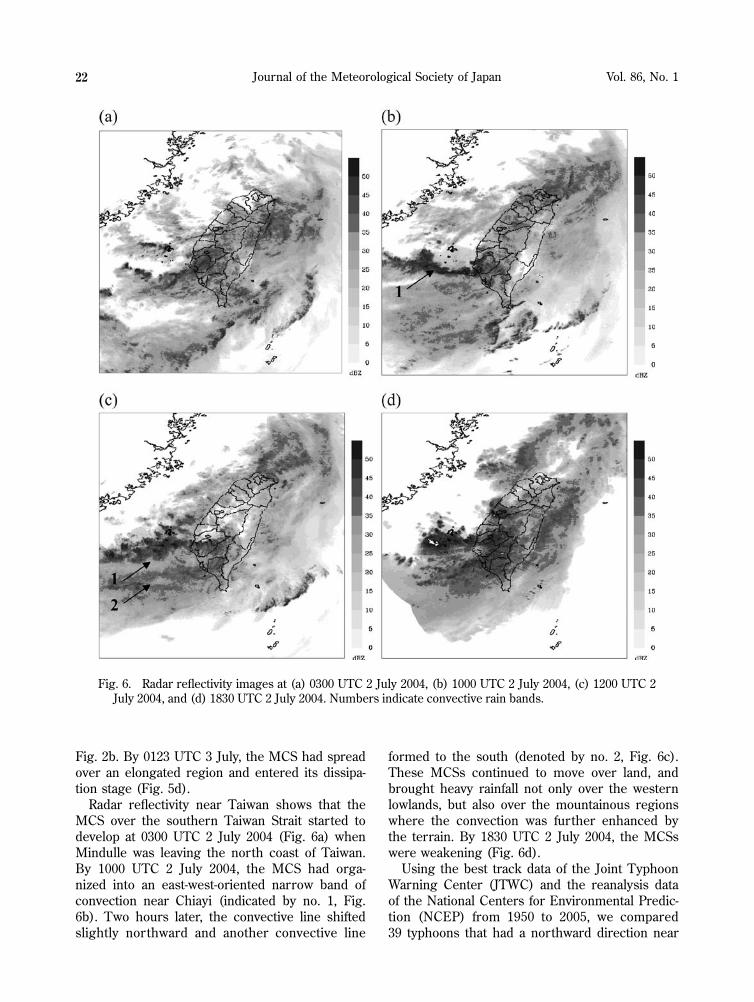
Radar reflectivity near Taiwan shows that the MCS over the southern Taiwan Strait started to develop at 0300 UTC 2 July 2004 (Fig. 6a) when Mindulle was leaving the north coast of Taiwan. By 1000 UTC 2 July 2004, the MCS had orga-nized into an east-west-oriented narrow band of convection near Chiayi (indicated by no. 1, Fig. 6b). Two hours later, the convective line shifted slightly northward and another convective line
formed to the south (denoted by no. 2, Fig. 6c). These MCSs continued to move over land, and brought heavy rainfall not only over the western lowlands, but also over the mountainous regions where the convection was further enhanced by the terrain. By 1830 UTC 2 July 2004, the MCSs were weakening (Fig. 6d).
Using the best track data of the Joint Typhoon Warning Center (JTWC) and the reanalysis data of the National Centers for Environmental Predic-tion (NCEP) from 1950 to 2005, we compared 39 typhoons that had a northward direction near
Fig. 6. Radar reflectivity images at (a) 0300 UTC 2 July 2004, (b) 1000 UTC 2 July 2004, (c) 1200 UTC 2 July 2004, and (d) 1830 UTC 2 July 2004. Numbers indicate convective rain bands.
F.-C. CHIEN et al.February 2008 23
Taiwan, similar to that of Mindulle. The result shows that the southwesterly flow and the as-sociated rainfall of Mindulle were among the top 5% strongest events. Evidently, Mindulle was an extreme case that deserves detail studies to gain scientific insights on the rainfall development.
3. Modelsimulationofthesynopticpattern
3.1 Model settingsThe fifth-generation Pennsylvania State Univer-
sity-National Center for Atmospheric Research Mesoscale Model (MM5) was used in the model-ing study. The model configuration included three domains with 45, 15, and 5 km horizontal grid spacing and two-way interaction between domains. Thirty-one sigma levels were used in the verti-cal, with model top set at 100 hPa and maximum resolution located in the planetary boundary layer (PBL). The Medium-Range Forecast model (MRF) PBL parameterization (Hong and Pan 1996) was applied to represent the PBL processes, including surface fluxes of heat, moisture, and momentum. The Reisner II grid-resolvable explicit moisture scheme and the Grell cumulus parameterization scheme were used to represent the hydrologi-cal processes (Grell et al. 1994). The cumulus scheme was not applied in the innermost domain (5 km). The initial and lateral boundary conditions, including sea surface temperature, were sup-plied by the European Centre for Medium-Range
Weather Forecasts (ECMWF)/Tropical Ocean-Global Atmosphere (TOGA) global analyses with 1.25° resolution. An objective analysis procedure (the Little-R), based on successive correction (i.e., the Cressman scheme), was used to incor-porate upper-air and surface observations from the Global Telecommunications System (GTS). The observations are also used continuously in domain 1 throughout the model simulation by four-dimensional data assimilation (FDDA) nudg-ing. In addition, we used a bogus and replacing procedure proposed by Jian et al. (2006) to create a typhoon that was more representative of the observation at the initial time. The model was ini-tialized at 0000 UTC 1 July 2004 and was run for 48 hours.
3.2 Comparisons with the observationsCompared with the observations at 1200 UTC 1
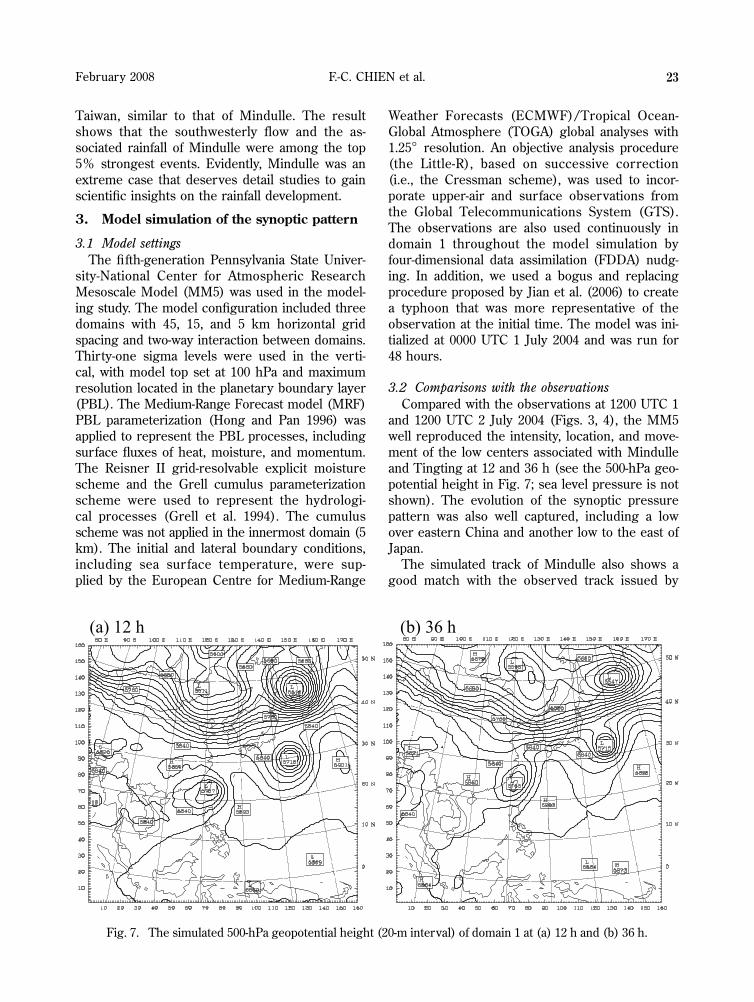
and 1200 UTC 2 July 2004 (Figs. 3, 4), the MM5 well reproduced the intensity, location, and move-ment of the low centers associated with Mindulle and Tingting at 12 and 36 h (see the 500-hPa geo-potential height in Fig. 7; sea level pressure is not shown). The evolution of the synoptic pressure pattern was also well captured, including a low over eastern China and another low to the east of Japan.
The simulated track of Mindulle also shows a good match with the observed track issued by
Fig. 7. The simulated 500-hPa geopotential height (20-m interval) of domain 1 at (a) 12 h and (b) 36 h.
Journal of the Meteorological Society of Japan Vol. 86, No. 124
the CWB (see Fig. 1). The center of Mindulle was located to the southeast of Taiwan when the model started at 0000 UTC 1 July 2004. The simulated typhoon moved northward with a track slightly to the right of the observed one from 0 to 12 h, and it made landfall a little later than the observed. After moving over the ocean to the north of Taiwan, the simulated Mindulle was heading toward the north-northeast slightly to the left of the observed track. As for the intensity, the center pressure and maximum wind speed of the simulated typhoon both agreed well with the observation (figures not shown).
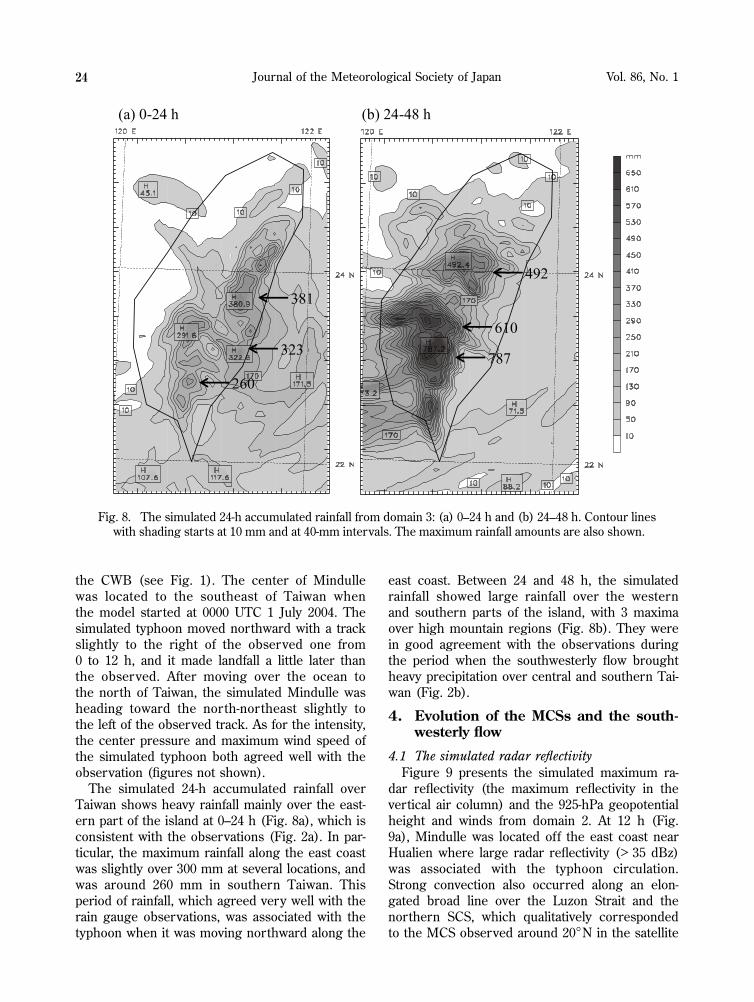
The simulated 24-h accumulated rainfall over Taiwan shows heavy rainfall mainly over the east-ern part of the island at 0–24 h (Fig. 8a), which is consistent with the observations (Fig. 2a). In par-ticular, the maximum rainfall along the east coast was slightly over 300 mm at several locations, and was around 260 mm in southern Taiwan. This period of rainfall, which agreed very well with the rain gauge observations, was associated with the typhoon when it was moving northward along the
east coast. Between 24 and 48 h, the simulated rainfall showed large rainfall over the western and southern parts of the island, with 3 maxima over high mountain regions (Fig. 8b). They were in good agreement with the observations during the period when the southwesterly flow brought heavy precipitation over central and southern Tai-wan (Fig. 2b).
4. Evolutionof theMCSsandthesouth-westerlyflow
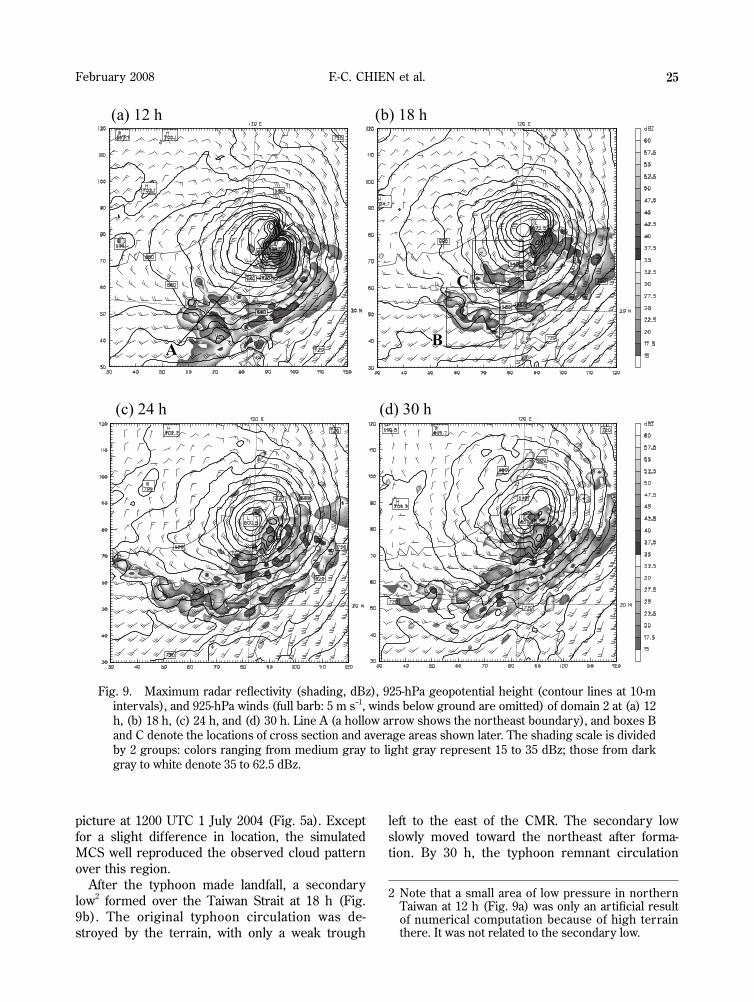
4.1 The simulated radar reflectivityFigure 9 presents the simulated maximum ra-
dar reflectivity (the maximum reflectivity in the vertical air column) and the 925-hPa geopotential height and winds from domain 2. At 12 h (Fig. 9a), Mindulle was located off the east coast near Hualien where large radar reflectivity (> 35 dBz) was associated with the typhoon circulation. Strong convection also occurred along an elon-gated broad line over the Luzon Strait and the northern SCS, which qualitatively corresponded to the MCS observed around 20°N in the satellite
787
610
492381
323
260
Fig. 8. The simulated 24-h accumulated rainfall from domain 3: (a) 0–24 h and (b) 24–48 h. Contour lines with shading starts at 10 mm and at 40-mm intervals. The maximum rainfall amounts are also shown.
F.-C. CHIEN et al.February 2008 25
picture at 1200 UTC 1 July 2004 (Fig. 5a). Except for a slight difference in location, the simulated MCS well reproduced the observed cloud pattern over this region.
After the typhoon made landfall, a secondary low2 formed over the Taiwan Strait at 18 h (Fig. 9b). The original typhoon circulation was de-stroyed by the terrain, with only a weak trough
left to the east of the CMR. The secondary low slowly moved toward the northeast after forma-tion. By 30 h, the typhoon remnant circulation
Fig. 9. Maximum radar reflectivity (shading, dBz), 925-hPa geopotential height (contour lines at 10-m intervals), and 925-hPa winds (full barb: 5 m s–1, winds below ground are omitted) of domain 2 at (a) 12 h, (b) 18 h, (c) 24 h, and (d) 30 h. Line A (a hollow arrow shows the northeast boundary), and boxes B and C denote the locations of cross section and average areas shown later. The shading scale is divided by 2 groups: colors ranging from medium gray to light gray represent 15 to 35 dBz; those from dark gray to white denote 35 to 62.5 dBz.
2 Note that a small area of low pressure in northern Taiwan at 12 h (Fig. 9a) was only an artificial result of numerical computation because of high terrain there. It was not related to the secondary low.
Journal of the Meteorological Society of Japan Vol. 86, No. 126
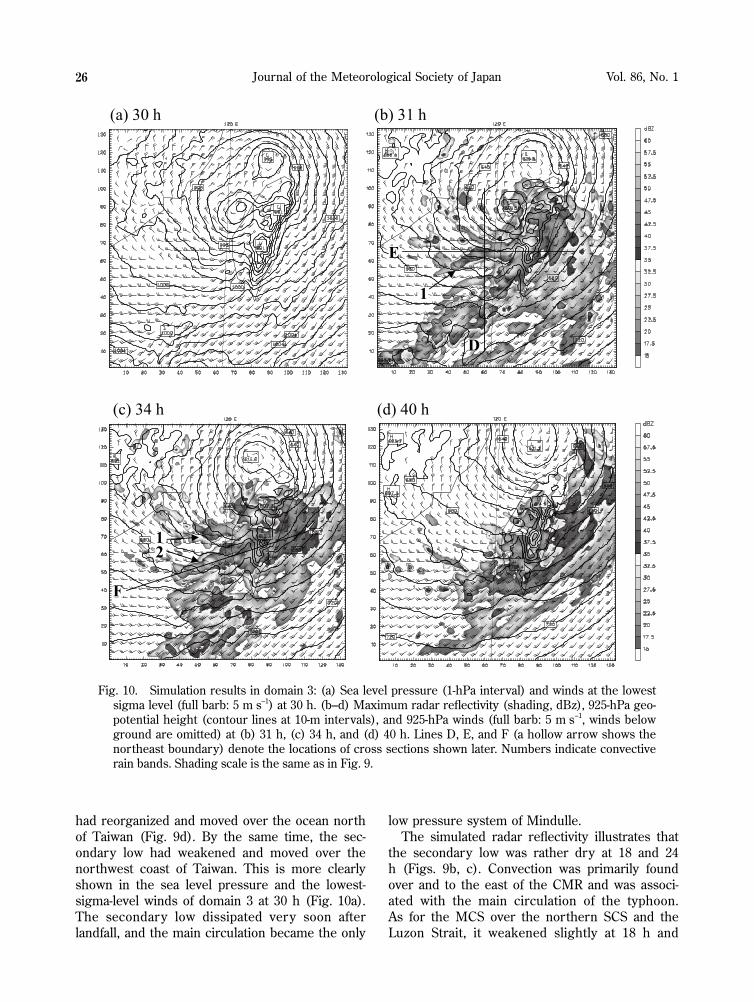
had reorganized and moved over the ocean north of Taiwan (Fig. 9d). By the same time, the sec-ondary low had weakened and moved over the northwest coast of Taiwan. This is more clearly shown in the sea level pressure and the lowest-sigma-level winds of domain 3 at 30 h (Fig. 10a). The secondary low dissipated very soon after landfall, and the main circulation became the only
low pressure system of Mindulle.The simulated radar reflectivity illustrates that
the secondary low was rather dry at 18 and 24 h (Figs. 9b, c). Convection was primarily found over and to the east of the CMR and was associ-ated with the main circulation of the typhoon. As for the MCS over the northern SCS and the Luzon Strait, it weakened slightly at 18 h and
Fig. 10. Simulation results in domain 3: (a) Sea level pressure (1-hPa interval) and winds at the lowest sigma level (full barb: 5 m s–1) at 30 h. (b–d) Maximum radar reflectivity (shading, dBz), 925-hPa geo-potential height (contour lines at 10-m intervals), and 925-hPa winds (full barb: 5 m s–1, winds below ground are omitted) at (b) 31 h, (c) 34 h, and (d) 40 h. Lines D, E, and F (a hollow arrow shows the northeast boundary) denote the locations of cross sections shown later. Numbers indicate convective rain bands. Shading scale is the same as in Fig. 9.
F.-C. CHIEN et al.February 2008 27
intensified again at 24 h after the southwesterly flow strengthened. There was an elongated band of convection along the low-level convergence line that formed between the northwesterly flow associated with the secondary low and the south-westerly flow from the SCS. Six hours later as Mindulle left northern Taiwan, a few convections started to develop south of the secondary low over the Taiwan Strait (Fig. 9d). Winds over the southern Taiwan Strait turned from northwesterly to westerly owing to the weakening of the second-ary low. As a result, the convergence weakened and the MCS around 20°N started to dissipate. At the same time, the southwesterly flow pushed far-ther northward and converged with the westerly flow over the ocean southwest of Taiwan, forming a northeast-southwest oriented band of strong convection.
In order to examine the detailed structure of the MCS that occurred near Taiwan, similar plots from domain 3 were used for the successive times. At 31 h, Mindulle was located about 50 km north of Taiwan, while the secondary low was dissipating over the northwest coast (Fig. 10b). Although there was still weak convection off the east coast, strong convection had shifted from the eastern part of the island to western and south-western Taiwan. The northwesterly flow brought by the circulation of the typhoon and the second-ary low converged with the westerly flow, result-ing in a narrow band of strong convection over the central Strait and the western plains near Chiayi (indicated by no. 1). Its location was con-sistent with the observed convective line at 1000 UTC 2 July 2004 (Fig. 6b). Although their orien-tations were not exactly the same and the time in the simulation was about 3 hours earlier than in the observation, it is believed that the model had done a good job in reproducing the convec-tion. To the southwest of Taiwan, the northeast-southwest oriented rain band had intensified from one hour earlier (Fig. 9d). Strong southwesterly flow brought convections toward southern Tai-wan, together with the landward movement of the aforementioned convective line, resulting in heavy precipitation on the western and southern parts of the island (Fig. 10b). The MCS was further en-hanced over the mountain slopes because of the terrain lifting effect.
Three hours later, the convective line offshore of Chiayi (indicated by no. 1) had shifted slightly to the north (Fig. 10c). At the same time, another
line of strong convection developed to the south (no. 2). Farther to the south over the northern SCS was a broad area of weak convection. It is clear that with the southwesterly flow strengthen-ing, the major MCSs had shifted northward to the central Taiwan Strait and produced heavy rainfall in central Taiwan. The two convective lines were fairly comparable with those observed at 1200 UTC 2 July 2004 (Fig. 6c), except for small dif-ferences in location and orientation. By 40 h, the MCSs had dissipated (Fig. 10d).
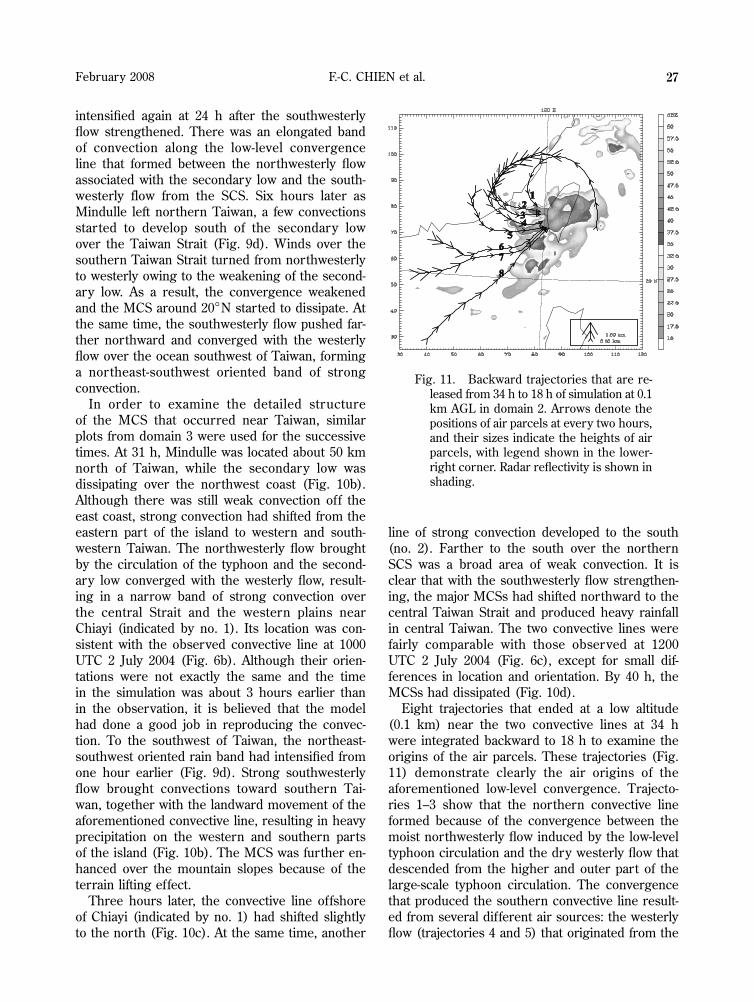
Eight trajectories that ended at a low altitude (0.1 km) near the two convective lines at 34 h were integrated backward to 18 h to examine the origins of the air parcels. These trajectories (Fig. 11) demonstrate clearly the air origins of the aforementioned low-level convergence. Trajecto-ries 1–3 show that the northern convective line formed because of the convergence between the moist northwesterly flow induced by the low-level typhoon circulation and the dry westerly flow that descended from the higher and outer part of the large-scale typhoon circulation. The convergence that produced the southern convective line result-ed from several different air sources: the westerly flow (trajectories 4 and 5) that originated from the
Fig. 11. Backward trajectories that are re-leased from 34 h to 18 h of simulation at 0.1 km AGL in domain 2. Arrows denote the positions of air parcels at every two hours, and their sizes indicate the heights of air parcels, with legend shown in the lower-right corner. Radar reflectivity is shown in shading.
Journal of the Meteorological Society of Japan Vol. 86, No. 128
large-scale typhoon circulation like trajectories 2 and 3, and the southwesterly flow (trajectories 6–8) that came from the northern SCS. Trajectories 6 and 7 actually had a large westerly component before 30 h. At ~24 h, they converged after com-ing from different origins, and were likely respon-sible for the convections that developed over the northern SCS at 24 h (see Fig. 9c).
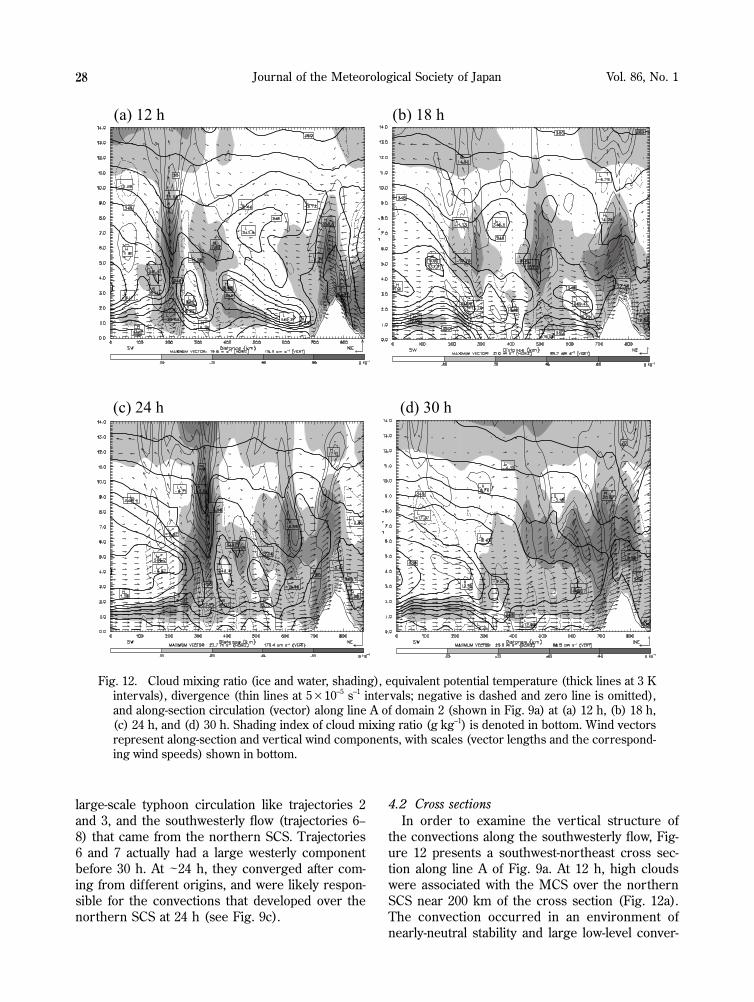
4.2 Cross sectionsIn order to examine the vertical structure of
the convections along the southwesterly flow, Fig-ure 12 presents a southwest-northeast cross sec-tion along line A of Fig. 9a. At 12 h, high clouds were associated with the MCS over the northern SCS near 200 km of the cross section (Fig. 12a). The convection occurred in an environment of nearly-neutral stability and large low-level conver-
Fig. 12. Cloud mixing ratio (ice and water, shading), equivalent potential temperature (thick lines at 3 K intervals), divergence (thin lines at 5×10⁻⁵ s–1 intervals; negative is dashed and zero line is omitted), and along-section circulation (vector) along line A of domain 2 (shown in Fig. 9a) at (a) 12 h, (b) 18 h, (c) 24 h, and (d) 30 h. Shading index of cloud mixing ratio (g kg–1) is denoted in bottom. Wind vectors represent along-section and vertical wind components, with scales (vector lengths and the correspond-ing wind speeds) shown in bottom.
F.-C. CHIEN et al.February 2008 29
gence. The low-level air behind the convection was convectively unstable (equivalent potential temperature, θe, decreases with height) and had a large southwesterly wind component. Its conver-gence with the westerly flow ahead produced up-ward motion, which provided lifting on the poten-tially unstable air. As a result, strong convections were triggered and the air became approximately neutral. Over Taiwan, clouds were associated with Mindulle off the east coast at this time.
By 18 h, the low-level air of high equivalent potential temperature over the northern SCS had pushed northeastward to ~300 km of the cross section (Fig. 12b). The convection at the leading edge of the warm moist air (high θe) weakened because the low-level convergence became small-er at this time. A new band of convective clouds formed to the southwest of Taiwan (near 500 km) where low-level convergence was large. The con-vergence between the westerly and southwesterly flows was induced by the secondary low over the central Taiwan Strait and the large-scale typhoon circulation.
The convection over the northern SCS (at ~ 340 km of the cross section) became stronger at 24 h when the southwesterly flow intensified (Fig. 12c). The maximum upward motion of ~ 1.8 m s–1 occurred at a height of around 7 km as a result of a deep layer of convergence below. To the north, the cloud band associated with the secondary low had moved over land and inten-sified on the upslope region of the mountains. Offshore new convective bands were developing and moving landward. By 30 h, the convection over the northern SCS had dissipated (Fig. 12d). The southwesterly flow had further strengthened and pushed all the way to the southwest coast of Taiwan. There were weak convections associated with mid-layer clouds along the cross section. When moving over land, they were remarkably enhanced, producing heavy rainfall over the low plains and mountains in southwestern Taiwan.
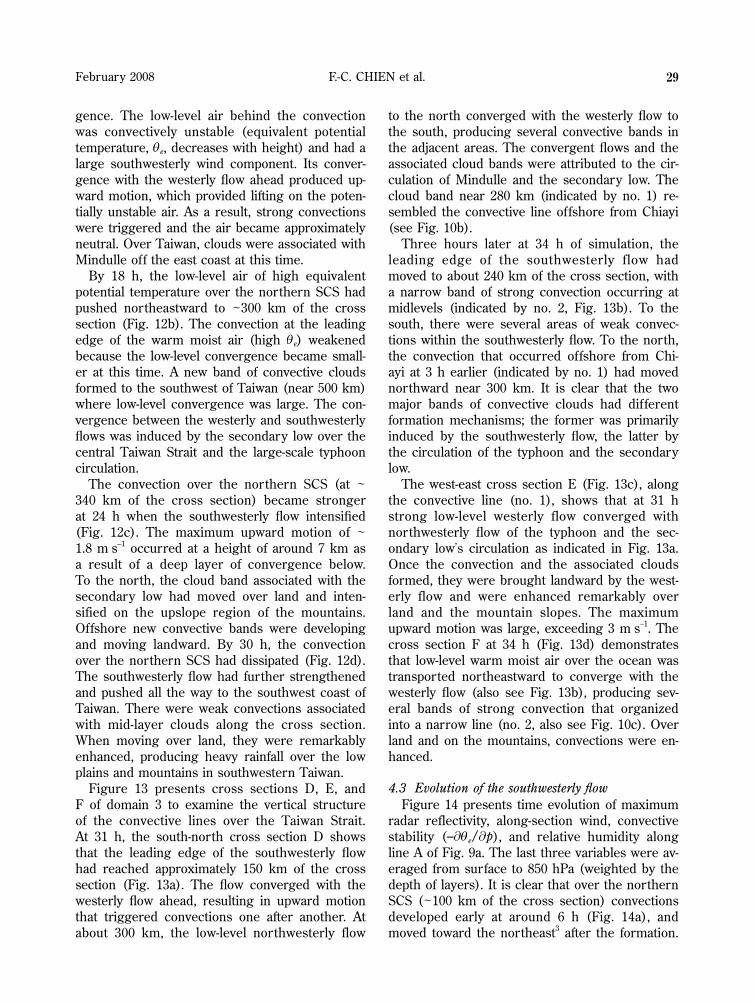
Figure 13 presents cross sections D, E, and F of domain 3 to examine the vertical structure of the convective lines over the Taiwan Strait. At 31 h, the south-north cross section D shows that the leading edge of the southwesterly flow had reached approximately 150 km of the cross section (Fig. 13a). The flow converged with the westerly flow ahead, resulting in upward motion that triggered convections one after another. At about 300 km, the low-level northwesterly flow
to the north converged with the westerly flow to the south, producing several convective bands in the adjacent areas. The convergent flows and the associated cloud bands were attributed to the cir-culation of Mindulle and the secondary low. The cloud band near 280 km (indicated by no. 1) re-sembled the convective line offshore from Chiayi (see Fig. 10b).
Three hours later at 34 h of simulation, the leading edge of the southwesterly flow had moved to about 240 km of the cross section, with a narrow band of strong convection occurring at midlevels (indicated by no. 2, Fig. 13b). To the south, there were several areas of weak convec-tions within the southwesterly flow. To the north, the convection that occurred offshore from Chi-ayi at 3 h earlier (indicated by no. 1) had moved northward near 300 km. It is clear that the two major bands of convective clouds had different formation mechanisms; the former was primarily induced by the southwesterly flow, the latter by the circulation of the typhoon and the secondary low.
The west-east cross section E (Fig. 13c), along the convective line (no. 1), shows that at 31 h strong low-level westerly flow converged with northwesterly flow of the typhoon and the sec-ondary low’s circulation as indicated in Fig. 13a. Once the convection and the associated clouds formed, they were brought landward by the west-erly flow and were enhanced remarkably over land and the mountain slopes. The maximum upward motion was large, exceeding 3 m s–1. The cross section F at 34 h (Fig. 13d) demonstrates that low-level warm moist air over the ocean was transported northeastward to converge with the westerly flow (also see Fig. 13b), producing sev-eral bands of strong convection that organized into a narrow line (no. 2, also see Fig. 10c). Over land and on the mountains, convections were en-hanced.
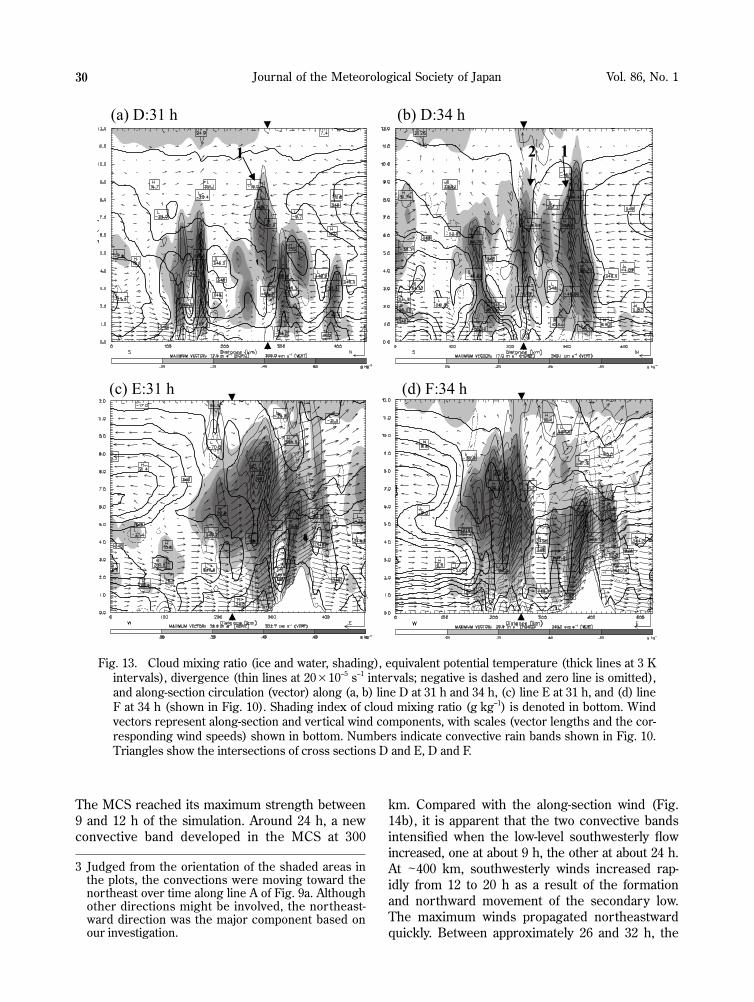
4.3 Evolution of the southwesterly flowFigure 14 presents time evolution of maximum
radar reflectivity, along-section wind, convective stability (–¶θ e/¶p), and relative humidity along line A of Fig. 9a. The last three variables were av-eraged from surface to 850 hPa (weighted by the depth of layers). It is clear that over the northern SCS (~100 km of the cross section) convections developed early at around 6 h (Fig. 14a), and moved toward the northeast3 after the formation.
Journal of the Meteorological Society of Japan Vol. 86, No. 130
The MCS reached its maximum strength between 9 and 12 h of the simulation. Around 24 h, a new convective band developed in the MCS at 300
km. Compared with the along-section wind (Fig. 14b), it is apparent that the two convective bands intensified when the low-level southwesterly flow increased, one at about 9 h, the other at about 24 h. At ~400 km, southwesterly winds increased rap-idly from 12 to 20 h as a result of the formation and northward movement of the secondary low. The maximum winds propagated northeastward quickly. Between approximately 26 and 32 h, the
3 Judged from the orientation of the shaded areas in the plots, the convections were moving toward the northeast over time along line A of Fig. 9a. Although other directions might be involved, the northeast-ward direction was the major component based on our investigation.
Fig. 13. Cloud mixing ratio (ice and water, shading), equivalent potential temperature (thick lines at 3 K intervals), divergence (thin lines at 20×10–5 s–1 intervals; negative is dashed and zero line is omitted), and along-section circulation (vector) along (a, b) line D at 31 h and 34 h, (c) line E at 31 h, and (d) line F at 34 h (shown in Fig. 10). Shading index of cloud mixing ratio (g kg–1) is denoted in bottom. Wind vectors represent along-section and vertical wind components, with scales (vector lengths and the cor-responding wind speeds) shown in bottom. Numbers indicate convective rain bands shown in Fig. 10. Triangles show the intersections of cross sections D and E, D and F.
F.-C. CHIEN et al.February 2008 31
southwesterly flow increased again, and it also propagated promptly toward the northeast. Be-cause of this wind variation, the convective bands over the southern Taiwan Strait (box C) first de-veloped at around 18 h and then moved toward
the northeast at a speed of ~20 km h–1 (Fig. 14a). The considerable increase of the southwesterly flow after 24 h caused the MCS over the north-ern SCS (~300 km of the cross section) to move northeastward even more rapidly (~32 km h–1)
Fig. 14. Time series of (a) maximum radar reflectivity (dBz), (b) along-section wind (m s–1), (c) convec-tive stability (K hPa–1), and (d) relative humidity (%) along line A of domain 2 (shown in Fig. 9a) from 1–47 h of model simulation. The ordinate is time from 1 to 47 h, and the abscissa is distance in km. Variables in (b–d) are averaged from surface to 850 hPa. Shading indices are denoted in bottom. The zones where this cross section is overlapped with boxes B and C, and land are indicated.
Journal of the Meteorological Society of Japan Vol. 86, No. 132
toward the southern Taiwan Strait and then over land. When moving over land and mountains, the two convective bands were significantly enhanced.
Figures 14c and d show that low-level air was convectively unstable and very moist in the south-westerly flow and was moving toward the north-east. When low-level air convergence provided enough lifting, convections could be triggered. The instability then decreased because of vertical mixing. This is evident from the regions where nearly neutral stability (>-0.04 K hPa–1) was col-located with large radar reflectivity (> 10 dBz, Fig. 14a).
5. Verticalstructureandbudgetanalyses
In order to further examine the time evolution of the vertical structure of the MCSs and to iden-tify the formation mechanisms of the convections, a horizontal domain average was taken for several key fields inside two boxes: B and C (see Fig. 9b). The boxes were chosen to easily compare the two convection regions: the former for the northern SCS, the latter for the southern Taiwan Strait.
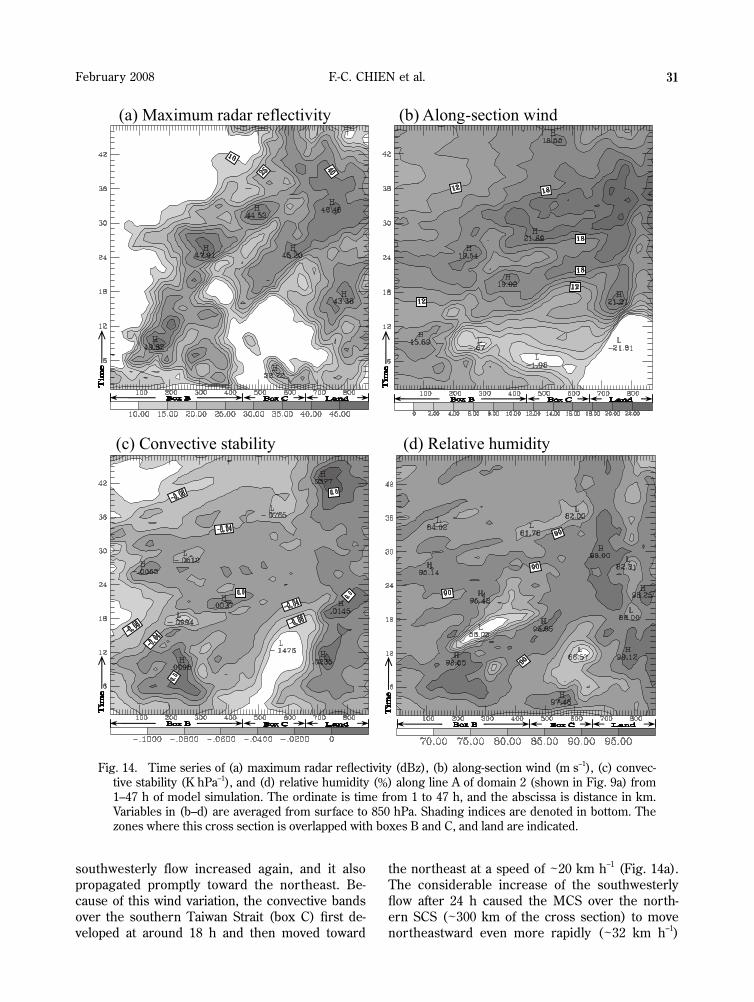
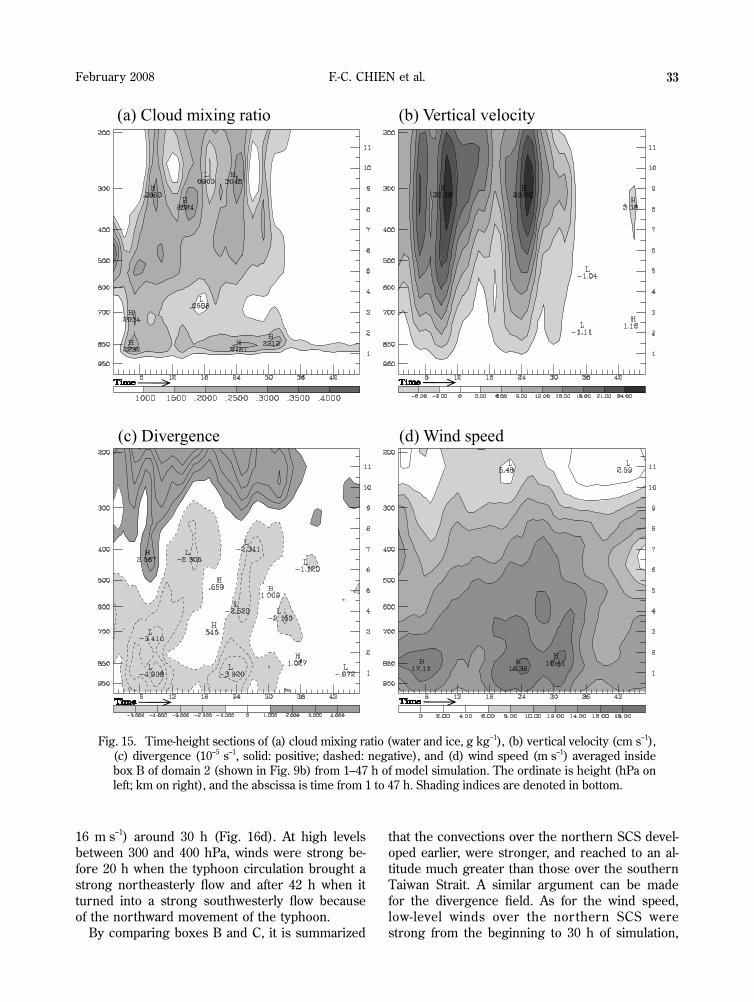
5.1 Vertical structureFigure 15 presents the time-height section of
cloud mixing ratio (cloud ice plus water), vertical velocity, horizontal divergence, and wind speed averaged inside box B. Using 0.1 g kg–1 as a threshold, the cloud mixing ratio shows that over the northern SCS the cloud base was slightly be-low 1 km at early times and rose a little over time (Fig. 15a). Although the majority of the convec-tive cloud bands formed at midlevels (about 400–600 hPa), for example, at 6–12 h and 18–24 h, there were a few time periods when the convec-tion was so strong that the clouds could develop to a very high altitude (above 200 hPa). After 30 h, the convection in this area dissipated and there were only shallow clouds left at low levels. This cloud evolution is best explained by the distribu-tion of the vertical velocity in Fig. 15b, which shows 2 periods of maximum upward motion, one between 6 and 12 h, the other around 24 h. The greatest ascent of the air flow occurred at about 300 hPa with a domain-averaged magnitude of ~2.6 m s–1.
Figure 15c shows that low-level convergence occurred earlier than upward vertical velocity at 6–12 h and 18–24 h. It is thus clear that the strong upward motion was first initiated by large
low-level convergence, which provided lifting to release the potential instability of the low-level air and to produce strong convections. As the updraft formed, the height of maximum horizontal con-vergence increased over time. At high levels (e.g., above 300 hPa), strong divergence was collocated with the low-level convergence. A comparison between Figs. 15b and c indicates that the maxi-mum updraft occurred almost simultaneously in the vertical (only about 1 h delay from 850 to 300 hPa), while the maximum convergence had a longer delay (4–6 h) from low levels to upper levels. This indicates that once the updraft devel-oped as a result of low-level convergence, it could reach to a high altitude very rapidly because of the large upward velocity (~2–3 m s–1). The midlevel convergence (e.g., 400–700 hPa), on the other hand, occurred a few hours later, be-cause it was induced by the strong updraft as a result of mass continuity. The wind speed aver-aged in box B shows that the maximum winds in the southwesterly flow occurred at low levels around 850 hPa, and there were two time peri-ods when the winds were stronger than 16 m s–1 (Fig. 15d). The first happened at about 6 h, and the second took place a lot longer from 18 to 30 h. These low-level jets were collocated with the large low-level convergence and thus played an important role on the formation of the convec-tions in box B.
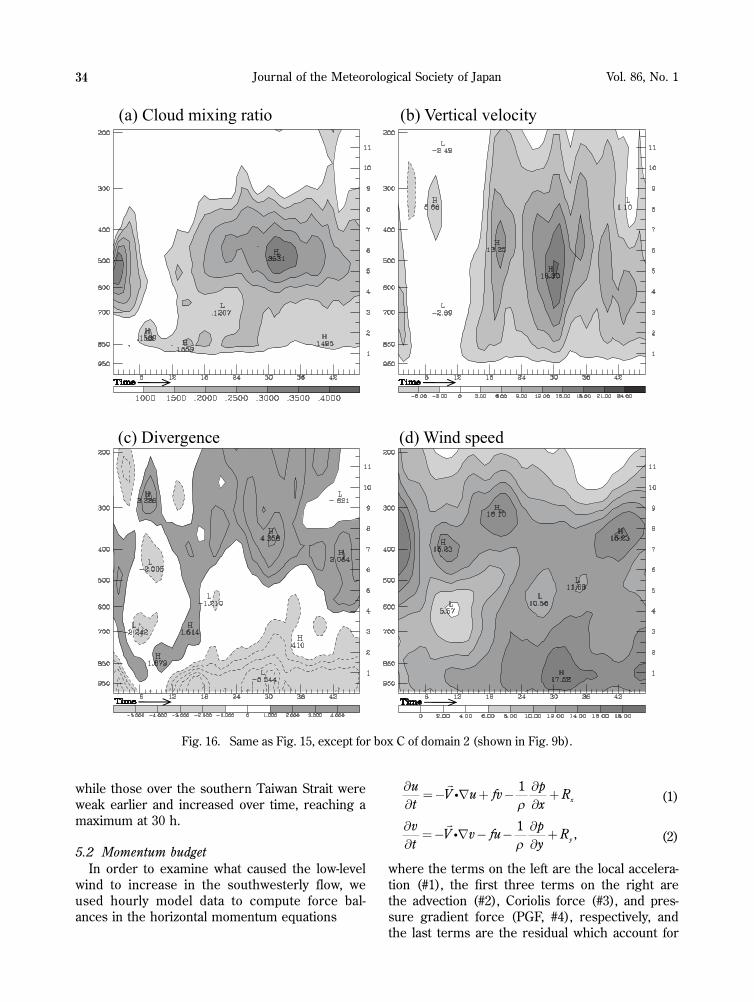
Figure 16 presents similar plots, but averaged inside box C. It is clear from Fig. 16a that weak midlevel cloud bands first appeared at 12 h. Note that a large value before 6 h can be ignored, because the simulated hydrology is not trustwor-thy during the model’s spin-up stage. The cloud amount increased over time and reached a maxi-mum shortly after 30 h at about 500 hPa. The cloud top remained at nearly the same height around 300 hPa, with only one short period of exception at ~42 h. Vertical velocity (Fig. 16b) shows that two time periods of maximum upward motion at about 19 h (1.3 m s–1) and 30 h (1.8 m s–1) were associated with large low-level convergence at 12–18 h and 25–31 h (Fig. 16c), respectively. Since the maximum updrafts only reached mid-level, the horizontal convergence occurred in a shallow layer below ~700 hPa (Fig. 16c). Above 500 hPa or so, the air flow became mostly diver-gent. The wind speed pattern shows that low-level winds over the southern Taiwan Strait started to increase early and formed a low-level jet (>
F.-C. CHIEN et al.February 2008 33
16 m s–1) around 30 h (Fig. 16d). At high levels between 300 and 400 hPa, winds were strong be-fore 20 h when the typhoon circulation brought a strong northeasterly flow and after 42 h when it turned into a strong southwesterly flow because of the northward movement of the typhoon.
By comparing boxes B and C, it is summarized
that the convections over the northern SCS devel-oped earlier, were stronger, and reached to an al-titude much greater than those over the southern Taiwan Strait. A similar argument can be made for the divergence field. As for the wind speed, low-level winds over the northern SCS were strong from the beginning to 30 h of simulation,
Fig. 15. Time-height sections of (a) cloud mixing ratio (water and ice, g kg−1), (b) vertical velocity (cm s–1), (c) divergence (10–5 s–1, solid: positive; dashed: negative), and (d) wind speed (m s–1) averaged inside box B of domain 2 (shown in Fig. 9b) from 1–47 h of model simulation. The ordinate is height (hPa on left; km on right), and the abscissa is time from 1 to 47 h. Shading indices are denoted in bottom.
Journal of the Meteorological Society of Japan Vol. 86, No. 134
while those over the southern Taiwan Strait were weak earlier and increased over time, reaching a maximum at 30 h.
5.2 Momentum budgetIn order to examine what caused the low-level
wind to increase in the southwesterly flow, we used hourly model data to compute force bal-ances in the horizontal momentum equations
¶¶
=- Ñ + - ¶¶
+ut
V u fv px
Rx
1ρ (1)
¶¶
=- Ñ - - ¶¶
+vt
V v fu py
Ry
1ρ
, (2)
where the terms on the left are the local accelera-tion (#1), the first three terms on the right are the advection (#2), Coriolis force (#3), and pres-sure gradient force (PGF, #4), respectively, and the last terms are the residual which account for
Fig. 16. Same as Fig. 15, except for box C of domain 2 (shown in Fig. 9b).
F.-C. CHIEN et al.February 2008 35
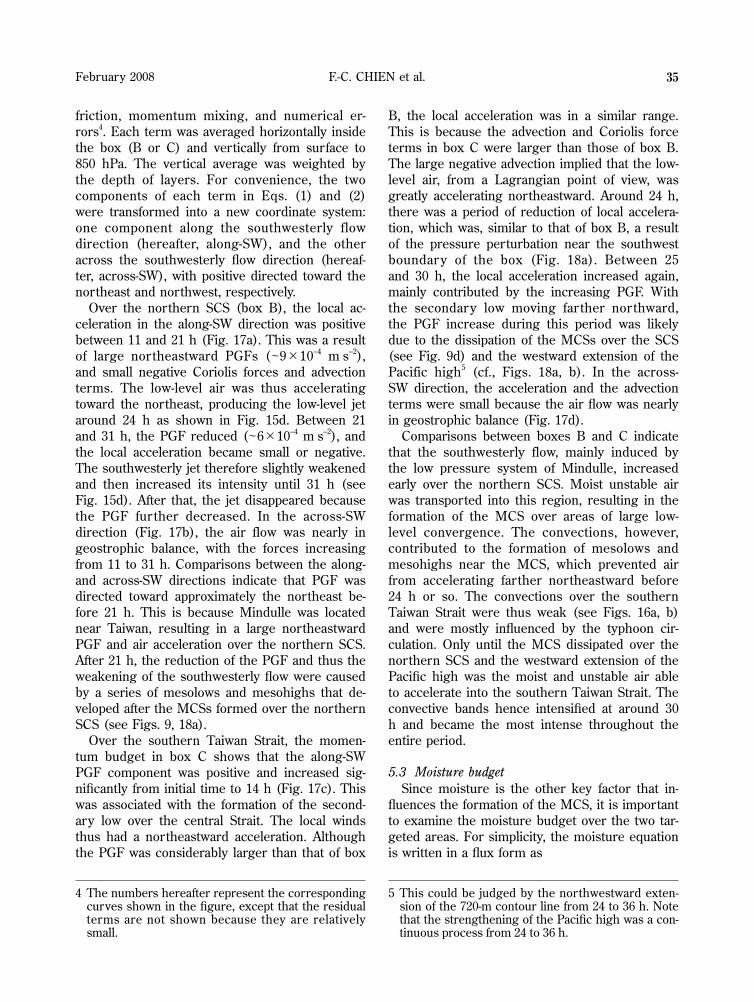
friction, momentum mixing, and numerical er-rors4. Each term was averaged horizontally inside the box (B or C) and vertically from surface to 850 hPa. The vertical average was weighted by the depth of layers. For convenience, the two components of each term in Eqs. (1) and (2) were transformed into a new coordinate system: one component along the southwesterly flow direction (hereafter, along-SW), and the other across the southwesterly flow direction (hereaf-ter, across-SW), with positive directed toward the northeast and northwest, respectively.
Over the northern SCS (box B), the local ac-celeration in the along-SW direction was positive between 11 and 21 h (Fig. 17a). This was a result of large northeastward PGFs (~9×10⁻⁴ m s–2), and small negative Coriolis forces and advection terms. The low-level air was thus accelerating toward the northeast, producing the low-level jet around 24 h as shown in Fig. 15d. Between 21 and 31 h, the PGF reduced (~6×10⁻⁴ m s–2), and the local acceleration became small or negative. The southwesterly jet therefore slightly weakened and then increased its intensity until 31 h (see Fig. 15d). After that, the jet disappeared because the PGF further decreased. In the across-SW direction (Fig. 17b), the air flow was nearly in geostrophic balance, with the forces increasing from 11 to 31 h. Comparisons between the along- and across-SW directions indicate that PGF was directed toward approximately the northeast be-fore 21 h. This is because Mindulle was located near Taiwan, resulting in a large northeastward PGF and air acceleration over the northern SCS. After 21 h, the reduction of the PGF and thus the weakening of the southwesterly flow were caused by a series of mesolows and mesohighs that de-veloped after the MCSs formed over the northern SCS (see Figs. 9, 18a).
Over the southern Taiwan Strait, the momen-tum budget in box C shows that the along-SW PGF component was positive and increased sig-nificantly from initial time to 14 h (Fig. 17c). This was associated with the formation of the second-ary low over the central Strait. The local winds thus had a northeastward acceleration. Although the PGF was considerably larger than that of box
B, the local acceleration was in a similar range. This is because the advection and Coriolis force terms in box C were larger than those of box B. The large negative advection implied that the low-level air, from a Lagrangian point of view, was greatly accelerating northeastward. Around 24 h, there was a period of reduction of local accelera-tion, which was, similar to that of box B, a result of the pressure perturbation near the southwest boundary of the box (Fig. 18a). Between 25 and 30 h, the local acceleration increased again, mainly contributed by the increasing PGF. With the secondary low moving farther northward, the PGF increase during this period was likely due to the dissipation of the MCSs over the SCS (see Fig. 9d) and the westward extension of the Pacific high5 (cf., Figs. 18a, b). In the across-SW direction, the acceleration and the advection terms were small because the air flow was nearly in geostrophic balance (Fig. 17d).
Comparisons between boxes B and C indicate that the southwesterly flow, mainly induced by the low pressure system of Mindulle, increased early over the northern SCS. Moist unstable air was transported into this region, resulting in the formation of the MCS over areas of large low-level convergence. The convections, however, contributed to the formation of mesolows and mesohighs near the MCS, which prevented air from accelerating farther northeastward before 24 h or so. The convections over the southern Taiwan Strait were thus weak (see Figs. 16a, b) and were mostly influenced by the typhoon cir-culation. Only until the MCS dissipated over the northern SCS and the westward extension of the Pacific high was the moist and unstable air able to accelerate into the southern Taiwan Strait. The convective bands hence intensified at around 30 h and became the most intense throughout the entire period.
5.3 Moisture budgetSince moisture is the other key factor that in-
fluences the formation of the MCS, it is important to examine the moisture budget over the two tar-geted areas. For simplicity, the moisture equation is written in a flux form as
4 The numbers hereafter represent the corresponding curves shown in the figure, except that the residual terms are not shown because they are relatively small.
5 This could be judged by the northwestward exten-sion of the 720-m contour line from 24 to 36 h. Note that the strengthening of the Pacific high was a con-tinuous process from 24 to 36 h.
Journal of the Meteorological Society of Japan Vol. 86, No. 136
¶¶
=-¶¶
- ¶¶
- ¶¶
+( ) ( ) ( ) ( ) ,ρ ρ ρ ρqt
qux
qvy
qwz
S (3)
where ρ is air density and q is the mixing ratio of water vapor. The term on the left is the local change (#1), the first and second terms on the right are horizontal moisture flux convergence (#2),
the third is vertical moisture flux convergence (#3), and the last term is the residual (#4, source and sink) which accounts for hydrological processes like condensation, evaporation, and so on.
Figure 19 shows time series plots of the mois-ture budget averaged in boxes B and C. The terms in Eq. (3) are first integrated vertically
Fig. 17. Time series of low-level (surface to 850 hPa) momentum budget averaged inside (a, b) box B and (c, d) box C of domain 2 (shown in Fig. 9b). The ordinate is time from 1 to 47 h, and the abscissa is magnitude in 10–4 m s–2. The local acceleration (#1), advection (#2), Coriolis force (#3), and pressure gradient force (#4) terms are transformed into two components: (a, c) along-SW direction, and (b, d) across-SW direction.
F.-C. CHIEN et al.February 2008 37
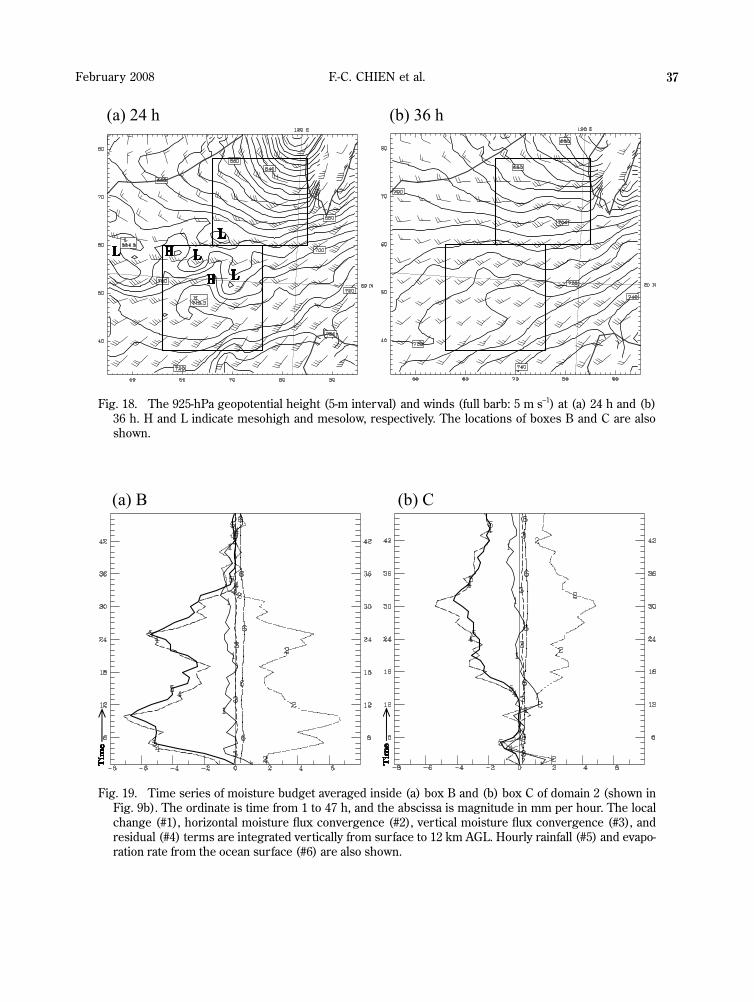
Fig. 18. The 925-hPa geopotential height (5-m interval) and winds (full barb: 5 m s–1) at (a) 24 h and (b) 36 h. H and L indicate mesohigh and mesolow, respectively. The locations of boxes B and C are also shown.
Fig. 19. Time series of moisture budget averaged inside (a) box B and (b) box C of domain 2 (shown in Fig. 9b). The ordinate is time from 1 to 47 h, and the abscissa is magnitude in mm per hour. The local change (#1), horizontal moisture flux convergence (#2), vertical moisture flux convergence (#3), and residual (#4) terms are integrated vertically from surface to 12 km AGL. Hourly rainfall (#5) and evapo-ration rate from the ocean surface (#6) are also shown.
Journal of the Meteorological Society of Japan Vol. 86, No. 138
from surface to 12 km AGL, divided by the water density, and then converted to the unit of mm h–1. In addition, we used simulated hourly rainfall (#5) and evaporation rate from the ocean surface (#6) to roughly estimate the moisture sink and source, respectively. It is first seen that, being integrated through approximately the entire troposphere, the residual was nearly equal to the sum of rain-fall and evaporation from the ocean, except that rainfall had a slight time delay. This is reasonable because it took time for rain, after formation, to fall from air to the ground.
Over the northern SCS (box B), the horizon-tal moisture flux convergence was large positive with two maxima before 30 h (Fig. 19a), which corresponded well to the two strong convection periods (e.g., Fig. 15). Although there was a large horizontal convergence of moisture, the air column averaged in the box still lost moisture at a rate of about 0.5 mm per hour during the con-vective periods. The decrease was due to the ex-cessive residual term, because precipitation was far larger than evaporation from the ocean. It is therefore evident that the convections in the MCS were mainly contributed by the horizontal mois-ture transport in the southwesterly flow. Evapora-tion locally from the ocean played only a minor
role. Precipitation consumed moisture not only from these supplies, but also from water vapor in the air column.
Over the southern Taiwan Strait, the horizon-tal moisture convergence, primarily induced by the typhoon and the secondary low, helped the development of weak convections at early times (Fig. 19b). The evaporation rate from the ocean was small. Between 12 and 18 h when rainfall was small, moisture was in fact increasing in this re-gion because of horizontal moisture convergence. After 24 h, the convections over the northern SCS were dissipating. With the southwesterly flow transporting warm moist air into the south-ern Taiwan Strait, the horizontal moisture conver-gence began to increase considerably in box C. Like in box B, moisture supplied by this process and evaporation were converted into precipitation.
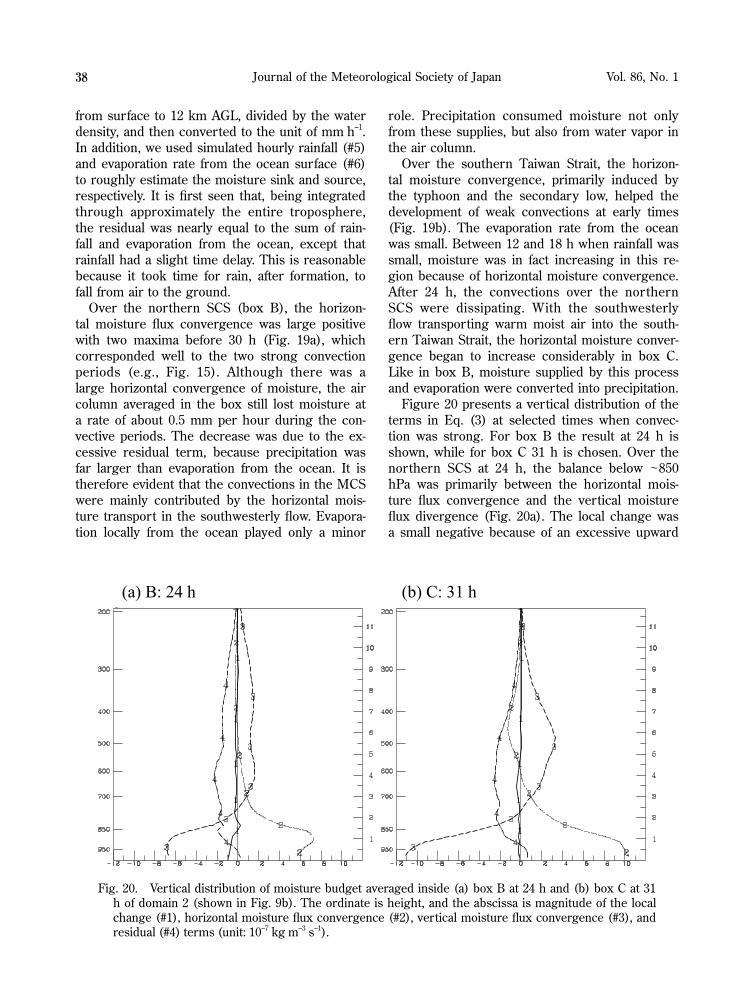
Figure 20 presents a vertical distribution of the terms in Eq. (3) at selected times when convec-tion was strong. For box B the result at 24 h is shown, while for box C 31 h is chosen. Over the northern SCS at 24 h, the balance below ~850 hPa was primarily between the horizontal mois-ture flux convergence and the vertical moisture flux divergence (Fig. 20a). The local change was a small negative because of an excessive upward
Fig. 20. Vertical distribution of moisture budget averaged inside (a) box B at 24 h and (b) box C at 31 h of domain 2 (shown in Fig. 9b). The ordinate is height, and the abscissa is magnitude of the local change (#1), horizontal moisture flux convergence (#2), vertical moisture flux convergence (#3), and residual (#4) terms (unit: 10–7 kg m–3 s–1).
F.-C. CHIEN et al.February 2008 39
transport at low levels. The residual was small, too, but it became positive near the surface due to evaporation from the ocean. This indicates that moisture was converged at low levels and trans-ported upward above ~850 hPa where vertical moisture flux became convergent. As moist air as-cended and became saturated, water vapor turned into rainfall, denoted by the residual terms, which balanced the vertical moisture flux convergence at high levels. At 31 h over the southern Taiwan Strait (Fig. 20b), the primary balanced terms at low levels were, similar to but larger than those in box B, the horizontal moisture flux conver-gence and the vertical moisture flux divergence.
6. Summaryandconclusions
This paper presents an observational and nu-merical study of Typhoon Mindulle (2004) with two foci: the southwesterly flow and heavy rain-fall in the Taiwan area. Mindulle, a weak tropical storm, made landfall on the east coast of Taiwan at 1440 UTC 1 July 2004. About 13 hours later, the typhoon left the north coast of Taiwan. Dur-ing landfall of the main circulation, a secondary low formed over the Taiwan Strait but dissipated after Mindulle moved over the ocean north of Taiwan. There was not much damage in terms of winds and precipitation created by the typhoon itself. However, after Mindulle left Taiwan the ac-companying strong southwesterly flow brought extremely heavy rainfall over the southern and central parts of the island, resulting in severe flooding and mudslides in many regions.
Satellite observations show that MCSs devel-oped over the northern SCS during the time when Mindulle was af fecting Taiwan. These MCSs, developing in the warm moist southwest-erly flow, had no influence on Taiwan. Later when Mindulle left the north coast of Taiwan, strong convections developed over the southern Taiwan Strait. Radar observations show that these MCSs first organized into an east-west oriented convec-tive line. With the southwesterly flow intensify-ing, the convective line shifted slightly northward and another convective line formed to the south. These convective bands continued to move over land and brought large rainfall not only over the western lowlands, but also over the mountainous regions where the convection was further en-hanced.
The MM5 run initialized at 0000 UTC 1 July 2004 well simulated the observed synoptic pat-
tern, the secondary low, the MCSs over the northern SCS and the southern Taiwan Strait, and the heavy rainfall in Taiwan. It is also remarkable that the model reproduced, though with a few hours of lead time, the convective lines that de-veloped offshore and moved over land to produce heavy precipitation in southwestern Taiwan. The simulation clearly demonstrates that the moist northwesterly flow of the low-level typhoon cir-culation converged with the decending westerly flow from the higher and outer part of the large-scale typhoon circulation, resulting in the con-vective band over the central Taiwan Strait. The warm moist southwesterly flow that came from the northern SCS converged with the westerly or northwesterly flow of the circulation associated with the typhoon and the secondary low, and pro-duced the convective band southwest of Taiwan. These are evidently shown by backward trajecto-ries that terminated in the convection zone.
The southwesterly flow, which was primarily induced by the low pressure system of Mindulle, strengthened early over the northern SCS. The PGF was significantly larger than the Coriolis force in the along-SW direction, resulting in a downgradient acceleration toward the north-east. Moist unstable air in the southwesterly flow was thus transported northeastward. When low-level air convergence provides enough lift-ing, strong convections can be triggered. The convections, however, contributed to the forma-tion of mesolows and mesohighs in the MCS, which prevented air from accelerating farther northeastward. Therefore, during this time the convections over the southern Taiwan Strait were weak. Only after the dissipation of the MCS over the northern SCS and the westward exten-sion of the Pacific high was the moist unstable air able to accelerate into the southern Taiwan Strait. The convective bands there then intensi-fied and moved over land, where the MCSs were further enhanced, producing heavy rainfall over the low plains and the mountains in southwest-ern Taiwan. The common ingredients of heavy orographic rainfall proposed by Lin et al. (2001) were examined for this event. Compared with the two Taiwan rainfall events in their Table 1, our case had an upstream moist and unstable low-level jet, with an averaged wind speed of 17.5 m s–1, specific humidity of 20 g kg–1, and CAPE of 2400 J kg–1. These conditions, comparable to their Taiwan 1959 flooding event, favored for
Journal of the Meteorological Society of Japan Vol. 86, No. 140
heavy orographic rainfall. As a result, the maxi-mum rainfall was similar for the two events (700 verses 500 mm day–1). As for the Tropical Storm Rachel, since its southwesterly flow was weaker (10 m s–1), the rainfall was a lot smaller.
The moisture budget shows that the develop-ment of the MCSs was mainly contributed by the horizontal moisture transport in the south-westerly flow. Evaporation locally from the ocean played only a minor role. The balance below ~ 850 hPa was primarily between horizontal mois-ture flux convergence and vertical moisture flux divergence, which indicates that moisture was converged at low levels and transported upward above ~850 hPa. As the moist air ascended and became saturated, water vapor turned into rain-fall, which balanced the vertical moisture flux convergence at the midlevel. Over the southern Taiwan Strait, the low-level horizontal moisture flux convergence and vertical moisture flux di-vergence were both greater than those over the northern SCS.
Acknowledgements
This research was supported by the National Science Council of Taiwan (Grants NSC 94-2625- Z-002-015, NSC 93-2111-M-003-001-AP2, and NSC 93-2625-Z-003-001). We thank the Central Weather Bureau for numerical and observational data. Dr. P.-L. Lin of National Central University, Dr. B.-L. Chang, Dr. J.-H. Teng, and Mr. Y.-C. Kao of the Central Weather Bureau provided radar pictures. Their assistance is greatly appreciated. Our grati-tude also goes to the Academic Paper Editing Clinic, NTNU.
ReferenceBender, M.A., R.E. Tuleya, and Y. Kurihara, 1985:
A numerical study of the effect of a mountain range on a landfalling tropical cyclone. Mon. Wea. Rev., 113, 567–582.
Bender, M.A., R.E. Tuleya, and Y. Kurihara, 1987: A numerical study of the effect of island terrain on tropical cyclones. Mon. Wea. Rev., 115, 130–155.
Brand, S. and J.W. Blelloch, 1974: Changes in the characteristics of typhoons crossing the island of Taiwan. Mon. Wea. Rev., 102, 708–713.
Chang, S.W., 1982: The orographic effects induced by an island mountain range on propagating tropi-cal cyclones. Mon. Wea. Rev., 110, 1255–1270.
Chen, G.T.-J., 1992: Mesoscale features observed in the Taiwan Mei-yu season. J. Meteor. Soc. Ja-
pan, 70, 497–516.Chen, S.-J., Y.-H. Kuo, W. Wang, Z.-Y. Tao, and B.
Cui, 1998: A modeling case study of heavy rain-storms along the Mei-yu front. Mon. Wea. Rev., 126, 2330–2351.
Chiao, S. and Y.-L. Lin, 2003: Numerical simulations of an orographic rainfall event associated with the passage of a tropical storm over a meso-scale mountain. Wea. Forecasting, 18, 325–344.
Grell, G.A., J. Dudhia, and D.R. Stauffer, 1994: A description of the fifth-generation Penn State/NCAR Mesoscale Model (MM5). NCAR Tech. Note, NCAR/TN-398+STR, 138 pp.
Hong, S.-Y. and H.-L. Pan, 1996: Nonlocal boundary layer vertical diffusion in a medium-range fore-cast model. Mon. Wea. Rev., 124, 2322–2339.
Jian, G.-J., C.-S. Lee, and G.T.-J. Chen, 2006: Numeri-cal simulation of Typhoon Dot (1990) during TCM-90: The discontinuous track across Tai-wan. Terr. Atmos. Oceanic Sci., 17, 23–52.
Lin, Y.-L., S.-Y. Chen, C.M. Hill, and C.-Y. Huang. 2005: Control parameters for the influence of a mesoscale mountain range on cyclone track continuity and deflection. J. Atmos. Sci., 62, 1849–1866.
Lin, Y.-L., D.B. Ensley, S. Chiao, and C.-Y. Huang, 2002: Orographic influences on rainfall and track deflection associated with the passage of a tropical cyclone. Mon. Wea. Rev., 130, 2929–2950.
Lin, Y.-L., J. Han, D.W. Hamilton, and C.-Y. Huang, 1999: Orographic influence on a drifting cy-clone. J. Atmos. Sci., 56, 534–562.
Lin, Y.-L., S. Chiao, T.-A. Wang, M.L. Kaplan, and R.P. Weglarz, 2001: Some common ingredients for heavy orographic rainfall. Wea. Forecasting, 16, 633–660.
Trier, S.B., D.B. Parsons, and T.J. Matejka, 1990: Observations of a subtropical cold front in a region of complex terrain. Mon. Wea. Rev., 118, 2449–2470.
Velden, C. and Co-authors, 2006: The Dvorak tropical cyclone intensity estimation technique, a satel-lite-based method that has endured for over 30 Years. Bull. Amer. Meteor. Soc., 87, 1195–1210.
Wang, S.-T., 1980: Prediction of the behavior and strength of typhoons in Taiwan and its vicinity. Res. Rep. 108, National Science Council, Taipei, Taiwan, 100 pp.
Wang, S.-T., 1989: Observational analysis of the orographically induced disturbances during TAMEX. Workshop on TAMEX Preliminary Sci-entific Results, Taipei, Taiwan, National Science Council, 279–286.
Wu, C.-C., 2001: Numerical simulation of Typhoon Gladys (1994) and its interaction with Taiwan terrain using GFDL hurricane model. Mon.

F.-C. CHIEN et al.February 2008 41
Wea. Rev., 129, 1533–1549.Wu, C.-C. and Y.-H. Kuo, 1999: Typhoons affecting
Taiwan: Current understanding and future chal-lenges. Bull. Amer. Meteor. Soc., 80, 67–80.
Wu, C.-C., T.-H. Yen, Y.-H. Kuo, and W. Wang, 2002: Rainfall simulation associated with Typhoon Herb (1996) near Taiwan. Part I: The topo-graphic effect. Wea. Forecasting, 17, 1001–1015.
Yeh, T.-C. and R.L. Elsberry, 1993a: Interaction of ty-phoons with the Taiwan orography. Part I: Up-stream track deflections. Mon. Wea. Rev., 121, 3193–3212.
Yeh, T.-C. and R.L. Elsberry, 1993b: Interaction of typhoons with the Taiwan orography. Part II: Continuous and discontinuous tracks across the island. Mon. Wea. Rev., 121, 3213–3233.


![arXiv:math/9501233v1 [math.DS] 19 Jan 1995a periodic “highway-building” behavior, heading off to infinity in a southwesterly direction. This phenomenon of “transient symmetry”](https://img.pdfslide.us/doc/110x75/5f4d49a72b74e036d83ac434/arxivmath9501233v1-mathds-19-jan-1995-a-periodic-aoehighway-buildinga-behavior.jpg)