Embed Size (px)
Citation preview
The Hunt for Elusive Growth: Asset Management in 2012
Will the goose keep laying golden eggs? June 2012 – McKinsey’s annual perspective on the global asset management industry
2
Executive Summary
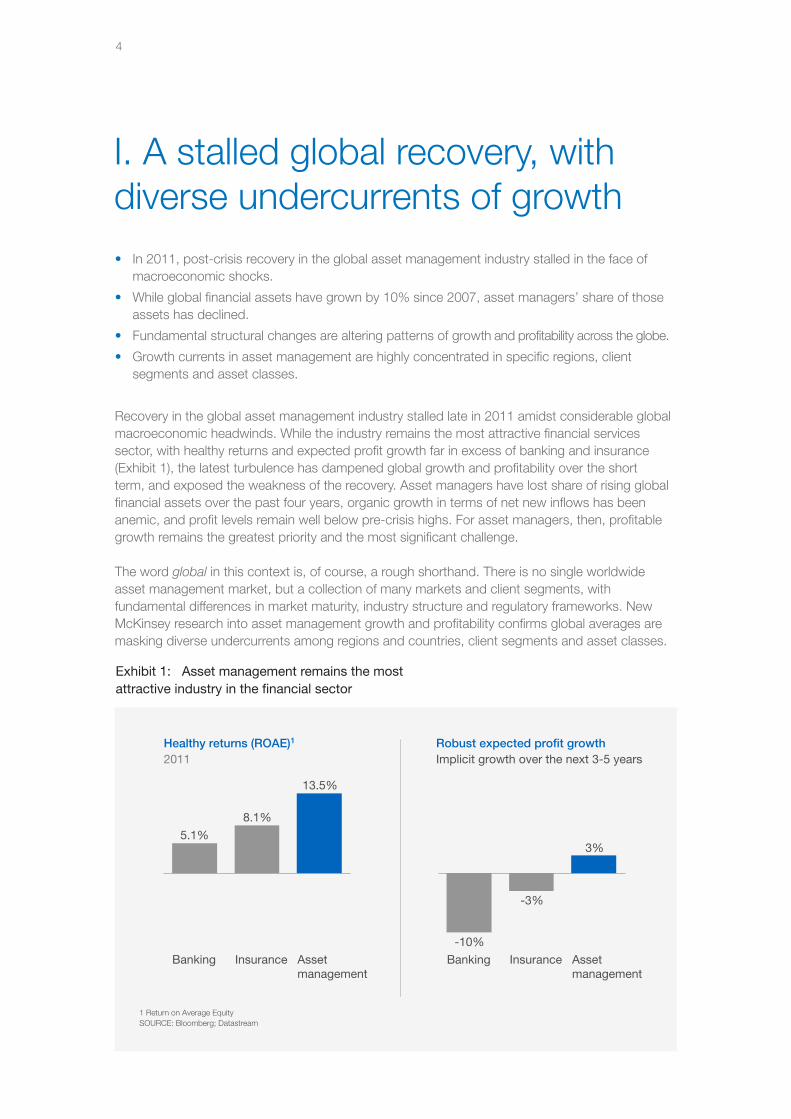
In the face of a highly volatile and uncertain macroeconomic environment, the global asset management industry's recovery from the financial crisis stalled in 2011. While asset management remains the most attractive financial services sector, with a return on equity of 13.5% at the end of 2011 (compared to 8.1% for insurance and 5.1% for banking), the picture looks less positive when viewed over a longer time period. Since 2007, global assets under management (AuM) have been growing at a slower pace than total financial assets, the industry has struggled to attract net inflows, and profits have declined by a third.
At the same time, growth expectations for the industry remain high – 30% of the market value of asset managers is based on expected future profit growth. Restoring profit growth is the most pressing priority for the industry. To meet the challenge, asset managers must both ensure that their supporting cost infrastructure is flexible and adaptable to a fast-changing market environment, and drive top-line growth with granular decisions about where to play and – most important – invest appropriately behind those convictions.
To complicate matters, new McKinsey research reveals that growth in asset management is highly concentrated by area and by player, making strategic decisions on where to invest more difficult and important than ever. To help asset managers pinpoint opportunities, McKinsey has developed a proprietary model that dissects growth and profitability trends by regions and countries, client segments and asset classes. Results from this model and from McKinsey’s benchmarking survey of over 300 asset managers covering approximately 60% of global AuM reveal the following:
• Structural shifts are impacting growth and profitability. From a high level, the asset management industry appears to be in the midst of cyclical change. However, comparisons to the previous market recovery suggest that deeper, structural shifts are at work. First, growth since the financial crisis has come almost exclusively from market appreciation, as opposed to net flows, making the industry more vulnerable to volatility. Second, asset managers are losing share of rising global financial assets. Finally, profitability in developed markets remains well below pre-crisis highs, buffeted by lower revenues and higher costs.
• Low flows overall, but granular opportunities exist by geography, segment and asset class. While adverse conditions and crises have exerted a gravitational pull on all asset management markets, emerging market regions have shown more resilience and continue to grow faster than developed markets (especially in Latin America). Yet, even though divergence has increased between countries, growth has also been concentrated by client segment and by asset class. Over the past four years, the retail segment has declined globally and the institutional segment has remained flat. The individual pension plan/defined contribution segment has been the most consistent source of growth worldwide, in some cases the only source, as in North America. Specialized asset classes including alternatives have accounted for the majority of growth in asset classes.

3
• Competition is fierce, with a wide open playing field. Despite granular opportunities, flows have been minimal overall, and highly concentrated among a handful of players, particularly in retail. Asset managers are competing against a broad spectrum of wealth managers, including private and investment banks, insurance companies and independent financial advisors (IFAs), all of whom offer similar services. The reality is that asset management exists as part of the larger wealth management market. In addition, many of these competing players have direct access to customers through proprietary distribution channels, while asset managers primarily rely on business-to-business or business-to-consumer distribution. Asset managers will need to rethink their distribution model and product/service offering in light of these challenges.
• Seven global trends will shape growth over the next few years. Growth in asset management will continue to evolve in diverse and complex ways, but seven larger trends will strongly influence that growth. They include a continuing concentration of growth in emerging markets that will force asset managers to strategically focus their global footprint; a mainstreaming of alternative investing, which will account for a significant portion of growth across the globe; and the growth of objective-oriented solutions, which is shifting the industry’s focus from generating alpha relative to specific benchmarks to delivering outcomes that clients need.
The asset management industry continues to be highly attractive compared to other financial services sectors. However, in an era of elusive growth and dampened profitability, strategic decisions concerning where and how to compete have never been more important. Overall, the environment will be tougher, with fewer players enjoying the growth rates and profitability of the pre-crisis era. Some players are likely to disappear altogether. Winning firms will be those that understand the granularity of growth in asset management and make the changes necessary to meet the challenge.
4
I. A stalled global recovery, with diverse undercurrents of growth• In 2011, post-crisis recovery in the global asset management industry stalled in the face of
macroeconomic shocks.
• While global financial assets have grown by 10% since 2007, asset managers’ share of those assets has declined.
• Fundamental structural changes are altering patterns of growth and profitability across the globe.
• Growth currents in asset management are highly concentrated in specific regions, client segments and asset classes.
Recovery in the global asset management industry stalled late in 2011 amidst considerable global macroeconomic headwinds. While the industry remains the most attractive financial services sector, with healthy returns and expected profit growth far in excess of banking and insurance (Exhibit 1), the latest turbulence has dampened global growth and profitability over the short term, and exposed the weakness of the recovery. Asset managers have lost share of rising global financial assets over the past four years, organic growth in terms of net new inflows has been anemic, and profit levels remain well below pre-crisis highs. For asset managers, then, profitable growth remains the greatest priority and the most significant challenge.
The word global in this context is, of course, a rough shorthand. There is no single worldwide asset management market, but a collection of many markets and client segments, with fundamental differences in market maturity, industry structure and regulatory frameworks. New McKinsey research into asset management growth and profitability confirms global averages are masking diverse undercurrents among regions and countries, client segments and asset classes.
5.1%
8.1%
Banking Asset management
13.5%
Insurance Banking Insurance
-10%
Asset management
-3%
3%
1 Return on Average Equity
2011Healthy returns (ROAE)1 Robust expected profit growth
Implicit growth over the next 3-5 years
SOURCE: Bloomberg; Datastream
Exhibit 1: Asset management remains the most attractive industry in the financial sector
5
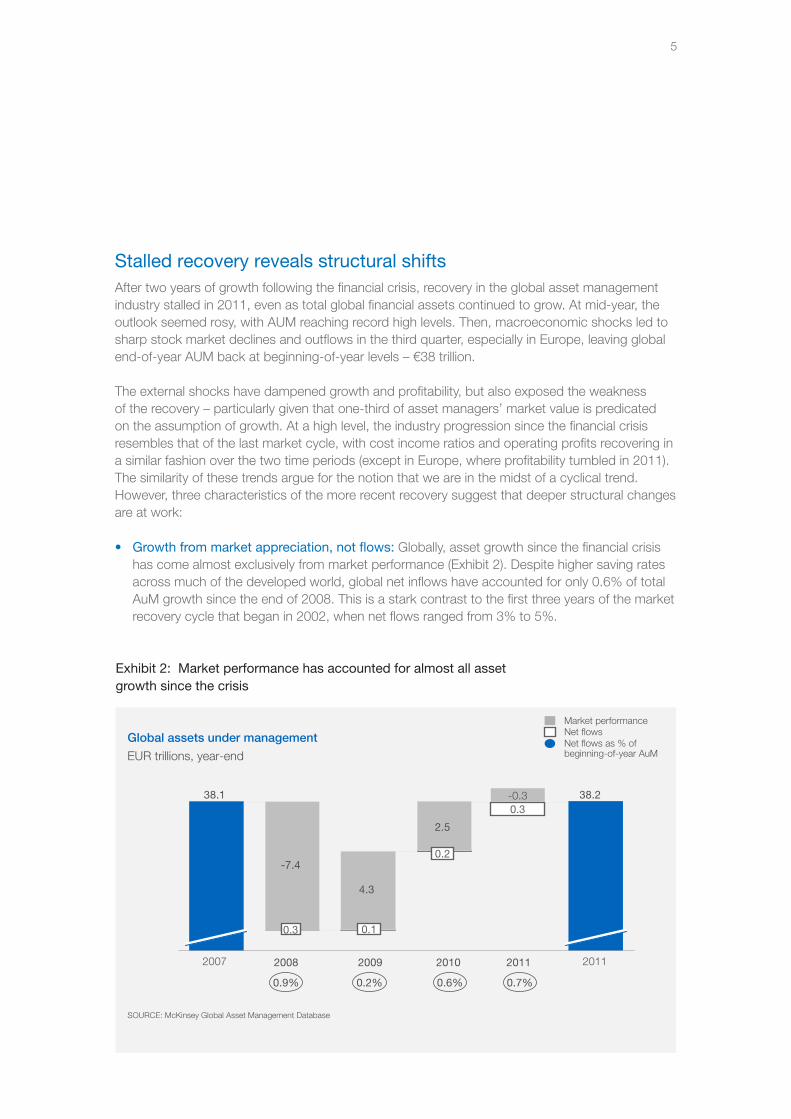
Stalled recovery reveals structural shiftsAfter two years of growth following the financial crisis, recovery in the global asset management industry stalled in 2011, even as total global financial assets continued to grow. At mid-year, the outlook seemed rosy, with AUM reaching record high levels. Then, macroeconomic shocks led to sharp stock market declines and outflows in the third quarter, especially in Europe, leaving global end-of-year AUM back at beginning-of-year levels – €38 trillion.
The external shocks have dampened growth and profitability, but also exposed the weakness of the recovery – particularly given that one-third of asset managers’ market value is predicated on the assumption of growth. At a high level, the industry progression since the financial crisis resembles that of the last market cycle, with cost income ratios and operating profits recovering in a similar fashion over the two time periods (except in Europe, where profitability tumbled in 2011). The similarity of these trends argue for the notion that we are in the midst of a cyclical trend. However, three characteristics of the more recent recovery suggest that deeper structural changes are at work:
• Growth from market appreciation, not flows: Globally, asset growth since the financial crisis has come almost exclusively from market performance (Exhibit 2). Despite higher saving rates across much of the developed world, global net inflows have accounted for only 0.6% of total AuM growth since the end of 2008. This is a stark contrast to the first three years of the market recovery cycle that began in 2002, when net flows ranged from 3% to 5%.
Exhibit 2: Market performance has accounted for almost all asset growth since the crisis
20112011
0.3
0.2
2.5
0.1
4.3
0.3
-7.4
2007
38.1
SOURCE: McKinsey Global Asset Management Database
-0.3 38.2
201020092008
0.9% 0.2% 0.6% 0.7%
Global assets under management Net flowsMarket performance
Net flows as % of beginning-of-year AuMEUR trillions, year-end
6
Exhibit 3: Asset managers’ share of total global assets has declined
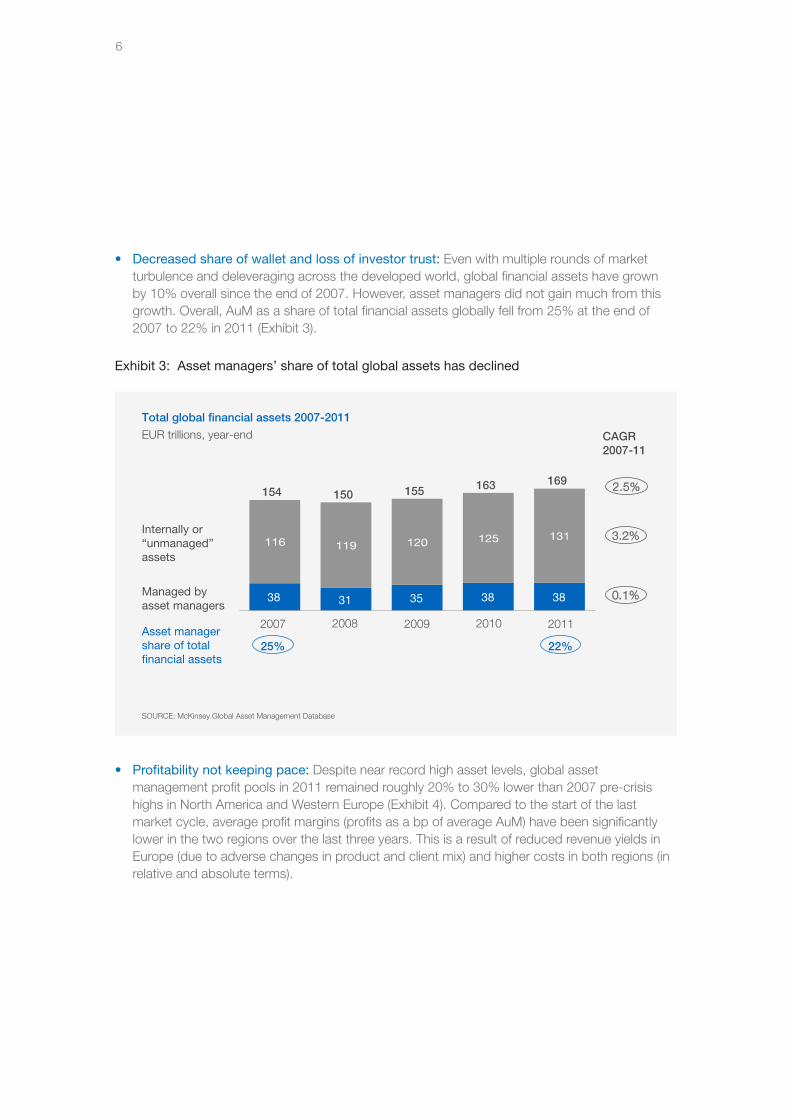
• Decreased share of wallet and loss of investor trust: Even with multiple rounds of market turbulence and deleveraging across the developed world, global financial assets have grown by 10% overall since the end of 2007. However, asset managers did not gain much from this growth. Overall, AuM as a share of total financial assets globally fell from 25% at the end of 2007 to 22% in 2011 (Exhibit 3).
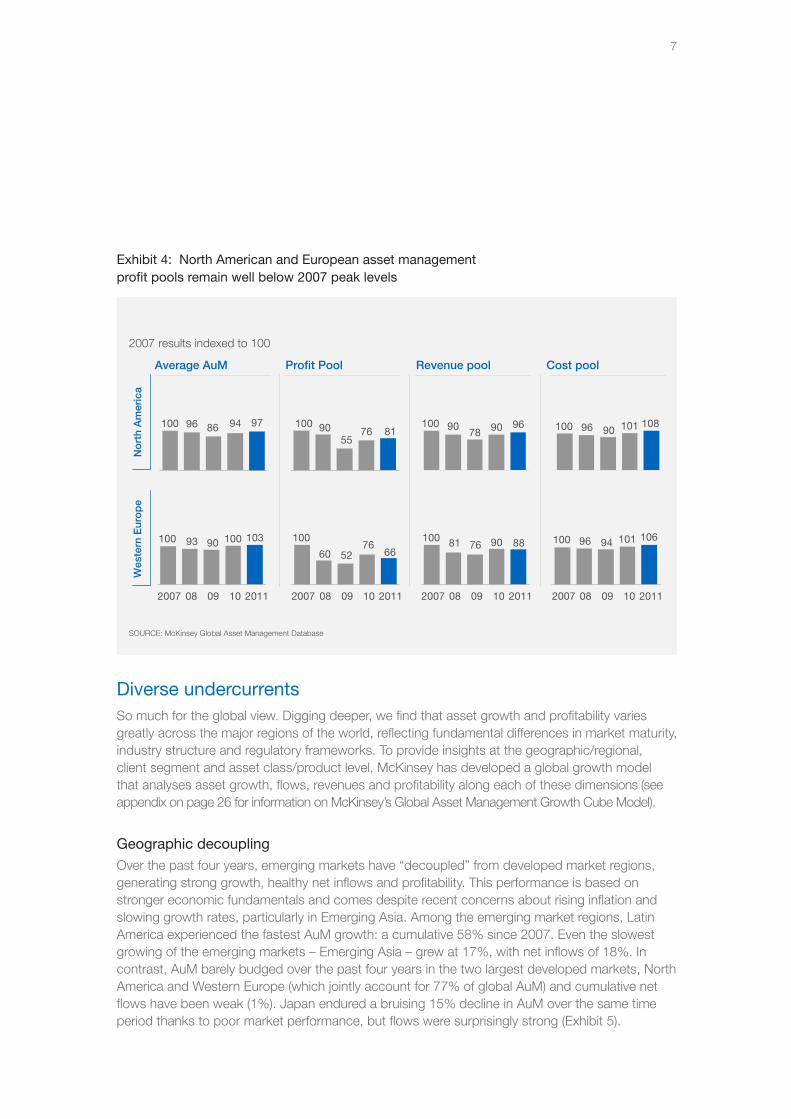
• Profitability not keeping pace: Despite near record high asset levels, global asset management profit pools in 2011 remained roughly 20% to 30% lower than 2007 pre-crisis highs in North America and Western Europe (Exhibit 4). Compared to the start of the last market cycle, average profit margins (profits as a bp of average AuM) have been significantly lower in the two regions over the last three years. This is a result of reduced revenue yields in Europe (due to adverse changes in product and client mix) and higher costs in both regions (in relative and absolute terms).
EUR trillions, year-end
Total global financial assets 2007-2011
SOURCE: McKinsey Global Asset Management Database
116 119 120 125 131
2010 2011
169
38
163
38
2009
155
35
2008
150
31
2007
154
38Managed by asset managers
CAGR2007-11
3.2%
0.1%
25% 22%Asset manager share of total financial assets
Internally or “unmanaged”assets
2.5%
7
Exhibit 4: North American and European asset management profit pools remain well below 2007 peak levels
Diverse undercurrentsSo much for the global view. Digging deeper, we find that asset growth and profitability varies greatly across the major regions of the world, reflecting fundamental differences in market maturity, industry structure and regulatory frameworks. To provide insights at the geographic/regional, client segment and asset class/product level, McKinsey has developed a global growth model that analyses asset growth, flows, revenues and profitability along each of these dimensions (see appendix on page 26 for information on McKinsey’s Global Asset Management Growth Cube Model).
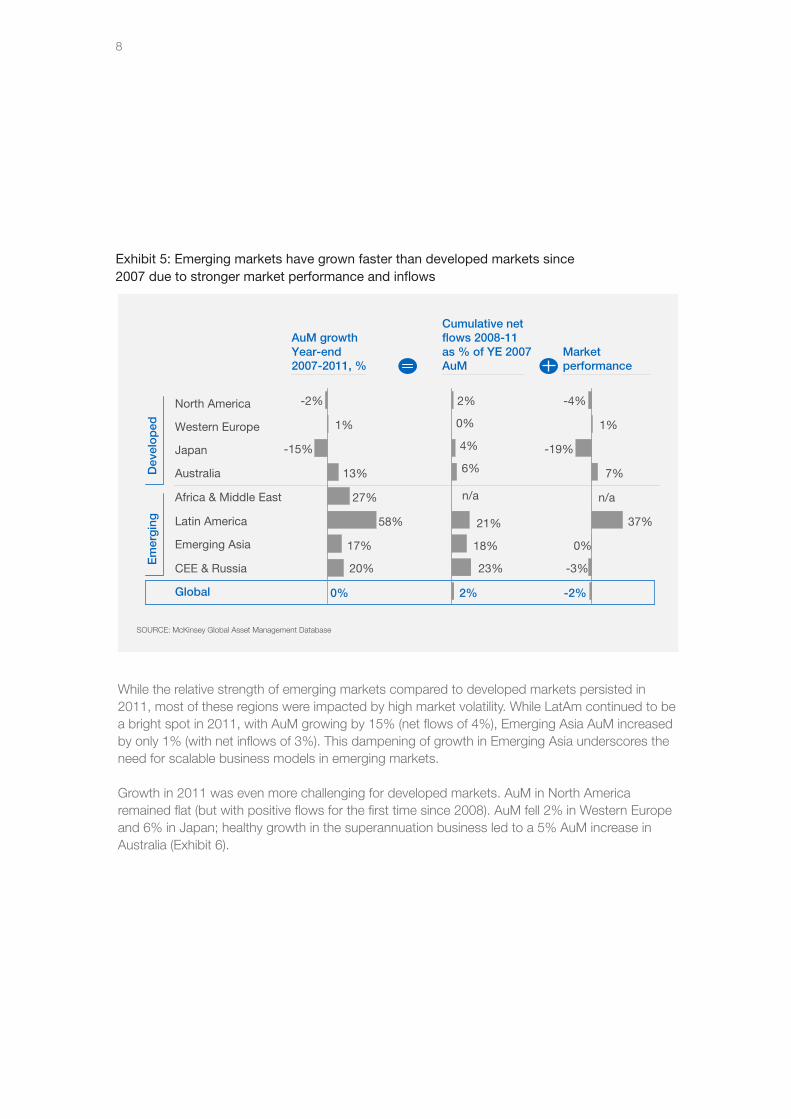
Geographic decouplingOver the past four years, emerging markets have “decoupled” from developed market regions, generating strong growth, healthy net inflows and profitability. This performance is based on stronger economic fundamentals and comes despite recent concerns about rising inflation and slowing growth rates, particularly in Emerging Asia. Among the emerging market regions, Latin America experienced the fastest AuM growth: a cumulative 58% since 2007. Even the slowest growing of the emerging markets – Emerging Asia – grew at 17%, with net inflows of 18%. In contrast, AuM barely budged over the past four years in the two largest developed markets, North America and Western Europe (which jointly account for 77% of global AuM) and cumulative net flows have been weak (1%). Japan endured a bruising 15% decline in AuM over the same time period thanks to poor market performance, but flows were surprisingly strong (Exhibit 5).
No
rth
Am
eric
a
2007 results indexed to 100
SOURCE: McKinsey Global Asset Management Database
100
20111009082007 20111009082007
100
2011
108
10
101
09082007
100
20111009082007
100
Average AuM Profit Pool Cost poolRevenue pool
Wes
tern
Eur
op
e
103100100 100 101100100
96 86 94 97 9055
76 81 9078 90 96 96 90
10693 9060 52
7666
81 76 90 88 96 94
8
Exhibit 5: Emerging markets have grown faster than developed markets since 2007 due to stronger market performance and inflows
Em
erg
ing
North America
Global
CEE & Russia
Emerging Asia
Latin America
Africa & Middle East
Australia
Japan
Western Europe
AuM growthYear-end2007-2011, %
Cumulative net flows 2008-11 as % of YE 2007 AuM
Dev
elo
ped
Market performance
SOURCE: McKinsey Global Asset Management Database
0%
20%
17%
58%
27%
13%
-15%
1%
-2%
2%
23%
18%
21%
6%
4%
0%
2%
37%
0%
-3%
-2%
7%
n/a
-4%
1%
-19%
n/a
While the relative strength of emerging markets compared to developed markets persisted in 2011, most of these regions were impacted by high market volatility. While LatAm continued to be a bright spot in 2011, with AuM growing by 15% (net flows of 4%), Emerging Asia AuM increased by only 1% (with net inflows of 3%). This dampening of growth in Emerging Asia underscores the need for scalable business models in emerging markets.
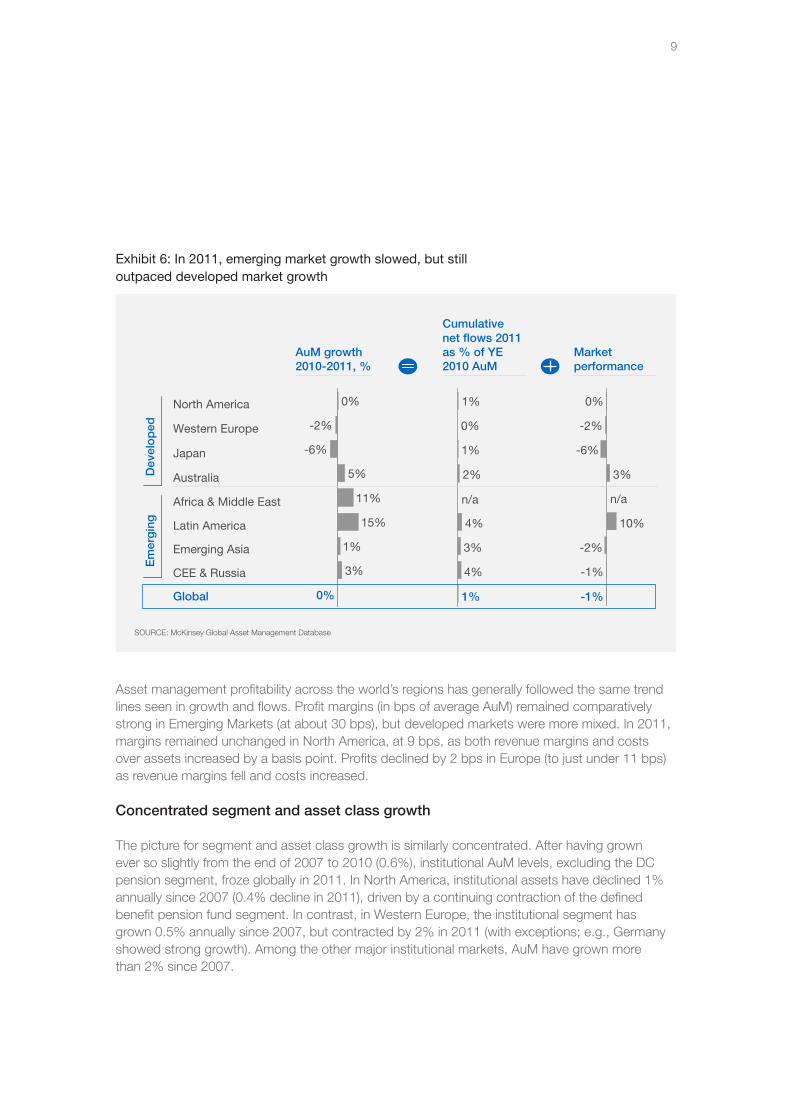
Growth in 2011 was even more challenging for developed markets. AuM in North America remained flat (but with positive flows for the first time since 2008). AuM fell 2% in Western Europe and 6% in Japan; healthy growth in the superannuation business led to a 5% AuM increase in Australia (Exhibit 6).
9
Exhibit 6: In 2011, emerging market growth slowed, but still outpaced developed market growth
AuM growth2010-2011, %
Cumulative net flows 2011 as % of YE 2010 AuM
Market performance
0%
3%
1%
15%
11%
5%
-6%
-2%
0%
1%
4%
3%
4%
2%
1%
0%
1%
-1%
-1%
-2%
10%
n/a
3%
-6%
-2%
0%
n/a
SOURCE: McKinsey Global Asset Management Database
North America
CEE & Russia
Emerging Asia
Latin America
Africa & Middle East
Australia
Japan
Western Europe
Em
erg
ing
Dev
elo
ped
Global
Asset management profitability across the world’s regions has generally followed the same trend lines seen in growth and flows. Profit margins (in bps of average AuM) remained comparatively strong in Emerging Markets (at about 30 bps), but developed markets were more mixed. In 2011, margins remained unchanged in North America, at 9 bps, as both revenue margins and costs over assets increased by a basis point. Profits declined by 2 bps in Europe (to just under 11 bps) as revenue margins fell and costs increased.
Concentrated segment and asset class growth
The picture for segment and asset class growth is similarly concentrated. After having grown ever so slightly from the end of 2007 to 2010 (0.6%), institutional AuM levels, excluding the DC pension segment, froze globally in 2011. In North America, institutional assets have declined 1% annually since 2007 (0.4% decline in 2011), driven by a continuing contraction of the defined benefit pension fund segment. In contrast, in Western Europe, the institutional segment has grown 0.5% annually since 2007, but contracted by 2% in 2011 (with exceptions; e.g., Germany showed strong growth). Among the other major institutional markets, AuM have grown more than 2% since 2007.
10
Institutional excluding DC Defined contributionRetail
-1.6% p.a.
2011
13.9
2.4
8.8
2007
14.8
2.6
9.0
AuM, EUR trillions
0.4% p.a.
2011
18.3
5.5
6.4
2007
18.0
5.1
6.7
-3.5%
-2.2%
-0.7%0.5%
2.1%
-1.0%
SOURCE: McKinsey Global Asset Management Database
Western Europe
North America
Other regions
3.3% p.a.
2011
6.0
0.7
3.5
2007
5.3
0.5
3.46.9%
7.6%
1.0%
CAGR, %2007-11
CAGR, %2007-11
CAGR, %2007-11
3.2
6.3 6.4
2.8
1.4 1.8
Exhibit 7: Defined contribution is the fastest-growing segment globally, followed by institutional
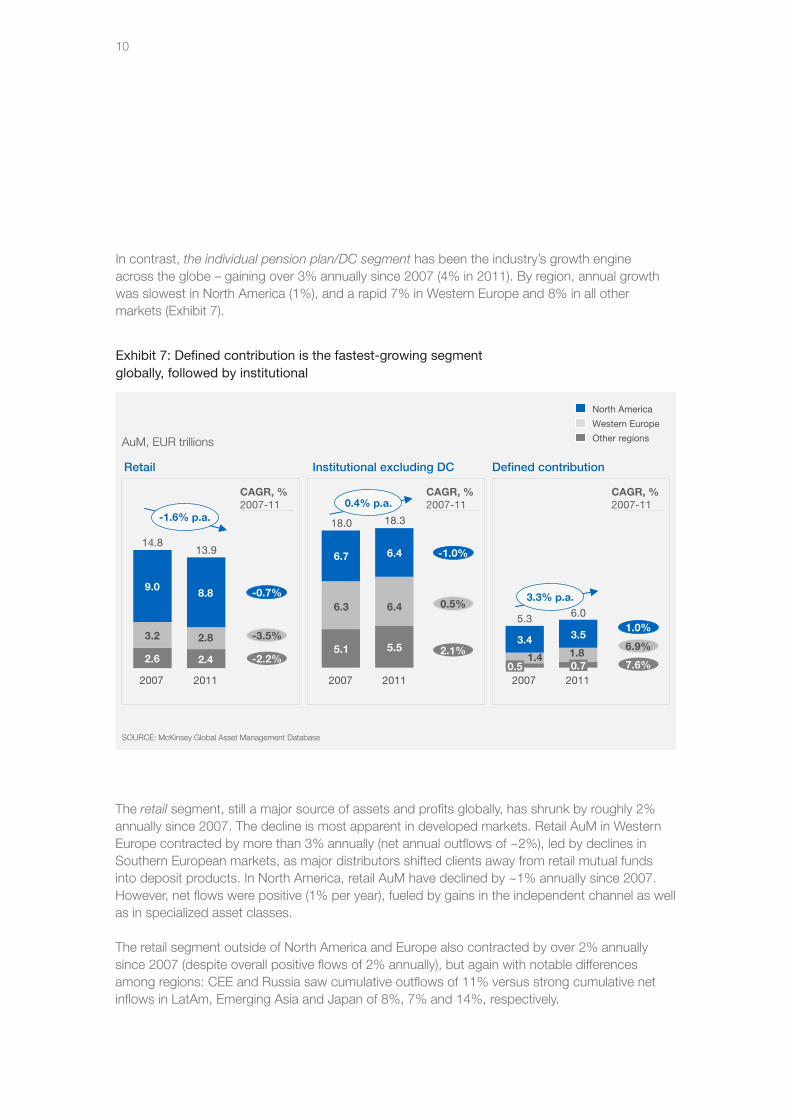
In contrast, the individual pension plan/DC segment has been the industry’s growth engine across the globe – gaining over 3% annually since 2007 (4% in 2011). By region, annual growth was slowest in North America (1%), and a rapid 7% in Western Europe and 8% in all other markets (Exhibit 7).
The retail segment, still a major source of assets and profits globally, has shrunk by roughly 2% annually since 2007. The decline is most apparent in developed markets. Retail AuM in Western Europe contracted by more than 3% annually (net annual outflows of ~2%), led by declines in Southern European markets, as major distributors shifted clients away from retail mutual funds into deposit products. In North America, retail AuM have declined by ~1% annually since 2007. However, net flows were positive (1% per year), fueled by gains in the independent channel as well as in specialized asset classes.
The retail segment outside of North America and Europe also contracted by over 2% annually since 2007 (despite overall positive flows of 2% annually), but again with notable differences among regions: CEE and Russia saw cumulative outflows of 11% versus strong cumulative net inflows in LatAm, Emerging Asia and Japan of 8%, 7% and 14%, respectively.
11
Cumulative retail segment net flows 2008-2011, % of 2007 AuM
SOURCE: McKinsey Global Asset Management Database
EquityFixed income Balanced
Money market
Alternatives& other Total
Total %
Latin America
Emerging Asia
Japan
Australia
Western Europe -
North America
CEE & Russia
15%1% 6% -21%
-
2%
8%
7%
14%
0%
6%
3%
11%
16
>5% <0%0-5% n/a
Exhibit 8: The global asset class landscape
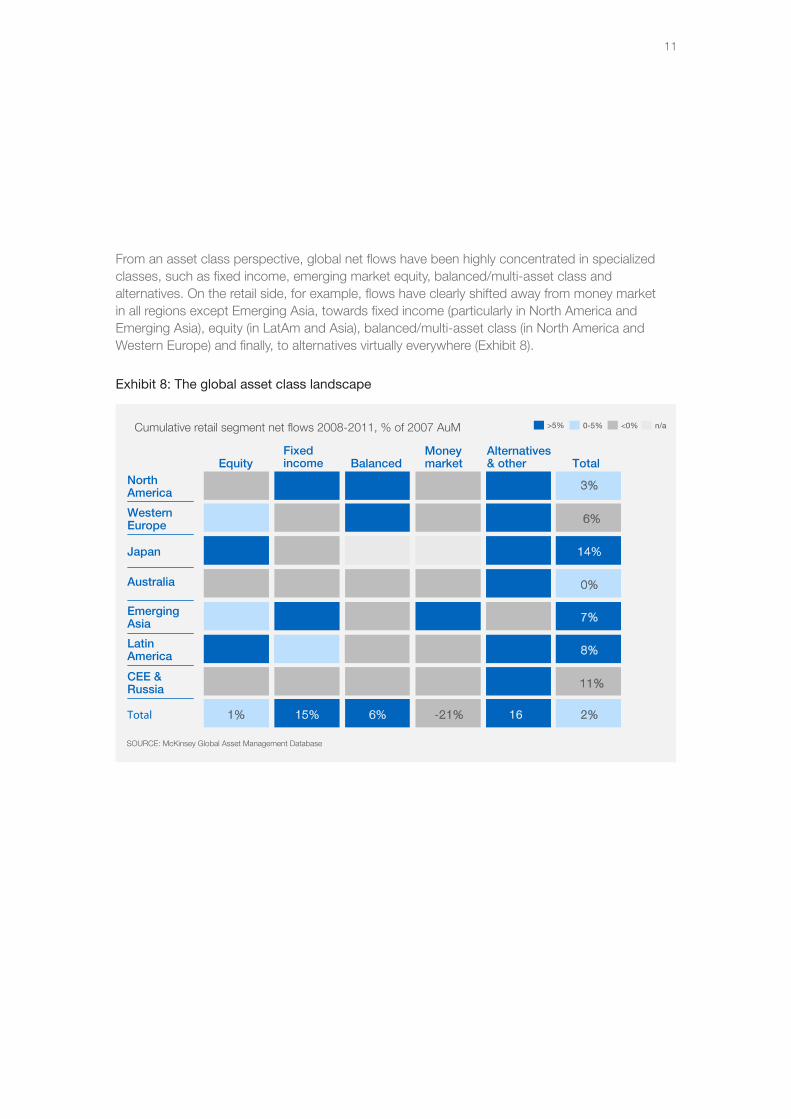
From an asset class perspective, global net flows have been highly concentrated in specialized classes, such as fixed income, emerging market equity, balanced/multi-asset class and alternatives. On the retail side, for example, flows have clearly shifted away from money market in all regions except Emerging Asia, towards fixed income (particularly in North America and Emerging Asia), equity (in LatAm and Asia), balanced/multi-asset class (in North America and Western Europe) and finally, to alternatives virtually everywhere (Exhibit 8).

12
13
II. The global search for growth opportunities• In North America, flows have been highly concentrated in defined contribution and in a few
specialized asset classes – and in a handful of firms.
• The European asset management landscape has been defined by collapsing retail flows, sharp difference between individual markets, and a “winner takes all” environment.
• Growth across emerging Asia disappointed in 2011, but as in Europe, there were sweet spots by product and by country.
• In Latin America, strong growth continued in Brazil, Mexico and Chile, and overall the investment mix is gradually becoming more sophisticated.
Asset management growth opportunities clearly exist across the globe, even in the most challenging markets. But decisions regarding where to play – which accounted for the majority of total growth over the last decade – are more complex than ever. The few firms with sustained above average growth rates go deeper in identifying opportunities than their peers. They look first to growing markets in their specific geographies, select the most attractive client segments within those regions, and then design the product or solution to meet the needs of those clients. In this chapter we describe the granular growth and profitability trends uncovered by our most recent research.
North AmericaRecovery in the North American asset management industry hit a rough patch in 2011 in the form of volatile markets and structural headwinds. The year began well, with market appreciation pushing AuM to record heights by mid-year. But by year end, AuM were back to 2010 levels. Moreover, despite an increase, since 2007, in the savings rate (to 11%) and positive GDP growth (2%) net inflows have been anemic at less than 1% (3% in 2008, -2% in 2009, -1% in 2010 and 1% in 2011).
Industry pretax operating margins did inch up to 28% of revenues in 2011 from 27% in 2010 (while profits over AuM remained unchanged at 9 bps). However, profitability remains roughly 20% below pre-crisis levels as revenues and costs face continuing pressure. Specifically, while 2011 overall net revenue yields edged up by 1 bp in both retail and institutional, prices are on average 6% below 2007 levels in retail and about 10% lower in institutional. Costs, meanwhile, continued to grow, increasing by 7% in absolute terms in 2011 (1 bp of assets), with the fastest increases in sales and marketing and operations.
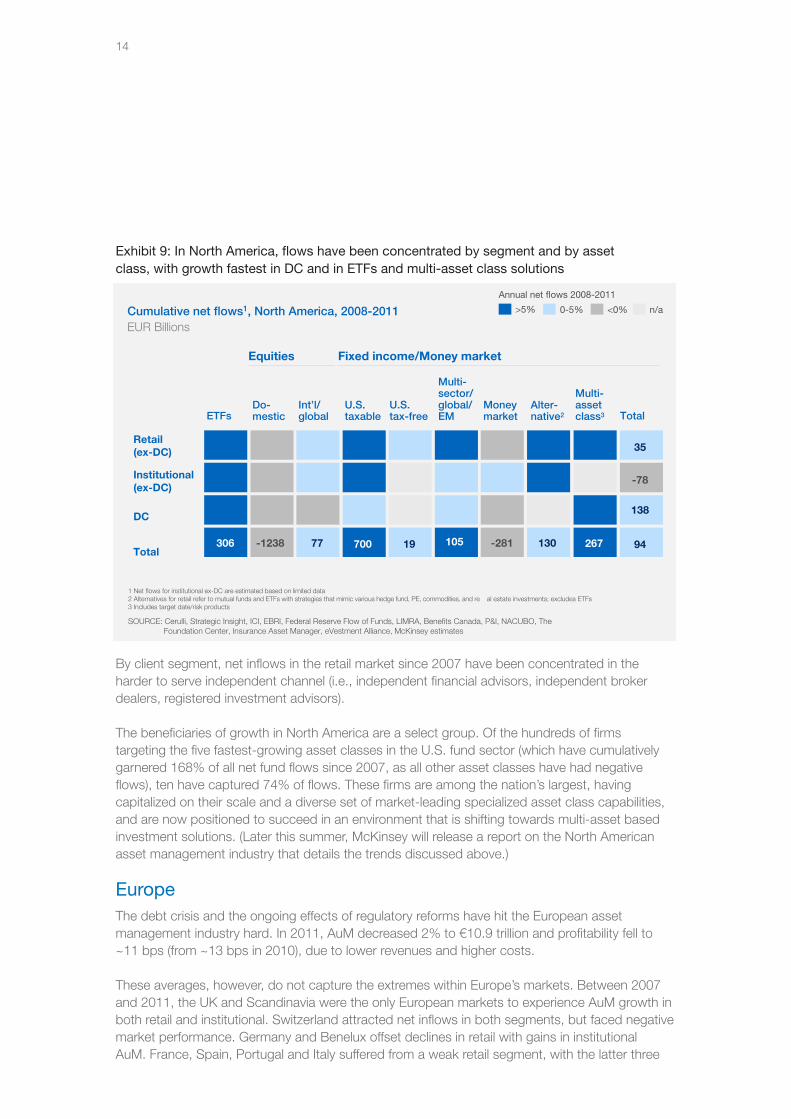
Notwithstanding the problems associated with managing assets in a highly volatile market environment, flows remain highly concentrated in North America. Since 2007, net new money has flowed almost exclusively to the DC segment and to a lesser extent to the retail segment. Flows have also been highly concentrated in specialized asset classes – ETFs, taxable fixed income, multi-sector/global/emerging market fixed income, alternatives, and multi-asset solution products (Exhibit 9).
14
Exhibit 9: In North America, flows have been concentrated by segment and by asset class, with growth fastest in DC and in ETFs and multi-asset class solutions
1 Net flows for institutional ex-DC are estimated based on limited data2 Alternatives for retail refer to mutual funds and ETFs with strategies that mimic various hedge fund, PE, commodities, and re al estate investments; excludes ETFs3 Includes target date/risk products
EUR BillionsCumulative net flows1, North America, 2008-2011
Institutional (ex-DC)
DC
Total
Retail(ex-DC)
Equities
Total
-78
138
94
35
ETFs
306 -1238 700
Alter-native2
130
Multi-asset class3
267
Do-mestic
Int’l/global
77 105 -281
Fixed income/Money market
U.S. taxable
Multi-sector/global/EM
Moneymarket
U.S.tax-free
19
SOURCE: Cerulli, Strategic Insight, ICI, EBRI, Federal Reserve Flow of Funds, LIMRA, Benefits Canada, P&I, NACUBO, The Foundation Center, Insurance Asset Manager, eVestment Alliance, McKinsey estimates
Annual net �ows 2008-2011
>5% <0%0-5% n/a
By client segment, net inflows in the retail market since 2007 have been concentrated in the harder to serve independent channel (i.e., independent financial advisors, independent broker dealers, registered investment advisors).
The beneficiaries of growth in North America are a select group. Of the hundreds of firms targeting the five fastest-growing asset classes in the U.S. fund sector (which have cumulatively garnered 168% of all net fund flows since 2007, as all other asset classes have had negative flows), ten have captured 74% of flows. These firms are among the nation’s largest, having capitalized on their scale and a diverse set of market-leading specialized asset class capabilities, and are now positioned to succeed in an environment that is shifting towards multi-asset based investment solutions. (Later this summer, McKinsey will release a report on the North American asset management industry that details the trends discussed above.)
EuropeThe debt crisis and the ongoing effects of regulatory reforms have hit the European asset management industry hard. In 2011, AuM decreased 2% to €10.9 trillion and profitability fell to ~11 bps (from ~13 bps in 2010), due to lower revenues and higher costs.
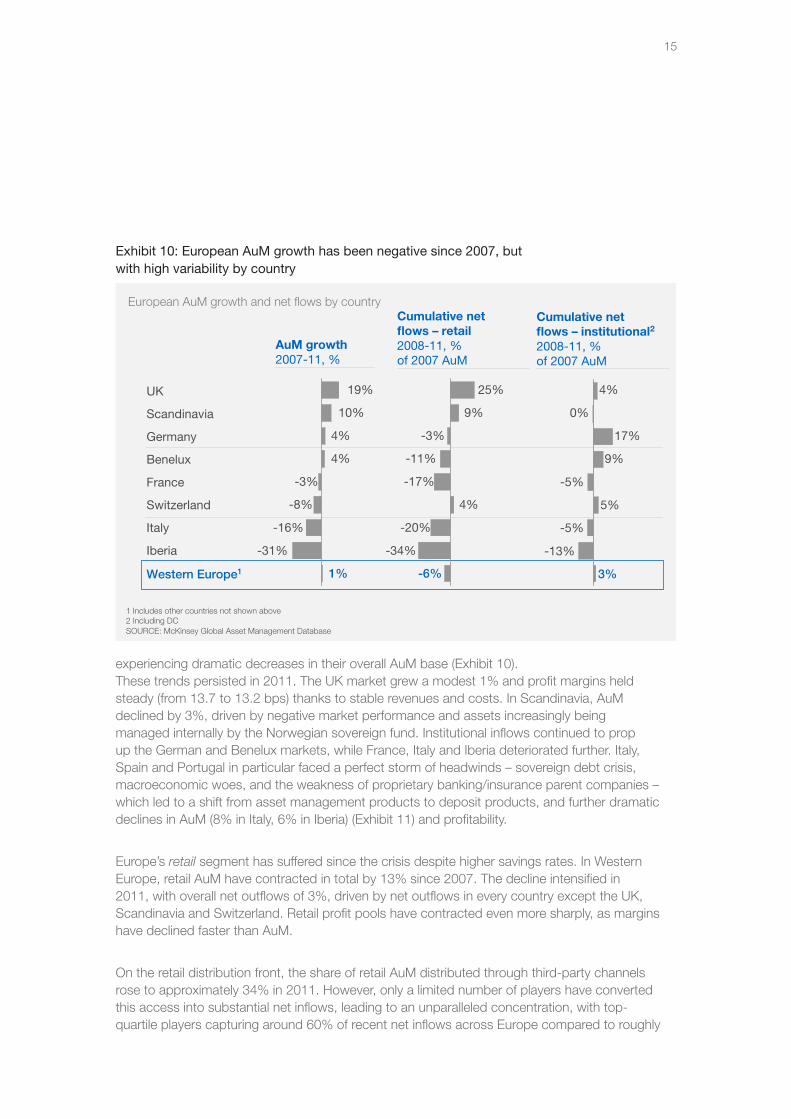
These averages, however, do not capture the extremes within Europe’s markets. Between 2007 and 2011, the UK and Scandinavia were the only European markets to experience AuM growth in both retail and institutional. Switzerland attracted net inflows in both segments, but faced negative market performance. Germany and Benelux offset declines in retail with gains in institutional AuM. France, Spain, Portugal and Italy suffered from a weak retail segment, with the latter three
15
Exhibit 10: European AuM growth has been negative since 2007, but with high variability by country
UK
Scandinavia
Germany
Benelux
Western Europe1
Italy
France
Switzerland
Iberia
European AuM growth and net flows by country
1%
-31%
-16%
4%
-8%
4%
19%
10%
-3%
-20%
-6%
-34%
-17%
-11%
25%
-3%
4%
9%
-5%
3%
-13%
9%
-5%
4%
0%
17%
5%
AuM growth2007-11, %
Cumulative net flows – institutional2
2008-11, % of 2007 AuM
Cumulative net flows – retail2008-11, % of 2007 AuM
1 Includes other countries not shown above2 Including DCSOURCE: McKinsey Global Asset Management Database
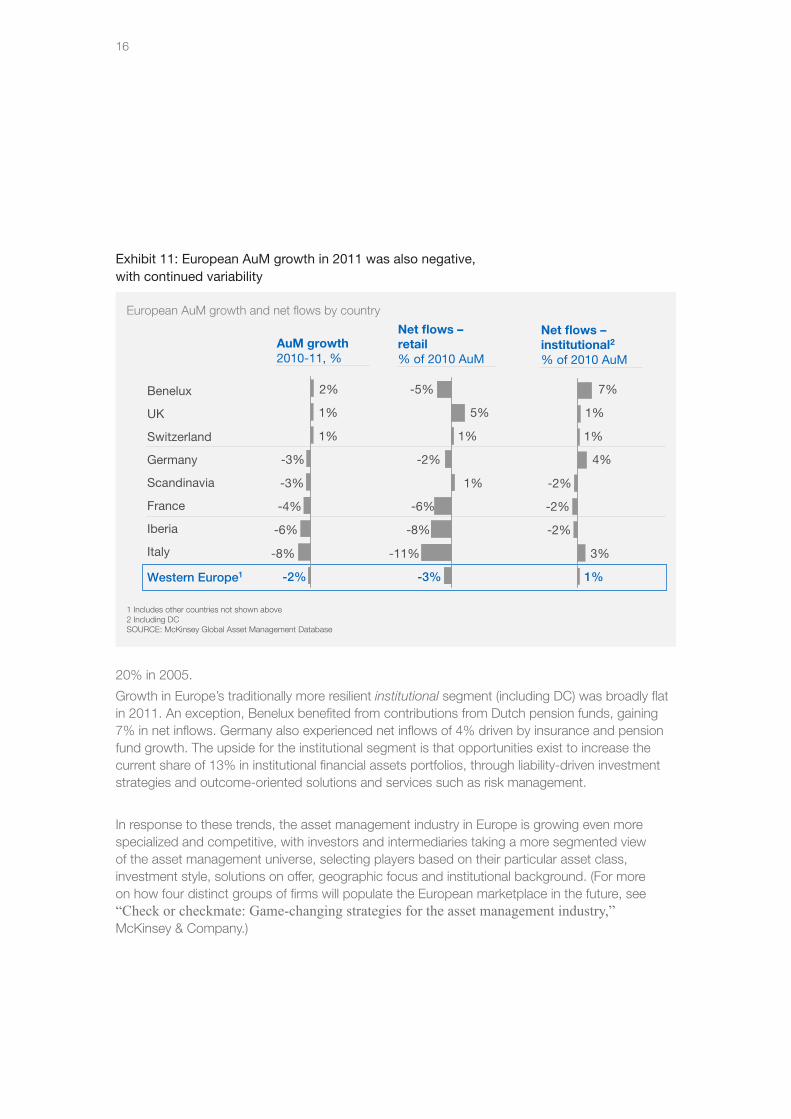
experiencing dramatic decreases in their overall AuM base (Exhibit 10).These trends persisted in 2011. The UK market grew a modest 1% and profit margins held steady (from 13.7 to 13.2 bps) thanks to stable revenues and costs. In Scandinavia, AuM declined by 3%, driven by negative market performance and assets increasingly being managed internally by the Norwegian sovereign fund. Institutional inflows continued to prop up the German and Benelux markets, while France, Italy and Iberia deteriorated further. Italy, Spain and Portugal in particular faced a perfect storm of headwinds – sovereign debt crisis, macroeconomic woes, and the weakness of proprietary banking/insurance parent companies – which led to a shift from asset management products to deposit products, and further dramatic declines in AuM (8% in Italy, 6% in Iberia) (Exhibit 11) and profitability.
Europe’s retail segment has suffered since the crisis despite higher savings rates. In Western Europe, retail AuM have contracted in total by 13% since 2007. The decline intensified in 2011, with overall net outflows of 3%, driven by net outflows in every country except the UK, Scandinavia and Switzerland. Retail profit pools have contracted even more sharply, as margins have declined faster than AuM.
On the retail distribution front, the share of retail AuM distributed through third-party channels rose to approximately 34% in 2011. However, only a limited number of players have converted this access into substantial net inflows, leading to an unparalleled concentration, with top-quartile players capturing around 60% of recent net inflows across Europe compared to roughly
16
Benelux
UK
Switzerland
Germany
Western Europe1
Iberia
Scandinavia
France
Italy
European AuM growth and net flows by country
-2%
-4%
1%
-8%
-6%
-3%
-3%
1%
2%
-3%
-11%
-6%
5%
1%
-2%
-5%
-8%
1%
1%
3%
-2%
1%
-2%
1%
-2%
4%
7%
AuM growth2010-11, %
Net flows –institutional2
% of 2010 AuM
Net flows –retail% of 2010 AuM
1 Includes other countries not shown above2 Including DCSOURCE: McKinsey Global Asset Management Database
Exhibit 11: European AuM growth in 2011 was also negative, with continued variability
20% in 2005.
Growth in Europe’s traditionally more resilient institutional segment (including DC) was broadly flat in 2011. An exception, Benelux benefited from contributions from Dutch pension funds, gaining 7% in net inflows. Germany also experienced net inflows of 4% driven by insurance and pension fund growth. The upside for the institutional segment is that opportunities exist to increase the current share of 13% in institutional financial assets portfolios, through liability-driven investment strategies and outcome-oriented solutions and services such as risk management.
In response to these trends, the asset management industry in Europe is growing even more specialized and competitive, with investors and intermediaries taking a more segmented view of the asset management universe, selecting players based on their particular asset class, investment style, solutions on offer, geographic focus and institutional background. (For more on how four distinct groups of firms will populate the European marketplace in the future, see “Check or checkmate: Game-changing strategies for the asset management industry,” McKinsey & Company.)
17
AsiaDespite strong growth across the region since 2007, the mood in Asia’s asset management markets is less than exuberant. The Asian asset management story is predicated on growth, but the industry has failed to keep pace with broader economic growth – for example, in the growth engine of Emerging Asia, the share of total personal financial assets managed by asset managers has fallen from approximately 15% in 2007 to 10% in 2011.
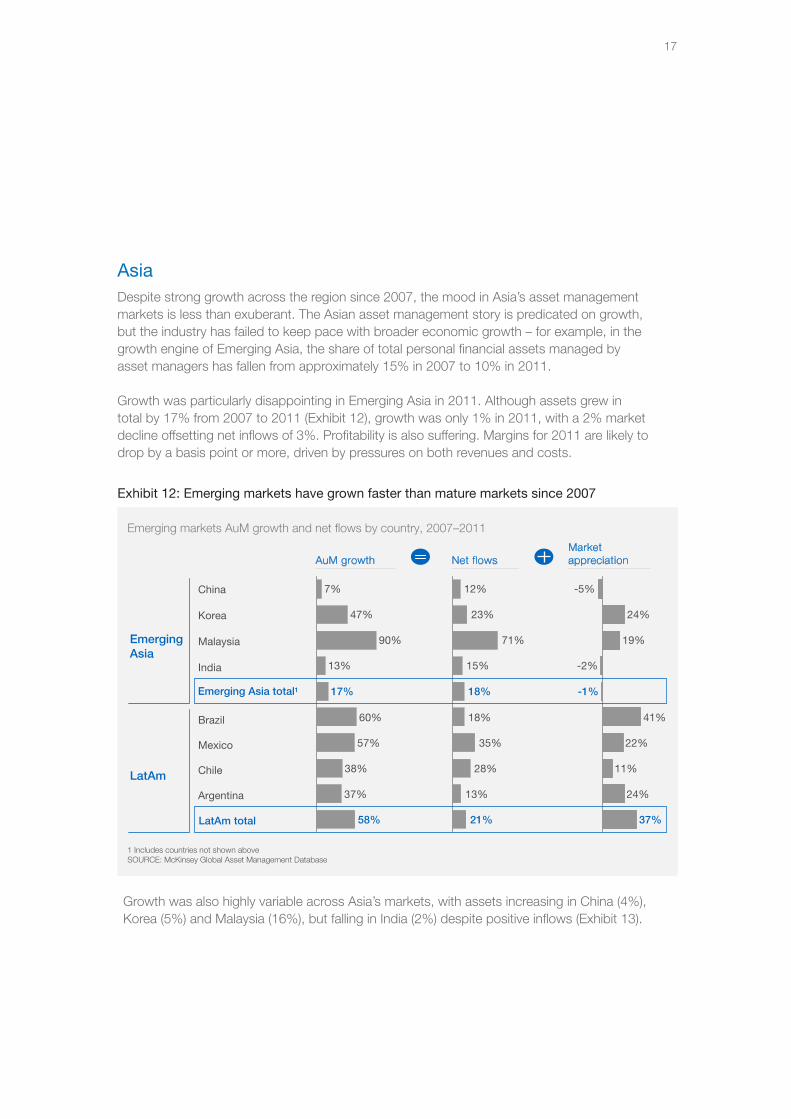
Growth was particularly disappointing in Emerging Asia in 2011. Although assets grew in total by 17% from 2007 to 2011 (Exhibit 12), growth was only 1% in 2011, with a 2% market decline offsetting net inflows of 3%. Profitability is also suffering. Margins for 2011 are likely to drop by a basis point or more, driven by pressures on both revenues and costs.
58%
17%
37%
38%
57%
60%
13%
90%
47%
7%
21%
18%
13%
28%
35%
18%
15%
71%
23%
12%
-1%
37%
24%
11%
22%
41%
-2%
19%
24%
-5%
AuM growth Net flows
Brazil
Korea
Mexico
China
India
Market appreciation
Emerging Asia
1 Includes countries not shown above SOURCE: McKinsey Global Asset Management Database
Chile
Argentina
LatAm
Malaysia
Emerging markets AuM growth and net flows by country, 2007–2011
Emerging Asia total1
LatAm total
Exhibit 12: Emerging markets have grown faster than mature markets since 2007
Growth was also highly variable across Asia’s markets, with assets increasing in China (4%), Korea (5%) and Malaysia (16%), but falling in India (2%) despite positive inflows (Exhibit 13).
18
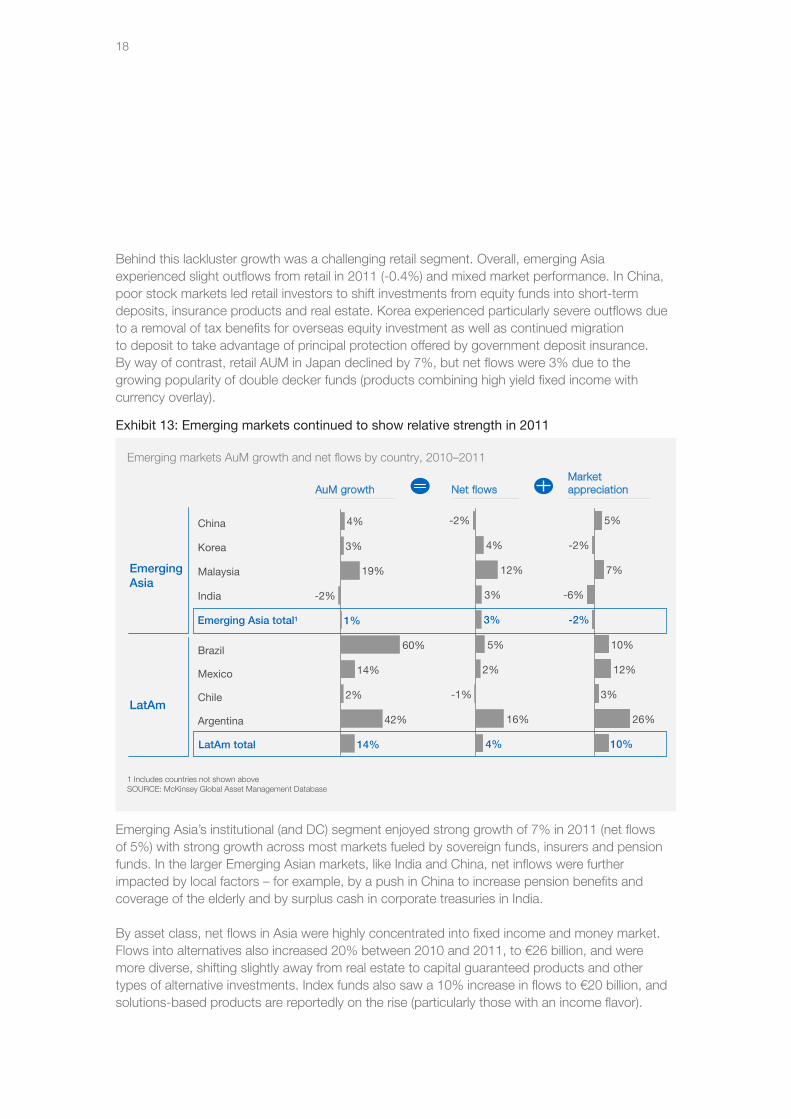
Behind this lackluster growth was a challenging retail segment. Overall, emerging Asia experienced slight outflows from retail in 2011 (-0.4%) and mixed market performance. In China, poor stock markets led retail investors to shift investments from equity funds into short-term deposits, insurance products and real estate. Korea experienced particularly severe outflows due to a removal of tax benefits for overseas equity investment as well as continued migration to deposit to take advantage of principal protection offered by government deposit insurance. By way of contrast, retail AUM in Japan declined by 7%, but net flows were 3% due to the growing popularity of double decker funds (products combining high yield fixed income with currency overlay).
Emerging Asia’s institutional (and DC) segment enjoyed strong growth of 7% in 2011 (net flows of 5%) with strong growth across most markets fueled by sovereign funds, insurers and pension funds. In the larger Emerging Asian markets, like India and China, net inflows were further impacted by local factors – for example, by a push in China to increase pension benefits and coverage of the elderly and by surplus cash in corporate treasuries in India.
By asset class, net flows in Asia were highly concentrated into fixed income and money market. Flows into alternatives also increased 20% between 2010 and 2011, to €26 billion, and were more diverse, shifting slightly away from real estate to capital guaranteed products and other types of alternative investments. Index funds also saw a 10% increase in flows to €20 billion, and solutions-based products are reportedly on the rise (particularly those with an income flavor).
Exhibit 13: Emerging markets continued to show relative strength in 2011
60%
1%
14%
42%
2%
14%
-2%
19%
3%
4%
3%
4%
16%
-1%
2%
5%
3%
12%
4%
-2%
-2%
10%
26%
3%
12%
10%
-6%
7%
-2%
5%
Brazil
Korea
Mexico
China
India
1 Includes countries not shown above SOURCE: McKinsey Global Asset Management Database
Chile
Argentina
Malaysia
Emerging markets AuM growth and net flows by country, 2010–2011
Emerging Asia total1
LatAm total
AuM growth Net flowsMarket appreciation
Emerging Asia
LatAm
19
In addition to the challenge posed by highly variable growth across markets, Asia remains highly fragmented geographically and in terms of consumer preferences, regulations and distribution structures. To succeed, asset managers must build scalable and economically viable business models – in a region that is already hard to serve profitably and getting more so.
Latin AmericaLatin America accounts only for roughly 3 percent (€1 trillion) of global AuM, but has been one of the fastest-growing and highest-margin regions. Growth will likely remain strong due to solid economic prospects, increasing foreign investments and market under-penetration. Brazil, Mexico and Chile should remain the most robust markets due to their starting position and country stability. However, as investor sophistication increases, interest rates decline and increased transparency brings pressure to bear on fees, profitability is likely to fall.
In addition, LatAm markets are capacity-constrained in the sense that liquidity is still lacking, even for large players, and the private credit market is incipient across Mexico, Chile and Brazil (17% of GDP, 18% and 23% respectively in 2010). Unless there is a concerted effort by regulators and industry players, capacity will remain a hurdle and the market will remain shallow, with limited investment opportunities.
The vast majority of AuM (about 95 percent) in the region are concentrated in Brazil, Mexico and Chile. Over the past four years, LatAm has grown at approximately 12 percent annually, mostly driven by asset appreciation. Mexico, Chile, Colombia and Peru are still seeing growth in new customers (affiliates of Pillar II pensions) and net flows. Profit margins have remained healthy, at around 30 bps, despite some negative trends (e.g., pension pricing in Mexico will continue to decline under regulatory pressure).
Growth in Brazil, both the largest and fastest-growing LatAm market, has been largely driven by market appreciation. The investment mix here is less slanted towards fixed income, and alternative products are growing faster than in other LatAm countries.
Mexico has been also seen healthy growth rates, driven by new affiliate/employee growth in the Pillar II pensions segment, market returns and general economic prosperity. The future also seems bright, as an upcoming generational shift could raise the level of sophistication in the market over the next five years. Chile has seen double-digit growth of roughly 12 percent since 2007, with independent players gaining importance.
Across the region, in retail (48% of the market), the primary clients of mutual funds and other investments remain affluent and high-net-worth individuals. In Spanish-speaking LatAm, Pillar II pensions could be a very relevant product for the middle class, particularly with their voluntary offering, as these investors have less access to attractive investment options. However, the economics of offering these products are not attractive to the average AFP/Afore agent, and banks tend to push term deposits as a means to fund credit growth.

20
The institutional segment (52% of the market) is mostly comprised of AFPs/Afores (Pillar II pensions), which invest directly in listed investment options, although the market is beginning to open up to institutional mandates. Pension funds hold 64% of AuM, with open funds (EAPC) continuing to gain share.
Investments are mostly concentrated in money market and fixed income products, particularly in Mexico and Chile, where they represent around 80% of the market (this is mostly due to historically high interest rates and limited financial education). In Chile, AFPs account for about 75% of AuM and in Mexico, approximately 55% of AuM.
The investment mix across the region is expected to slowly shift towards the more sophisticated end of the spectrum. There are already high growth rates in private equity, asset-backed securities, exchange-traded derivatives and development capital certificates in Mexico, with its large Pillar II pension business that limits investments to publicly traded vehicles and assets.
Bank-related players still dominate the LatAm market, although new business models are beginning to compete, particularly in Brazil. Independent players are gaining space, resulting in competition both for assets and talent.
21
III. Seven growth trends and the implications for asset managersThe “global asset management industry,” as stated earlier in this paper, is a shorthand for describing a collection of regional markets. Actionable insights on growth clearly exist at the more granular level. However, we can point to a number of global trends that are reshaping growth in asset management along the dimensions of regions, segments and asset classes and products. While it is difficult to predict how much these changes will impact individual regions and markets, the following trends will heavily influence global industry growth over the next three to five years.
Emerging markets win share of global AUM and profits
Over the past four years, annual AuM growth in emerging markets has outpaced developed markets, 6.4% to -0.5%. Emerging markets will continue to increase their share of global AUM and, if profitability holds, will account an ever-increasing share of global profits.
However, as noted previously, emerging markets are not immune to global forces, and picking the right market is not an obvious exercise. In addition, as competition increases from both local and outside players, investors become more sophisticated, and transparency requirements become more stringent, profit margins of over 30 bps will increasingly come under pressure. As a result, asset managers will no longer be able to rely on the strategy of simply being “present” in booming regions. Instead, they will need to adopt a targeted approach to the markets and channels in which they want to compete, strive for efficient operations that can serve a very diverse marketplace (e.g., in terms of regulation, products and distribution channels) and generate scale. In short, asset managers must build scalable and economically viable business models to succeed in emerging markets.
Equities go globalAs highlighted in the McKinsey Global Institute’s recent report, “The Emerging Equity Gap,” a rebalancing of global financial assets is underway with two profound implications for equity investing. First, several factors are reducing investor appetite for equities in developed markets: aging populations, the shift to defined contribution retirement plans, financial regulation, the shifting risk budgets of institutional investors and the lingering effects on investor psyche of weak and highly volatile equity market performance. Yet, even as developed market investors reduce their overall level of equity investments, they are shifting from domestic to non-domestic equities (e.g., to emerging and global equity products).
Second, emerging market financial assets are growing robustly and influencing the global demand for equity products. While today’s emerging market investors have historically kept most of their assets in bank deposits and fixed income, their appetite for local equity products will grow as they become more willing to put money at risk in order to achieve higher rates of return.
22
The net result of both trends is a “globalization” of equity products and managers (in a market that has been dominated by developed market players with developed market equity products). To win in markets that increasingly require emerging market and global equity product skills, developed market asset managers will need to access credible local market expertise, either by building capabilities internally or buying or partnering with local firms. They will also need to invest in local distribution capabilities and balance the trade-offs between producing the products locally or globally. Developed market players will also face the formidable challenge of counterbalancing the decline in developed market equity, currently a significant driver of profitability. Local players, on the other hand, must ensure they lead the pack in performance and product innovation, and leverage preferred distribution relationships to maintain or increase share.
Fixed income specializesTotaling €19 trillion in assets and accounting for about half of global assets, fixed income represents the largest asset class in many countries around the globe. Through the crisis, global growth for fixed income has remained strong, particularly in Continental Europe and Asia. In the U.S., retirement markets will continue to be the primary growth engine for fixed income, especially through target-date funds, which represent an increasing share of AuM and within which fixed income is capturing a greater share of the asset allocation.
Nevertheless, across markets, the benign era for fixed income (fueled by slowly declining interest rates globally) is likely over. Unexpected rising interest rates would exert considerable pressure on asset values. Conversely, the anticipated prolonged low interest rate environment, coupled with retirement trends, is magnifying the need for returns. This will drive increased demand for high-yield, credit, multi-sector and absolute return strategies. In this scenario, asset managers looking to preserve or increase market share in fixed income have two broad options: take share in large but slow-growing core categories through excellent investment performance or preferred distribution access; or invest to build or acquire capabilities in fast-growing categories. In the institutional arena, one of these categories will likely include loan products (backed by both retail and corporate loans), given the attraction of diversification into new, long-duration credit assets, and the concurrent need for banks to reduce traditional lending in light of Basel III. While institutional investors might lean toward creating these exposures directly (i.e., without using asset managers as intermediaries), the lack of in-house skills will provide an opportunity for institutional asset managers to fill the gap and capture an emerging opportunity.
ETFs enter their second actExchange-traded funds (ETFs) have grown explosively over the past 10 years, with total global assets increasing by over 30 percent annually over the last decade and reaching roughly $1.5 trillion by the end of 2011. The market could double again by as early as 2016, fueled by investor demand for cost efficient and liquid beta exposure and continued product innovation, including active ETFs (slow growth to date, but some recent headline successes by marquee fund managers,) ETF-based solutions and other new forms of ETFs.
23
However, regional markets are at very different stages of development. The maturing U.S. ETF market ($1.1 trillion in AuM) and has seen solid growth driven by deeper channel penetration (i.e., growing acceptance by formerly reluctant financial advisors) and continued product innovation, including “intelligent index” and active ETFs. Europe’s ETF sector (approximately $300 billion in assets), is in an earlier stage of development and asset growth has slowed recently, partly due to regional macroeconomic uncertainty and to unique product design challenges. Elsewhere, passive ETF markets are growing fast, but from a small base. For example the Asia-Pacific ETF market had total assets in 2011 of roughly $60 billion.
Much of the global growth for ETFs will continue to come from passive products, directly benefitting existing global ETF leaders with significant economies of scale. Beyond assessing the threat to their existing businesses, asset managers around the globe need to assess the opportunities for growth presented by ETFs, including taking a fresh look at the potential for active ETFs and for wrapping ETFs into multi-asset class products and solutions.
Alternatives go mainstreamAfter a drastic decline during the financial crisis, alternative investments across retail and institutional segments rebounded, doubling in size between 2005 and 2011, to €5 trillion in global AuM. Growth is expected to continue as alternative investments – comprised of investments in hedge funds and private equity funds, and in real estate, infrastructure and commodities, in a variety of vehicles including limited partnerships, fund of funds partnerships, and managed accounts in mutual funds, ETFs and UCITs – move into the asset management mainstream. This shift is being spurred by three trends: the adoption of alternatives by retail investors, the convergence of asset classes and investment products, and a broader movement from relative return to absolute return benchmarks. It remains to be seen how much increasing regulatory pressure will counterbalance these favourable trends.
This mainstreaming effect should drive a significant portion of industry growth over the next few years, particularly in the retail channel. In the U.S. retail market, for example, alternative investments will account for 13% of industry assets and 25% of industry revenues by 2015 (up from 7% and 14% today).
To capture some of this growth, traditional asset managers will need to plan targeted development initiatives, focusing on one or two asset classes; access credible investment capabilities (either through building, buying or partnering); refine channel strategy; and overinvest in sales and client service, particularly in education and improving risk management and reporting capabilities.
Solutions reshape the way money is managedPoor performance through the financial crisis, prolonged low interest rates and high volatility in equity markets, and pension restructuring have led many institutional investors to change how they interact with asset managers and investment consultants and adjust their thinking concerning portfolio construction. Many have sought out partnerships with asset managers that extend beyond traditional single asset class mandates and are looking for more holistic, strategic advice and support that spans across the spectrum of asset classes.
24
Investment solutions, broadly defined as products engineered to help clients address specific opportunities or needs, have quickly gained attention in the asset management industry. Three-quarters of asset managers recently surveyed by McKinsey anticipate that objective-oriented investment solutions and products will grow faster than traditional products. Survey respondents further expect institutional solutions to account for more than one-quarter of flows over the next three to five years. In line with these expectations, 85% of asset managers consider investment solutions a top-three strategic priority and are investing heavily to build these capabilities.
Investment solutions are typically implemented in one of two ways: as holistic solutions, with the asset manager partnering with the institutional investor to diagnose and address needs specific to their portfolio; or product-driven solutions, where the asset manager develops products that help address broader needs. In the latter, target-date funds are the most successful standardized solution.
Despite the clear demand for investment solutions, most asset managers are not well-positioned to offer them. To win in the space, they will need to make enhancements to their investment management function (e.g., create a “Solutions CIO” role to work across the organization), retool their distribution teams (e.g., give distribution teams the skills to move from product-led conversations to needs-based conversations), and embed technology as a core component in the investment decision-making process.
Retail is down in Europe, but not outThe retail sector has traditionally been a major source of profitability, accounting for example, for 70% of asset management industry profits in Europe. Of late, however, retail has been under significant stress. Globally, the share of personal financial assets in mutual funds has fallen from 16% in 2004 to 12% in 2010, with net outflows continuing in 2011. Europe has been particularly hard hit, with retail profits (in both absolute values and basis points) approximately 40% lower than in 2007. By 2015, the European retail market will have contracted further – with profits declining to €4 billion to €5 billion, roughly half what they were in 2007.
The cause of this precipitous decline, at least in Europe, is the dramatic retreat by banks (the primary distribution channel in Continental Europe) from the sale of mutual funds as a result of regulatory changes, a push for deposit products, and reputational concerns. In addition, the opening up of the distribution landscape is intensifying the pressure on captive asset managers: in Western Europe, five players with independent brands captured over 60% of flows in 2011.
On the brighter side, global personal financial assets have fully recovered from the financial crisis and are expected to reach €29 trillion by 2015, an increase of over 20% from 2011. This represents a significant opportunity for asset managers who can adapt to an environment buffeted by continuing capital market volatility and regulations, and with no mandatory long-term savings/pension scheme on the horizon.
To regain share in the growth of personal financial assets, European asset managers need to rapidly adjust their business model by upgrading their distribution approach (including direct distribution), establishing a retail brand and positioning themselves as providers of savings solutions.
* * *

25
Despite a volatile and uncertain macro-economic environment in 2011, the asset management industry continued to outperform other financial services sectors. Viewed over the past few years, however, the asset management industry as a whole does not present a picture of robust health. Globally, industry assets are growing at a slower pace than total financial assets, net flows remain anemic and profits have declined substantially. By a number of measures, the current post-crisis recovery compares unfavorably to the previous market cycle.
Restoring profitable growth is the most pressing priority for the industry. But therein lies the challenge: a more granular perspective reveals there are opportunities for growth, but they are highly concentrated and require more targeted investment. The great challenge for asset managers in the coming years will be to make informed, granular choices about where to grow by geography, by client segment and by product or solution. Most importantly, players will need to move beyond analyzing the opportunities to selecting a few trends to exploit and investing firmly behind those choices. To date, few firms have acted with this level of conviction, but it is an imperative for those that hope to thrive in the coming years. Overall, the environment will tougher, with fewer players enjoying the growth rates and profitability of past years. Some players are likely to disappear altogether. Winning firms will be those that understand the granularity of growth in asset management, and make the changes necessary to meet the challenge.
Pierre-Ignace BernardSalim RamjiMarkus SchachnerNancy SzmolyanKurt MacAlpine
The authors would like to acknowledge the contributions of McKinsey's financial institutions practices globally in building this report. Our special thanks go to partners Maria Novales-Flamarique and Raj Kamal, and to the working team: Manu Balakrishnan, Paul Feldman, Owen Jones, Etienne Mayor, Raksha Pant, Francesca Rizzi, Achim Schlitter and Manit Seth.
26
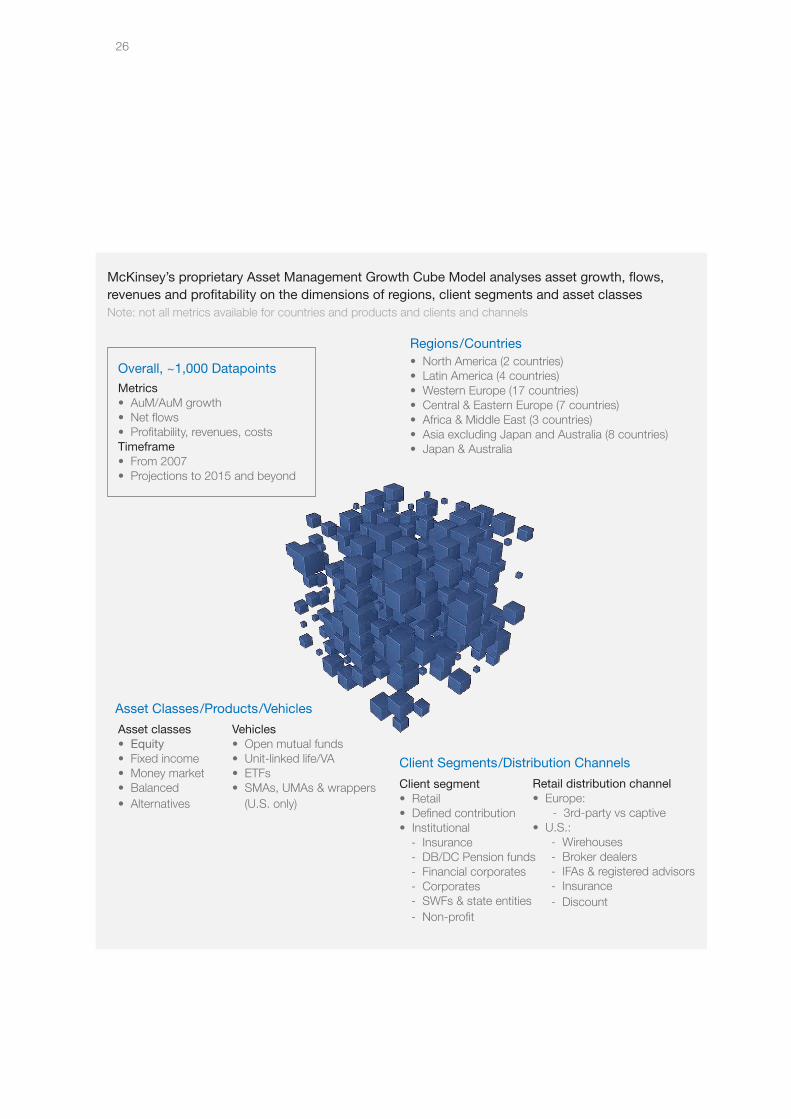
• North America (2 countries)• Latin America (4 countries)• Western Europe (17 countries)• Central & Eastern Europe (7 countries)• Africa & Middle East (3 countries)• Asia excluding Japan and Australia (8 countries)• Japan & Australia
Metrics• AuM/AuM growth• Net flows• Profitability, revenues, costsTimeframe• From 2007• Projections to 2015 and beyond
Asset classes• Equity• Fixed income• Money market• Balanced• Alternatives
Vehicles• Open mutual funds• Unit-linked life/VA• ETFs• SMAs, UMAs & wrappers
(U.S. only)
Client segment• Retail• Defined contribution• Institutional - Insurance - DB/DC Pension funds - Financial corporates - Corporates - SWFs & state entities - Non-profit
McKinsey’s proprietary Asset Management Growth Cube Model analyses asset growth, flows, revenues and profitability on the dimensions of regions, client segments and asset classes
Client Segments/Distribution Channels
Regions/Countries
Asset Classes/Products/Vehicles
Overall, ~1,000 Datapoints
Retail distribution channel• Euro pe: - 3rd-party vs captive• U.S.: - Wirehouses - Broker dealers - IFAs & registered advisors - Insurance - Discount
Note: not all metrics available for countries and products and clients and channels

27
About McKinsey’s annual global asset management surveyMcKinsey’s annual global asset management survey offers participating players a unique benchmarking view of their operating performance, and a valuable foundation for assessing their global market strategy. It is the largest and most comprehensive survey of its kind, tracking more than 2,000 business metrics for over 300 firms from the U.S., Europe, Asia and Latin America, accounting for €19 trillion in AuM – over 70% of actively managed assets globally and over 60% of total global assets – for each of the past 13 years. We are grateful for the continued participation of all subscribing firms.
A Premium subscription combines a customized benchmarking effort with a comprehensive view on global markets. Peer group benchmarking is tailored to subscriber requirements based on an extensive dataset, which ensures critical mass in a variety of sub-segments and covers the full spectrum of operating revenues and costs. Customized benchmarking results and highlights of McKinsey global market analysis will be presented to individual subscribing firms by senior McKinsey experts during a workshop, allowing for targeted discussion about how to improve your top-line and bottom-line performance.

28
Europe
Pierre-Ignace BernardT: +33 (1) 4069 [email protected]
Massimo GiordanoT: +39 (02) [email protected]
Andres Hoyos-GomezT: +33 (1) 4069 [email protected]
Sebastien LacroixT : + +33 (1) 4069 [email protected]
Martin HuberT: +49 (221) 208 [email protected]
Philipp KochT: +49 (40) [email protected] LucchinettiT: +39 (02) [email protected]
Matteo PaccaT: +33 (1) 4069 [email protected]
Charles RoxburghT: +44 (20) 7961 7597 [email protected]
Markus SchachnerT: +43 (1) [email protected]
Gregor TheisenT: +49 (69) 7162 [email protected]
Radboud VlaarT: +31 (20) 551 [email protected]
North America
Pooneh BaghaiT: +1 (416) 313 [email protected]
About McKinsey & Company
McKinsey & Company is a management consulting firm that helps many of the world’s leading corporations and organizations address their strategic challenges, from reorganizing for long-term growth to improving business performance and maximizing profitability. For more than 80 years, the firm’s primary objective has been to serve as an organization’s most trusted external advisor on critical issues facing senior management. With consultants in more than 40 countries around the globe, McKinsey advises clients on strategic, operational, organizational and technological issues.
McKinsey’s regional asset management practices serve asset managers, wealth management companies and retirement players globally on issues of strategy, organization, operations and business performance.
Our partners and consultants have deep expertise in all facets of asset management in every region of the globe. Our proprietary research spans all regions, institutional and retail segments, asset classes (e.g., alternatives) and products (e.g., ETFs, outcome-oriented funds). Our proprietary tools provide deep insights into the flows, assets and economics of each of the sub-segments of these markets and into the preferences and behaviors of consumers, investors and intermediaries.
To learn more about McKinsey & Company’s specialized expertise and capabilities related to the asset management industry, or for additional information about this report, please contact:

29
Geraldine BuckinghamT: +1 (212) [email protected]
Céline Dufétel T: +1 (212) [email protected]
Kweilin EllingrudT: +1 (612) [email protected]
Onur ErzanT: +1 (212) 446 [email protected]
Sacha GhaiT: +1 (416) [email protected]
Aly JeddyT: +1 (212) [email protected]
Salim RamjiT: +1 (212) 446 [email protected]
Nancy SzmolyanT: +1 (212) [email protected]
Giambattista TaglioniT: +1 (212) [email protected]
Jill ZuckerT: +1 (212) [email protected] Asia-Pacific
Nigel AndradeT: +61 (2) 8273 [email protected]
Further insights
McKinsey publishes frequently on issues of interest to industry executives. Our recent reports include:
“The mainstreaming of alternatives: Fueling the next wave of growth in asset management,” June 2012
“Check or checkmate: Game-changing strategies for the asset management industry,” June 2012
“Retail customers: The great misunderstanding,” December 2011
“The emerging equity gap: Growth and stability in the new investor landscape,” December 2011 (The McKinsey Global Institute)
“The second act begins for ETFs: A disruptive investment vehicle view for center stage in asset management,” August 2011
Stephan BinderT: +86 (21) 6122 [email protected]
Tab BowersT: +81 (3) 5562 [email protected]
Keiko HondaT: +81 (3) 5562 [email protected]
Raj KamalT: +91 (22) 6630 [email protected]
Luca MartiniT : +61 (2) 8273 [email protected]
Joseph Luc NgaiT: +852 2846 [email protected]
Naveen TahilyaniT: +91 (22) 6630 [email protected]
Latin America
Rogerio MascarenhasT: +55 (11) 5189-1531E : [email protected]
Maria Novales-FlamariqueT: +52 (55) 5351 [email protected]
Middle East
Laurent NordinT: +971 (4) 312 [email protected]
Hans-Martin StockmeierT: +971 (4) 312 [email protected]

McKinsey Asset ManagementJune 2012Designed by Visual Media EuropeCopyright © McKinsey & Company