Embed Size (px)
Citation preview

1
The Geology of Shale Gas
Prof. Dr. Stefan M. Luthi
KNAW Mini-Symposium on Shale Gas, June 12, 2013

2
Shale
A fine-grained sedimentary rock consisting of clay, silt and sand
Gas
Usually referring to natural gas consisting primarily of methane (CH4)
Shale Gas
Natural gas (and light liquids) contained in shale
Def
init
ion
s
Organic-rich shale, Grube Messel, Germany
3
Th
e C
arb
on
Cyc
le
The carbon cycle is at the basis of the
formation of organic-rich rocks. They have essentially “escaped”
from the organic cycle (arrow at lower right)
Scientific American

4
Plankton is Main Source of Oil and Gas
Phytoplankton includes diatoms (right). They contain a silica skeleton
and may reach 1 mm in diameter. Other phytoplankton organisms have a carbonate skeleton or none at all.
Zooplankton includes planktonic
foraminifera, radiolaria, and planktonic crustacea.
Phytoplankton is about 10× more
abundant than zooplankton and 100-1000× more abundant than fish.
Land plants are an important
source of natural gas.

5
The Organic Matter Engine
Oxygen in water, in ppk
This figure shows oxygen concentrations in a schematic cross-section from the ocean to the continental rise, shelf edge and shelf. The open
ocean waters are generally rich in oxygen due to circulation and exchange with the atmosphere. Upwelling of nutrient-rich water leads to
high organic productivity in the photic zone on the shelf, but lack of circulation and organic decay may produce anoxic bottom waters there.
Hunt (1995)

6
Preservation of Organic Matter
Access to air (oxygen) rapidly - at geological time scales - oxidizes organic matter and converts it into CO2 and H2O. Fine-grained rocks
such as shales are often deposited in oxygen-poor or anoxic environments. They are also better at keeping air out.
The total carbon content in the Earth’s crust is 9·1019 kg. The hydro-
and biosphere contain less than 10-5 of this. Over 80% of this is inorganic and in carbonate rocks. Organic carbon amounts to 1.2·1019
kg and is distributed approximately as follows:
Dispersed in sedimentary rocks ~97.0 % Coal and peat 0.13 % Oil and gas in non-reservoir rocks 2.0 % Oil and gas in reservoirs 0.01%
“Reservoir”: Permeable and porous rock Sources: Hunt, Tissot and Welte

7
Ker
ogen
Typ
es &
Matu
rati
on
Sapropelic kerogen (algae)
Lipid-rich kerogen (phyto- and zooplankton)
Humic kerogen (land plants)
“Van Krevelen diagram” TAI, VR are maturation indicators
After Tissot & Welte (1984)

8
The Oil and Gas Generation Windows
Organic matter converts with increasing burial depth, first to kerogen, then to oil and
finally to gas. The figure on the right shows the peak
depths for both.
Gas generation diminishes at temperatures above ~180°C
Hunt (1995)
9
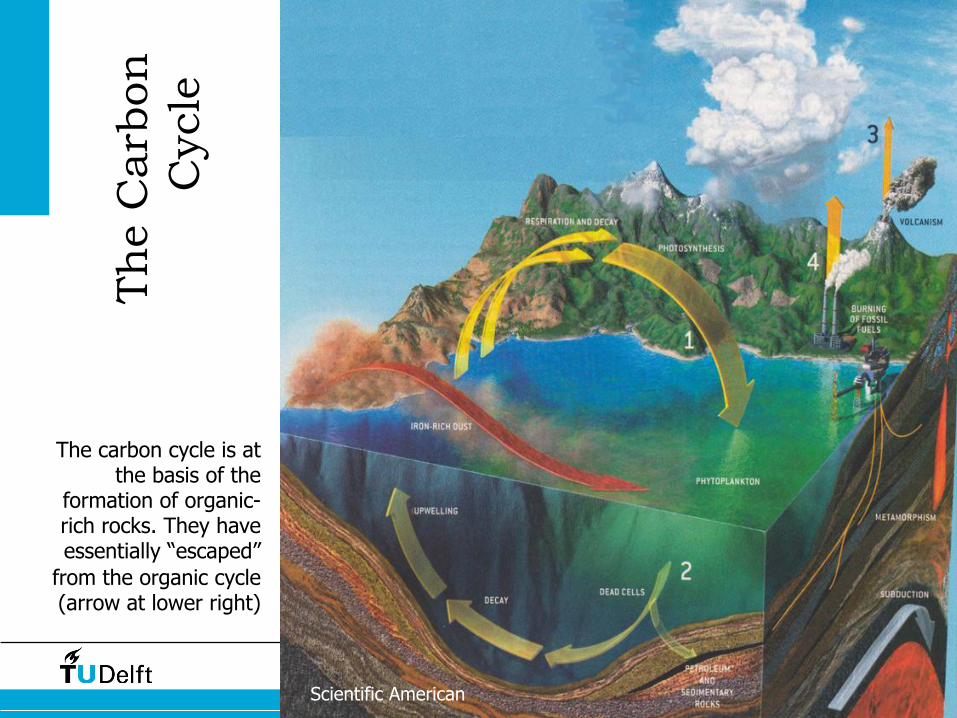
Source Rocks for Oil and Gas
Usually finer-grained sediments such as shales with Total Organic Carbon
(TOC) contents above ~1% but sometimes as high as 20% (weight
percent)
A fine-grained carbonate rock of Jurassic age containing abundant organic matter; width 2
mm.
Well Saddam-8, Chia Gara, central Iraq.
With permission of the INOC (Central Region)

10
Source Rocks for Oil and Gas
Wang et al., 2009
A ESEM close-up of a sample of the Barnett Shale. In the center a kerogen particle with pores. There can be free gas in the pores or adsorbed gas on the organic material. Furthermore the clays show interparticle porosity in which free gas may occur too.

11
A Well-Known Shale Gas Play

12
A Well-Known Shale Gas Play
100 km

13
Hor
izon
tal W
ell Tra
ject
ory
an
d C
omple
tion

14
The World Shale Gas Map
1 Tcf = 1012 cubic feet = 28.3×10⁹ m3
Groningen: ~100 Tcf World Natural Gas Consumption per Year*: 120 Tcf
World Proved Natural Gas Reserves*: 6,839 Tcf
World Unproved Natural Gas Reserves**: 8,842 Tcf Technically Recoverable Shale Gas Resources*: 7,201 Tcf
Total*: 22,822 Tcf
* EIA 2013 ** USGS 2012

15
The World Shale Gas Map
Figures only for countries with >40 Tcf except for NL; 26 Tcf is also ~ EBN/TNO assessment

16
Shale Gas in the NL
Van Adrichem-Boogaert & Kouwe, 1995
EIA/ARI 2013
Green: Oil Yellow: Wet Gas
Posidonia
Epen
Greverik

17
Stellingen
• “"Wat er ook in Nederland gebeurd, de winning van schaliegas wereldwijd zal doorgaan, afhankelijk van de lokale gasprijzen”
• "Als China schaliegas in plaats van steenkool wint is dit goed voor de CO2 uitstoot”
• "Bijna alle schaliegaslagen bevatten ook grote hoeveelheden olie en condensaten”
• "Het is opmerkelijk dat de winning van schalieolie op veel minder weerstand stuit dan die van schaliegas"
18
Food for Thought
“In 2012 the Dutch government made about 14 billion € from the Groningen gas
fields. Without these revenues, the Netherlands' deficit would be similar to that of
crisis-struck Cyprus (6.3%).”
BBC Online News, May 19, 2013.
“Om bij het schaliegas te komen, moet door deze watervoerende lagen heen
worden geboord. Deze lagen staan vaak met elkaar in verbinding.”
Lieve Declercq, directievoorzitter van Vitens in Trouw, 12 april 2013
“Zeker is…dat de petroleumrijke schalielagen het mondiale energielandschap
drastisch gaan veranderen”
TECHNO! 1/2013