Embed Size (px)
Citation preview

PAPER REF # 8010 Proceedings: Eighth International Space Syntax Symposium Edited by M. Greene, J. Reyes and A. Castro. Santiago de Chile: PUC, 2012.
8010:1
THE GENERATIVE OFFICE BUILDING
AUTHOR: Kerstin SAILER The Bartlett School of Graduate Studies, University College London, United Kingdom e‐mail: [email protected] Ros POMEROY Spacelab, London, United Kingdom e‐mail: [email protected] Aabid RAHEEM Spacelab, London, United Kingdom e‐mail: [email protected] Andrew BUDGEN Spacelab, London, United Kingdom e‐mail: [email protected] Nathan LONSDALE Spacelab, London, United Kingdom e‐mail: [email protected]
KEYWORDS: Office, Workplace, Space Usage, Generative Building, Benchmark
THEME: Building Morphology and Usage
Abstract
The Space Syntax concept of the generative and conservative building describes the effect of spatial configuration on knowledge creation: a building that acts generatively allows new relationships, new ideas, new products and new knowledge to emerge by maximising random encounters between people. In contrast, a building that acts conservatively preserves and mirrors existing relationships, existing ideas and existing knowledge by reinforcing a specific interface between people. A key criterion for the generativity of a building was proposed to be an integrative layout.
However, evidence of patterns of encounter, movement flows and organisational behaviour suggests that not every building with high levels of integration is automatically generative of new knowledge. What is more, looking at a spatial layout it is difficult to judge whether the level of integration is rather high or low given size and structure of the space (e.g. number of floors, size of floor plate). Therefore the question of what constitutes a generative office building remains unanswered.
Using a large sample of 62 different organisations and their office spaces, this paper therefore aims to create a better understanding of what renders an office building generative or conservative, by expanding on the original theory of generativity and including a more detailed articulation of the spatial qualities that are influential.
For the analysis, results of a VGA of each of the office buildings in the sample are compared, investigating not only overall levels of integration, but also the distribution of integration and the relationship between integration levels and structural features. This allows the construction of a benchmark of possible ranges of integration for office buildings. It is further investigated which of the buildings are deemed generative by the

Proceedings: Eighth International Space Syntax Symposium Santiago de Chile: PUC, 2012.
8010:2
inhabitants and how this relates to various spatial characteristics. The paper finally proposes a variety of different factors that may have a bearing on the generativity of an office building. This list of factors combines suggestions from the original theory of generative and conservative buildings with additional syntactical, spatial and organisational aspects of space usage.
The paper concludes that the generativity of an office space depends on several factors and features, including but not limited to integration and syntactical measures that can be analysed on the basis of a floor plan. Implications for theory and workplace consultancy practice are discussed and reflected on.
1. INTRODUCTION
Hillier and Hanson (1984) have described buildings as social objects, and have thus laid the foundation for
the exploration of the social life of different types of buildings. What buildings do to those using them, and
how they create affordances for specific social dynamics and organisational behaviours has been of
particular interest in workplaces.
The debate about how the design and spatial layout of offices may have an impact on the output and
performance of an organisation reaches back to the 1970s and 1980s (Becker, 1981; Steele, 1973), and is still
on‐going. It seems that the relationship between organisational performance and the design of the
workplace environment is not easily established. While some contributions are able to show a convincing
link between spatial structure, behaviours in the workplace and organisational output (Toker & Gray, 2008),
others admit there is only modest support for the claim that the physical environment influences
organisational performance (Kampschroer & Heerwagen, 2005; Kampschroer, Heerwagen, & Powell, 2007;
Price, 2007). This means that from a theoretical point of view there is still a lot to be understood about the
functioning of space in office buildings, and how configuration and design can support an organisation in its
goals.
At the same time, this is one of the most pertinent questions in the professional practice of workplace
consultancy. Often clients want to know how an office building can assist them in achieving their
organisational goals, or whether the office they occupy is right for them.
Driven by both theoretical and practical interests, this paper aims to address this question of social and
organisational performance of office buildings. It will draw on the simple and intriguing idea by Hillier and
Penn (1991) that buildings can act in generative or conservative ways, and will explore features and
characteristics of offices that contribute to their generativity. The argument will unfold in three consecutive
steps: firstly, the theory of generative and conservative buildings will be described to summarise existing
knowledge. Secondly, a large sample of 62 different office buildings will be introduced and analysed
according to configurational characteristics in search of a clear pattern of generativity, testing the original
assumption of an integrative layout as the key feature of generativity. Thirdly, an in‐depth exploration of
several case studies will open up the discussion on additional building features with an influence on
generativity. The paper will conclude with a list of factors that may have a bearing on generativity, and
reflections on the relevance of this research for professional workplace consultancy.
Proceedings: Eighth International Space Syntax Symposium Santiago de Chile: PUC, 2012.
8010:3
2. THE THEORY OF GENERATIVE AND CONSERVATIVE BUILDINGS
The idea that buildings can act generatively or conservatively was first discussed in the paper ‘Visible
Colleges’ by Hillier and Penn (1991) and later elaborated in Hillier’s ‘Space is the Machine’ (Hillier, 1996).
Apart from notable exceptions (Penn, Desyllas, & Vaughan, 1999; Rohloff, 2009; Sailer, 2010; Tzortzi, 2007a,
2007b) the concept has not been one of the key concerns of the analysis of complex buildings. This chapter
shall therefore outline and trace the theory of generativity to form the foundation for the further
elaboration in this paper.
Referring to the Levi‐Straussian concept of mechanical and statistical models, Hillier and Penn set out to
investigate the relationship between spatial and social structures. A mechanical model of social solidarity
according to Levi‐Strauss (1963) would mean following predetermined rules, for example in marriage laws,
whereas a statistical model implied the overall lack of rules and therefore a statistical outcome of who could
marry whom with certain matches being more likely than others.
Hillier and Penn related mechanical and statistical models to what they called ‘long and short models’, a
concept derived from a simulation of the spatial arrangement of cells, as described in ‘The Social Logic of
Space’ (Hillier & Hanson, 1984). In this simulation cells were grouped and arranged to form an aggregation,
and thus a spatial form. If rules to arrange the cells were predominantly local this was called a p‐model
based on local phenotypes; an example would be the rule that each cells needs an entrance, and therefore
an empty plot next to them. G‐models in contrast were centred on global genotypical relations, for instance
the rule that longer lines of sight were preferable. A short model was then defined as a model with
predominantly p‐model rules, i.e. local rules, or in the words of Hillier and Hanson a “short g‐model in
relation to the number of p‐models in the system” (Hillier & Hanson, 1984, p. 217). With few rules in total
and a randomisation in the arrangements and relationships, morphogenesis can occur, i.e. something new is
created based on a probabilistic structure. Thus short models represent a Levi‐Straussian statistical model.
On the other hand, a long model was defined as a model following predominantly g‐model rules, i.e. global
rules. With a variety of different rules in place, it tends to conserve. No morphogenesis happens, since the
outcome reflects the rule itself in a deterministic structure. Therefore, long models relate to the mechanical
models of Levi‐Strauss.
Despite its origin in a spatial experiment of cell aggregation, the idea of long and short models was mainly
used to describe social relationships and the interface between people, or the so called strong or weak
programme of an organisation. Programme was defined as the spatial dimension of an organisation and
therefore the construction of interfaces between different types of users. A classic example for a strong
programme would be a court with regulated movement flows and predetermined patterns of who should be
able to meet whom where; in contrast a classic example of a weak programme building would be the
editorial floor of a newspaper with bee‐hive like activities and an all‐play‐all interface.
The spatial implications of a weak programme, or in other words, the concept of morphogenesis in a short
model is of interest here. The idea of randomisation and morphogenesis was elaborated with the theory of
the generative and conservative building. Hillier and Penn (1991) argued that spatial structure could either
generate or conserve social forms. A building that acts generatively would allow new relationships, new
ideas, new products and new knowledge to emerge by spatial proximity and movement, thus maximising
random encounters between people. In contrast, a building that acts conservatively would preserve and
mirror existing relationships, existing ideas and existing knowledge by spatial distance and by reinforcing a
specific interface between people.

Proceedings: Eighth International Space Syntax Symposium Santiago de Chile: PUC, 2012.
8010:4
Since proximity implies a generative mode and distance a conservative mode, it could be argued that the
key measurement in Space Syntax, i.e. spatial integration, is a criterion for generativity, since it depicts
overall closeness and centrality.
The fact that integration is a crucial factor for a generative building is confirmed by Hiller and Penn.
Although the authors were not very specific about the factors and features of a building that render it
generative, some aspects were mentioned in the discussion of a short model space: “Theoretically it can be
said that the editorial floor is a short‐model setup; and through its integrating layout, its density of
movement, and its structuring of the by‐product of movement, it is generating new encounter patterns –
that is, it is acting morphogenetically at the level of social encounter. (…) The function of space is to be
creative by facilitating and extending the network of unprogrammed encounters necessary to the efficient
running of a newspaper. Space in this sense is generative.” (Hillier & Penn, 1991, p. 35)
While an integrative layout can therefore clearly be seen as a factor in rendering a building generative, it
certainly is not the only one, especially since there is no automatism: not every highly integrated building is
automatically a generative building. This is for the same reason that space is not prescriptive. Rather than
strictly determining social forms and relationships, space acts as a “field of probabilistic co‐presence and
encounter” (Hillier, Burdett, Peponis, & Penn, 1987, p. 248). Space creates potential, and proximity for
instance can increase the probability for interaction, yet it does not guarantee interaction. If for instance
two colleagues in an office do not like each other, they will not interact very frequently; or, on a larger scale,
a traditional and conservative organisation with strict codes of conduct and a strong organisational culture
will not automatically become innovative and creative just by moving into an integrated building.
This raises three main questions: firstly, how integrated is integrated, or in other words, is a given office
space rather integrated or rather segregated relative to its size and structural features? This can give the
first hints of the potential for a generative office building. Secondly, are high levels of integration always
good, or in other words, under what circumstances does an integrated space contribute to the generativity
of an organisation? Is there a specific configurational profile of the generative building? And thirdly, which
other building features apart from overall spatial integration can render a building generative? This paper
sets out to investigate and reflect on these questions with the aim of offering a more refined set of factors
that may contribute to a generative office building.
3. METHODOLOGY AND SAMPLE
A large sample of 62 different office buildings taken from the professional design and consultancy practice
of Spacelab is analysed for the purposes of this paper. The offices are all located in the UK, and are inhabited
by organisations from both the private and public sectors across a variety of industries, including media,
publishing, advertising, public relations, communications, legal advice, civil service, charity and research. The
buildings in the sample are not always complete buildings. Some of them are just one floor, or part of a floor
of a larger office building that is inhabited by several organisations. In these cases the boundaries of which
spaces to include into the analysis were drawn in accordance to the organisational boundaries, so in essence
each building in the sample depicts the office spaces available to a single organisation. In cases where an
organisation inhabits more than one building, they were listed as separate cases (see table 1).
A Visibility Graph Analysis (VGA) (Turner, Doxa, O'Sullivan, & Penn, 2001) using the software Depthmap
(Turner, 2010) was completed for each building, and the resulting data was then compared according to a

Proceedings: Eighth International Space Syntax Symposium Santiago de Chile: PUC, 2012.
8010:5
variety of metrics, including the size of the building, the number of floors occupied, average mean depth
values, and relative distribution of depth in so called integration profiles. This methodology was first
developed by Sailer (2010) in her PhD on the ‘Space‐Organisation Relationship’. For this analysis of the
distribution of depth, all mean depth values of the VGA of all offices were collected. Then the maximum and
minimum values were determined, all values were then divided into a number of equal ranges1 and then
plotted office by office showing the percentage of spaces of one office falling into each range. Thus a
distinctive depth profile is created showing the character of the building in comparison to other offices in
the sample. The aim of this analysis was to develop a benchmark of differently sized and shaped offices to
understand the ranges and distribution of integration values for several categories of office structures
(single floor, multiple floors, etc.) in order to answer the question whether a given office space was well
integrated or not.
To relate these configurational aspects to social life in buildings and specifically generativity, a categorisation
is needed to determine whether a building acted generatively or conservatively. Since generativity, as
defined by Hillier and Penn, is a rather broad concept describing the emergence of a whole variety of
novelty and innovation, the definition was narrowed for the purposes of this paper to include only the
affordance for random encounter as a criterion for generativity. It could be argued that the remaining
aspects of generativity, i.e. the creation of new ideas, new products or new knowledge all rely on the
creation of new relationships and hence random encounters. For 13 of the cases detailed empirical data
such as staff satisfaction questionnaires, observation of movement flows and behaviours, social network
analysis, focus group discussions and in‐depth interviews with staff and management was available, hence
an evidence‐based judgement was made whether the buildings afforded random encounters or not. For 2
more cases, systematically collected feedback from clients collected through a client satisfaction survey by
Spacelab architects was available, thus giving insights into the generativity of those offices. For a further 13
cases oral and anecdotal feedback from clients was available distinguishing generative and conservative
offices. This means in total 28 categorisations on generativity could be made, resulting in 11 conservative
and 17 generative offices in the sample.
To enrich the quantitative perspective of the benchmark, several consultancy projects of Spacelab architects
are drawn upon as in‐depth case studies. For each of these projects a broad mix of methods and techniques
was used to analyse organisational and spatial structures. The methods included interviews with
Management, satisfaction questionnaires with all staff, interaction questionnaires with all staff and Social
Network Analysis (Wasserman & Faust, 1994), Space Syntax analysis (mainly visibility graphs and isovists), as
well as on‐site observations of movement flows and activities.
4. INTEGRATION OF OFFICE LAYOUTS AND THEIR GENERATIVE POTENTIAL
Exploring the generative building necessarily means analysing the levels of integration or segregation of
spatial layouts, since integration is mentioned as key factor of generativity by Hillier and Penn. This paper
therefore investigates the levels of Mean Depth of visibility in offices. It also uses the comparative analysis
of depth profiles to enrich the discussion.
1 For the comparative analysis of all offices 50 different ranges were used. While Depthmap originally uses 16 different (colour) ranges and this was deemed appropriate for the following steps of analysis, where only subsamples were compared to each other (e.g. only single floor offices), 16 ranges in the analysis of all offices would have resulted in too extreme distributions (for instance small offices completely in the lowest range). Using 50 ranges means that the areas of each office are distributed over at least nine ranges.

Proceedings: Eighth International Space Syntax Symposium Santiago de Chile: PUC, 2012.
8010:6
Mean Depth is used in this paper as a key measurement instead of the more commonly used integration for
a variety of reasons: firstly, due to the criticism of the normalisation and relativisation procedures of
integration (Livesey & Donegan, 2003; Teklenburg, Timmermans, & Wagenberg, 1993) and its empirical tests
with specifically urban systems, the integration measurement was deemed problematic for office buildings,
which arguably have very different structures and properties (for more details see: Sailer 2010). Secondly, as
Sailer (2010) continues to argue, visual mean depth is a meaningful measure in its own right without the
need to consider size effects, because it clearly depicts awareness and thus the potential for interaction: a
small open‐plan office with everyone accommodated in one room has similar affordances as a large open‐
plan office with everyone in one room. Likewise, these two systems would show similar values of average
visual mean depth. Thirdly, mean depth is easier to grasp than the more abstract measurement of
integration, for instance an average mean depth of six means that all other areas are visible within six steps
on average. Still for ease of understanding the terminology ‘integrated’ or ‘segregated’ will be used in this
paper to describe low or high levels of depth.
The following analysis of integration and segregation in offices will proceed in four consecutive steps: first of
all, the sample will be introduced with basic descriptions and statistics regarding office area, number of
floors and average Mean Depth (MD). Secondly, the proposition of Hillier and Penn that an integrated layout
implies generativity will be tested. Thirdly, what makes a building integrated will be explored by looking at
structural features of buildings like office area and numbers of floors. Finally, integration profiles and their
characteristics will be examined to find out whether additional features can be associated with generativity.
4.1 Description of office sample
Table 1 below lists all 62 different offices that were analysed in this paper including information on the
industry2 of the organisation, the occupied office area (in square metres), the number of floors occupied, the
average area per floor (in square metres), average Mean Depth for the whole office configuration, the
categorisation of generativity, the diversity of the integration profile and the height of the maximum peak in
the profile. Diversity measures the diversity of distribution and was calculated as the ratio of number of
ranges filled divided by the number of all ranges in the analysis of all offices using 50 bins. The maximum
peak was measured as the highest proportion of depth values falling into a single range of depth (from the
comparative analysis of all offices using 50 bins). Cases are ordered by area starting with the smallest office.
No Industry Area
[sqm]
# Floors Av Area / Floor [sqm] Av MD GEN or CON Diversity Max. Peak
1 public sector 118 1 118 1.739 0.18 0.44
2 public sector 125 1 125 2.041 0.22 0.32
3 public sector 219 1 219 2.066 0.20 0.48
4 public sector 241 1 241 2.514 0.26 0.26
5 media 245 1 245 2.145 0.22 0.30
6 public sector 263 1 263 2.053 0.24 0.53
7 public sector 306 1 306 2.112 0.26 0.40
8 public sector 311 1 311 2.454 0.22 0.25
9 public sector 311 1 311 3.249 0.28 0.25
10 administration 316 1 316 2.257 generative 0.24 0.36
11 public sector 333 1 333 3.778 0.26 0.27
12 administration 361 1 361 1.456 generative 0.18 0.44
2 Those were simplified into four broad categories: media, advertising, administration and public sector.

Proceedings: Eighth International Space Syntax Symposium Santiago de Chile: PUC, 2012.
8010:7
13 public sector 361 1 361 2.006 0.20 0.50
14 media 386 1 386 2.232 generative 0.26 0.38
15 public sector 393 1 393 2.391 0.28 0.36
16 advertising 402 1 402 1.493 generative 0.18 0.51
17 public sector 411 1 411 2.781 generative 0.32 0.25
18 public sector 431 2 216 3.614 0.24 0.37
19 public sector 434 1 434 2.902 0.34 0.29
20 advertising 464 4 116 4.594 0.34 0.23
21 administration 468 1 468 2.346 generative 0.22 0.38
22 administration 493 2 247 4.537 conservative 0.20 0.31
23 public sector 532 3 177 4.859 0.28 0.34
24 public sector 718 1 718 4.629 0.34 0.16
25 media 798 1 798 3.653 conservative 0.30 0.45
26 media 808 1 808 3.167 0.32 0.22
27 advertising 863 4 216 6.196 conservative 0.38 0.17
28 administration 954 1 954 2.829 0.22 0.25
29 administration 960 1 960 3.174 generative 0.24 0.28
30 media 965 2 483 3.218 generative 0.42 0.35
31 public sector 1033 2 517 6.639 0.44 0.13
32 advertising 1072 1 1072 2.586 0.32 0.33
33 advertising 1206 1 1206 2.485 generative 0.26 0.27
34 media 1236 2 618 4.756 0.32 0.37
35 advertising 1246 1 1246 2.815 0.30 0.21
36 administration 1255 6 209 5.618 conservative 0.32 0.52
37 advertising 1274 5 255 5.175 generative 0.42 0.19
38 media 1481 3 494 3.496 generative 0.30 0.20
39 advertising 1554 4 389 3.845 generative 0.32 0.28
40 media 1645 2 823 7.352 conservative 0.50 0.17
41 media 1693 3 564 6.601 conservative 0.44 0.20
42 media 1719 4 430 4.404 conservative 0.32 0.52
43 administration 1724 3 575 5.660 generative 0.34 0.29
44 public sector 1768 2 884 7.265 0.32 0.30
45 administration 1809 2 905 2.431 generative 0.26 0.36
46 media 1810 2 905 3.109 0.34 0.33
47 public sector 1899 3 633 5.289 0.36 0.16
48 administration 1962 3 654 5.978 conservative 0.50 0.17
49 advertising 2150 1 2150 3.719 generative 0.40 0.32
50 advertising 2205 2 1103 3.133 generative 0.34 0.29
51 media 2355 6 393 6.547 0.54 0.14
52 media 3973 1 3973 2.536 0.32 0.29
53 media 3987 3 1329 5.308 0.38 0.27
54 media 4122 6 687 7.385 0.46 0.26
55 media 4315 4 1079 6.114 0.42 0.16
56 advertising 4877 4 1219 5.475 generative 0.34 0.24
57 public sector 5043 6 841 6.922 conservative 0.58 0.15
58 advertising 6130 7 876 4.639 conservative 0.44 0.18
59 advertising 7547 5 1509 6.189 0.38 0.32
60 public sector 7826 7 1118 7.363 0.66 0.11
61 media 8669 3 2890 5.334 conservative 0.52 0.20
62 advertising 8700 2 4350 3.876 0.32 0.22
Table 1: List of all 62 different offices analysed
The sample ranges from offices arranged on a single floor to those spread across a maximum of seven floors
(cases 58 and 60) with a majority of cases on one floor (47%), followed by two floors (18%), three floors

Proceedings: Eighth International Space Syntax Symposium Santiago de Chile: PUC, 2012.
8010:8
(13%), five floors or more (13%), and four floors (9%). It includes very small offices with only a couple of
hundred square metres (case 1 with 118sqm is the smallest), but also very large offices up to several
thousand square metres (case 62 with 8700sqm is the largest). Figure 1 shows the distribution of office area
across the sample. The average area per floor also varies significantly: while some cases have very small
floor plates – for instance case 20 is arranged across four floors with an average size of just above a hundred
square metres – other cases have very large floor plates – case 62 is not only the biggest office in the
sample, but also has the largest floor plate with more than four thousand square metres of office area per
floor.
Figure 1: Distribution of office area of the cases, ordered from smallest to largest
The levels of integration found in the sample include very low levels of average Mean Depth (roughly 1.5
steps of visibility are needed on average in cases 12 and 16 to cover the whole area of around 400 square
metres in both cases), but also high depth levels for the larger offices with more storeys (for instance in
cases 40, 54 and 60 around 7.4 steps of depth are required on average).
4.2 Relationship between integration and generativity
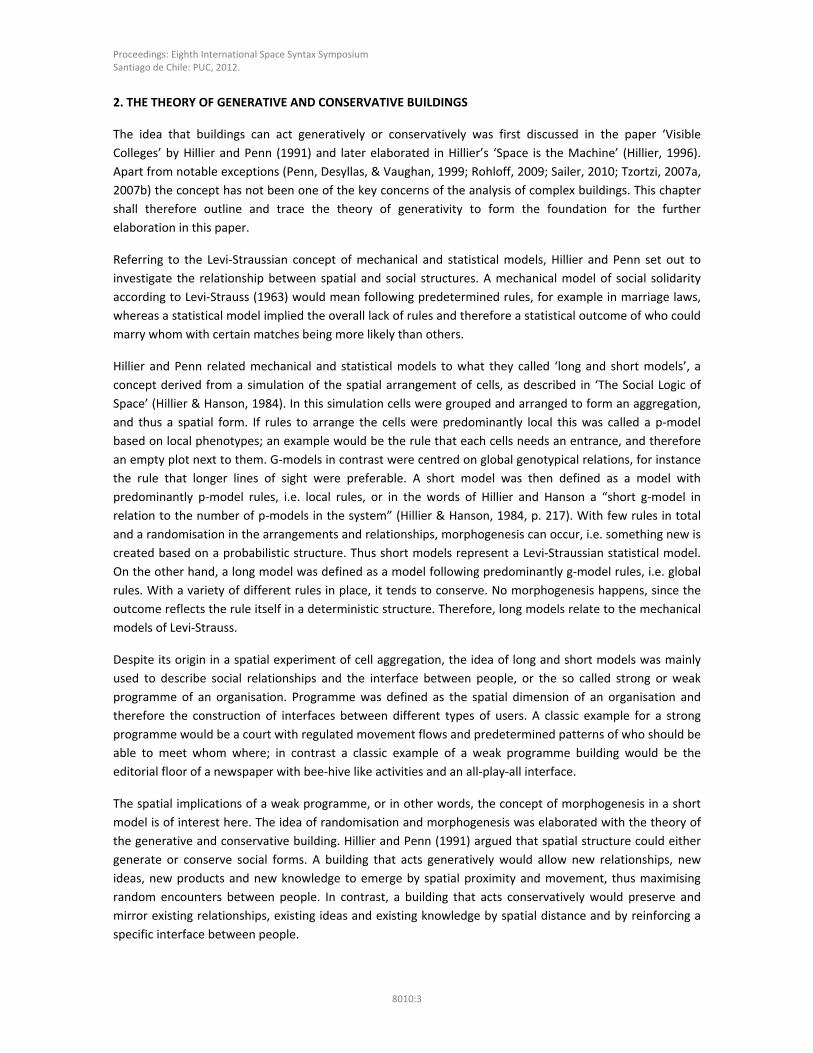
In order to test the proposition made by Hillier and Penn that well integrated buildings imply generativity, a
t‐Test assuming unequal variances of average values of Mean Depth for the two groups of conservative
offices (n=11) and generative offices (n=17) was performed. A clear relationship emerges (see figure 2):
conservative offices have a higher average mean depth (5.567) than generative ones (3.199) and the
differences are highly significant (p<0.0001*). This means that the assumption of Hillier and Penn that an
integrative layout is a key feature of generativity can be confirmed.
Proceedings: Eighth International Space Syntax Symposium Santiago de Chile: PUC, 2012.
8010:9
Figure 2: Result of the t‐Test assuming unequal variances of average Mean Depth for generative and conservative offices.
4.3 What determines integration levels?
Which configurational features determine levels of integration has been investigated in great detail using
abstract principles (Hillier, 1996). However, this paper sets out to explore the gain of depth using the
concrete examples in the benchmark to further elaborate on what makes existing buildings integrated or
segregated.
The gain of depth in the office layouts in the sample seems to be governed by structural features more than
by size of the workplace. Certainly office area plays an important role for the overall configuration, and large
offices tend to create higher levels of Mean Depth, however, smaller offices produce a wide range of
average Mean Depth. The correlation between the two factors, i.e. office area and average Mean Depth
results in a correlation of R2=0.260 only (p<0.0001*). What is more, office area is mostly defined by the size
of an organisation, i.e. the number of people to be accommodated in the workplace and therefore can be
considered a given factor beyond scope for intervention by the organisation. In contrast, the number of
floors of an office clearly determines average Mean Depth, as can be seen in figure 3. An analysis of variance
(ANOVA) results in a highly significant R2=0.662 (p<0.0001*). This means that a higher number of floors
creates increasing levels of depth.

Proceedings: Eighth International Space Syntax Symposium Santiago de Chile: PUC, 2012.
8010:10
Figure 3: Analysis of variance between number of floors and resulting average Mean Depth of the configuration
4.4 Additional features associated with generativity
The basic analysis shows how structural features, such as the numbers of floors, produce different levels of
integration and therefore different potentials for the emergence of generativity. However, a variety of other
aspects come into play as the following investigation of integration profiles will demonstrate.
Figure 4a shows the integration profiles of all 62 offices from the overall comparative analysis (using 50
ranges) in a stacked area chart; the same data is shown in a 3D view with single profiles in figure 4b.
It can be observed in figure 4a that across all cases integrated spaces with a low average Mean Depth are
predominant (ranges 3 and 7 out of 50 show the highest count), whereas only very few spaces are
segregated. This is probably due to the fact that the majority of cases in the sample are organisations in the
media and advertising industries with large open‐plan office layouts that do not tend to accumulate a lot of
depth. Higher levels of depth mostly occur in larger and multi‐storey buildings, or in examples with a higher
ratio of enclosed office space. Case 60 with its seven floors and a mixture of enclosed and open‐plan office
space, occupied by a public sector organisation is the only one with spaces in the last five ranges of highest
depth.

Proceedings: Eighth International Space Syntax Symposium Santiago de Chile: PUC, 2012.
8010:11
Figure 4a: Integration profiles of all 62 offices if all cases are compared to each other; profiles are stacked to show the accumulated
percentage of Mean Depth of all cases across the 50 ranges.
Figure 4b: Integration profiles of all 62 offices if all cases are compared to each other in 3D view; profiles are ordered by office area
with the smallest in front.
Proceedings: Eighth International Space Syntax Symposium Santiago de Chile: PUC, 2012.
8010:12
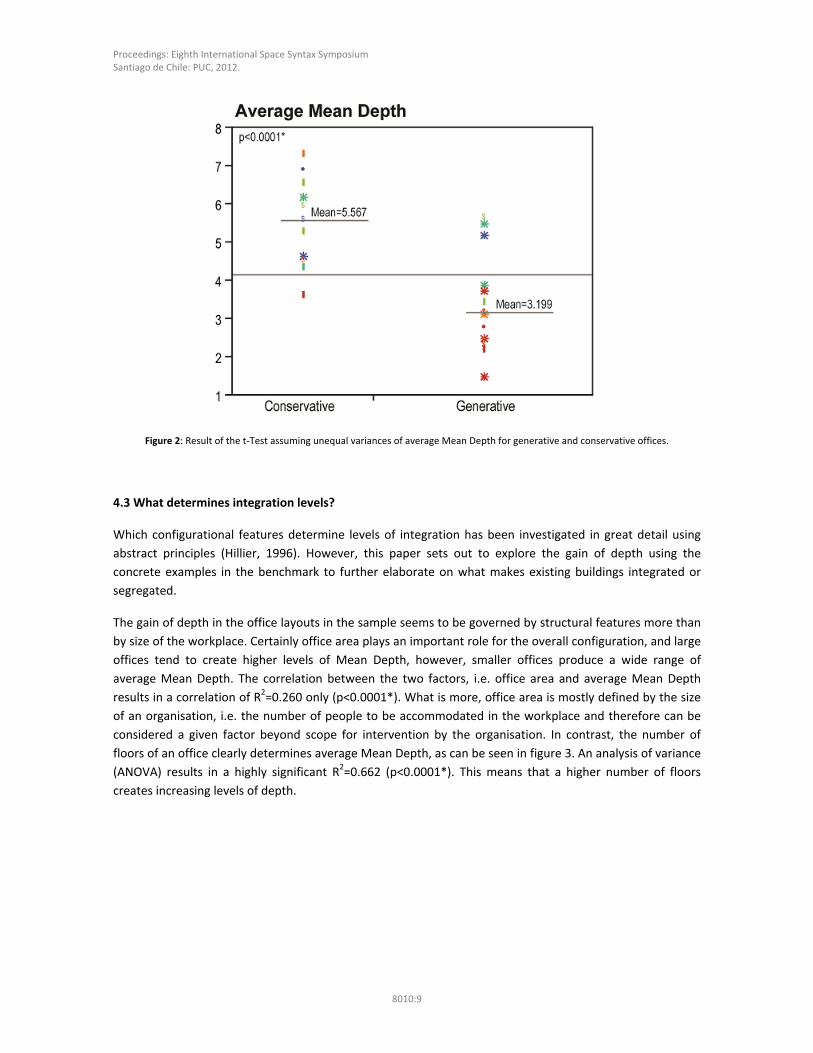
Some of these aspects become even clearer by investigating smaller sub‐samples that display similar
structural properties, for instance the number of floors, as this was confirmed as crucial feature influencing
Mean Depth. Therefore, figures 5a‐e show the comparative analysis for offices on one floor (5a), two floors
(5b), three floors (5c), four floors (5d) and five or more floors (5e) using the Depthmap standard of 16
ranges. This makes it much easier to see relevant differences between profiles.
Figure 5a‐e: Integration profiles of offices on a single floor (a), two floors (b), three floors (c), four floors (d) and five floors or more (e).
Confirming the importance of open versus enclosed office space, case 24 for instance (figure 5a) presents
itself as an office with a profile that accumulates relatively high levels of depth, certainly more than other
single‐floor cases. This is due to a workplace layout with exclusively cellular offices along an L‐shaped
corridor, which creates relatively high levels of depth compared to other more open layouts. The same goes
for case 31 (figure 5b), which has a profile shifted to the higher depth ranges due to a high degree of
5a 5b
5c 5d
5e

Proceedings: Eighth International Space Syntax Symposium Santiago de Chile: PUC, 2012.
8010:13
enclosed offices along several corridors. So in essence a higher proportion of enclosed office space creates
depth.
Other cases with comparatively high levels of depth include cases 48 and 61 (figure 5c) and case 40 (figure
5b); what unites them is a layout with multiple wings and only narrow connections. Cases 44 (figure 5b), 41
(figure 5c), 27 (figure 5d) and 54 (figure 5e) have in common an enclosed staircase far away from
workstations, which seems to create higher levels of depth. And cases 55 (figure 5d) and 60 (figure 5e) both
have multiple and enclosed staircases connecting the floors, which again seems to accumulate depth.
To summarise, various configurational features including the number of floors, the proportion of enclosed
office space and the structure of horizontal connections (wings) as well as vertical ones (staircases) seem to
shape the degree of integration or segregation of a space. Although office area was found to be significantly
correlated with average Mean Depth, it seems to play a minor role in governing the gain of depth compared
with these other factors.
So far, average Mean Depth has been established as the main criterion for generativity, and various aspects
have been explored that contribute to the creation of depth. The final step of analysis shall now investigate
which other features can be associated with generativity and whether generative offices have a different
integration profile than conservative ones. Two measurements of the integration profile, i.e. the diversity of
the profile and the maximum height of the peak in the profile are therefore tested for their variances, and
results are shown in figures 6a and b.
Figure 6a‐b: Results of the t‐Tests assuming unequal variances between Diversity of Integration Profile (left) and Maximum Height of
Integration Peak (right) for generative and conservative offices.
The relationship between generativity and the diversity of the integration profile is less pronounced
(p<0.0113*) than average Mean Depth (see figure 2 again), but still significant, since conservative offices
tend to have a higher diversity (mean=0.409) than generative ones (mean=0.296). This may seem
counterintuitive at first, since a diverse workplace environment is often praised as necessary for and
conducive to knowledge‐intensive work patterns, where communication and concentration both need to be
accommodated (Meusburger, 2009; Sailer, 2011). However, recalling the definition of generativity as the
creation of new and random contacts it does make sense to think of generative spaces as integrated spaces3
3 For the same reason, average Mean Depth and diversity of the integration profile correlate quite well (R
2=0.641, p<0.0001*), so in
essence an integrated office has low diversity and as such is generative.

Proceedings: Eighth International Space Syntax Symposium Santiago de Chile: PUC, 2012.
8010:14
and not as a diverse range of integrated as well as segregated areas. Hence a low to moderate diversity of
the integration profile can be seen as an affordance for generativity, while high levels of diversity are rather
characteristic of conservative buildings, even though diversity and the segregation that comes with it may be
appropriate to accommodate concentrated working tasks.
The maximum height of the peak in an integration profile in contrast does not make a difference to
generativity, since no significant differences (p<0.4090) can be found between conservative and generative
offices.
Lastly, the shapes of the integration profiles of generative and conservative offices are compared to
investigate whether any striking differences can be seen. Figure 7 shows the profiles of all eleven
conservative and seventeen generative offices.
Figure 7: Integration profiles of conservative and generative offices; the shapes are taken from the analysis of all offices in the sample
using 50 different mean depth ranges.
There seems to be no single typical generative profile, nor is there a typical conservative profile. However,
some trends can be observed that distinguish conservative from generative profiles. As might be expected,

Proceedings: Eighth International Space Syntax Symposium Santiago de Chile: PUC, 2012.
8010:15
generative profiles tend to be positively skewed, i.e. the integrated ranges to the left of each profile are
filled up to a higher degree and peaks tend to be in the more integrated ranges. For instance, cases 22
(conservative) and 10 (generative) have very similar shapes, yet case 10 is shifted to the left towards more
integrated ranges. What is more striking is that the generative offices almost all show a steep rise at the first
peak, which also tends to be the highest. The profile of the generative case 43, for example, although shifted
to the deeper right hand side has its highest peak at the left hand side. In contrast, the conservative offices
either have a slow rise (cases 40, 41, 57) or tend to have the highest peak towards higher levels of depth
(cases 25, 36).
Even though certain features of the generative and conservative profile groups tend to be more
pronounced, it does not seem possible to predict generativity just by looking at the shape of the profile,
since there is such diversity within the two categories.
4.5 Summary
In summary, generative offices are more integrated on average, have a lower diversity of integration ranges
and tend to have a profile, which peaks in the lower depth regions. Conservative offices are more
segregated, more distributed across various ranges of depth and show peaks rather towards the middle of
the integration profile. This means that investigating average mean depth of an office as well as looking at
its integration profile in a comparative manner allows a first and quick assessment of the likelihood of this
office to function in a generative way, at least to a degree. Still there seem to be a multiplicity of other
phenomena involved in generativity and the configurations affording it, since considerable variances within
the categories of generative and conservative offices exist. This means a more in‐depth analysis is needed,
which will be undertaken in the following chapter.
5. GENERATIVE AND CONSERVATIVE OFFICE BUILDINGS – IN‐DEPTH EXPLORATIONS
By bringing more qualitative data to bear and thus exploring a few cases more in‐depth, this chapter aims to
uncover more features, aspects and characteristics that contribute to the generative or conservative mode
of an office building.
5.1 Opportunities for Generativity within a Conservative Building: The Office of a Law Firm
The six floor building (5 storeys plus basement) occupied by a firm of solicitors (Case 36) is an example of a
predominantly conservative workspace. All seven legal teams were co‐located on their own floor or in some
cases half of a floor. As an assistant solicitor in the firm commented, “currently our legal departments are
acting as separate firms; the building perpetuates this and it would be nice if the building could facilitate
more openness between teams”. The average mean depth of the building is relatively high (MD=5.618),
which is partly due to the desire of the occupants to create cellular work spaces (55% of NIA is cellular
compared with 7% open plan), but also to the multiple floors and the separateness of both stairwells. This in
itself might suggest a conservative space, but it is worth examining the factors implicated in how the space
performs in this way in more detail.
The three main spikes of the integration profile (figure 8b) are associated with spaces that have different
uses. The main, deepest spike is workspace – both cellular and open plan. Corridor spaces make up the
middle spike and the least deep spike is the main stairwell and the ground floor reception area. It can be
argued that the less integrated narrow corridors do not afford a high level of movement, since people move

Proceedings: Eighth International Space Syntax Symposium Santiago de Chile: PUC, 2012.
8010:16
up and down the building via the stairwell or lift without traversing or gaining any visibility of other floors
along the way. Even though corridors are adjacent to all workspace, the opportunity for casual enrolment of
people at their desks, or recruitment, as it has been termed (Backhouse & Drew, 1992), is similarly restricted
due to the overall lack of movement combined with the majority of space being partitioned from the
walkways and on many occasions completely shut off as cellular office occupants shut their doors.
Figure 8a‐b: VGA (left) and integration profile (right) of case 36

Proceedings: Eighth International Space Syntax Symposium Santiago de Chile: PUC, 2012.
8010:17
So far, the way in which the high mean depth spaces act to create a conservative building is apparent.
However the role of the small amount of more integrated space is also worth considering further. The lifts
and main stairs did provide some opportunity for random encounter as people came and went to and from
the building. The most integrated space, that is the reception area, was observed to be the one place where
people did occasionally pause to chat, and evidence from a social network survey carried out amongst the
occupants showed that the reception staff were the most well known within the firm suggesting that the
area did act as some kind of hub. However, this was an area also shared with external visitors and thus any
conversations which would by their nature be confidential, were likely to be constrained. In an attempt to
counteract this problem, the firm had provided a communal kitchen and lounge area for staff located in the
basement. This proved to be one of the more segregated parts of the building and occupancy observations
showed that it was only occupied 55% of the time and by an average of 1.9 people (1.6% of total
inhabitants). Possibly, this might have acted as a generative space within an otherwise conservative building,
had it been located in a more integrated location within the building. It is therefore possible to contend that
both generative and conservative elements can co‐exist and that a high mean depth building can in fact
create a degree of generativity that the headline mean depth data might not indicate and would only
become apparent by reference to the integration profile, the VGA, and additional evidence.
5.2 Integrated, Yet Conservative: The Office of a Business‐to‐Business Media Corporation
The office of a large media corporation (case 61) was chosen to illustrate that not every integrated building
automatically implies generativity. Due to a central open staircase connecting the ground with the first floor
(figure 9a), the building is relatively well integrated given its size and structure (see figure 4c again). With an
average MD of 5.334 and a size of almost 8700sqm it outperforms 14 smaller offices in the sample regarding
depth levels. The integration profile (figure 9b) therefore has its centre in the reasonably well integrated4
areas. Staff of the media corporation was moved into this space after having been accommodated in six
separate buildings all over London.
4 The profile was taken from the comparative analysis of the whole benchmark; therefore the colours in the integration profile are less red, orange and yellow than the VGA, which was rendered on its own without reference to other buildings.

Proceedings: Eighth International Space Syntax Symposium Santiago de Chile: PUC, 2012.
8010:18
Figure 9a‐b: VGA (left) and integration profile (right) of case 61
As a result of the move, the intensity of interaction increased slightly among staff (for a more detailed
description see: Sailer 2010), however from qualitative data it becomes clear that this was not due to an
increase of random encounters, but rather the ease of arranging meetings with already known
collaborators. Members of staff commented on this: “It is great to have all the departments under one roof.
My relationship with the magazines for which I produce conferences has been greatly improved.” But even
more so, this seemed crucial for senior management. In particular they praised “the speed of adhoc
communication”, the “ease of accessibility of senior staff”, the “opportunity of interaction with different
parts of the business”, and “the closeness of brands and ease to communicate with stakeholders”. At the
same time staff complained that the space felt soulless and too anonymous (also see: Sailer & Penn, 2010):
“If you walk around the office you would never know where you are unless you already know people. This
doesn't enable people to make new friends or contacts, which I imagine was part of the point of the move.”
Therefore it can be argued that the office mostly acted in a conservative way by reinforcing already existing
relationships instead of allowing new contacts to be generated. This means that levels of integration and the
overall configuration should have contributed to a generative office space, yet the lack of identity and
branding in the design of the space inhibited this and created a rather anonymous space, where random
encounter was not fostered.
5.3 One Generative, One Conservative Building: The Offices of an Advertising Agency
The case of a London‐based advertising agency occupying two different buildings adjacent to each other,
one generative and one conservative can shed more light onto generative and conservative building
features. The main building of the agency (case 37) was considered generative; it has open workspaces on
the top three floors and a variety of diverse spaces for concentrated and collaborative work on the ground
and lower ground floor. The second building (case 27), needed due to growth of the organisation, provides
additional workspaces and meeting rooms on two full and two maisonette floors.

Proceedings: Eighth International Space Syntax Symposium Santiago de Chile: PUC, 2012.
8010:19
Figure 10a‐b: VGA (left) and integration profile (right) of cases 27 (conservative) and 37 (generative)
This office was seen as less attractive as well as inhibiting for the collaborative and engaging working culture
of the organisation and therefore judged conservative. Comments by staff and senior management included
“It is an odd space that looks good on paper, but it feels forced and too regimented”. Not only is office 27
more segregated on average (MD=6.196) than office 37 (MD=5.175), its main peaks of depth are also shifted
to the more segregated areas, as figure 10b illustrates. However, some more striking differences between
the two buildings can be found upon closer exploration of the configurational features of the spaces. The

Proceedings: Eighth International Space Syntax Symposium Santiago de Chile: PUC, 2012.
8010:20
main workspaces in office 37 are highly visible from the point of entry to the floor plates, i.e. the staircases,
as the series of isovists in figure 11b show. In contrast, the majority of workspaces in office 27 remain
hidden from the vertical circulation, as the isovists in figure 11a show. Local visibility could be argued to
increase the awareness for organisational life as well as individual people, and as such the potential for new
relationships to emerge. Likewise, everyday routes of movement through office 37 pass alongside
workstations, thus creating real opportunities for encounter and recruitment, while routes of movement
through office 27 are more distant from workspaces.
Figure 11a‐b: Isovists of offices 27 and 37 from the main point of entry to each floor.

Proceedings: Eighth International Space Syntax Symposium Santiago de Chile: PUC, 2012.
8010:21
This means that local visibility and the structuring of everyday movement flows can be considered crucial
additional factors to the levels of overall integration in rendering an office space generative.
6. CONCLUSION: FACTORS AND BUILDING FEATURES OF GENERATIVITY
This paper has aimed at articulating Hillier’s and Penn’s theory of the generative and conservative building
using workplace environments as an example, and thus contributing to the discourse on spatial
configuration and organisational performance. It has worked with a novel approach to analyse the
comparative integration profiles of buildings. This seems a fruitful endeavour and adds a valuable
perspective to the exploration of the potential of workplace structures beyond average integration values. It
seems to ‘create phenomena’ (Hacking, 1983), i.e. a different way of looking at data that reveals new
insights.
The paper has discussed a variety of spatial features that make an office building generative. To summarise
the discussion of the preceding two chapters, it can be confirmed that high levels of global integration
contribute to the generativity of an office space, as proposed by Hillier and Penn (1991). However, this is not
the only spatial feature that is associated with generativity. It was shown that generative offices tend to be
less varied in their distribution of mean depth and tend to have a peak in the lower depth regions, i.e. a
large proportion of rather integrated spaces. Even though analysing integration values and distribution
profiles can give a good first hint towards the potential of generativity, its realisation is more complex and
thus cannot simply be predicted by quantitative figures5.
It was argued that other factors come into play, for instance the levels of local visibility from the circulation
routes and the structuring of everyday movement (case 27 and 37), the placement of attractors in
integrated areas (case 36), or the overall design and intimacy of a workplace (case 61).
The following list in figure 12 with factors contributing to generativity therefore consolidates the findings
from this paper. This should not be seen as a conclusive list, but rather as a first attempt to further articulate
the theory and understanding of the generative office building.
5 In fact testing the predictive power of the integration profile and average Mean Depth figures would make for interesting future research.

Proceedings: Eighth International Space Syntax Symposium Santiago de Chile: PUC, 2012.
8010:22
Figure 12: List of features of generative offices
Limitations of the research conducted in this paper include the lack of proper data on organisational output
and performance. Therefore, generativity could only be established based on client feedback and
behavioural data. Furthermore, this was only partially gathered systematically, and was partially of a rather
anecdotal nature.
Future research could therefore collect more systematic evidence on organisational output to enhance the
understanding of the relationship between performance, generativity and behaviours in the workplace.
Also, the features of generativity listed in figure 12 were not rigorously tested in all cases and doing so could
shed further light on the phenomenon of generativity. For instance, it could be hypothesised that certain
building features are essential for generativity (for instance high levels of global integration), whereas other
features may act as supporting or sufficient factors (for instance everyday routes next to workspaces). A
hierarchy of generative features similar to Maslow’s hierarchy of needs (Maslow, 1943) could be the
outcome, where certain conditions need to be met first before other more complex features come into play.
Alternatively, a dichotomy of features could be the outcome, where certain building characteristics could be
shown to positively drive generativity or negatively inhibit it, in analogy to Herzberg’s motivation – hygiene
factors (Herzberg, 1966; Herzberg, Mausner, & Snyderman, 1959).
Another aspect worth testing includes the question of whether a deep or shallow integration core (Hillier &
Hanson, 1984) contributes to generativity. The relationship between intelligibility of a building and
generativity would be an interesting future piece of research. Also, the relationship between layout, average
Mean Depth and shape of the integration profile could be explored more intensively, for instance regarding
the structure and place of vertical connections, the impact of open‐plan versus enclosed office organisation,
Proceedings: Eighth International Space Syntax Symposium Santiago de Chile: PUC, 2012.
8010:23
the degree of convexity, and the amount and positions of partitions based on the partitioning theory and
the related four principles governing depth gain, i.e. centrality, contiguity, extension and linearity (Hillier,
1996). Last but not least, future research could also look at other approaches to the categorisation and
comparison of built forms, such as Steadman’s work on the archetypal building and architectural
morphospace (Steadman, 1998; Steadman & Mitchell, 2010), or from a more syntactic point of view,
Shpuza’s contribution to the analysis of integration as a function of the shape of floor plates (Shpuza, 2006),
and incorporate some of their methods and measurements where appropriate.
While this paper has certainly raised interesting questions regarding the theoretical understanding of spatial
structure in buildings in relation to their usage, it may also be of relevance to the practice of Workplace
Consultancy. The combination of various forms of comparative spatial analysis (overall integration values,
distribution of integration and depth profiles, visual shape of profile) provides ample opportunities for a
profound and evidence‐based workplace consultancy service. For instance, a company wanting to move
could be consulted on the potential generativity of various buildings they might consider. Additionally, the
information about how their current building performs in comparison to other offices from organisations in
the same industry could be equally invaluable for clients.
It is hoped that this approach will not only increase the awareness for generative layouts in architecture,
design, workplace consultancy and management practices, but also form a starting point for a renewed and
intensified debate on the features of generativity within office buildings and beyond.
7. REFERENCES
Backhouse, A., & Drew, P. (1992). The design implications of social interaction in a workplace setting,.
Environment and Planning B: Planning and Design, 19, 573‐584.
Becker, F. (1981). Work Space: Creating Environments in Organizations. New York: Praeger Publishers Inc.
Hacking, I. (1983). Representing and intervening: introductory topics in the philosophy of natural science.
Cambridge: Cambridge University Press.
Herzberg, F. (1966). Work and the nature of man. Cleveland, Ohio: The World Publishing Company.
Herzberg, F., Mausner, B., & Snyderman, B. B. (1959). The motivation to work. New York: Wiley.
Hillier, B. (1996). Space is the machine. A configurational theory of architecture. Cambridge. Online at:
http://eprints.ucl.ac.uk/3881/: Cambridge University Press.
Hillier, B., Burdett, R., Peponis, J., & Penn, A. (1987). Creating life: Or, does architecture determine anything?
Architecture and Behaviour, 3(3), 233‐250.
Hillier, B., & Hanson, J. (1984). The social logic of space. Cambridge: Cambridge University Press.
Hillier, B., & Penn, A. (1991). Visible Colleges: Structure and Randomness in the Place of Discovery. Science in
Context, 4(1), 23‐49.
Kampschroer, K., & Heerwagen, J. (2005). The strategic workplace: development and evaluation. Building
Research and Information, 33(4), 326‐337.

Proceedings: Eighth International Space Syntax Symposium Santiago de Chile: PUC, 2012.
8010:24
Kampschroer, K., Heerwagen, J., & Powell, K. (2007). Creating and Testing Workplace Strategy. California
Management Review, 49(2), 119‐137.
Levi‐Strauss, C. (1963). Structural Anthropology (Vol. 1). New York City: Basic Books.
Livesey, G. E., & Donegan, A. (2003). Addressing Normalisation in the Pursuit of Comparable Integration.
Paper presented at the 4th International Space Syntax Symposium, London.
Maslow, A. H. (1943). A theory of motivation. Psychological Review, 50(4), 370‐396.
Meusburger, P. (2009). Milieus of Creativity: The Role of Places, Environments, and Spatial Contexts. In P.
Meusburger, J. Funke & E. Wunder (Eds.), Milieus of Creativity ‐ An Interdisciplinary Approach to Spatiality of
Creativity (pp. 97‐153). Heidelberg/Berlin: Springer.
Penn, A., Desyllas, J., & Vaughan, L. (1999). The space of innovation: interaction and communication in the
work environment. Environment and Planning B: Planning and Design, 26(2), 193‐218.
Price, I. (2007). Lean Assets: New Language for New Workplaces. California Management Review, 49(2), 102‐
118.
Rohloff, I. K. (2009). Museum Gallery Layouts and their Interactions with Exhibition Narratives and Space Use
Patterns: An Investigation of the YCBA, the MoMA and the HMA Galleries. PhD, University of Michigan.
Sailer, K. (2010). The space‐organisation relationship. On the shape of the relationship between spatial
configuration and collective organisational behaviours. Doctoral Dissertation PhD, Technical University,
Dresden. Retrieved from http://nbn‐resolving.de/urn:nbn:de:bsz:14‐qucosa‐38427
Sailer, K. (2011). Creativity as social and spatial process. Facilities, 29(1/2), 6‐18.
Sailer, K., & Penn, A. (2010). Towards an Architectural Theory of Space and Organisations: Cognitive,
Affective and Conative Relations in Workplaces. Paper presented at the 2nd Workshop on Architecture and
Social Architecture, EIASM, Brussels.
Shpuza, E. (2006). Floorplate Shapes and Office Layouts: A Model of the Effect of Floorplate Shape on
Circulation Integration. PhD PhD, Georgia Institute of Technology, Diss., Atlanta.
Steadman, P. J. (1998). Sketch for an archetypal building. Environment and Planning B: Planning and Design,
25th anniversary issue, 92‐105.
Steadman, P. J., & Mitchell, L. J. (2010). Architectural morphospace: mapping worlds of built forms.
Environment and Planning B: Planning and Design, 37, 197‐220.
Steele, F. I. (1973). Physical Settings and Organization Development. Reading, Mass.: Addison‐Wesley.
Teklenburg, J. A. F., Timmermans, H. J. P., & Wagenberg, A. v. (1993). Space syntax : standardised integration
measures and some simulations. Environment and Planning B: Planning and Design, 20(3), 347‐357.
Toker, U., & Gray, D. O. (2008). Innovation spaces: Workspace planning and innovation in U.S. university
research centers. Research Policy, 37, 309‐329.

Proceedings: Eighth International Space Syntax Symposium Santiago de Chile: PUC, 2012.
8010:25
Turner, A. (2010). UCL Depthmap: Spatial Network Analysis Software (Version 10.10.16b). London:
University College London, VR Centre of the Built Environment.
Turner, A., Doxa, M., O'Sullivan, D., & Penn, A. (2001). From isovists to visibility graphs: a methodology for
the analysis of architectural space. Environment and Planning B: Planning and Design, 28(1), 103‐121.
Tzortzi, K. (2007a). The interaction between building layout and display layout in museums. PhD, University
College London, London.
Tzortzi, K. (2007b, 12‐15 June 2007). Museum Building Design and Exhibition Layout: Patterns of Interaction.
Paper presented at the 6th International Space Syntax Symposium, Istanbul.
Wasserman, S., & Faust, K. (1994). Social network analysis: methods and applications. Cambridge:
Cambridge University Press.