Embed Size (px)
Citation preview

The General Motors Ignition Switch Incident Viewed Through a Proposed Economic Impact Severity Index
Ian J. Shepherd
Abilene Christian University
Phil Vardiman Abilene Christian University
Management’s response to any disaster has historically been based on hindsight. Little work has been done to offer tools by which a company can examine possible decisions in light of compounding factors that can cause disasters to spiral out of control. This paper will review the General Motors (GM) Cobalt Key disaster and apply a proposed methodology for review as the disaster unfolds. Rather than hindsight, the proposed decision matrix will identify for future companies proactive decision points which are key to changing the economic outcomes of each company. GM will be examined for strategic decision errors leading to their current situation and its final outcome. INTRODUCTION
A contemporary part of business and organizational life is the ever-present possibility of an economic and marketing disaster such as the one found at General Motors (GM). Disaster for this motor company could come in the form of enormous recall and repair costs, a tainted image, negative press, and enormous product liability costs. Disaster could also come from the collapse of a strategic alliance (a supplier error) and unfavorable court ruling, or an un-envisioned surprise causing long term damage to both company finances and company image.
In anticipation of a disaster, organizations of all types should have disaster prevention plans in place. Should these measures fail, a disaster recovery plan would address the resulting damage. What is currently missing from this discussion, in the context of economic and marketing disasters, is a mechanism for assessing the level of damage to which redemptive / recovery efforts can respond prior to events worsening.
This paper will review the GM Cobalt key disaster and apply a proposed methodology for review as the disaster unfolds. Rather than relying solely on hindsight, the proposed decision matrix will identify for future companies proactive decision points which are key to changing the economic outcomes of each company. GM will be examined for strategic decision errors leading to their current situation and its final outcome. SIGNIFICANCE OF THIS PROJECT
Traditionally, disaster management within companies tends to focus on four areas which include:
36 Journal of Management Policy and Practice Vol. 17(1) 2016

A. Mitigation – activities taken prior to an event that will lessen the probability or effect of the incident.
B. Preparedness – efforts taken to enhance the response capabilities of an organization in order to handle the resulting problems.
C. Response – the activities that occur during an event to improve the outcome through a well-developed plan that will activate needed resources within the disaster response system.
D. Recovery – includes the short-term and / or long-term measures to bring the system back to normal operation.
This paper will examine these four current disaster steps that are standard within corporations today
and expand on them using a severity index proposed in 2015 by Timmerman, Sharp, and Shepherd (Timmerman, et al., 2015) (TSS). Using the GM Cobalt Key Disaster (GM), the writer will then examine the GM disaster and extrapolate from these standard responses and the proposed TSS matrix a three-dimensional model for evaluating the severity of an economic and marketing disaster. By overlaying this matrix with this well-known situation we allow users to see the value of examining their strategic decisions in a new light and offer insight into how this new matrix can alleviate and inform current decisions.
There were a few questions raised regarding the TSS matrix and its origins: 1. The origins/antecedents for the scales themselves – the response was and still is that when
one first presents a concept (such as the Fujita Scale for tornado damage) that finding precedents is somewhat difficult.
2. Defense of the additive nature vs. multiplicative, exponential, etc., nature of the scales. The position remains that changes, whether additive or multiplicative or exponential, all coincide with inflection points for the analysis, thus focusing ones attention on the impact of decisions at that inflection point.
Intuitively and pragmatically, practitioners can see how the TSS system would work. The purpose of this paper is to actually apply the TSS scales to a real application showing both the
problems of the proposed scale as well as the benefits. It is not the intention of this paper to prove why each of the TSS scale attributes is chosen. That work is contained in the original paper. THE TSS RECOMMENDED MODEL
The TSS model (Timmerman, et al., 2015) extrapolates from other existing rating systems. The TSS model proposes a three-dimensional model for evaluating the severity of a company disaster:
1. the scale of the problem, 2. the nature (impact) of the damage, and 3. the degree of culpability of the organization.
Scale (S) is important because it signifies the reach or scope of the problem and the region over
which the recovery activities must be directed. In this case, scale employs a measure using a local, regional, or pervasive rating to designate how far-reaching is the problem. The scope of a problem, whether localized or expanding into every facet of the operation, is a significant determinate of the kind and level of response required to address the damage. When a disaster is localized, its effects may be contained, minimized, and addressed with little impact on the entire enterprise and may even go unnoticed externally. At the other extreme, a pervasive disaster denotes that it has invaded a large portion of the market, society, or organization and requires significant recovery efforts.
Table 1 sets out the criteria for classification of the scale. The scale of the crisis is given a weight based on a cross reference of knowledge and effect.
Knowledge is defined as the spread of information regarding the crisis to ever-expanding areas, some controlled, and others uncontrolled.
Journal of Management Policy and Practice Vol. 17(1) 2016 37

0. None – no knowledge at all. 1. Internal or local - can be seen as those areas within the span of control of the company. These
are crisis scenarios that are contained within the culture and scope of the organization or town.
2. Market or Regional - are those areas where some control is kept over the flow of information and its spread is contained within the market. Crises in this category are contained in the market for this particular product or service.
3. Non-Market or Pervasive - represents the spread of information beyond the market into regions uncontrolled by the corporation. Crises in this category have spread outside of the market and influence perceptions in society as a whole.
Effect can be defined as the containment area for the physical problem.
0. None – no effect at all. 1. Internal / Local - indicates that the physical outcome is contained within the corporation. 2. Market / Regional - indicates that the physical outcome of the crisis is contained within the
known market area of the company. 3. Non-Market / Pervasive - indicates that the physical outcome of the crisis has moved outside
of the market area into society as a whole.
The scale is determined by selecting the category which best determines the combination of knowledge and effect. A crisis that is known only by those within the company and its effect has been contained to those within the company receives a Low – Low rating of 1 x 1 or 1. Crises where the knowledge is contained within the market and where the effect is contained within the region are assigned a multiplier of Medium – Medium or 2 X 2 or 4 for scale. Crises that are known outside of the market and in society as a whole and affect Non-Market regions physically are assigned a multiplier of high – high of 3 x 3 or 9 for scale.
TABLE 1 DIMENSIONS OF SCALE
Nature (N) is the term we use to designate both the kind of disaster and the number and type of victims of the disaster which combine to result in the degree of impact. Nature can be categorized as duration (short-term, medium-term, or long-term) and impact (low, moderate, and high).
Duration refers to the span or interval of time over which the disaster might run its course. The definition and interpretation of duration is heavily dependent on the industry or activity being reviewed.
0. None – no duration involved. 1. Short-Term – business can carry on almost as usual or the problem can be corrected and
ameliorated within a day or two with internal resources. 2. Medium-Term– problem can be addressed within a week or so with little use of outside help. 3. Long-Term - response may take a month or more, even with significant external assistance
and, in extreme cases, may result in complete business failure.
Impact refers directly to the number of victims that are affected by the disaster. 0. None – No impact involved.
None – 0 Internal / Local - 1 Market / Region - 2 Non-Market / Pervasive - 3None – 0 0 0 0 0
Internal/Local - 1 0 1 2 3Market/Regional - 2 0 2 4 6
Non-Market/Pervasive - 3 0 3 6 9
Knowledge
Effect
SCALE
38 Journal of Management Policy and Practice Vol. 17(1) 2016

1. Low impact - affects a relatively small number of customers or clients. 2. Moderate impact - affects a significant share of customers or clients. 3. High impact – affects all customers or clients and may affect additional persons outside the
usual control of the company.
Table 2 sets out the classification scale for Nature. This table compares both the duration and impact that the crisis might have on a corporation.
TABLE 2 DIMENSIONS OF NATURE
“Low impact / short term disasters” are assigned a scale of 1 x 1 or 1 and can have a temporary debilitating effect on the organization, but their cause is typically localized and directly affects a relatively small number of customers/clients in an annoying, but non-critical manner.
“Moderate impact / Medium term disasters” are assigned a scale of 2 x 2 or 4 and are distinctly noticeable among a significant share of both customers and employees and lead to enduring and more debilitating consequences.
“High impact / long term disasters” are assigned a 3 x 3 or 9 and can have life- or business- threatening consequences. Knowledge of the problem is widespread, many people are affected, and damage is devastating. Sometimes a disaster is such that the organization is left literally fighting for its very survival by an event or decision that brings into question its integrity. Falsifying data, misleading consumers or stockholders, employing fraudulent accounting practices, taking deliberate shortcuts in production to the harm of customers, or deliberately producing products known to be harmful can all lead to a high impact disaster.
Culpability (C) is the state of being responsible for the wrong or injury inflicted and deserving of blame and censure. It certainly raises the severity quotient when an organization directly contributes to the decision or event which brings about the disaster. In harmony with the three-part rating schema employed thus far, culpability can be rated:
Contribution defines the corporation’s involvement and ranges from no contribution to direct contribution to the disaster at hand.
0. None – where the corporation has no involvement. 1. Incidental – where the corporation has incidental involvement and is not one of the
contributing factors. 2. Indirect – where the corporation may be one of the contributing factors, though not the
immediate cause. 3. Direct – where the corporation caused the problem as a direct result of organizational choice.
Intent measures the level of intended actions by the company.
0. Innocence – where the corporation had no intent to harm anyone. 1. Ignorance - where the corporation should have known what was happening, but did not act
because of its ignorance. 2. Negligence – where the corporation knew but did not act to prevent the crisis from occurring. 3. Guilt – where the corporation knew of their contribution to the crisis and acted improperly.
None - 0 Short Term - 1 Medium Term - 2 Long Term - 3None - 0 0 0 0 0
Low Impact - 1 0 1 2 3Moderate Impact - 2 0 2 4 6
High Impact - 3 0 3 6 9
NATURE Duration
Impact
Journal of Management Policy and Practice Vol. 17(1) 2016 39

Table 3 sets out the classification scale for culpability. This scale is based on a comparison of contribution and intent.
TABLE 3 DIMENSIONS OF CULPABILITY
The instance of “Incidental Contribution / Ignorant Intent,” is assigned as score of 1 x 1 or 1 and signifies a situation in which an organization may be implicated in a disaster, but it did not participate directly.
A case of “Indirect Contribution / Negligent Intent,” is assigned a scale of 2 x 2 = 4 and is one in which the organization allowed the damage by virtue of its action or inaction, but had it not been for other coinciding events, the disaster would not have occurred. In other words, the organization was co-culpable.
A “Direct Contribution / Guilty Intent” is assigned a scale of 3 x 3 = 9 and would be one resulting from the organization trying to “put one over on” the market. Cases of deception, malfeasance, and clearly faulty product design or manufacturing would fit into this category SNC Application Summary
The conditions of a disaster can be visualized as a summation of the 3 X 3 X 3 matrix as follows in Table 4. The value of this matrix approach is that it provides guidance in the nature and extent of recovery response. By applying a three-dimensional designation to each of the 27 cells in the matrix (with the convention of 1 to 3 representing the levels of severity in ascending order), one can categorize each combination of scale-nature-culpability by its cell coordinate. For example, an extremely mild disaster case could be represented by the cell designation 111 and the most severe set of conditions would be designated 333.
The SNC Severity scale has a visual component that rates the crises based on the sum of the three base scales. See Table 4 for visual sizing of the SNC Severity scale. The summation of the 3 x 3 x 3 grid reference for each component in the crisis scales the crisis for evaluation.
TABLE 4 SNC SEVERITY SCALE
For manageability, three relatively broad categories of response have been designated. It is important to remember that these responses are generic and must be tailored to the individual organization. It is also important to note that the response categories are deliberately broad for discussion’s sake, but an individual organization may find it useful to narrow each of these divisions to reflect finer definitions of response.
An egregious set of confluent conditions, all of which are on the high end of their respective SNC severity, would call for forceful, robust action to demonstrate that the organization comprehends the
None - 0 Incidental - 1 Indirect - 2 Direct - 3Innocence - 0 0 0 0 0Ignorance - 1 0 1 2 3Negligence - 2 0 2 4 6
Guilt - 3 0 3 6 9
CULPABILITY Contribution
Intent
Low < 7Moderate 7 – 17
High > 17
SNC Severity Index
40 Journal of Management Policy and Practice Vol. 17(1) 2016

magnitude of the disaster and understands the need for swift, decisive action to minimize harm and to do what is right. This would be a case in which the top guns are brought in to address the problem directly, offering assurances that every action that the situation calls for will be taken.
At the other end of the continuum are a confluence of SNC conditions which suggest that, while there is definite reason for concern, the situation is manageable and the recovery responses indicated are best addressed by lower-level officials. To bring in top management and to respond with overwhelming force (shock and awe) would represent overkill and could serve to exacerbate the problem by suggesting that it is greater than it actually is. Of all times, this is one of the most important to remember that perception is reality for customers. Anything that feeds the perception of “major disaster” by over-representing the severity of the harm, could add the sensation of severity, much in the way wind can intensify the perception of cold, producing a “wind chill factor.” Positions in-between these two extremes call for a moderate response.
In order for an organization to protect itself from the consequences of disaster, it must anticipate the attendant risks and provide prevention and planning measures. Then, when a disaster has occurred and while the emergency is still at its height, an organization must be able to identify and quantify its effects as accurately as possible so that it can design rehabilitation and reconstruction programs and identify resources that will have to be channeled to the affected business or constituents. APPLICATION OF THE MODEL TO THE GM COBALT KEY PROBLEM
To illustrate how the model could aid a company in a realistic assessment of its situation, and thereby select an appropriate response, consider the recent problems with the GM Cobalt situation which led to several fatalities. The GM situation qualifies as a disaster, having started out as a relatively minor crisis that could have been resolved in pre-production (where the problem was kept internal (Basu, 2014)), but as the result of subsequent decisions and cover-ups, led to devastating consequences to the organization’s posture and appearance to the world.
To begin applying the model we have to go back to the preplanning stages of the Cobalt. Our analysis begins in January of 2001 when GM engineers detected a defect during pre-production testing of the Saturn Ion (a precursor to the Cobalt). At that time GM engineer who designed the Ion switch described it as the switch from hell (Valukas, 2014). This switch was later rolled into the Cobalt and used without any changes to the key system. This is the beginning of the problem and dates from January of 2001.
In order to track each step through the analysis, the authors set up a continuum table where notes were made within each month as to investigative and research findings. Figure 1 below shows how these notes were then taken and evaluated month by month with regard to each attribute of scale, nature and culpability. As the readers evaluated each statement with regard to the relative levels under each of the scales, a scale number was applied to that event. Once that entry was made, the entry then replicated itself throughout the table until a higher number entry could be assigned. During each month, the severity scale took the summation of the scale, nature, and culpability results and applied the low, medium and high measurements as the items changed.
As changes were made to each scale the writers indicated a change in level by coloring the column / row cell where the change occurred. The summary table as shown in Figure 1 really covers 168 months of data. For the sake of brevity, months without research entries are excluded from the table and only months where we feel GM had a decision to make were included here.
Journal of Management Policy and Practice Vol. 17(1) 2016 41

FIGURE 1 EXAMPLE OF APPLICATION PROCESS
As we proceed through the analysis it becomes evident that there are certain points where the findings escalate the problem significantly. APPLICATION OF THE MODEL
Prior to examining the model we had to set parameters for each decision point. Most companies can look back on other disasters that have occurred in house, use those disasters as decision criteria for setting foundation points, and then recommend that future problems be examined through these criteria. A suggested methodology is to gather strategic partners within the corporation and (using past disaster experiences) identify key “what if” points in the disaster process where different decisions would have mitigated the problem. Using these waypoints, each corporation can identify markers whereby future problems can be gauged. Ford might examine the rollover incident situation. Toyota could examine the accelerator issue. Each company can apply the costs associated with each disaster to begin to assign probable future costs to missteps that were made by each corporation. Costs would include internal costs, external costs, and social costs. Where applicable, punitive and civil damage costs can be used to apply accountability measures to future steps in the model. The process of data compilation benefits the corporation by creating a leveling of expectations and common interpretation of key points in the model.
Acting outside of GM in the creation of this paper we found ourselves somewhat at a disadvantage in that we had to overlay our interpretation of events based on mostly external reporting. Internal application of in-house criteria would be much easier for corporations to finalize.
For this model to succeed, each department and level of the company would need the same interpretation of given parameters to ensure they are calculating the risk correctly and in a manner
42 Journal of Management Policy and Practice Vol. 17(1) 2016

consistent to gauge possible outcomes. The following are the authors’ suggested applications for each criterion in the model when examining GM’s responses. Scale Table Attributes Suggested for GM
Knowledge is defined as the spread of information regarding the crisis to ever expanding areas, some controlled, and others uncontrolled. For GM we suggest:
0. None – no knowledge at all. 1. Internal or local - can be seen as those areas within the span of control of the company. For
GM this would be for any model in pre-release mode. While the car is in development and problems can be contained within GM, this is that classification.
2. Market or Regional - are those areas, where some control is kept over the flow of information and its spread is contained within the market. Once a vehicle is released to the market this automatically warrants escalation by GM to this level. Knowledge of problem becomes widespread based on the geographical area of release and the statistical representation of the problem e.g., 1 in 10 owners experience a problem. This is limited to customers only.
3. Non-Market or Pervasive - represents the spread of information beyond the market into regions uncontrolled by the corporation. This level occurs when media begin to report to non-GM customers problems within GM products. In this situation future customers become knowledgeable of the problem and may change purchasing decisions based on this information.
Effect can be defined as the containment area for the physical problem.
0. None – no effect at all. 1. Internal / Local - indicates that the physical outcome is contained within the corporation. For
GM this would be for any model in pre-release mode. While the car is in development and problems can be contained, this is that classification.
2. Market / Regional - indicates that the physical outcome of the crises is contained within the known market area of the company. Once a vehicle is released to the market this automatically warrants escalation by GM to this level.
3. Non-Market / Pervasive - indicates that the physical outcome of the crisis has moved outside of the market area into society as a whole. This level occurs when media begin to report to non-GM customers problems within GM products. In this situation future customers become knowledgeable of the problem and may change purchasing decisions based on this information.
Nature Table Attributes Suggested for GM
Duration refers to the span or interval of time over which the disaster might run its course. The definition and interpretation of duration is heavily dependent on the industry or activity being reviewed.
0. None – no duration involved. 1. Short-Term – business can carry on almost as usual or the problem can be corrected and
ameliorated with internal resources once a problem is found. For GM this could be applied to a situation of less than six months after the release of a vehicle to market. In early release any correction can be carried out quickly.
2. Medium-Term– problem can be addressed with little use of outside help. For GM we assign a period of greater than six months but less than two years and when only internal advisors are used to correct the problem.
3. Long-Term - response may take much longer than two years, even with significant external assistance and, in extreme cases, may result in complete business failure. For GM, we assign a period of greater than two years and when external advocates and researchers are sought to resolve the problem.
Journal of Management Policy and Practice Vol. 17(1) 2016 43

Impact refers directly to the number of victims that are affected by the disaster. 0. None – No impact involved. For GM this can be assumed for any vehicles in pre-release
where the markets are yet to be involved and the cost of corrections minimized. 1. Low impact - affects a relatively small number of customers or clients. For GM the decision
to go with any product that still has problems implies that a quick decision to replace or change the part will minimize the impact on the market. The earlier the correction is made, the lower the impact on the corporation.
2. Moderate impact - affects a significant share of customers or clients. For GM this is a post-production release of the vehicle to several markets where a significant number of complaints are received about the new product.
3. High impact – affects all customers or clients and may affect additional persons outside the usual control of the company. For GM this is the point at which the product is post release and begins to impact non GM product owners such as extended family and / or the general public.
Culpability Table Attributes Suggested for GM
Contribution defines the corporation’s involvement and ranges from no contribution to direct contribution to the disaster at hand.
0. None – where the corporation has no involvement. For GM, this is the pre-production and pre-release environment where GM is reliant on the advice of their employees that the situation is in hand.
1. Incidental – where the corporation has incidental involvement and is not one of the contributing factors. For GM, the detection of a problem in pre-production that that lower level management has failed to address (such as the design engineer) is incidental. Senior Management and company representatives have not knowingly released a dangerous product. In effect, middle to senior management are “in the dark” regarding the situation.
2. Indirect – where the corporation may be one of the contributing factors, though not the immediate cause. For GM, middle management makes an incorrect decision or misclassifies a problem, causing the problem to escalate or continue. Senior leadership is not involved in the decision or misclassification.
3. Direct – where the corporation caused the problem as a direct result of organizational choice. For GM, this is where senior leadership knows of the problem but due to ineptitude, ignorance or deceit; delays its efforts to resolve the immediate problem. Senior leadership is, in this case, involved in the continuation of the problem with their decision/indecision and actions.
Intent measures the level of intended actions by the company.
0. Innocence – where the corporation had no intent. For GM, this is the pre-production and release environment.
1. Ignorance - where the corporation should have known what was happening, but did not act through their ignorance. For GM, this is where a general misunderstanding of the issue occurs at a low level of the corporation. Middle and senior management do not know of the extent of the problem.
2. Negligence – where the corporation knew but did not act to prevent the crisis from occurring. For GM, the continuance of the problem based on ignorance after recurrent part failure begins to implicate middle to higher management.
3. Guilt – where the corporation knew of its contribution to the crisis and acted improperly. For GM, once a representative of the company covers up a problem to intentionally divert attention, and the company fails to act immediately when liability is found, requires a complicit guilt finding. Every action after this point that does not address the problem implies guilt at all levels of the corporation.
44 Journal of Management Policy and Practice Vol. 17(1) 2016

THE COST OF INDECISION
In an attempt to estimate costs we examined both internal costs of repair and external costs of fines, civil damages, and punitive damages. These external costs are those that would be assessed against GM by outside sources. Table 5 sets out cost estimates in total. These total costs are than allocated to each vehicle as a cost per vehicle for each vehicle that will be recalled.
Internal cost repairs consist of one hour of fully loaded labor salary at an estimated $100 and a $5 cost for the part. Labor and parts total to $105 per vehicle for each repair (Answers To Your Questions). We do not include the opportunity cost of lost billable hours for the repair mechanic not working on revenue generating repairs. Compared to the disasters total costs, the repair costs make up only 8% of the total costs of the recall at $245,799,195. Fines of $35,000,000 are allocated to each vehicle at $14 per vehicle with fines representing 1% of the total recall cost (Basu, 2014). Civil Damage costs were estimated at $600,000,000 or $247 per vehicle (GURFOCUS, 2014). Civil Damages represent 18% of total recall costs. Punitive Damages are thought to be $2,400,000,000 or $989 per vehicle (GURFOCUS, 2014). Total costs of the recall are estimated at $3,289,799,195 or $1,356 per vehicle recalled.
Allocation of the costs was achieved by allocating costs across all vehicles. Fine tuning of the cost allocations could be made if more detail were paid to the timing of each assignation of fines, civil damages, and punitive damages. In reality, were GM active in recalling the cars early, they would only have been assigned repair costs and civil damages. This would force more costs to be allocated to vehicles later in the recall process. This would be consistent with the level of SNC where culpability begins to increase.
TABLE 5 NORTH AMERICAN GM COST ESTIMATES
Source: Internal Repairs – (Answer to Your Questions, 2015 Fines: (Basu, 2014), Civil Damages: (GURFOCUS, 2014), and Punitive Damages: (GURFOCUS, 2014)
To allocated costs correctly we need to understand the release times and unit sales of each recalled vehicle. Table 6 sets out the vehicle construction and release schedule (GOOD CAR BAD CAR) combined with the recall costs assigned to each year as there calculated in Table 5 above.
Internal Repair Costs Fines Civil Damages Punitive Damages Total CostsCosts per Vehicle 105$ 14$ 247$ 989$ 1,356$ Extended Costs 254,799,195$ 35,000,000$ 600,000,000$ 2,400,000,000$ 3,289,799,195$
Extended Costs % 8% 1% 18% 73% 100%
General Motors North American Ignition Recall Cost Estimates
Journal of Management Policy and Practice Vol. 17(1) 2016 45

TABLE 6 NORTH AMERICAN GM VEHICLE RELEASE AND RECALL NUMBERS BY YEAR
Table 7 sets out the change in costs as each SNC scale attribute increases. By allocating costs to each vehicle and then assigning these costs to each month, we can see how SNC escalation costs change as the SNC scale attribute changes for each successive decision point.
TABLE 7 NORTH AMERICAN RECALL COSTS AT TIME OF EACH SNC SCALE CHANGE
Ignoring the first cost impact of 100% at the release point for the vehicle we can see that the months prior to February, 2004 were the most impactful in containing the disaster. The period leading into February of that year saw an increase in costs of 145%. Of course, as the disaster escalates and the running total costs increase, later percentage increases (even though smaller) become considerably larger. In September of 2006, an increase of almost one billion dollars occurs as the disaster continues to spiral out of control.
Year Pontiac G5 Pontiac Soltstice Saturn Sky HHR Cobalt Saturn Ion Total Running Total Recall Costs2001 - - - - - - - - -$ 2002 - - - - 238,225 6,066 244,291 244,291 331,183,053$ 2003 - - - - 256,550 117,230 373,780 618,071 837,913,147$ 2004 215 - - - 229,641 116,367 346,223 964,294 1,307,284,470$ 2005 16,289 5,962 - 42,824 265,154 114,105 444,334 1,408,628 1,909,663,970$ 2006 33,453 21,599 8,947 106,778 243,537 115,026 529,340 1,937,968 2,627,285,320$ 2007 53,139 18,595 11,876 110,201 233,290 61,805 488,906 2,426,874 3,289,799,195$ 2008 51,875 11,638 9,571 100,969 221,799 760 396,612 2,823,486 -$ 2009 22,447 6,085 3,568 73,704 119,074 15 224,893 3,048,379 -$ 2010 2,920 203 179 77,184 151,012 - 231,498 3,279,877 -$ 2011 2 7 38,226 266,848 - 305,083 3,584,960 -$ 2012 - - - 194 270,387 - 270,581 3,855,541 -$ 2013 - - - 9 281,408 - 281,417 4,136,958 -$ 2014 - - - - 307,481 - 307,481 4,444,439 -$
2002 - 2014 Production / 2002 - 2007 Recalled Vehicles
Scale TotalNature Total
Culpability Total
Scale + Nature +
Culpability
Economic and Marketing
Disaster Severity Scale
YearMonth / Rating
Effect x Knowledge
Impact x Duration
Intent x Contribution
Extrapolated Total
Interpretation(Low Medium
High)2001 January 1 0 1 2 LOW $ - 2001 September 1 0 2 3 LOW $ - 2002 December 2 1 2 5 LOW $ 331,183,053 100%2003 January 4 1 2 7 LOW $ 373,410,560 12.8%2004 February 4 2 2 8 MEDIUM $ 916,093,122 145.3%2004 May 4 2 4 10 MEDIUM $ 1,033,363,084 12.8%2004 July 4 4 4 12 MEDIUM $ 1,111,543,059 7.6%2005 March 4 6 4 14 MEDIUM $ 1,457,587,872 31.1%2006 April 4 6 6 16 MEDIUM $ 2,148,579,613 47.4%2006 September 4 9 6 19 HIGH $ 2,447,588,509 13.9%2013 April 4 9 9 22 HIGH $ 3,289,799,195 34.4%2013 May 6 9 9 24 HIGH $ 3,289,799,195 0.0%2014 February 9 9 9 27 HIGH $ 3,289,799,195 0.0%
% Change
Severity Scale Economic and Marketing Disaster Severity Index
Date
Running Total of Recall Costs
46 Journal of Management Policy and Practice Vol. 17(1) 2016

It should be noted first, that these costs are just for the North American continent. North America consists of both the United States and Canada. This paper focuses only on this region. The GM disaster is worldwide. Several of the vehicles were released overseas. Any costs of repairs or fines in these other countries are ignored in this analysis. Second, our research indicates that GM has underestimated the actual costs of the recall in their set aside to handle the final costs by as much as a billion dollars. SUMMARY OF EVENTS AND SCALE ENTRIES January 2001 - Prior to January 1st 2001 we begin with all Scale, Nature, and Culpability entries set to zero. Event: GM engineers note a defect in the pre-production ignition switch. Running Total of Recall Costs: $0 Scale Scale Application: Remember that Scale is important because it signifies the reach or scope of the problem and the region over which any recovery activities must be directed. Since this is pre-production we set the Scale Effect to Internal / Local (1), and Scale Knowledge is set to Internal / Local (1) since all efforts to negate the problem at this time are internal. Having both entries present we begin by multiplying these together to get a Scale Total of 1 x 1 = 1 Scale Decision: When a disaster is localized, its effects may be contained with little impact on the entire enterprise. This score would indicate that lower to mid-level managers should be able to contain the problem with proper planning and process controls. It should be noted that the status of “pre-production” automatically limits the market impact of this situation by naturally keeping the problem from expanding outside the company itself. Middle management should be informed and knowledgeable of the problem and should be ready to stop the transition to the market should the problem not be solved. Nature Nature Application: Remember that Nature is the term we use to designate both the kind of disaster and the number and type of victims of the disaster which combine to result in the degree of impact. We categorize nature as a duration of short-term, medium-term, or long-term, and we categorize impact as low, moderate, or high. Once again, as the problem with the key is a pre-production problem we set Nature Impact to Low Impact (1). This situation really has not presented itself to market so we set Nature Duration at zero (0) as it has not actually become an issue at market. We then multiply both to get Nature Total to be 1 x 0 = 0. Nature Decision: Any situation that can be corrected pre-market is a good situation. Additionally management should note the benefit of pre-production not multiplying the nature of the situation. Looking at this entry from a preventative position, a manager might ask if this continues to market and becomes a short term problem, and how might it impact the company? The mathematics of “what if” still indicates a low impact disaster, but it is obvious that minimization at this point is important to save time and money later on. Culpability Culpability Application: Culpability is the state of being responsible for the wrong or injury inflicted and deserving of blame and censure from the market. Since the part involved is an ignition switch and is therefore seen as an integral part of the workings of the car (as opposed to, say, the head lining in the roof – not related to the workings of the car), we have to set the culpability rating to ignorance (1) since “we don’t know what we don’t know,” and yet the part is integral to the safety of the car as a whole. With Intent set to 1 for this reason we (at least in this case) feel compelled to do the same for contribution by setting it to incidental, also at 1. By multiplying both these together we get a Culpability Total to be 1 x 1 = 1 Culpability Decision: The nature of the part in question leads us to classify the culpability analysis as key in any decision about the problem management process. Remember that typically all disasters are handled in hindsight. Using this moment as foresight - i.e., “should this become a more serious issue due to the important nature of the part,” - we believe that close oversight of the issue needs to occur.
Journal of Management Policy and Practice Vol. 17(1) 2016 47

Precipitating factors for these assigned rankings are that GM detected the key defect during pre-production testing of the Saturn Ion, a precursor to its use in the Cobalt (Basu, 2014). This implies that the problem was identified quite early on and yet continued through production. We note here that the GM engineer who designed the switch described it as “the switch from Hell” (Valukas, 2014). To a GM manager this should have implied that there could be ongoing problems with the part. Finally, even after the switch was redesigned, it still failed to meet GM standards (Valukas, 2014) which should have caused concern. Severity Scale Total Initial Scale Entries: On the Severity Scale we add Scale + Nature + Culpability giving a total of 2, which is in the “low” impact range for a disaster. With a SNC rating of “low,” it can be recognized that there is definite reason for concern, but the situation at hand is manageable and the recovery responses indicated are best addressed by lower-level officials. GM appears to have responded naturally to the current internal situation and yet its response (again in hindsight) was insufficient. September 2001 Event: In September of 2001 component level testing of the ignition switch occurred at GM and 10 of 12 switches failed to meet basic engineering requirements. That level of failure is significant, and yet nothing was done within GM (Valukas, 2014). Running Total of Recall Costs: $0 Culpability Application: Since GM ignored such a significant failure rate on what is considered to be an important component of the vehicle, the authors feel that this oversight warrants an escalation of culpability to Negligence. Culpability Intent is set to Negligence (2) and Culpability Contribution remains at Incidental (1). By multiplying we get a Culpability Total of 2 x 1 = 2. Now on the Severity Scale we add Scale + Nature + Culpability giving a total of 3, which is still in the low impact range for a disaster. Culpability Decision: Remember that Incidental is where the corporation has incidental involvement and is not one of the contributing factors to the problem. Since this is a problem localized in engineering we leave Contribution scale where it was until we see where GM as a corporation contributes to the problem. December 2002 Event: Launch of the Saturn ION using the faulty ignition system to market now involves individuals outside the corporation. Running Total of Recall Costs: $331,183,053 Scale Application: Scale Effect is set to Market / Regional where the car has been released (2) while Scale Knowledge remains unchanged at (1). By multiplying we get a Scale Total of 2 x 1 = 2. Nature Application: With release outside of the corporation the minimum effect on the market becomes short term. Nature Duration is now set to Short Term of 1. By multiplying we get a Nature Total of 1 x 1 = 1. On the Severity Scale we add Scale + Nature + Culpability giving a total of 5 which is still in the low impact range for a disaster. Scale and Nature Decision: Precipitating factors for the change were the Saturn ION launch for Model year 2003. The moment the vehicles hit the market the web of problems expand. The regional launch of the Saturn ION with the faulty switch problem caused us to re-evaluate duration to short term if GM addressed the problem quickly. This did not happen. There appears to be a significant failure within GM where different departments were unaware of problems in other areas that should have held up release of these models until this component part was repaired or replaced. January 2003 Event: Stall complaints begin to come in regarding the ignition switch. The classification of these as an inconvenience rather than a significant danger precipitated further problems. Running Total of Recall Costs: $373,410,560 Scale Application: Scale Knowledge is set to Market / Regional (2) while Scale Effect remains unchanged at 2. Scale total now becomes 2 +2 = 4. This change in Scale Total now affects Scale + Nature
48 Journal of Management Policy and Practice Vol. 17(1) 2016

+ Culpability and resets a new total to be 4 + 1 + 2 = 7. This equates to a low impact for a disaster. Scale Decision: A precipitating factor for the change in Market / Regional was that a service technician closed an inquiry into a stalling Saturn Ion after changing the key ring and noticing the problem was fixed. This indicates that knowledge of the problem extended outside the company (Basu, 2014). Starting early after the launch GM received hundreds of complaints regarding both the ignition switch shutting off and intermittent stalls in the vehicle (Valukas, 2014). This indicates that as the problem spread it began to affect all markets. February 2004 Event: Anniversary of Saturn ION release puts the problem at longer than a suggested six month horizon on fixing problems. Running Total of Recall Costs: $916,093,122 Nature Application: By exceeding six months in duration the problem has escalated. Nature Duration is set to Medium (2) while Impact remains unchanged (1). Nature Total now becomes Impact x Duration or 1 x 2 = 2. With this change in the Nature Scale, the Total changes. Scale + Nature + Culpability now changes to be a new 4 + 2 + 2 = 8. This now equates to a “medium” impact for a disaster. Nature Decision: The change in duration to medium is brought about because DiGiorgio (the ignition design engineer) initiated a work order to implement changes in the ignition part by adding grease and changing the circuit board. There was also (in this first instance) a change in the part number once he had made these changes. These changes were made because he was focused on the cold crank start problem of the part. DiGiorgio considered the stalls part of the same problem in the airbag non-deployment (Valukas, 2014). The change of status here is due to the problem now being longer than the six months which we considered short term. DiGiorgio has been focused on the problem but has not reacted quickly to complaints about the ignition. By making changes he has tacitly acknowledged that there is a problem. From GM’s perspective time equates to sales, sales equates to increased market numbers, increased market numbers equate to increased complaints and exposure to the inherent problem with the part.
The change in classification to a Medium level disaster should have produced a renewed level of attention by GM management. Remembering that perception is reality for customers, GM should have renewed efforts to analyze internal and external data to see why a solution to the problem might be taking so long. This change in classification would also indicate a shift in emphasis from low level management to mid-level management examining the problem, as this “in-between” level of the scales extremes calls for a moderate response that tries to minimize panic and yet address the problems at hand. May 2004 Event: GM presents to the National Highway Transportation Safety Administration (NHTSA) that the stalls and complaints experienced by consumers are not safety events. Running Total of Recall Costs: $1,033,363,084 Culpability Application: Culpability Contribution is set to Indirect (2) while intent remains unchanged (2). Remember that Culpability Indirect is where the corporation may be one of the contributing factors, though not the immediate cause. Culpability Total now becomes Intent x Contribution or 2 x 2 = 4. With the change in Culpability Total that now changes Scale + Nature + Culpability to be the new 4 + 2 + 4 = 10. This still equates to a medium impact for a disaster. Culpability Decision: The fact that GM presents to the NHTSA that engine stalls are not safety events (Valukas, 2014) shows the level of misunderstanding on the part of GM. This is a massive disconnect requiring an upgrade to the level of Indirect applied to GM. The fact that GM cannot link ignition switch stalls with non-deployment of airbags is almost unthinkable. Research outside of the corporation was already making these links. GM’s inability to scan these (external to GM) studies and reports dramatically implicates them to the extent that their negligence causes more injuries. July 2004 Event: The number of injuries reported begins to escalate.
Journal of Management Policy and Practice Vol. 17(1) 2016 49

Running Total of Recall Costs: $1,111,543,059 Nature Application: Nature Impact is set to Moderate Impact (2) while Duration remains unchanged (2). Nature Total now becomes Impact x Duration or 2 x 2 = 4. With the change in Scale Total that now affects the Scale + Nature + Culpability to be the new 4 + 4 + 4 = 12. This still equates to a medium impact for a disaster. Remember that once many injuries begin to be reported we can assume that the problem has become distinctly noticeable among a significant share of both customers and employees and leads to enduring and more debilitating consequences for GM if the problem continues. Nature Decision: The reason for the change in nature to moderate is that we begin to see injuries caused by the ignition switch after one particular side impact by a drunk driver. During that event the airbags did not deploy (Valukas, 2014). As impact injuries begin to be reported this causes us to scale up the problem. GM again has failed to connect the dots through inadequate reporting across departments. Again, as this remains a moderate level disaster, middle management at GM needs to recognize the expanding nature of the problem if these types of accidents continue to be reported. GM appears, through silo-type departments, to be unable to access and analyze data in ways that keeps all departments up to speed and informed of the problems. March 2005 Event: By refusing to correct the problem with the part because of costs, GM fails to solve the problem and extends the problems being experienced. Running Total of Recall Costs: $1,457,587,872 Nature Application: Nature Duration is set to Long Term (3) while Impact remains unchanged (2). Nature Total now becomes Impact x Duration or 2 x 3 = 6. With the change in Scale Total this now affects the Scale + Nature + Culpability to be the new 4 + 6 + 4 = 14. This still equates to a medium impact for a disaster. Failing to address the problem because of costs extends the problem into the future necessitating a rating of long term. Nature Decision: Precipitating factors for the change include the following: In March 2005 GM rejects a proposal to fix the problem because it would be too costly and take too long to implement (Basu, 2014). According to other sources, in March 2005 a GM project engineering manager closed the investigation into the faulty switches, noting that they were too costly to fix. In his words: "Lead time for all solutions is too long" and "the tooling cost and piece price are too high." Later emails unearthed by Reuters suggested that the fix would have cost GM 90 cents per car (Plumer, 2014). On March 9th PRTS (an internal investigative group at GM) closed their investigation with no action. No one knows who authorized the investigative group being closed. Had GM maintained that the problems with the key system were a safety issue and not just an inconvenience, it would not have been closed (Valukas, 2014). The GM product investigations group created a framework that 20 to 30 incidents (stalls) per 1000 was a reasonable rate for engine stalls. There is no evidence that the National Highway Transportation Safety Administration was advised or agreed to this rate (Valukas, 2014). After years of study, this problem now becomes long term.
At this point one begins to question the detached nature of the decision to not fix the issue based on cost. From an outsider’s perspective and hindsight, one questions the misclassification as an inconvenience to users rather than a safety problem. This is another disconnect that exacerbates the problem for GM. April 2006 Event: DiGiorgio (the designing engineer) changes the switch design without changing the part number. Based on evidence, this looks like he knew the extent and consequences of the original part’s problem and tries to cover up the fact that the issue was caused by his design. Engineering 101: you never change a part and give it the same part number as the one it replaces. Running Total of Recall Costs: $2,148,579,613 Culpability Application: Culpability Contribution is set to Direct (3) while intent remains unchanged (2). Culpability Total now becomes Intent x Contribution or 2 x 3 = 6. With the change in Culpability
50 Journal of Management Policy and Practice Vol. 17(1) 2016
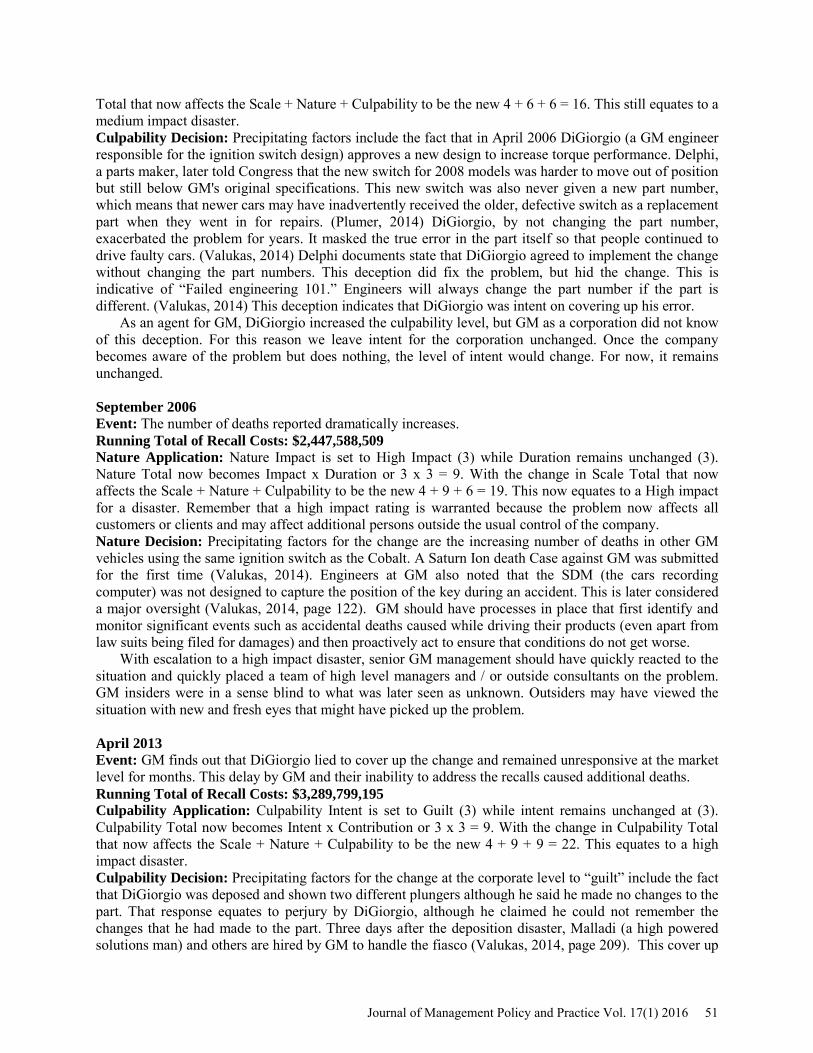
Total that now affects the Scale + Nature + Culpability to be the new 4 + 6 + 6 = 16. This still equates to a medium impact disaster. Culpability Decision: Precipitating factors include the fact that in April 2006 DiGiorgio (a GM engineer responsible for the ignition switch design) approves a new design to increase torque performance. Delphi, a parts maker, later told Congress that the new switch for 2008 models was harder to move out of position but still below GM's original specifications. This new switch was also never given a new part number, which means that newer cars may have inadvertently received the older, defective switch as a replacement part when they went in for repairs. (Plumer, 2014) DiGiorgio, by not changing the part number, exacerbated the problem for years. It masked the true error in the part itself so that people continued to drive faulty cars. (Valukas, 2014) Delphi documents state that DiGiorgio agreed to implement the change without changing the part numbers. This deception did fix the problem, but hid the change. This is indicative of “Failed engineering 101.” Engineers will always change the part number if the part is different. (Valukas, 2014) This deception indicates that DiGiorgio was intent on covering up his error.
As an agent for GM, DiGiorgio increased the culpability level, but GM as a corporation did not know of this deception. For this reason we leave intent for the corporation unchanged. Once the company becomes aware of the problem but does nothing, the level of intent would change. For now, it remains unchanged. September 2006 Event: The number of deaths reported dramatically increases. Running Total of Recall Costs: $2,447,588,509 Nature Application: Nature Impact is set to High Impact (3) while Duration remains unchanged (3). Nature Total now becomes Impact x Duration or 3 x 3 = 9. With the change in Scale Total that now affects the Scale + Nature + Culpability to be the new 4 + 9 + 6 = 19. This now equates to a High impact for a disaster. Remember that a high impact rating is warranted because the problem now affects all customers or clients and may affect additional persons outside the usual control of the company. Nature Decision: Precipitating factors for the change are the increasing number of deaths in other GM vehicles using the same ignition switch as the Cobalt. A Saturn Ion death Case against GM was submitted for the first time (Valukas, 2014). Engineers at GM also noted that the SDM (the cars recording computer) was not designed to capture the position of the key during an accident. This is later considered a major oversight (Valukas, 2014, page 122). GM should have processes in place that first identify and monitor significant events such as accidental deaths caused while driving their products (even apart from law suits being filed for damages) and then proactively act to ensure that conditions do not get worse.
With escalation to a high impact disaster, senior GM management should have quickly reacted to the situation and quickly placed a team of high level managers and / or outside consultants on the problem. GM insiders were in a sense blind to what was later seen as unknown. Outsiders may have viewed the situation with new and fresh eyes that might have picked up the problem. April 2013 Event: GM finds out that DiGiorgio lied to cover up the change and remained unresponsive at the market level for months. This delay by GM and their inability to address the recalls caused additional deaths. Running Total of Recall Costs: $3,289,799,195 Culpability Application: Culpability Intent is set to Guilt (3) while intent remains unchanged at (3). Culpability Total now becomes Intent x Contribution or 3 x 3 = 9. With the change in Culpability Total that now affects the Scale + Nature + Culpability to be the new 4 + 9 + 9 = 22. This equates to a high impact disaster. Culpability Decision: Precipitating factors for the change at the corporate level to “guilt” include the fact that DiGiorgio was deposed and shown two different plungers although he said he made no changes to the part. That response equates to perjury by DiGiorgio, although he claimed he could not remember the changes that he had made to the part. Three days after the deposition disaster, Malladi (a high powered solutions man) and others are hired by GM to handle the fiasco (Valukas, 2014, page 209). This cover up
Journal of Management Policy and Practice Vol. 17(1) 2016 51

by DiGiorgio was identified as a root cause in how long it took to recall all the cars with the problems. It took GM until 2014 to begin to respond to this revelation. This delay caused many additional unnecessary deaths which the authors believe implicates GM and warrants the guilt level applied to this situation (Valukas 2014, page 268). The culpability change is based on our notion that knowing that they had a major problem GM should have recalled all these vehicles much earlier. May 2013 Event: Non-customer interest in world news reports pushes the gravity of GM’s actions outside of the typical GM customer base to the world through news outlets. Customers who have never purchased a GM vehicle now know of the situation and the gravity of the losses incurred because of GM’s hesitation in addressing the problem. Running Total of Recall Costs: $3,289,799,195 Scale Application: Scale Knowledge is set to Non-Market / Pervasive (3) while Scale Effect remains unchanged at 2. Scale total now becomes 3 x 2 = 6. With the change in Scale Total that now affects the Scale + Nature + Culpability to be the new 6 + 9 + 9 = 24. This equates to a High impact for a disaster. Scale Decision: The precipitating factor for the change is that GM finally contacts their trouble shooter Malladi leading to a decision to recall. This recall becomes known outside of just those who have experienced the problem. Now, anyone who hears media coverage knows of the problem and makes judgments about the company based on information presented around the recall (Valukas, 2014, page 203). February 2014 Event: The number of recalls and deaths becomes pervasive and well known outside of regular GM customers. Running Total of Recall Costs: $3,289,799,195 Scale Application: Scale Effect is set to Non-Market / Pervasive (3) while Scale Knowledge remains unchanged at 3. Scale total now becomes 3 x 3 = 9. With the change in Scale Total that now affects the Scale + Nature + Culpability to be the new 9 + 9 + 9 = 27. A score of 27 is the highest disaster scale possible for the model. Scale Decision: Precipitating factor for this change was: On February 7, 2014, GM officially notifies the NHTSA "that it determined that a defect, which relates to motor vehicle safety, exists in 619,122 cars," (Basu, 2014). Again on February 13th, 2014, GM additionally officially recalls 2005-2007 Chevrolet Cobalt's and 2007 Pontiac G5’s, (Basu, 2014). Then again on February 25th, 2014, GM adds 748,024 more vehicles to the recall, (Basu, 2014). Between the first and second groups of recalled vehicles, GM identified 54 crashes, resulting in at least 13 fatalities, where this defect likely contributed to the non-deployment of the frontal air bags. In its recall notices, GM stated that it is “very important that customers remove all items from their key rings, leaving only the vehicle key. The key fob should also be removed from the key ring.”
Based on the history of these recalls, on February 27th the U.S. auto safety regulator says it is beginning an investigation into whether GM responded quickly enough to the ignition switch problem. By February 24th, 2014 The New York Times publishes an article "G.M. recalls some cars but not all with ignition switch problems," (Valukas 2014, page 235). This media coverage begins an incredible cascade of bad publicity for GM. Again on February 24th, GM expands the recall to HHR and Solstice vehicles. The news of these additional recalls now further incites market response to the problem. Total Recall numbers now amount to 842,000 (Valukas 2014, page 235). Reacting slowly to the escalation of the situation, on February 14 the GM Board is first informed of the Cobalt Problems (Valukas 2014, page 243). The situation becomes the worst publicity disaster for GM in its history.
A final analysis of this situation can be summarized by the statement “too little…too late!”
52 Journal of Management Policy and Practice Vol. 17(1) 2016

GM STRATEGIC DECISION ERRORS
The strategic decision process involves many critical steps and each step needs to be made in a systematic process. Key to each step is the need for an objective analysis that not only looks at the big picture but also the true picture without a hidden or bias agenda. For most strategic planning processes you start with a vision and then build objectives that result in a strategic plan. Once the strategic plan has been developed, then you launch the execution part. Critical to the whole process is the understanding that constant adjustments need to be made throughout the process to make sure everything is aligned and heading in the right direction. As noted in Figure 1 below the typical strategic management process follows several steps that flow smoothly together to achieve the desired vision (Gamble and Thompson, 2011). Figure 2 shows the threat or potential for external and internal challenges throughout each step with our SNC added to plan.
FIGURE 2 GM STRATEGIC PLANNING INFLUENCES
o Within the GM ongoing story line there were several critical moments when the vision of high quality
and safety took a back seat to the need for immediate production needs and project completion. As noted in Figure 2 above, it is critical to constantly review (look back) to the vision as you establish objectives; design the strategic plan and implement (execute) the plan. The possibility of misdirection or lack of appropriate adjustments grows the more external and internal influences are ignored and consequences are not forthcoming. Without accountability, the SNC plan and outcome of any strategic decision are in doubt.
These external and internal influences need to be identified and accounted for upfront in the SNC disaster planning process. You can’t just hope that you will recognize and account for the external and internal influences as they occur. This is both naïve and potentially detrimental to the whole SNC disaster plan development process.
Execution Plan - SNC
Objectives Vision
External & Internal Influences A d j u s t
m e n t s
Continuous
Journal of Management Policy and Practice Vol. 17(1) 2016 53

KEY FACTORS SHAPING STRATEGIC MANAGEMENT DECISIONS
Once a company SNC vision has been developed and communicated, SNC disaster management is built on a system of steps that take a proactive approach to addressing key factors that help shape the decisions and ultimately the desired outcome. Addressing potential factors that can promote or hinder (derail) the desired outcome (plan execution) is fundamental to the overall strategic management process. Basically reducing the potential for errors to occur with scheduled corrective adjustments steps (assessment and analysis) being made is a measure of strong strategic management. The SNC model allows companies to begin to identify key strategic moments and proactively act in the best interest of all involved.
Some of the key factors that impacted the GM decision making process are listed below. Throughout the production process these factors were inappropriately addressed and many times allowed to cloud the judgment and corrective processes that ultimately resulted in a total system breakdown. Competitive Forces within the Industry
Throughout the development and implementation stages of the manufacturing process there were several common forces. These included challenging production goals, cost controls and even the need to meet or achieve individual personal success based on specific launch dates. There were so many opportunities to correct the deficiencies, but the competitive forces clouded so much of the individual judgments. Communication Challenges within the GM Organization
These communication challenges involved several areas such as misclassification of quality information, changing products while keeping the same part number, delaying timely information, and even covering up key information. Within these challenges was also an underlying need for profitability over quality. It should be noted that this need was never stated, but it was implied by many of the critical decisions (or should we say mis-decisions). Quality Standards (Not Fully Defined or Understood)
As noted in the communication challenges, there was also a very blatant acceptance of defective parts or incidents by key individuals who felt no need to immediately take corrective action. Each of the seemingly small decisions on quality snowballed into a major and fatal outcome. Many times errors begin small and then escalated into an out-of-control situation. The SNC model attempts to focus attention on these escalating points allowing proactive attempts to resolve the situation. Price and Costs (Competitive with Industry)
This area directly impacts the execution stage of the strategic management process. It is at this point that results must be monitored and evaluated for success. This stage is also the area of great temptation to overlook or simply ignore potential problems with the hope that they will self-correct or even be allowed because of a cost control requirements. Again, it takes a culture of acceptance to allow price (profit) to override quality. The GM executives were so blinded by the need to achieve production and market goals they allowed unacceptable performance in many critical areas. Willingness to Accept the Current Strategic (Behavior) for Performance
A key strength of strategic management is the process for self-assessment. This includes the SNC model where looking at each key step in the strategic planning process and doing an objective assessment for strengths, weaknesses, opportunities and threats will help the company. If the SNC self-assessment is completed correctly it will identify areas for continuous improvement and also answer the basic question on how you are doing. General Motors failed to self-assess this key factor from the standpoint of internal influences. The organization simply did not self-assess and correct for this potential influence based on
54 Journal of Management Policy and Practice Vol. 17(1) 2016

internal needs and goals. Again, this lack of corrective action clouded the judgment process needed to properly identify and correct substandard manufacturing processes. ERRORS IN JUDGMENT
In addition to the factors identified above, it is also important to highlight that these problems were allowed to go unchecked because of an unethical culture of meeting production goals at all costs. In other words, the error of judgment was much more that an incorrect decision; it was an unethical decision.
A lack of ethical judgment can be the result of many different things and many times it happens slowly without regard to the potential full threat. In this case, there are many stages of errors in judgment beginning with the initial knowledge of the defective switch and lack of action to correct it at an early stage. Just think how much suffering and cost could have been avoided if action (appropriate adjustments) would have taken place in a timely manner. The purpose of the SNC model is to identify these errors early and act accordingly reducing culpability.
There are several possible reasons business people act unethically and some of these include (Wheelen, Hunger, 2006):
1. The people involved may not be aware of the problem or that what they are doing is wrong. 2. People have different values and this causes a different understanding of what is right and wrong. 3. Sometimes the issue or challenge causes people to rationalize their decision and find a way to
justify the different approach to address the problem. In the existing strategic planning and execution process by GM it appears that rationalization and
different perspectives or values regarding ethical decision-making caused a lack of corrective action to address the problem appropriately. GM RECOMMENDATIONS – STRATEGIC PLANNING AND IMPLEMENTATION
Recommendation for improvement in the strategic planning process starts at the very beginning of the manufacturing stage. It is recommended that controls be established that include areas of behavior, output and input (Wheelen, Hunger, 2006). It is acknowledged that these controls were probably established to some degree, but evidence suggests the controls in behavior were not enforced. These controls include such areas as:
1. Following company policies and procedures 2. Completing work appropriately (meeting guidelines) 3. Meeting ISO standards (such as ISO 9000 standards that focus on quality)
These types of controls help assure that manufacturing processes are being followed correctly and a
process is in place to monitor performance. This monitoring requirement is constant and occurs at every critical stage of the strategic planning process. The SNC model helps with this problem. CONCLUSIONS AND RECOMMENDATIONS Internal Applications
The application of the SNC model (at first) feels overwhelming to anyone trying to look externally at a corporation as if you were an internal member. From an internal point of view (as each company will individually describe the criteria for each category break) the writers find the model extremely useful in allowing us to gauge the “what if” scenarios. For example, what if senior management had just found out that DiGiorgio had lied to cover up his error and that by doing this lie had caused deaths? Slow reaction time caused by indecisiveness or unbelief would have to be seen as an admission of guilt or culpability and perhaps warranted an immediate recall rather than a delay of months. This scenario is akin to Tylenol finding a few packets of drugs had killed a person or two and then left the defective boxes on the shelves
Journal of Management Policy and Practice Vol. 17(1) 2016 55

for six months so they could further examine the cause of the situation. That reaction by the makers of Tylenol would have been the end of that brand. Might GM not have been able to pre-gauge the reaction to their delay were they applying this SNC model strategically?
Strategic application of this SNC model can aid any company in minimizing potential problems. Key to its success is pre-planning, scale scenario attribute creation, training, and finally application of this methodology. Follow through in its application is a foundation to success. A suggestion for implementation follows.
SNC Model Application
In situations where you are a small or new company and do not have a previous experience with disasters it becomes more complicated to define key decision points on the SNC scale. Easy applications include situations where you are in beta test and not out in the market (pre-production) where there are definite indicators of delineation. Problems occur with scale attributes such as culpability. How does one gauge the “what if someone really is covering up here” when you are a new company? You can't evaluate what you don't know. GM constantly underestimated the impact of a stall on a vehicle because all they could think of was that the car could be handled by the normal driver. In no way did they link in their minds the idea that a stall could be combined with a crash to result in the air bags not being deployed, and that this situation was a severe safety hazard. How do you anticipate what you don't know and then report it? Having gone through the process, the authors can say that the process of examination itself is informative. It creates questions on how applications could be made and formalizes a vision of what can occur if something is missed.
The scale sometimes feels limited in that when you select a first entry it is important that both entries have a number - i.e., it is impossible for there to be a noticeable effect with no knowledge. Thus one requires a selection of the other. It can be argued that in some cases no knowledge might imply a final result of zero where 1 x 0 = 0. In the final application of the model, it really is the examination process that is important. The examination itself is more important than the result. It is through examination that we gain knowledge of the current situation which informs better decision making in the future.
The scales as presented can be modified by corporations based on the individual corporation’s experience. Again, remember that the scale interpretations and impacts can be specific to certain corporations. Examples of differences in scales could be shown where one company has the problem where few individuals may be hurt (a toy company) versus a nuclear plant corporation where hundreds of thousands could be hurt or killed if a disaster occurs. It is the construct of the model and the thought process rather than the specific math that informs corporations’ decision processes.
The structure of GM by committee meant that no one was held responsible and that no one took the lead. The “separation of church-and-state” like natures of different GM projects (e.g., litigation versus Customer safety) caused this issue to drag on for years. One group did not feed information to the other. The nature of litigation forces secrecy in some cases, tying up cars and keeping them from engineers due to them being part of evidence. The SNC model would force the company to look outside of the silos to see how situations may be linked. This, of course, is problematic. How does one ensure communication between divisions or other departments?
External Applications
During the examination of GM, the authors found that the model would be well suited to being used as a scale for punitive penalty calculations. The more egregious and outrageous the acts, the more the multipliers kick in when calculating civil or punitive penalties. Perhaps the courts might find this model applicable in the structural application of economic impact? The creation of a penal scale such as this (once standardized and imposed) adds to the willingness of companies to implement the SNC review process because now penalties are understood, quantifiable, and a certainty.
56 Journal of Management Policy and Practice Vol. 17(1) 2016

Is There an App for That? As silly as that heading statement sounds, the practitioner in me looks for ways to remove barriers to
communications and one way is to use an application for the cell phone. How do you empower all employees to ensure everyone is on the same page? You use technology. Cell phones are almost universal in the work place. Having worked on a system where questions and feedback are collected electronically, it struck me that a focused version of that system would fit the SNC model perfectly. There is an obvious need to allow immediate and timely measurement in small manageable increments that provide better quality data for GM. The use of technologies to link timely events with actions and measure outcomes immediately would remove the silo effect and encourage a 360 degree type of reporting within the corporation. The application data itself could be either push (GM sends text questions) or pull (GM employees make a note of a concerning incident) in nature for each category of the SNC model. The collection of this data would allow GM or others to examine data for trends that currently are impossible to see.
Should an employee note a problem where there is no record in the application of that problem, the employee would be able to add an entry. For example, if that employee heard in the break room DiGiorgio bragging that he had covered his error by changing a part but not a part number, the employee could open the GM application on the phone, touch the culpability scale, and add an entry about what he or she just heard or may suspect. The application also works in reverse, so that GM can push questions at differing intervals to all levels of the corporation asking about problems and progress on solutions. These questions can even focus on whether there is potential for escalation of the problem. Numerical based responses can be quickly analyzed for feedback and problem status.
An employee could receive an example text: “With regard to the Cobalt airbag deployment problem, do you see this problem as: 1. Not a problem, 2. An inconvenience, 3. A problem, 4. A serious problem, 5. Escalating and placing GM in a bad light? Different personnel levels across different company departments can be polled using the application. The polling when received on the phones forces an immediate reinforcement of situations causing the employee and / or GM concern.
With regard to anonymity, the push / pull nature of the SNC application might warrant anonymity to ensure the quality of feedback being received. The success of this type of capability requires GM to adopt a culture where feedback is valued and not penalized, and in all probability requires the data to be managed by a trusted external facilitator. This type of application would benefit GM by being:
1. real time in data collection, 2. real time in data feedback, 3. and enable SNC model trajectory tracking on a constant basis.
The GM SNC application would:
1. Transmit questions and receive responses regarding SNC scales sent as SMS texts to employees, management, and perhaps even customers.
2. Be designed to transmit questions based on scheduled events (to follow up at regular intervals). Nothing gets left behind or ignored.
3. Be used to randomize questions to employees or even customers based on application algorithms regarding the position on the SNC scale. Different viewpoints or perspectives can be polled to avoid silo vision.
4. Allow unrequested feedback to open new problem instances and questions. Recording exact times of notification and recording feedback creates new levels of responsiveness within the corporation.
5. Ensure that incomplete or unresponsive behavior is tracked and corrected through resubmission and follow-up by the system facilitator. Unanswered questions are re-asked until the question resolution is complete.
6. Create a decision tree follow-up question system where the user can be guided through other questions to clarify and record his or her observation ensuring accurate and timely feedback
Journal of Management Policy and Practice Vol. 17(1) 2016 57

for GM. Responders sometimes lack information on how a problem might be classified. The decision tree builds as the user delves deeper into recording the problem.
Other GM SNC Application Benefits
In addition to the benefits of this delivery methodology for the SNC model, GM might benefit from personnel internal “360 evaluations." This type of internal employee evaluation has become vital to managing companies and ensuring that SNC goals are met. Catching DiGiorgio in his error might have shortened GM’s lead time in responding if a co-worker was able to notify GM what had happened. In human resources or industrial/organizational psychology, 360-degree feedback, also known as multi-rater feedback, multisource feedback, or multisource assessment, is feedback that comes from all around an employee. "360" refers to the 360 degrees in a circle, with an individual figuratively in the center of the circle. Feedback is provided by subordinates, peers, and supervisors. It also includes a self-assessment and, in some cases, feedback from external sources such as customers and suppliers or other interested stakeholders. It may be contrasted with "upward feedback," where managers are given feedback by their direct reports, or a "traditional performance appraisal," where the employees are most often reviewed only by their managers. By looking and asking everywhere, accountability for company goals becomes everyone’s responsibility.
The results from 360-degree feedback are often used by the person receiving the feedback to plan training and development. With GM using this system to track the SNC model, this capability becomes an additional benefit ensuring accountability. Results for GM could be used to make administrative decisions, such as “are our employees following procedures and working in the best interest of the company.” CONCLUSIONS REGARDING THE SNC MODEL
1. The SNC model can disentangled companies from addressing disasters in hindsight. 2. The SNC model allows companies to minimize internal, external, and social costs to problems. 3. The SNC model is a useful tool by which a company can examine possible decisions in light of
compounding factors that can cause disasters to spiral out of control. 4. The development of SNC scale attributes by each corporation is informative. This knowledge
creates both power and the ability to intervene in a deteriorating process. 5. The SNC model can be used both internally for mitigation and externally for assignation of
punitive damages. 6. Strategically, the SNC model provides structure out of what sometimes appears to be the chaos of
everyday business processes. A common and consistent vision in any corporation ensures improved outcomes.
7. The systemization of the SNC model through a cell phone and/or website application will ensure that all levels of the company have buy-in and access to the system.
REFERENCES Answers To Your Questions | FamilyDealBlog.com. (2014, March 14). Retrieved March 27, 2015, from
http://familydealblog.com/gm-ignition-switch-recall-answers-to-your-questions/ Basu, T. (2014, March 31). Timeline: A History Of GM's Ignition Switch Defect. Retrieved January 26,
2015, from http://www.npr.org/2014/03/31/297158876/timeline-a-history-of-gms-ignition-switch-defect
Bomey, N. (2014, July 24). GM estimates ignition switch victim fund will cost at least $400 million. Retrieved February 2, 2015, from http://archive.freep.com/article/20140723/BUSINESS0101/307240023/GM-earnings
Gamble, J., Thompson, A. (2011). Essential of Strategic Management: The Quest For Competitive Advantage. McGraw-Hill/Irwin, New York, NY
58 Journal of Management Policy and Practice Vol. 17(1) 2016

GOOD CAR BAD CAR. (2015, March 12). Retrieved March 12, 2015, from http://www.goodcarbadcar.net/p/sales-stats.html
Gurufocus. (2014, August 31). General Motors Is Still Not Done With The Ignition Switch Recall. Retrieved February 2, 2015, from http://www.Gurufocus.com/news/276336/general-motors-is-still-not-done-with-the-ignition-switch-recall
Plumer, B. (2014, October 3). What is the timeline of the GM recall scandal? Retrieved January 26, 2015, from http://www.vox.com/cards/gm-car-recall/what-is-the-timeline-of-the-gm-recall-scandal
Timmerman, E., Sharp, E. and Shepherd, I., (2015, December). Proposing a Marketing Disaster Severity Index: Measuring the Dimensions of Damage as a Preface to Recovery, Journal of Management Policy and Practice (ISSN# 1913-8067) volume 16(3), 2015.
Upton, F. (2014, September 16). Staff Report on the GM Ignition Switch Recall: Review of NHTSA. Retrieved January 26, 2015, from http://energycommerce.house.gov/sites/republicans.energycommerce.house.gov/files/Hearings/OI/20140915GMFootnotes/NHTSAreportfinal.pdf
Valukas, A. (2014, May 29). Report to the Board of Directors of General Motors Company Regarding Ignition Switch Recalls. Retrieved January 26, 2015, from https://www.scribd.com/doc/228310223/GM-s-Valukas-Switch-Recall-Report
Wheelen, T., Hunger, J. (2006). Concepts In Strategic Management And Business Policy. Pearson Education, Inc., Upper Saddle River, New Jersey
Journal of Management Policy and Practice Vol. 17(1) 2016 59