Embed Size (px)
Citation preview
G00213740
The Gartner Supply Chain Top 25 for 2011Published: 1 June 2011
Analyst(s): Debra Hofman, Kevin O'Marah, Carla Elvy
2011 marks the seventh year of our annual Supply Chain Top 25 report. Thegoal of this research has always been to raise awareness of the supplychain discipline and how it impacts business. Here, we reveal the results ofthis year's ranking and discuss where the Supply Chain Top 25 is heading inthe future.
Key Findings■ The Top 5 include three mainstays — Apple, Dell and P&G — and two that joined the list for the
first time last year—Research In Motion (RIM) and Amazon.
■ Four new companies joined the list this year: Nestle, Starbucks, 3M and Kraft Foods.
■ Four key themes emerged this year among the leaders, including how they deal with volatility,their approaches to value chain network integration, their focus on sustainable execution andtheir abilities to orchestrate.
Recommendations■ Develop supply chain processes and methodologies throughout your trading partner network
that will provide the resiliency to deliver predictable results in the face of ongoing volatility.
■ Supplement a clearly articulated, long-term value chain vision with strong, agile, andsustainable execution capabilities. Push your team to think differently and go beyondconventional wisdom to push the boundaries on performance levels.
■ Measure your supply chain as your customers experience it. Develop the capability tointernalize customer needs, and proactively build customer feedback into your supply chaindesign.
■ Step back and consider the basic supply chain capabilities you need, as well as the innovationsthat will differentiate your performance. Ensure the sustainability of your efforts and initiativesthrough a constant focus on governance, change management and culture.
Table of Contents
Analysis..................................................................................................................................................3
The Gartner Supply Chain Top 25 for 2011......................................................................................3
The Themes...............................................................................................................................3
Inside the Numbers .........................................................................................................................6
Honorable Mention...........................................................................................................................9
What Is Demand-Driven Excellence? ...............................................................................................9
Operational Excellence and Innovation Excellence..........................................................................10
Measuring Demand-Driven Excellence ...........................................................................................12
The Metrics We Wish We Had .................................................................................................12
Supply Chain Top 25 Methodology ................................................................................................15
Financial Component................................................................................................................16
Opinion Component.................................................................................................................17
Polling Procedure.....................................................................................................................21
Composite Score......................................................................................................................21
Looking Ahead...............................................................................................................................21
Recommended Reading.......................................................................................................................22
List of Tables
Table 1. The Gartner Supply Chain Top 25 for 2011 ..............................................................................5
Table 2. Industries Excluded From the Supply Chain Top 25................................................................15
List of Figures
Figure 1. Demand-Driven Principles......................................................................................................10
Figure 2. Operational Excellence and Innovation Excellence.................................................................11
Figure 3. Metrics for Operational Excellence and Innovation Excellence................................................12
Figure 4. The Hierarchy of Supply Chain Metrics: Operational Excellence.............................................13
Figure 5. The Hierarchy of Product Metrics: Innovation Excellence........................................................14
Figure 6. Peer Opinion Panel Composition: Industry.............................................................................18
Figure 7. Peer Opinion Panel Composition: Function............................................................................19
Figure 8. Peer Opinion Panel Composition: Role...................................................................................19
Figure 9. Peer Opinion Panel Composition: Region...............................................................................20
Figure 10. Peer Opinion Panel Composition: Revenue..........................................................................20
Page 2 of 24 Gartner, Inc. | G00213740
Analysis
The Gartner Supply Chain Top 25 for 2011
2011 marks the seventh year of our annual Supply Chain Top 25 report. At its highest level, the goalof this research has always been to raise awareness of the supply chain discipline and how itimpacts business. By identifying the leaders — that is, companies that are pushing the envelope ofsupply chain innovation — we hope to consistently highlight the best practices from which otherscan learn, thereby raising the bar for the supply chain profession as a whole.
Each year, our analysts talk to and research the supply chains of hundreds of companies. What wesee, hear and write about runs the gamut from specific to broad: from the specific functional issuesin planning, sourcing, manufacturing, and distribution, to companies' broader, cross-value-chainstrategies, visions, and missions.
The Themes
Stepping back from the discussions we've had all year, four themes emerged.
Resilience
First, of course, is the impact of the recovering economy. Companies are starting to invest again inresources and assets, and although we haven't fully recovered, the trend is certainly looking up. Atthe same time, leaders took some very clear lessons from the events of the past couple years, withone of them being the need for supply chain resilience: the ability to deliver predictable results,despite the volatility that many have pointed out is now here to stay. Speed, agility, efficiency,responsiveness and innovation — all remain critical, but equally important is a resilient supply chain.Companies like Cisco, Dow Chemical, RIM, Unilever and others are actively designing in structures,processes and methodologies to create and expand this resiliency not only in their own supplychains, but in those of their trading partners as well.
Value Chain Network Integration
Last year, we talked about the trend toward vertical integration. What we've seen since then is moreabout choosing the right set of value chain network integration strategies that allow better control ofthe end-to-end value chain. What this means is that there's no one answer that's always right. Wesee companies like Samsung, which have always been vertically integrated, weathering the ups anddowns through ownership of supply, and others like The Coca-Cola Company and PepsiCobecoming more vertically integrated with the acquisition of their largest bottlers. On the other hand,we see companies like Microsoft and Cisco managing an extensively outsourced network of tradingpartners. The key isn't whether a company owns all the pieces of its network — it's how well itcontrols the outcome of the activities that take place in the network that end in the delivery of a finalproduct to a customer. As such, each company needs to figure out the right strategy for sustainabledifferentiation given its unique business goals, and design the tactics and processes that will bestensure the quality and efficiency of the end-to-end output and response to the end customer.
Gartner, Inc. | G00213740 Page 3 of 24
Vision and Sustainable Execution
Leaders are setting their sights beyond the articulation of a clear vision to the need for sustainableexecution against that vision. These companies understand that, although a long-term supply chainvision is critical to communicate future value, the ability to replicate, scale and continually build onbest practices across the organization in a sustainable way — going beyond a one-time success orpockets of excellence — is just as critical. This is no small task given the size, complexity and sheerscale of many of the Top 25 leaders. It often requires fundamental shifts in organization andgovernance, as well as an unshakeable commitment to effective change management.
Orchestration
Leaders have been moving steadily up the demand-driven maturity curve over the last several years(see "Supply Chain Strategy for Manufacturing Leaders: The Handbook for Becoming DemandDriven"). What differentiates the companies that are true "orchestrators" is that they go beyondsimply borrowing and adapting others' best practices. They create new ones altogether, oftendefying "conventional wisdom" to rewrite the rules and increase the gap between themselves andothers. We'll be writing more about this in the coming year throughout our supply chain researchagenda.
With seven years of data and discussion behind it, the 2011 Supply Chain Top 25 continues to offerlessons about staying power, change, and the never-ending challenge of defining and measuringexcellence (see Table 1).
Page 4 of 24 Gartner, Inc. | G00213740
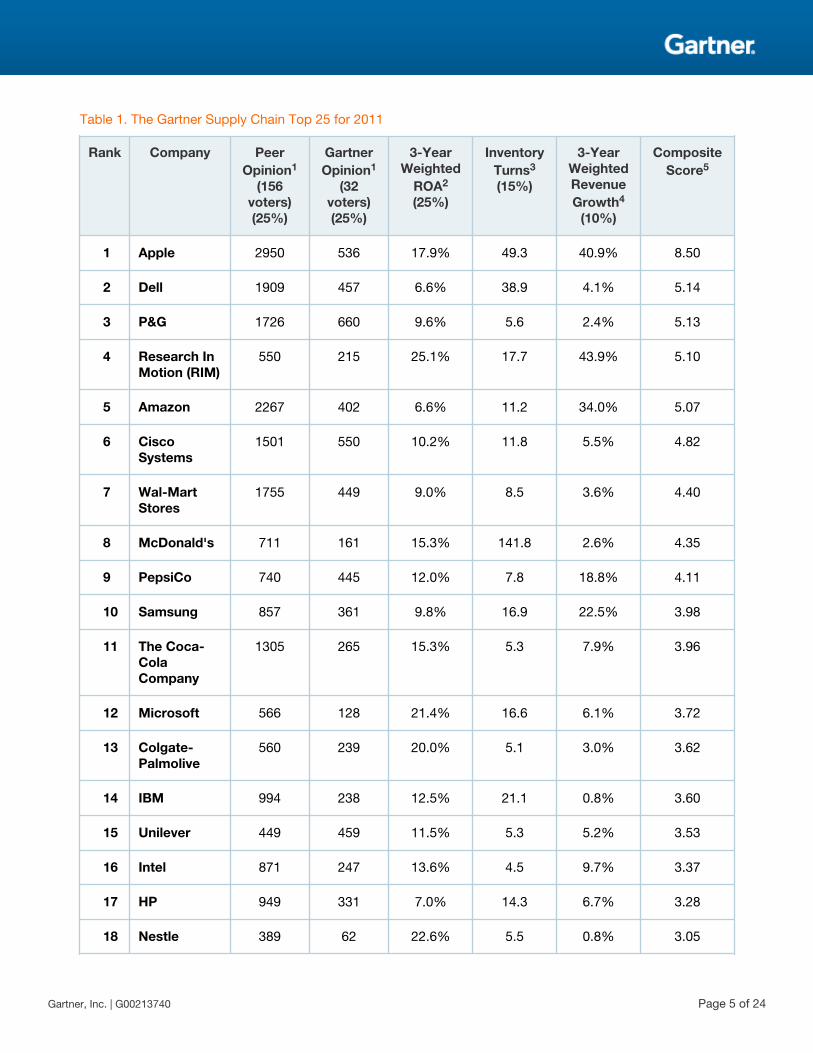
Table 1. The Gartner Supply Chain Top 25 for 2011
Rank Company PeerOpinion1
(156voters)(25%)
GartnerOpinion1
(32voters)(25%)
3-YearWeighted
ROA2
(25%)
InventoryTurns3
(15%)
3-YearWeightedRevenueGrowth4
(10%)
CompositeScore5
1 Apple 2950 536 17.9% 49.3 40.9% 8.50
2 Dell 1909 457 6.6% 38.9 4.1% 5.14
3 P&G 1726 660 9.6% 5.6 2.4% 5.13
4 Research InMotion (RIM)
550 215 25.1% 17.7 43.9% 5.10
5 Amazon 2267 402 6.6% 11.2 34.0% 5.07
6 CiscoSystems
1501 550 10.2% 11.8 5.5% 4.82
7 Wal-MartStores
1755 449 9.0% 8.5 3.6% 4.40
8 McDonald's 711 161 15.3% 141.8 2.6% 4.35
9 PepsiCo 740 445 12.0% 7.8 18.8% 4.11
10 Samsung 857 361 9.8% 16.9 22.5% 3.98
11 The Coca-ColaCompany
1305 265 15.3% 5.3 7.9% 3.96
12 Microsoft 566 128 21.4% 16.6 6.1% 3.72
13 Colgate-Palmolive
560 239 20.0% 5.1 3.0% 3.62
14 IBM 994 238 12.5% 21.1 0.8% 3.60
15 Unilever 449 459 11.5% 5.3 5.2% 3.53
16 Intel 871 247 13.6% 4.5 9.7% 3.37
17 HP 949 331 7.0% 14.3 6.7% 3.28
18 Nestle 389 62 22.6% 5.5 0.8% 3.05
Gartner, Inc. | G00213740 Page 5 of 24
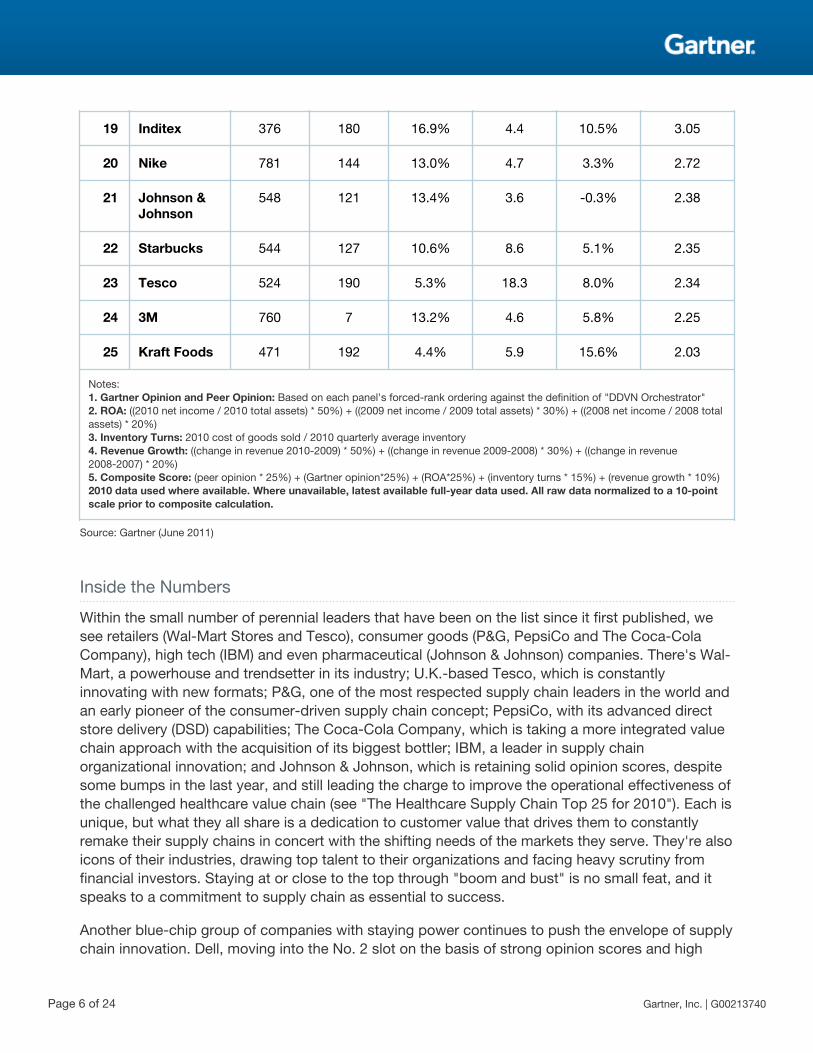
19 Inditex 376 180 16.9% 4.4 10.5% 3.05
20 Nike 781 144 13.0% 4.7 3.3% 2.72
21 Johnson &Johnson
548 121 13.4% 3.6 -0.3% 2.38
22 Starbucks 544 127 10.6% 8.6 5.1% 2.35
23 Tesco 524 190 5.3% 18.3 8.0% 2.34
24 3M 760 7 13.2% 4.6 5.8% 2.25
25 Kraft Foods 471 192 4.4% 5.9 15.6% 2.03
Notes:1. Gartner Opinion and Peer Opinion: Based on each panel's forced-rank ordering against the definition of "DDVN Orchestrator"2. ROA: ((2010 net income / 2010 total assets) * 50%) + ((2009 net income / 2009 total assets) * 30%) + ((2008 net income / 2008 totalassets) * 20%)3. Inventory Turns: 2010 cost of goods sold / 2010 quarterly average inventory4. Revenue Growth: ((change in revenue 2010-2009) * 50%) + ((change in revenue 2009-2008) * 30%) + ((change in revenue2008-2007) * 20%)5. Composite Score: (peer opinion * 25%) + (Gartner opinion*25%) + (ROA*25%) + (inventory turns * 15%) + (revenue growth * 10%)2010 data used where available. Where unavailable, latest available full-year data used. All raw data normalized to a 10-pointscale prior to composite calculation.
Source: Gartner (June 2011)
Inside the Numbers
Within the small number of perennial leaders that have been on the list since it first published, wesee retailers (Wal-Mart Stores and Tesco), consumer goods (P&G, PepsiCo and The Coca-ColaCompany), high tech (IBM) and even pharmaceutical (Johnson & Johnson) companies. There's Wal-Mart, a powerhouse and trendsetter in its industry; U.K.-based Tesco, which is constantlyinnovating with new formats; P&G, one of the most respected supply chain leaders in the world andan early pioneer of the consumer-driven supply chain concept; PepsiCo, with its advanced directstore delivery (DSD) capabilities; The Coca-Cola Company, which is taking a more integrated valuechain approach with the acquisition of its biggest bottler; IBM, a leader in supply chainorganizational innovation; and Johnson & Johnson, which is retaining solid opinion scores, despitesome bumps in the last year, and still leading the charge to improve the operational effectiveness ofthe challenged healthcare value chain (see "The Healthcare Supply Chain Top 25 for 2010"). Each isunique, but what they all share is a dedication to customer value that drives them to constantlyremake their supply chains in concert with the shifting needs of the markets they serve. They're alsoicons of their industries, drawing top talent to their organizations and facing heavy scrutiny fromfinancial investors. Staying at or close to the top through "boom and bust" is no small feat, and itspeaks to a commitment to supply chain as essential to success.
Another blue-chip group of companies with staying power continues to push the envelope of supplychain innovation. Dell, moving into the No. 2 slot on the basis of strong opinion scores and high
Page 6 of 24 Gartner, Inc. | G00213740
inventory turns, has been radically redefining itself, diversifying beyond its traditional build-to-orderPC base into business solutions, storage and services, with segmented supply chain responsemodels. Cisco (No. 6) leads the way with its customer value chain management (CVCM)organization, sophisticated risk management capabilities and regionalized supply networkarchitecture. Samsung (No. 10), on the list since 2005 and in the Top 10 ever since, is leading in itscustomer collaboration practices and leveraging its vertical integration to release more holisticallydesigned products. Intel continued its steady rise up the list, moving into the No. 16 slot this year onstrong financials, which reflects its product expansion from chips and servers to complete solutions,and steady opinion scores, despite some product challenges that impacted customer shipments.With one of the world's largest and most complex high-tech supply chains, massive volumes andextensive global reach, HP's (No. 17) ongoing supply chain transformation has allowed it toconsistently take costs out of its traditionally low-margin businesses, even in the face of continuingprice erosion. Nike, in the ranking since 2005, withstood the combination of falling demand in manyof its markets and commodity price pressures to come in at No. 20.
The 2011 list also highlights the scale of change being driven through our discipline by emerginginnovators. We welcome four new names to the list this year: Nestle, one of the world's largest foodproducers, with major expansions into emerging markets, at No. 18; Starbucks, which istransforming its supply chain into a strategic differentiator, at No. 22; 3M, an icon of innovation, atNo. 24; and Kraft Foods, with its leading channel management strategy, at No. 25.
Two companies that qualified for the first time last year from industries that had previously beenexcluded have returned: McDonald's, which is up a few notches to No. 8, and Microsoft, whichholds steady at No. 12. Both come in on solid financials, but they also get a lot of respect from ourvoters.
In fact, looking back, we see an average of four new names each year, some of which surprised usat first, and some that have already come to be fixtures: high-flying Apple, ranking No. 1 overall forthe fourth year in a row on the basis of continued killer financials and top-of-the-line voting scores;RIM, which was new to the list last year and rose to No. 4 this year, with enviable financials andsolid votes; Amazon, another newcomer last year that rose five spots to No. 5 in the 2011 ranking;Colgate-Palmolive, rising steadily since 2009 to No. 13 this year; Inditex, with an aggressiveexpansion outside its traditional European base, moving up a few spots to No. 19 from its entrypoint last year; and Unilever, which came onto the list for the first time in 2009 and saw the biggestjump among our group this year, rising six spots to No. 15.
The ability to have a combination of repeat and new faces on the list each year — representingstable leadership supplemented by new challengers — was one of the goals in designing themethodology for the ranking, which has undergone substantial debate and refinement over the pastseven years. Our joint use of financial metrics and opinion polling creates situations whereorganizations whose supply chain capabilities were less known to our research team can rise toprominence on one part of the score (for example, RIM, with stellar financials, or Amazon, with hugepeer voter totals). This balance ensures that new blood makes it into the discussion, forcing ouranalysts and the community as a whole to ask what these companies are doing right that might helpothers.
Gartner, Inc. | G00213740 Page 7 of 24
One of the trends we've seen over the last several years is a move from the notion of "supply chain"to "value chain" and a concomitant increase in the span of control of the supply chain organization(see "Stages of Value Chain Transformation, Revisited"). The old image of a supply chainorganization limited to either inbound materials management or logistics, with procurement,planning, manufacturing, and customer service as totally separate functions, is fading. What'sreplacing it is a supply chain organization, often reporting at the board level, that includes thefunctions of plan, source, make and deliver. It also increasingly includes functions such as customerservice and new product launch, and links them through the cross-functional processes and rolesthat are so critical to being demand-driven. The consumer-oriented companies, with their need torenew product lines constantly and their appetite for downstream data, have led the way in thischange, which may at least partially explain the steady drift away from industrial companies makingthe list.
What else might explain the reason why there are more consumer and high-tech companies thantraditional heavy industrials in the ranking? We've looked at this in detail over the years. Some havesuggested that the financials used in the ranking favor the consumer and high-tech companies, butour analysis disproves this notion, showing that there is far more variation in financials betweencompanies within an industry than there is between industries as a whole (see "The AMR SupplyChain Top 25 for 2010" and "Changes to the 2010 Supply Chain Top 25 Methodology: Our Ideas").It's also not the composition of the voting population. The industrial companies are well-represented in the peer panel each year, and our analysis has shown that they, too, tend to votemore for consumer and high-tech companies than for other industrials. Some have suggested it hasto do with the impact of brand — that is, the notion that voters are more likely to vote for companiesthey've heard of. We agree that brand plays a part, and we continue to look for ways to mitigatethat impact. But while brand has a role, it doesn't provide the full explanation.
There's something else that's even more important that should be noted: communication. Supplychain executives from consumer and high-tech companies are more likely to talk about what they'redoing in supply chain and share it with others in all kinds of venues. External communication tendsto be an accepted part of their organizational cultures. The Top 25 ranking is designed to recognizeleadership, and a critical component of leadership is visibility. It's not just their product brand —these companies have a bigger supply chain brand.
Finally, with the peer vote making up one-quarter of a company's composite score, the makeup ofthe peer voting community is of vital importance. In past years, one challenge was that roughly 80%of peer voters hailed from North America. For 2011, we were able to significantly improve the globalbalance of our peer voters, with only 59% coming from the Americas, 29% from Europe or Africa,and another 12% from Asia.
This better-balanced voter pool may have helped flag another trend this year: an increasingly two-way street in global supply chain strategies. Where emerging markets were once attractive primarilyas low-cost manufacturing and sourcing locations, many companies today are finding that selling toas well as sourcing from these countries offers better results all around. Leading this charge arecompanies like HP, whose investments in China are decidedly oriented to selling there, or Unilever,whose global business strategy includes extensive emerging-market distribution.
Page 8 of 24 Gartner, Inc. | G00213740
Honorable Mention
As always, there are many companies whose supply chain organizations have shown great resultsand demonstrated compelling innovation, yet they failed to make the list. Among these honorablementions are companies that have been on the list in the past and fallen, but are still pushing aheadwith supply chain innovations (e.g., The Walt Disney Company, Lockheed Martin and Woolworths).Others have not yet made the list, but they're rising (e.g., Lenovo, Dow Chemical, Raytheon, BMWGroup and Ford). Some are stars that have fallen, but they've started to turn themselves around(e.g., Motorola, L'Oreal and The Home Depot). In each of these examples, we see senior leadershipthat takes supply chain very seriously, and expects a strategic impact on customers, market shareand company value.
What Is Demand-Driven Excellence?
The concept of being demand-driven is at the heart of the Top 25 ranking. We first started writingabout demand-driven principles in 2003 and have published hundreds of articles on the topic since,including a maturity model to help companies move along the transformation curve (see "Toolkit:Assess the 12 Facets of DDVN Excellence"). Because it's so critical to the Top 25 analysis, here's abrief synopsis of what it means to have a demand-driven value chain.
Figure 1 captures the organizational ideal of demand-driven principles as applied to the globalsupply chain. This model has three overlapping areas of responsibility:
■ Supply management — Manufacturing, logistics, supply planning and sourcing
■ Demand management — Marketing, sales, demand planning and service
■ Product management — R&D, engineering and product development
Gartner, Inc. | G00213740 Page 9 of 24

Figure 1. Demand-Driven Principles
A system of technologies and processes that senses and responds to real-time demand signals across a supply network of customers, suppliers and employees.
Demand Supply
Product
Source: Gartner (June 2011)
When these processes work together, the business can respond quickly and efficiently toopportunities arising from market or customer demand. The defining characteristics of supplychains built to this design include the ability to manage demand, rather than just respond to it; anetworked, rather than linear, approach to global supply; and the ability to embed innovation inoperations, rather than keep it isolated in the laboratory.
Operational Excellence and Innovation Excellence
Two basic dimensions of measurement capture the totality of the best-in-class, demand-driven,global supply chain: operational excellence and innovation excellence (see Figure 2). To measureoperations, including delivering as promised to customers and keeping costs under control, werecommend a hierarchy of metrics, with perfect order performance and total supply chain costs atthe top (see "The Hierarchy of Supply Chain Metrics: Diagnosing Your Supply Chain Health").
Page 10 of 24 Gartner, Inc. | G00213740
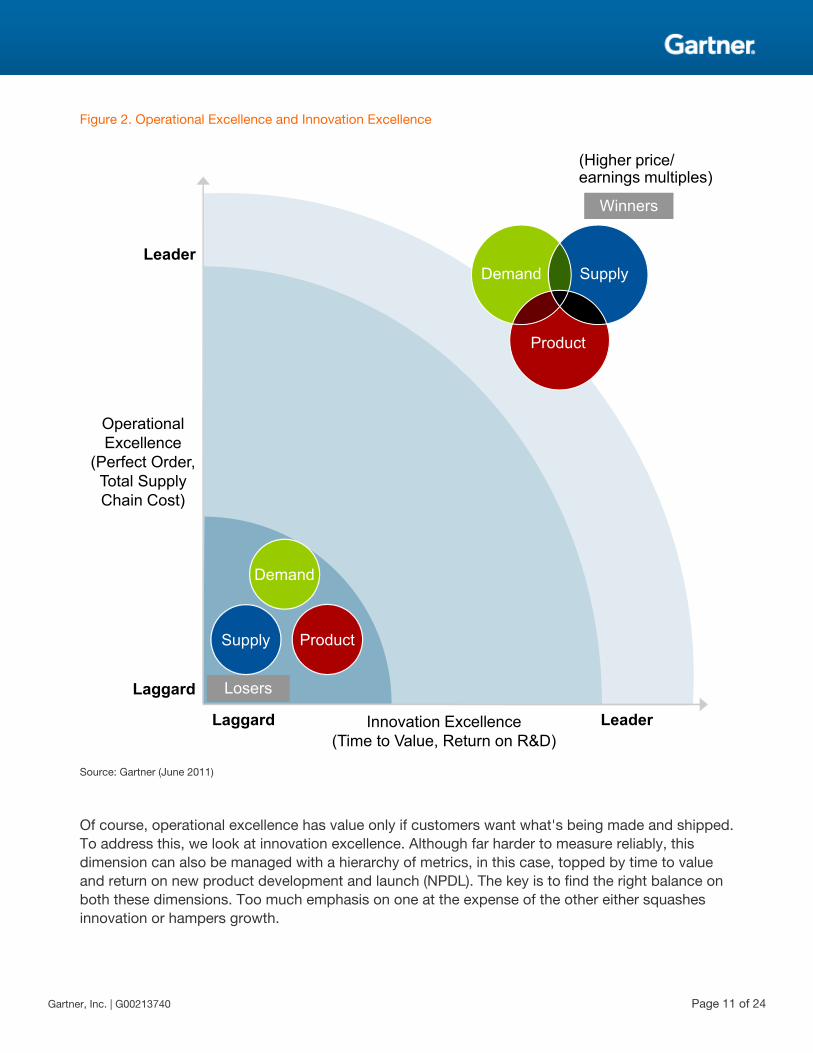
Figure 2. Operational Excellence and Innovation Excellence
Winners
Losers
Demand
Supply Product
OperationalExcellence
(Perfect Order,Total SupplyChain Cost)
Leader
Laggard
Laggard LeaderInnovation Excellence(Time to Value, Return on R&D)
(Higher price/earnings multiples)
Demand Supply
Product
Source: Gartner (June 2011)
Of course, operational excellence has value only if customers want what's being made and shipped.To address this, we look at innovation excellence. Although far harder to measure reliably, thisdimension can also be managed with a hierarchy of metrics, in this case, topped by time to valueand return on new product development and launch (NPDL). The key is to find the right balance onboth these dimensions. Too much emphasis on one at the expense of the other either squashesinnovation or hampers growth.
Gartner, Inc. | G00213740 Page 11 of 24
Measuring Demand-Driven Excellence
The Metrics We Wish We Had
For the Top 25 ranking, our ideal would be to have metrics that perfectly describe the two basicdimensions of performance: operational and innovation excellence. These are the dimensions thatpoint meaningfully to the better value chain, identifying which business is faster, stronger andsmarter. Betting on next year or next quarter is a matter of knowing who the better "athlete" is, notmerely who won last time. Our premise is that the better athlete is more likely to win markets andprofits in the future. Therefore, the companies that can demonstrate superior performance againstthese dimensions merit a higher share price multiple on a dollar of current earnings.
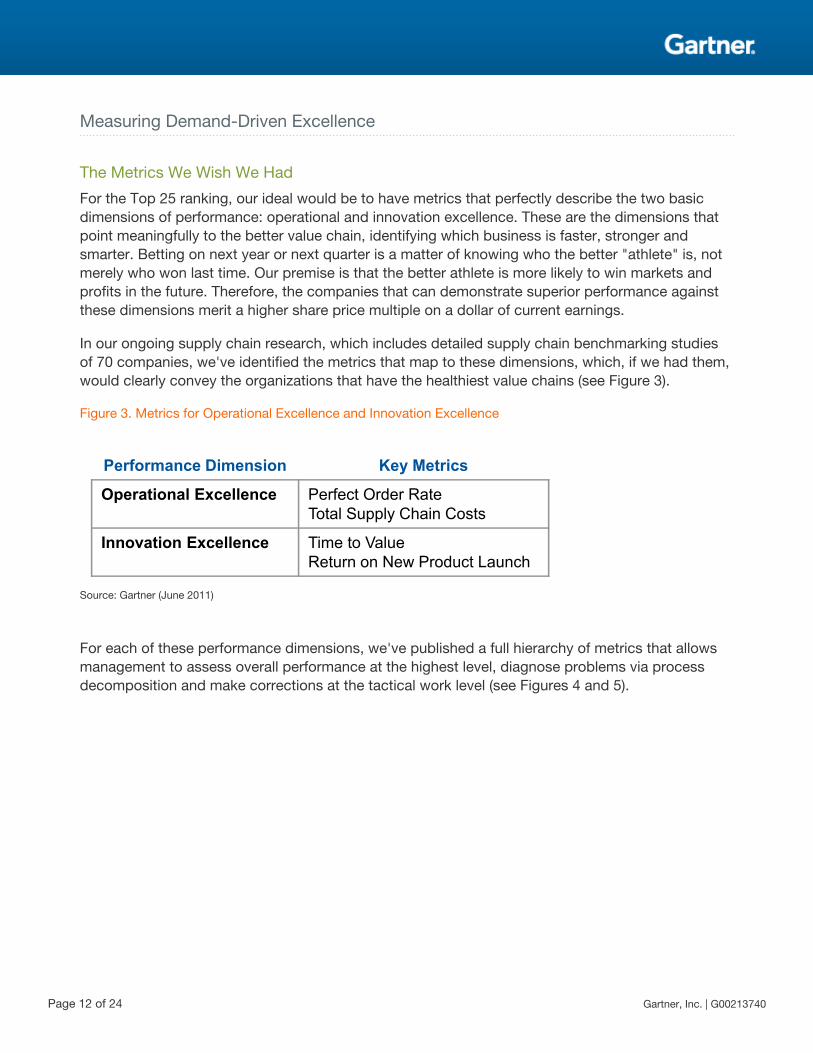
In our ongoing supply chain research, which includes detailed supply chain benchmarking studiesof 70 companies, we've identified the metrics that map to these dimensions, which, if we had them,would clearly convey the organizations that have the healthiest value chains (see Figure 3).
Figure 3. Metrics for Operational Excellence and Innovation Excellence
Performance Dimension Key Metrics
Operational Excellence Perfect Order RateTotal Supply Chain Costs
Innovation Excellence Time to ValueReturn on New Product Launch
Source: Gartner (June 2011)
For each of these performance dimensions, we've published a full hierarchy of metrics that allowsmanagement to assess overall performance at the highest level, diagnose problems via processdecomposition and make corrections at the tactical work level (see Figures 4 and 5).
Page 12 of 24 Gartner, Inc. | G00213740
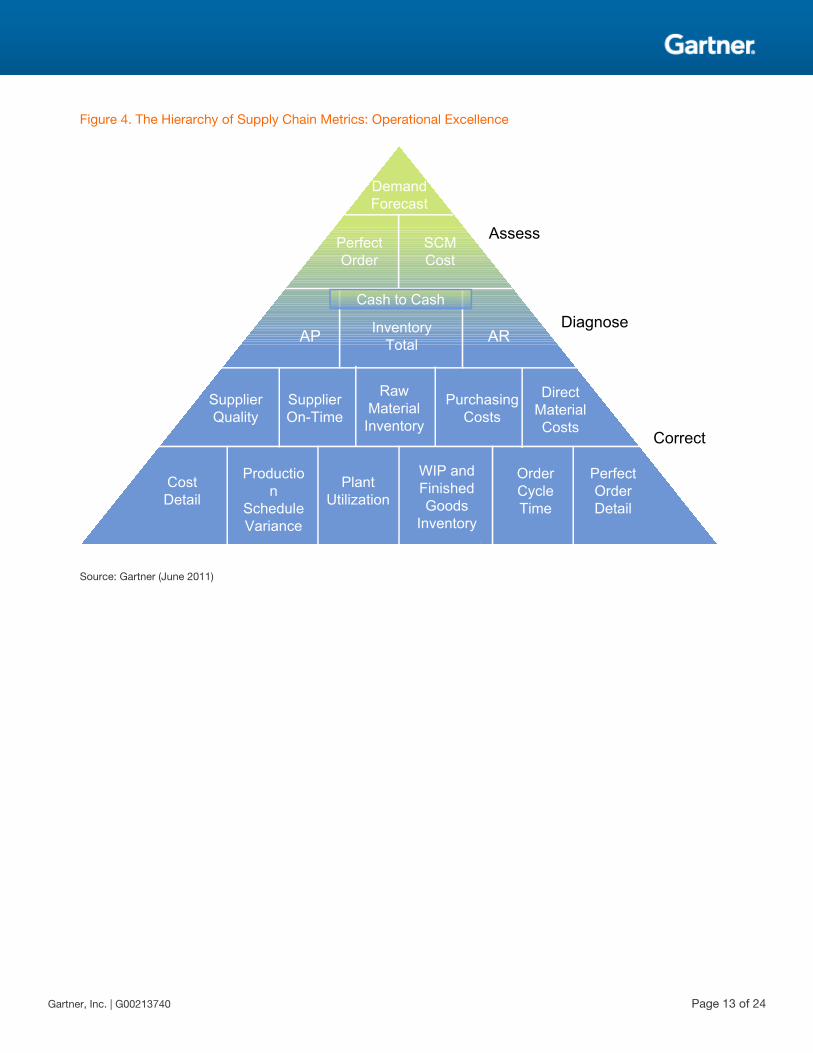
Figure 4. The Hierarchy of Supply Chain Metrics: Operational Excellence
Correct
Diagnose
Assess
AP AR
DemandForecast
PerfectOrder
SCMCost
Cash to Cash
InventoryTotal
SupplierQuality
SupplierOn-Time
Raw MaterialInventory
PurchasingCosts
Direct MaterialCosts
CostDetail
Production
ScheduleVariance
PlantUtilization
WIP and Finished Goods
Inventory
OrderCycleTime
PerfectOrder Detail
Source: Gartner (June 2011)
Gartner, Inc. | G00213740 Page 13 of 24
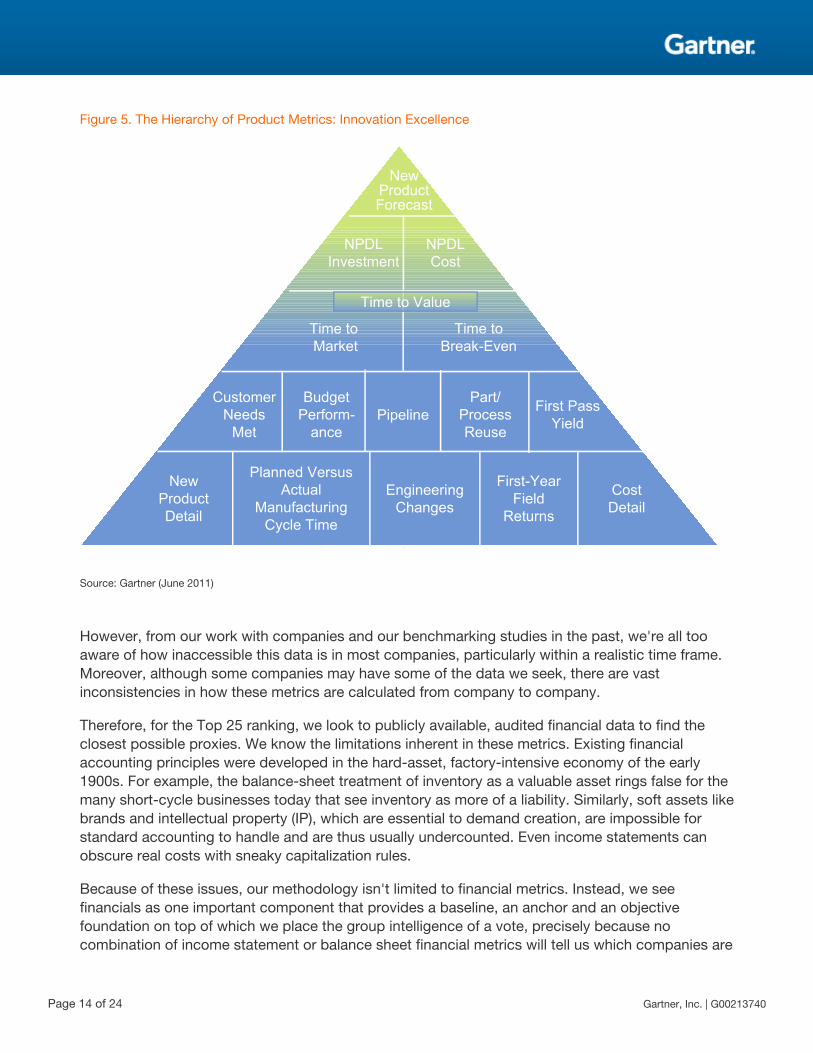
Figure 5. The Hierarchy of Product Metrics: Innovation Excellence
Time to Market
Time to Break-Even
NewProductForecast
NPDLInvestment
NPDLCost
Time to Value
CustomerNeeds
Met
BudgetPerform-
ancePipeline
Part/ProcessReuse
First PassYield
New ProductDetail
Planned VersusActual
ManufacturingCycle Time
EngineeringChanges
First-YearField
Returns
Cost Detail
Source: Gartner (June 2011)
However, from our work with companies and our benchmarking studies in the past, we're all tooaware of how inaccessible this data is in most companies, particularly within a realistic time frame.Moreover, although some companies may have some of the data we seek, there are vastinconsistencies in how these metrics are calculated from company to company.
Therefore, for the Top 25 ranking, we look to publicly available, audited financial data to find theclosest possible proxies. We know the limitations inherent in these metrics. Existing financialaccounting principles were developed in the hard-asset, factory-intensive economy of the early1900s. For example, the balance-sheet treatment of inventory as a valuable asset rings false for themany short-cycle businesses today that see inventory as more of a liability. Similarly, soft assets likebrands and intellectual property (IP), which are essential to demand creation, are impossible forstandard accounting to handle and are thus usually undercounted. Even income statements canobscure real costs with sneaky capitalization rules.
Because of these issues, our methodology isn't limited to financial metrics. Instead, we seefinancials as one important component that provides a baseline, an anchor and an objectivefoundation on top of which we place the group intelligence of a vote, precisely because nocombination of income statement or balance sheet financial metrics will tell us which companies are
Page 14 of 24 Gartner, Inc. | G00213740
furthest along toward the demand-driven ideal of supply chain excellence. For this reason, we lookto craft a methodology that combines enough — but not too many — of the right metrics, bothquantitative and qualitative, to achieve our goals.
Supply Chain Top 25 Methodology
The Supply Chain Top 25 ranking comprises two main components: financial and opinion. Publicfinancial data provides a view into how companies have performed in the past, while the opinioncomponent offers an eye to future potential and reflects future expected leadership, which is acrucial characteristic. These two components are combined into a total composite score.
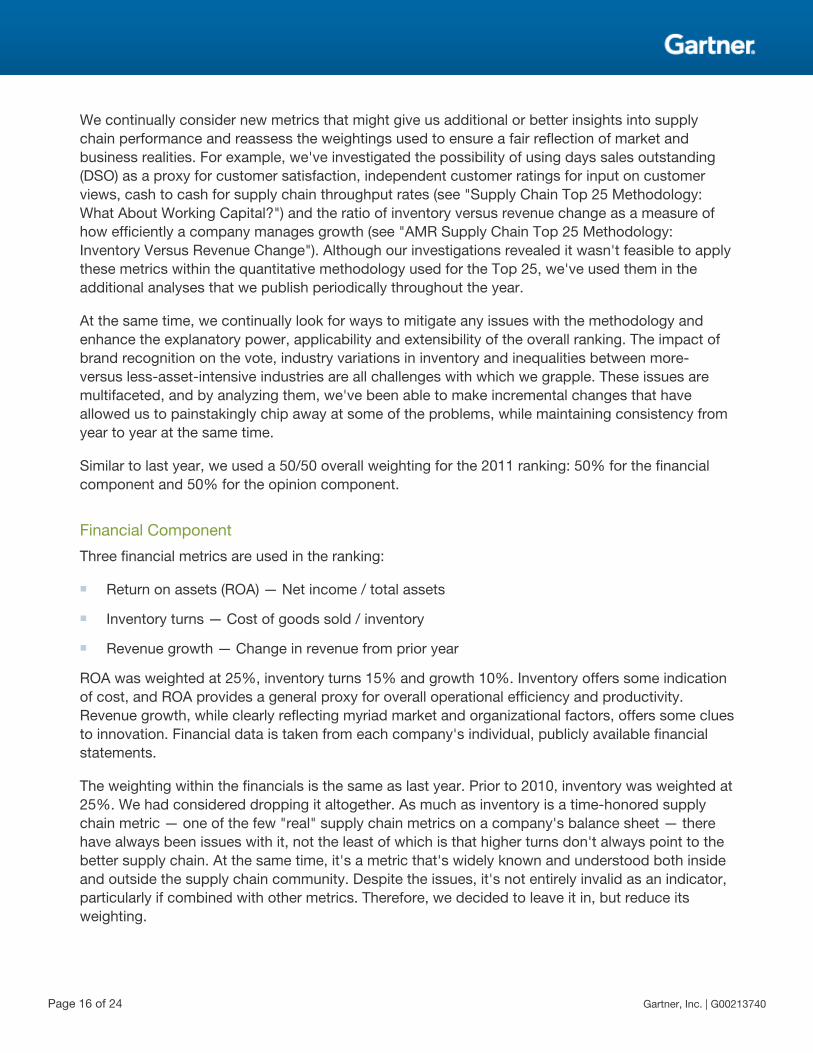
We derive a master list of companies from a combination of sources, including the Fortune Global500, the Fortune 1000 and the Forbes Global 2000. Our primary source is the Fortune Global 500,which we then pare down to the manufacturing and retail sectors, thus eliminating certainindustries, such as financial services and insurance (see Table 2 for a full list of excluded industries).We then supplement this group with companies from the Fortune 1000 that fall between $10 billionin revenue and the smallest revenue on the Global 500 list, as well as select companies from theForbes Global 2000. Although we'd like to include all companies, we must keep the list to a sizethat's manageable from a voting perspective.
Table 2. Industries Excluded From the Supply Chain Top 25
Airlines Healthcare (insurance, managed care, services) Shipping
Banks Insurance Telecommunications
Crude Oil Production Mail, Package and Freight Delivery Temporary Help
Diversified Financials Petroleum Refining Trading
Energy Pipelines Utilities
Engineering/Construction Railroads
Source: Gartner (June 2011)
Each year, we examine the methodology used to develop the ranking, with two sometimes-conflicting goals in mind: consistency and improvement. We want to improve the methods andprocedures we use, but, for the sake of consistency, in a way that builds on what we've done inprevious years.
We encourage and actively solicit input from the broader supply chain community on themethodology we use, issues with it, and suggestions for ways to improve it. Indeed, this goes to thevery heart of what we see as the purpose of the Top 25: It's intended to be a lightning rod andfoundation for vigorous debate about what constitutes leadership and supply chain excellence.
Gartner, Inc. | G00213740 Page 15 of 24
We continually consider new metrics that might give us additional or better insights into supplychain performance and reassess the weightings used to ensure a fair reflection of market andbusiness realities. For example, we've investigated the possibility of using days sales outstanding(DSO) as a proxy for customer satisfaction, independent customer ratings for input on customerviews, cash to cash for supply chain throughput rates (see "Supply Chain Top 25 Methodology:What About Working Capital?") and the ratio of inventory versus revenue change as a measure ofhow efficiently a company manages growth (see "AMR Supply Chain Top 25 Methodology:Inventory Versus Revenue Change"). Although our investigations revealed it wasn't feasible to applythese metrics within the quantitative methodology used for the Top 25, we've used them in theadditional analyses that we publish periodically throughout the year.
At the same time, we continually look for ways to mitigate any issues with the methodology andenhance the explanatory power, applicability and extensibility of the overall ranking. The impact ofbrand recognition on the vote, industry variations in inventory and inequalities between more-versus less-asset-intensive industries are all challenges with which we grapple. These issues aremultifaceted, and by analyzing them, we've been able to make incremental changes that haveallowed us to painstakingly chip away at some of the problems, while maintaining consistency fromyear to year at the same time.
Similar to last year, we used a 50/50 overall weighting for the 2011 ranking: 50% for the financialcomponent and 50% for the opinion component.
Financial Component
Three financial metrics are used in the ranking:
■ Return on assets (ROA) — Net income / total assets
■ Inventory turns — Cost of goods sold / inventory
■ Revenue growth — Change in revenue from prior year
ROA was weighted at 25%, inventory turns 15% and growth 10%. Inventory offers some indicationof cost, and ROA provides a general proxy for overall operational efficiency and productivity.Revenue growth, while clearly reflecting myriad market and organizational factors, offers some cluesto innovation. Financial data is taken from each company's individual, publicly available financialstatements.
The weighting within the financials is the same as last year. Prior to 2010, inventory was weighted at25%. We had considered dropping it altogether. As much as inventory is a time-honored supplychain metric — one of the few "real" supply chain metrics on a company's balance sheet — therehave always been issues with it, not the least of which is that higher turns don't always point to thebetter supply chain. At the same time, it's a metric that's widely known and understood both insideand outside the supply chain community. Despite the issues, it's not entirely invalid as an indicator,particularly if combined with other metrics. Therefore, we decided to leave it in, but reduce itsweighting.
Page 16 of 24 Gartner, Inc. | G00213740
Since 2009, we've used a three-year weighted average for the ROA and revenue growth metrics(rather than the one-year numbers we had previously used), and a one-year quarterly average forinventory (rather than the end-of-year number we had previously used). The yearly weightings are asfollows: 50% for 2010, 30% for 2009 and 20% for 2008.
The shift to three-year averages was put in place to accomplish two goals. The first was to smooththe spikes and valleys in annual metrics, which often aren't truly reflective of supply chain health,that result from events such as acquisitions or divestitures. It also accomplishes a second, equallyimportant goal: to better capture the lag between when a supply chain initiative is put in place (e.g.,a network redesign or a new demand planning and forecasting system) and when the impact can beexpected to show up in financial statement metrics, such as ROA and growth.
Inventory, on the other hand, is a metric that's much closer to supply chain activity, and we expectit to reflect initiatives within the same year. The reason we moved to a quarterly average was to geta better picture of actual inventory holdings throughout the year, rather than the snapshot, end-of-year view provided on the balance sheet in a company's annual report.
Opinion Component
The opinion component of the ranking is designed to provide a forward-looking view that reflectsthe progress companies are making as they move toward the idealized demand-driven blueprint.It's made up of two components, each of which is equally weighted: a Gartner analyst expert paneland a peer panel.
The goal of the peer panel is to draw on the extensive knowledge of the professionals that, ascustomers and/or suppliers, interact and have direct experience with the companies being ranked.Any supply chain professional working for a manufacturer or retailer is eligible to be on the panel,and only one panelist per company is accepted. Excluded from the panel are consultants,technology vendors and people who don't work in supply chain roles (e.g., public relations,marketing or finance).
We accepted 200 applicants for the peer panel this year, with 156 completing the voting process.Participants came from the most senior levels of the supply chain organization across a broad rangeof industries. There were 32 Gartner panelists across industry and functional specialties, each ofwhom drew on his or her primary field research and continuous work with companies.
Organizations must receive votes from both panels to be included in the ranking. Therefore, acompany that had a composite score fall within the Top 25 solely based on the financial metricswould not be included in the ranking.
The figures below provide a breakdown of the peer vote on the dimensions of industry, function,role, region and revenue. The regional breakdown of voters was a particular emphasis for us thisyear. In the past, North American voters have made up 80% of the total, despite many efforts to geta more even regional distribution. This year, thanks in large part to Gartner's broad geographicreach, we were able to increase the percentage of voters from Europe and Asia/Pacific, providing a
Gartner, Inc. | G00213740 Page 17 of 24
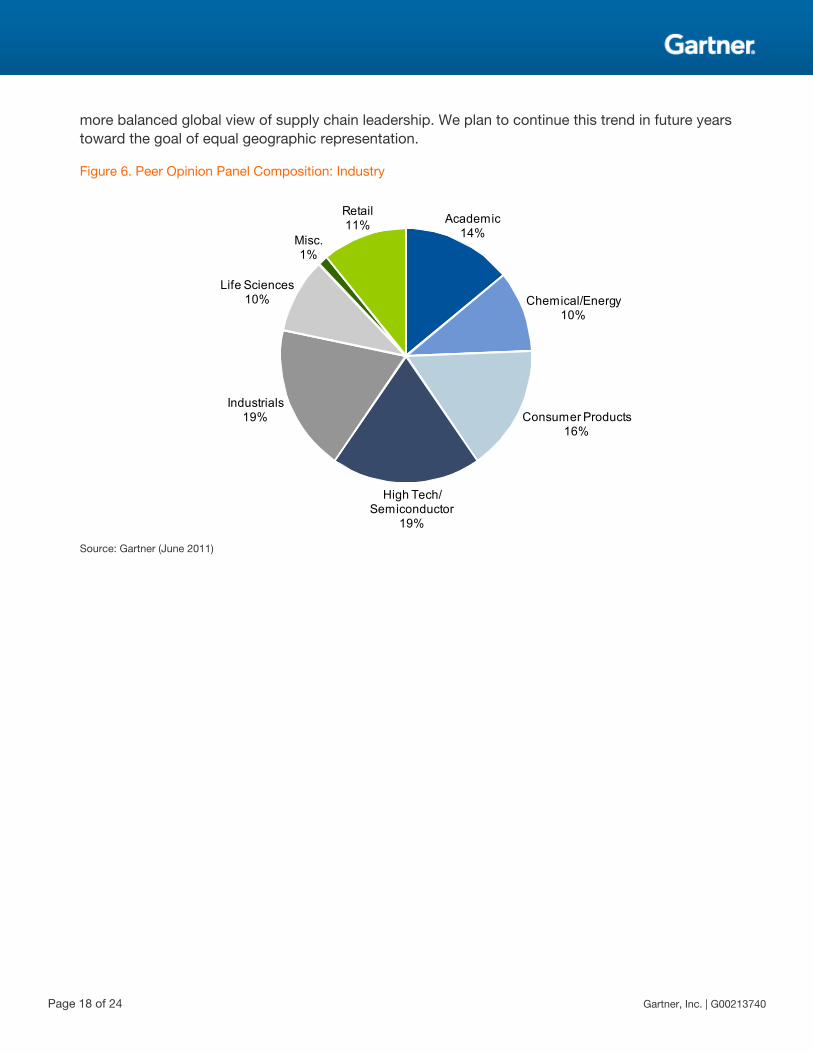
more balanced global view of supply chain leadership. We plan to continue this trend in future yearstoward the goal of equal geographic representation.
Figure 6. Peer Opinion Panel Composition: Industry
Academic14%
Chemical/Energy10%
Consumer Products16%
High Tech/Semiconductor
19%
Industrials19%
Life Sciences10%
Misc.1%
Retail11%
Source: Gartner (June 2011)
Page 18 of 24 Gartner, Inc. | G00213740
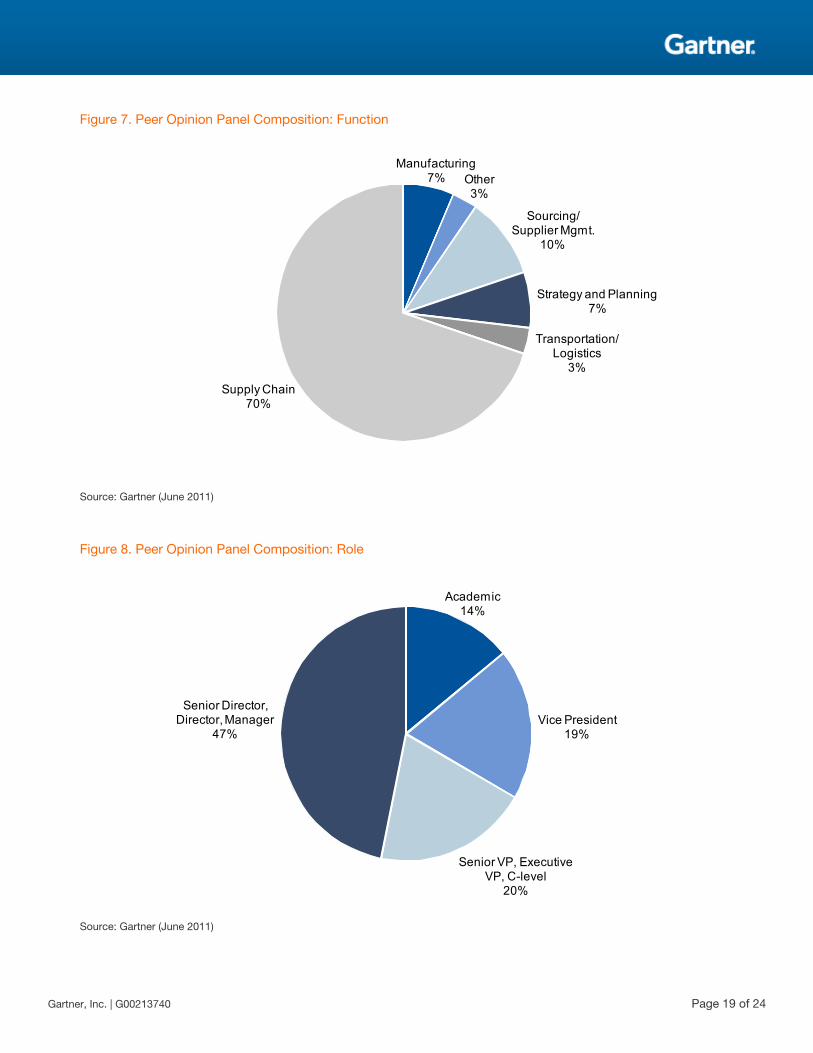
Figure 7. Peer Opinion Panel Composition: Function
Manufacturing7% Other
3%
Sourcing/Supplier Mgmt.
10%
Strategy and Planning7%
Transportation/Logistics
3%
Supply Chain70%
Source: Gartner (June 2011)
Figure 8. Peer Opinion Panel Composition: Role
Academic14%
Vice President19%
Senior VP, Executive VP, C-level
20%
Senior Director, Director, Manager
47%
Source: Gartner (June 2011)
Gartner, Inc. | G00213740 Page 19 of 24
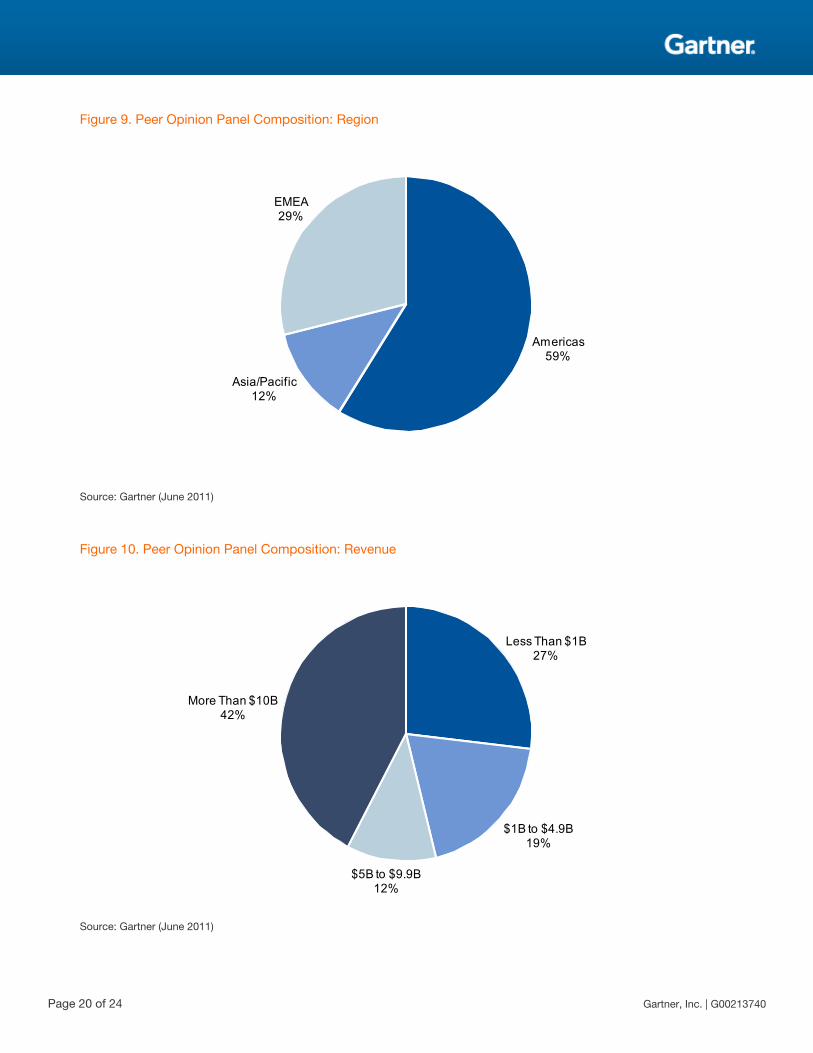
Figure 9. Peer Opinion Panel Composition: Region
Americas59%
Asia/Pacific12%
EMEA29%
Source: Gartner (June 2011)
Figure 10. Peer Opinion Panel Composition: Revenue
Less Than $1B27%
$1B to $4.9B19%
$5B to $9.9B12%
More Than $10B42%
Source: Gartner (June 2011)
Page 20 of 24 Gartner, Inc. | G00213740
Polling Procedure
Peer panel polling was conducted in April 2011 via a Web-based, structured voting processidentical to previous years. Panelists were taken through a four-page system to get to their finalselection of leaders that came closest to the demand-driven ideal, which is provided in theinstructions on the voting website for the convenience of the voters.
Here's a breakdown of the voting system:
■ The first page provides instructions and a description of the demand-driven ideal.
■ The second page asks for demographic information.
■ The third page provides panelists with a complete list of the companies to be considered. Weask them to choose 30 to 50 that, in their opinion, most closely fit the demand-driven ideal.
■ After the subset of leaders is chosen, the form refreshes, bringing just the chosen companies toa list. Panelists are then asked to force-rank the companies from No. 1 to No. 25, with No. 1being the company most closely fitting the ideal.
Individual votes are tallied across the entire panel, with 25 points earned for a No. 1 ranking, 24points for a No. 2 ranking and so on. The Gartner analyst panel and the peer panel use the exactsame polling procedure.
By definition, each person's expertise is deep in some areas and limited in others. Despite that,panelists aren't expected to conduct external research to place their votes. The polling system isdesigned to accommodate differences in knowledge, relying on what author James Surowiecki callsthe "wisdom of crowds" to provide the mechanism that taps into each person's core kernel ofknowledge and aggregates it into a larger whole.
Composite Score
All this information — the three financials and two opinion votes — is normalized onto a 10-pointscale and then aggregated, using the aforementioned weighting, into a total composite score. Thecomposite scores are then sorted in descending order to arrive at the final Top 25 ranking.
Looking Ahead
In 2010, we published the second annual Healthcare Supply Chain Top 25 and plan to continue thisin 2011. The global Top 25 itself offers many opportunities for various cuts and views — forexample, industry, geography and deeper into the full list — and we will continue those as well.We've also considered additional possibilities, including industry-specific rankings, a midmarketranking to bring in companies that don't meet the size requirements for the larger Top 25 and asustainability ranking.
In 2012, we plan to introduce the first annual regional Supply Chain Top 25 rankings for Asia and forEurope. Our overarching goal is to better reflect the unique aspects of the markets and economiesof each region that drive differences in demand, customer behavior and the necessary supply chain
Gartner, Inc. | G00213740 Page 21 of 24
response. Doing so will also allow us to open up the ranking to companies that today may not beincluded in the population being ranked, either due to the revenue cutoff requirement, or simplybecause of the basic limitations of size inherent in any one ranking. Of course, our data collectionand planning cycles start well in advance of any publication date, so we'll be looking for input andqualified voters as early as September 2011.
We will also continue to investigate possible changes to the methodology for the primary Top 25ranking for next year, seeking feedback and input on any possible changes from the broader supplychain community. Here are some examples of the suggestions that have been made: Is there a wayto take into account the differences in complexity and risk? Can we introduce a metric that willreward stability over time — something we know investors like? Are there better ways toaccommodate the radically different operating models that drive wide variation in inventory turns?Can voters provide more information as to why they voted for certain companies? Would it makesense to institute something like a hall of fame that would include the companies that have beenperennial leaders and fundamentally changed the way we all think about supply chain? We will alsocontinue to investigate the challenge of how to better measure success among the most asset-intensive businesses (e.g., mining), whose cyclical patterns of investing to earn future payback mayspan decades.
Our intent is to continue to invest in the methodology and community of the Supply Chain Top 25 totackle these measurement challenges in time. Along the way, no doubt, we will continue to identifyleaders and innovators that should inspire and challenge the supply chain community as a whole toconstantly improve.
As Gartner's supply chain research group, our role is to provide a platform for the informed andprovocative debate that we believe is essential to raising the bar on supply chain leadership. TheSupply Chain Top 25 has provided the spark for that debate. We remain committed to pushing theboundaries of supply chain excellence in all our research and look forward to continuing thedialogue.
Recommended ReadingSome documents may not be available as part of your current Gartner subscription.
"2010 AMR Supply Chain Top 25: A&D"
"2010 AMR Supply Chain Top 25: Automotive"
"2010 AMR Supply Chain Top 25: Industrial"
"2010 AMR Supply Chain Top 25: Retail"
"2010 AMR Supply Chain Top 25: Consumer Products"
"2010 AMR Supply Chain Top 25: Chemical"
"2010 AMR Supply Chain Top 25: High Tech"
Page 22 of 24 Gartner, Inc. | G00213740
"2010 AMR Supply Chain Top 25: Life Sciences"
"The 2010 Supply Chain Top 25: Asia/Pacific"
"The 2010 Supply Chain Top 25 Ranking: The Next 25"
"Supply Chain Top 25 Methodology: What About Working Capital?"
"AMR Supply Chain Top 25 Methodology: Inventory Versus Revenue Change"
"The Healthcare Supply Chain Top 25 for 2010"
"The 2010 Healthcare Supply Chain Top 25: Analysis of Organizations 26 to 50"
"Supply Chain Strategy for Manufacturing Leaders: The Handbook for Becoming Demand Driven"
"Stages of Value Chain Transformation, Revisited"
"Toolkit: Assess the 12 Facets of DDVN Excellence"
"The Hierarchy of Supply Chain Metrics: Diagnosing Your Supply Chain Health"
The Supply Chain Top 25 website: www.gartner.com/supplychaintop25
This research is part of a set of related research pieces. See Building a Resilient Supply Chain for anoverview.
Gartner, Inc. | G00213740 Page 23 of 24
Regional Headquarters
Corporate Headquarters56 Top Gallant RoadStamford, CT 06902-7700USA+1 203 964 0096
Japan HeadquartersGartner Japan Ltd.Aobadai Hills, 6F7-7, Aobadai, 4-chomeMeguro-ku, Tokyo 153-0042JAPAN+81 3 3481 3670
European HeadquartersTamesisThe GlantyEghamSurrey, TW20 9AWUNITED KINGDOM+44 1784 431611
Latin America HeadquartersGartner do BrazilAv. das Nações Unidas, 125519° andar—World Trade Center04578-903—São Paulo SPBRAZIL+55 11 3443 1509
Asia/Pacific HeadquartersGartner Australasia Pty. Ltd.Level 9, 141 Walker StreetNorth SydneyNew South Wales 2060AUSTRALIA+61 2 9459 4600
© 2011 Gartner, Inc. and/or its affiliates. All rights reserved. Gartner is a registered trademark of Gartner, Inc. or its affiliates. Thispublication may not be reproduced or distributed in any form without Gartner’s prior written permission. The information contained in thispublication has been obtained from sources believed to be reliable. Gartner disclaims all warranties as to the accuracy, completeness oradequacy of such information and shall have no liability for errors, omissions or inadequacies in such information. This publicationconsists of the opinions of Gartner’s research organization and should not be construed as statements of fact. The opinions expressedherein are subject to change without notice. Although Gartner research may include a discussion of related legal issues, Gartner does notprovide legal advice or services and its research should not be construed or used as such. Gartner is a public company, and itsshareholders may include firms and funds that have financial interests in entities covered in Gartner research. Gartner’s Board ofDirectors may include senior managers of these firms or funds. Gartner research is produced independently by its research organizationwithout input or influence from these firms, funds or their managers. For further information on the independence and integrity of Gartnerresearch, see “Guiding Principles on Independence and Objectivity” on its website, http://www.gartner.com/technology/about/ombudsman/omb_guide2.jsp.
Page 24 of 24 Gartner, Inc. | G00213740