Embed Size (px)
Citation preview

THE GAP INCORPORATED
Leann Bustamante
Jeffrey Bertinetti
Mary Cassidy

GAP

Gap Incorporated Leading international specialty retailer Founded 1969 More than 3,800 stores worldwide May 19, 1976 initial public offering $18 per
share Began trading on the NYSE 1976 Ticker symbol GPS Also listed on the Pacific Exchange

Provides customers with: Clothing Accessories Underwear Loungewear Personal care items
For women, men, children, and infants
Under the Gap (GapKids, babyGap, GapBody)
Banana Republic Old Navy

Why they lost market share: Increasing competition in the retail
industryNot keeping up to date with current
trends and fashionDecreasing economy due to September
11th events

Interview 20 Gap Customers 10 females, 10 males How long have you been shopping at Gap? Are you satisfied with the quality of Gap’s
clothing? Do you feel it’s consistent with the modern
trends? Do you feel it is adequately priced? Have you noticed any decrease in overall
satisfaction in the recent years?

Results:Customers of over 5 years Decrease in overall satisfactionPrices increasedNo quality increaseHave stayed with modern trendsBut competitors doing a better job

THE GAP INCORPORATED
AHP ANALYSIS

AHP Analysis Strategy A:
Marketing Brands Strategy B:
Design and Merchandise Products
Strategy C:Shopping Environment

AHP Analysis Three criterion:
1. Cost Control2. Quality3. Service

AHP Analysis
Model Name: Gap
Priorities with respect to: Goal: Selecting an Alternative Ma...
Controlling Cost .413
Service .260
Quality .327 Inconsistency = 0.21 with 0 missing judgments.
Page 1 of 111/25/01 11:16:30 PM
lbusta01

AHP Analysis
Performance Sensitivity for nodes below: Goal: Selecting an AlternativeMarketing Direction
.00
.10
.20
.30
.40
.50
.60
.70
.80
.90
.00
.10
.20
.30
.40
.50
.60
.70Crit% Alt%
Strategy C
Strategy B
Strategy A
Controlling Service Quality OVERALL
Objectives Names
Controlling Controlling Cost
Service Service
Quality Quality
Alternatives Names
Strategy A Strategy A
Strategy B Strategy B
Strategy C Strategy C
Page 1 of 111/25/01 11:22:35 PM
lbusta01

THE GAP INCORPORATED
Future Sales Predictions

Quarterly Sales(Observe Seasonality)
Gap Inc. Quartely Sales
0
500
1000
1500
2000
2500
3000
3500
4000
4500
5000
Quarter
Sa
les(
in m
illi
on
s)
Series1

Gap Inc. Annual Sales(1991-2000)
Gap Inc. Annual Sales
0
2000
4000
6000
8000
10000
12000
14000
16000
1 2 3 4 5 6 7 8 9 10
Year(beginning in 1991)
Sa
les
(in
mil
lio
ns
)
Series1
Series2
Gap Inc. Annual Sales
0
2000
4000
6000
8000
10000
12000
14000
16000
1 2 3 4 5 6 7 8 9 10
Year(beginning in 1991)
Sal
es
(in
mill
ion
s)
Series1
Series2

Linear RegressionA linear model can be used because the
data shows a clear trendHigh R Squared variable shows strong
relationship between annual sales and year
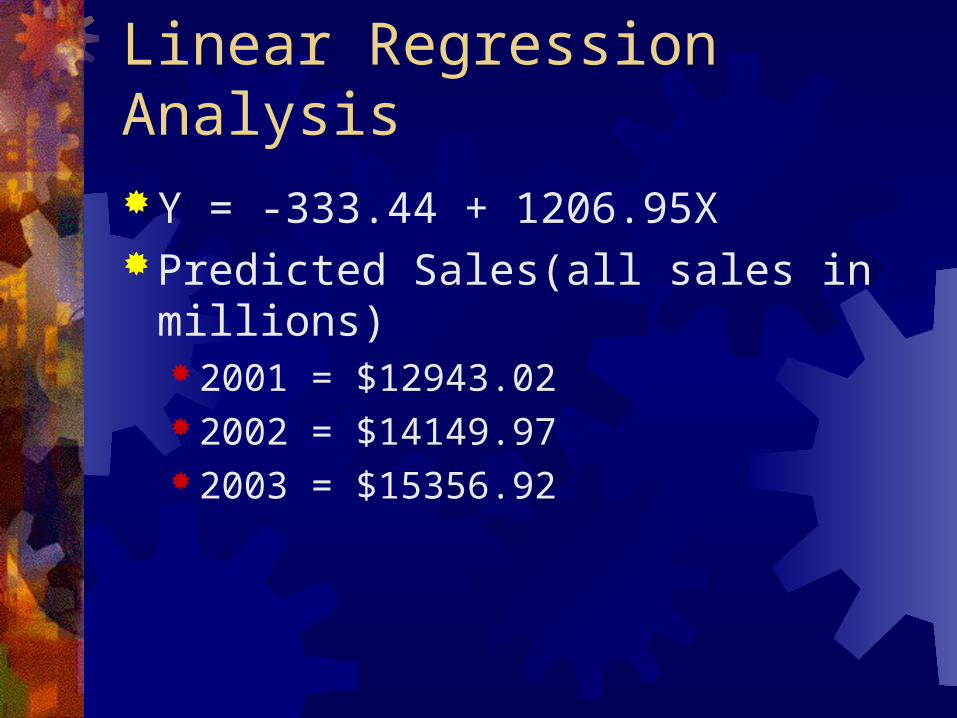
Linear Regression AnalysisY = -333.44 + 1206.95XPredicted Sales(all sales in millions)
2001 = $12943.02 2002 = $14149.97 2003 = $15356.92

MATERIALS MATERIALS REQUIREMENTS PLANNINGREQUIREMENTS PLANNING

New MRPNew MRPSAFETY STOCK
20% of sales should be kept on reserve for unexpected situations
LEAD TIME Should be shortened to get them to
customers when needed IMPROVES CUSTOMER
SATISFACTION!!

NEW MRPNEW MRP
Lot-Sizing-Rule
Minimum Order Size
Lowest amount of inventory possible means NO EXTRA COST!

TOTAL QUALITY TOTAL QUALITY MANAGEMENTMANAGEMENT

CODE OF VENDOR CONDUCT
Clearly laid out set of rules which must be followed
Enforcers of the Code: Vendor Compliance Officers (VCO’s) Inspect sewing machines for safety guards Review Payroll Records Interview Employees

PROBLEMS WITH GAP INC.’S TQM
Workers see the VCO’s as “watchdogs”Workers may hide mistakesWorkers may pass blame onto their
peers
LEADS TO TOO MANY CONFLICTS!!

THE NEW TQMTHE NEW TQM Incorporate Deming’s 14 point program
Break down barriers between departments Eliminate numerical goals/quotas Remove barriers that hinder the hourly
worker
This Leads to More FREEDOM!!

THE NEW TQMTHE NEW TQM Quality Circles
Groups of workers meet regularly/share information about the company
House of Quality Finds out the attributes that a customer
likes Benchmarking
Compares Gap Inc.’s products with the competitors (J. Crew, Abercrombie)